Abstract
Natural hazards are increasingly threatening our communities; hence it is imperative to provide communities with reliable information on possible impacts of such disasters, and on resilience measures that can be adopted to recover from disasters. To increase the engagement of various stakeholders in decision-making processes related to resilience to natural hazards, problem-specific information needs to be presented to them in a language understandable to non-experts in the field. To this end, this paper illustrates experimentation with low-code platforms for fast digitalization of resilience reports, incorporating the perspectives of various stakeholders in the analysis, thus making informed decision-making practicable. We present a co-creation-based approach to develop GIS-based user-friendly dashboards in support to the identification of resilience strategies against natural hazards; this approach has been developed within the framework of the European project ARCH. Urban areas are regarded as complex social-ecological systems whose various dimensions should be considered in this resilience endeavor, during all phases of the Disaster Risk Reduction and Climate Change Adaptation cycle. The work presented in this paper specifically targets the possible impacts and risks that might affect the cultural heritage subsystems of our cities, generally underrepresented in the international literature related to urban resilience assessment. We describe how we applied our approach to the Camerino municipality, a historic Italian town exposed to seismic risk, which was struck by a severe earthquake sequence in 2016–2017 and discuss the results of our experience.
1. Introduction
Natural hazards are increasingly threatening our communities; hence, measures to strengthen our communities’ resilience need to be assigned the highest priority for policy- makers. The first step is to provide communities with reliable information on the possible impacts, and on the resilience measures that can be adopted to prevent natural hazards from turning into disasters.
Among the various aspects of a city, historic areas, although extremely vulnerable to natural hazards, are often neglected in urban resilience assessment plans, as assessment of the vulnerabilities of these areas’ peculiar assets require tailored methods and expertise. The resilience concept itself needs to be specifically shaped for protection of cultural heritages by encompassing in preparations the social and ecological characteristics of these historic areas, with the objective of maintaining the historic district’s identity, integrity, and authenticity [1].
The European-funded research project ARCH (Advancing Resilience of historic areas against Climate-related and other Hazards) [2], has been among the most relevant initiatives devoted to the development of methods and tools focused on the resilience enhancement of historic and cultural heritage areas. Among the tools defined and made available by the ARCH project via the ARCH HUB (ARCH HUB is accessible at https://websites.fraunhofer.de/arch/, accessed on 5 December 2022), the ARCH DSS (Decision Support System) aims at providing risk knowledge representations in the form of hazard scenarios and their impacts, exploiting the different vulnerabilities of historic areas. These were elicited for four pilot cities, namely: Hamburg (Germany), Bratislava (Slovakia), Valencia (Spain), and Camerino (Italy). Furthermore, within the ARCH DSS, the effects of selected resilience measures in relation to reduction of impacts for various hazard scenarios have been evaluated and compared. The final objective of the ARCH DSS has been to support informed decision-making processes for resilience building leveraging quantitative riskanalysis methods. The application of these methods required the setup of extensive information systems, such as the Historic Area Information Management System (HArIS) and the Threats and Hazard Information Management System (THIS) (ARCH HArIS and THIS are accessible from ARCH Geoportal—https://www.cs.ingv.it/ARCHPortal/, accessed on 5 December 2022), to collect, organize, aggregate and make available assets and threats data.
In this paper, we illustrate the development method of the ARCH DSS, a tool-set consisting of knowledge reports about selected impact scenarios and effectiveness of resilience measures for various cities. These reports have been built on the processing of data and information made available by HArIS and THIS. The application of the method is described for the Camerino municipality, a historic Italian town exposed to seismic risks that was struck by a severe earthquake sequence in 2016–2017. Aiming to increase the engagement of various stakeholders in the decision-making processes related to resilience to natural hazards, it is necessary to present them with synthetic and problem-specific information using superior language. For this aim, within ARCH we promoted the usage of low-code platforms for the fast digitalization of resilience reports, incorporating the perspectives of various stakeholders in the analysis, thus making informed decision-making processes practicable.
GIS-based tools are commonly used as base applications to support decision making processes for disaster mitigation and management (see, for example, [3,4,5,6]). Several GIS environments require specialized skills in both IT development and data analysis; these skills are used to implement information systems for performing in-depth studies. Moreover, these GIS environments enable the realization of interactive web pages and customized dashboards in the form of a WebGIS for public access from the Internet to make study results available to various users. However, such tools are not immediately adequate for the collaborative development of decision support services with end users.
On the other hand, the growing availability of easy-to-use cloud-based environments [7,8,9] has led to the concept of self-service business intelligence providing end users, for example, with the ability to customize the dashboards by themselves with ready-to-use code. As this technology can be fed by various data sources, including GIS datasets, it can also be explored to build custom geospatial data visualization user interfaces, effective for specific government policies, such as resilience planning and disaster response.
This paper contains the following key contributions. First, a replicable agile methodology to develop fit-to-use GIS-based DSS tools to support the identification of urban resilience strategies against natural hazards is detailed. The main feature of the methodology is a co-creation method to implement iterations of the DSS development process where representatives of local communities collaborate with expert analysts to turn resilience knowledge into DSS tools and to drive development toward usage-based tool validation. To this purpose, the adoption of a low code technological environment to visualize the analysis results allows adaptation directly from the end users.
The second contribution is the implementation of a conceptual model for the representation of impact scenarios and of resilience strategies and results, which can be adapted to the context of various cities and to different decision objectives.
In particular, the ARCH DSS dashboards have been conceived to be, to the greatest extent possible, in line with the principles, terminology, and metrics addressed by the Agenda 2030 for Sustainable Development [10] that recommends strengthening efforts to protect and safeguard the world’s cultural and natural heritage. Furthermore, the Sendai Framework for Disaster Risk Reduction 2015–2030 [11], which states the imperative need to incorporate cultural heritage into disaster resilience, has been considered a reference.
The third contribution is the application of the methodology and experimentation of the DSS on a real case study, i.e., the Camerino municipality. The result of our experience is discussed, including the positive feedback received from the relevant stakeholders and their indications for practical uses of the ARCH DSS as part of municipality practices and for future improvement of the ARCH DSS tool.
2. Related Works
The present work refers to a methodological and technological approach for GIS-based support to democratize knowledge for decision making targeting resilience of historic areas to natural hazards.
2.1. GIS-Based Tools to Support Resilience to Natural Hazards
Various GIS-based platforms for informing and supporting decision-making processes for building resilience to climate changes and other hazards can be identified in the international literature, e.g., Global Earthquake Model, GEM [12]; HAZUS-MH platform used by the US Federal Emergency Management Agency, FEMA [13]; CAPRA Probabilistic Risk Assessment Platform [14], and others [15,16,17,18,19,20,21]. However, generally speaking, commercially available GIS-based platforms lack the spatial analysis. They also lack the capability required in the design phase of the decision-making process that concerns assessing and analysing impact scenarios and a set of alternative decisions for responding to them. The intelligence behind these platforms has long been non-transparent and/or not immediately available and clear for the stakeholders, as it has been reported in technical reports or scientific papers accessible and understandable by subject-matter-experts only.
As for the types of analysis, the platforms above are generic and do not specifically target historic areas and characterization of risk for these areas.
2.2. Risk Analysis for Protection of Historic Areas
As described in [22], the actual complexity of the risk concept for a historic city, in terms of variables and indicators, leaves open various research challenges in vulnerability assessment methods, from data availability and collection to coverage, accuracy and usefulness of the results. To face such a complexity, artificial intelligence methods, such as machine learning, are investigated for automatic risk classification trained on historical data. In a complementary direction, the work [23] proposes an automatic approach to risks of POIs of a city, where both the complexity of the activity and the problem of data unavailability are faced by combining a formal representation of the problem domain, following the Vulnerability Upper Model [24] development method, with computational creativity techniques to obtain risk descriptions and preliminary ranking. From the perspective of specific aims and tool results, both of the above works are aimed toward methods of enriching GIS-platforms directed at risk analysts, and, as such, they require modelling and development effort. From a research perspective, the techniques above could be adopted to support co-creation activities that, as for the ARCH project, lead to the realization of the DSS tools. Indeed, a step forward from previous works [5] has been the fundamental interpretation of historic areas as complex social-ecological systems, which can only be achieved by direct involvement of relevant stakeholders in the development process of the tools. In this respect, none of the existing GIS-based systems allows for agile programming and development, thus enabling accommodation of the timeline and the modality of the co-creation process that was at the core of the ARCH project.
2.3. Knowledge Democratization Methods
The concept of democracy in terms of knowledge on resilience has recently emerged in the research community thanks to the availability of open data and cloud-based tools that may host geo-data analytics and visualization services for knowledge sharing. The usefulness of public dashboards during a disaster to enable local communities to gain knowledge and explain event evolution for the purpose of emergency management is discussed, for example, in [25]. The usage of WebGIS technology to publish interfaces for a more effective understanding of in-depth environmental studies to support territorial planning is promoted in [3]. WebGIS technology allows internet access of GIS layers built in desktop projects; therefore, it requires some development work at the code level. In this paper, the use of a low code environment is promoted on top of GIS-tools to allow for easy adaptation of the dashboards to user needs.
The potential and effectiveness of self-service business intelligence (BI) methods is being intensely considered in research [26,27,28]. The benefit of these tools for knowledge democratization is being demonstrated in the area of resilience engineering in safety-critical systems [29]. In such areas, the concept of safety intelligence has been introduced referring to the aim to transform raw data and information from incident archives into meaningful information for safety management [30]. Unlike these works, this paper describes a co-creation-driven methodology for urban resilience knowledge building by using both raw data and user-provided information, and delivery of such knowledge by means of BI tools.
3. Co-Creation for the Design of a GIS-Based Decision Support System
The work presented in this paper is framed by the European project ARCH. The main results of the ARCH project are briefly presented in Section 3.1, to contextualize the development method and the architecture of the GIS-based ARCH Decision Support System (ARCH DSS) presented in Section 3.2.
3.1. Overview of the ARCH Project: Methods and Results
3.1.1. The Resilience Concept of a Social-Ecological System
Resilience is a complex concept that is not uniquely defined as an abstract term, but it assumes different and precise meanings in specific application domains, such as ergonomic and urban contexts, industry/infrastructure, and information technology systems. With respect to the historic areas, this concept is new, and the ARCH project has provided the following definition for it [1]:
“The sustained ability of a historic area as a social-ecological system (including its social, cultural, political, economic, natural, and environmental dimensions) to cope with hazardous events by responding and adapting in socially just ways that maintain the historic area’s functions and heritage significance (including identity, integrity, and authenticity).”
Therefore, not only the physical assets of cultural heritage and artworks are elements exposed and at risk but also their significance for the local community that contribute to maintaining the sense of belonging and evolving the place identity. Such intangible value is hard to be found in urban data repositories but needs to be acquired directly by community groups by using participative methods [31] tailored to the topics of heritage management, climate change adaptation/mitigation, disaster risk management, and sustainable urban development. On the other hand, GIS-based tools targeting the resilience building of historic areas, not only do they need to combine tangible and intangible indicators in the analysis methods, but they should be accessible and co-developed with non-expert users in order to make the tools useful and usable.
3.1.2. The ARCH DRM/CCA Framework: Focus on Decision Support
The central result of the ARCH project is the definition of the Disaster Risk Reduction and Climate Change Adaptation cycle (DRR/CCA), a methodological framework for resilience building in cities, with special focus on historic areas, which has been the reference for the development of all the ARCH tools. The framework, detailed in [2], provides information and recommendations on a process model to be followed by historic areas aiming to become more resilient to natural hazards. The ARCH DRR/CCA follows an evolutionary process model as the urban system itself evolves and adapts with time to both internal variations and changing environmental conditions. As illustrated in Figure 1, the framework consists of ten steps within the three temporal phases of a disaster, such as pre-, during, and post-disaster. In the pre-disaster phase, preparation activities are performed, following requirements and recommendations to assess vulnerabilities and risks; then resilience measures are identified, assessed, selected and implemented; finally, monitoring processes of the indicators used for the risk assessment are established. During the disaster phase, emergency response procedures are conducted, and, in the post-disaster phase, the needs are assessed, the situation is stabilized, and the recovery process starts.
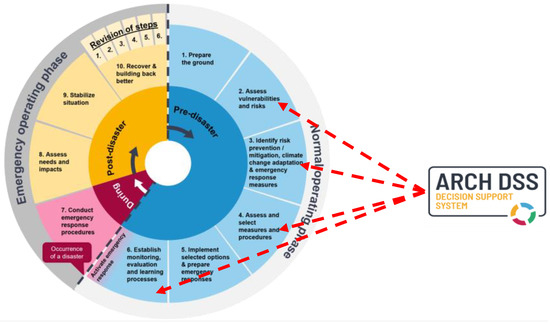
Figure 1.
Illustration of the ARCH DRR/CCA framework [2] with the activities addressed by the ARCH DSS tool.
Various ARCH tools have been provided to perform these activities, in particular, the ARCH DSS addresses the activities indicated in steps 2, 3, 4 and 6 of the pre-disaster phases.
3.1.3. The ARCH Tools and Links with the ARCH DSS
The ARCH HUB [2] assembles the following innovative online tools developed as part of the project, which are briefly described below.
ARCH RAD: Resilience Assessment Dashboard for a multi-stakeholder self-assessment, by means of a questionnaire, of the current level of resilience of a historic area.
ARCH Risk Scenario Toolbox: to support co-creation activities and workshops for identifying vulnerabilities, hazards and cause-effect relationships represented by means of graphical impact chain models. These models are the basis for the ARCH DSS design.
ARCH Geoportal: a system consisting of two GIS-based tools, named HArIS and THIS. The first allows exploration of data on historic areas, and the second relates to data on hazards acquired both in real time by monitoring systems and from historic events and projections. These databases are the data sources for the ARCH-DSS dashboards.
ARCH RMI: Resilience Measures Inventory of over 250 measures to address climate-related and other natural events such as earthquakes. Different resilience measures can be compared and selected to develop resilience scenarios as part of the ARCH DSS design.
ARCH DSS: consisting of a set of dashboards developed according to the specific needs of each single historic area, as described Section 3.2.
ARCH RPVT: Resilience Pathway Visualization Tool allowing visual construction of implementation pathways for selected resilience measures, i.e., which resilience measures must be implemented in which sequence to raise the resilience to a certain level until a certain time.
3.2. The ARCH DSS
This section describes the development process of the ARCH DSS, from the aim and user requirements to the selection and elaboration of risk/impact indicators, and their representation by means of objective-based dashboards.
3.2.1. Democratizing the Resilience Knowledge
The aim of the ARCH DSS is to contribute to the sharing of knowledge about resilience of historic areas. An innovative aspect of the ARCH project has been the enactment of a co-creation-based methodology where different types of stakeholders for each city have actively contributed to the identification of decision objectives of interest for the city and of the risk indicators to be considered in the design of the DSS. On the other hand, the aim of the ARCH DSS for a city has been to target a wide audience when delivering the resilience assessment results, to strengthen the decision processes and increase the resilience capacity of the addressed community.
As every city has its own social-ecological characteristics, as well as specific vulnerabilities to different hazards, conceiving a unique system capable of addressing all types of resilience strategies for different cities would be quite challenging or ineffective if the tools were made too general. As a result, the ARCH DSS has been conceived as a set of independent tools in the form of interactive user-friendly dashboards, each devoted to a pilot city and to support specific decision-making objectives of the city.
These tools are aimed toward democratization of the resilience knowledge in the city and its building process. Therefore, the technical solution for the ARCH DSS has been an environment for agile development and operation of dashboards. The main technical features are described in Table 1.

Table 1.
Features of the ARCH DSS environment.
Figure 2 depicts the agile development process of ARCH DSS highlighting two aspects. The first is the central role of the co-creation activities with cross-functional stakeholders to enable effective collaboration in all (iterative) phases of the development: from the definition of the DSS objectives and of the data types, and the validation of the tools. This cycle has been realized for each pilot city. The second is the choice of a low code development environment to enable rapid prototyping of the tools as well as their adaptation to changes by the end users. Another advantage is to support self-service tool enhancement and maintenance for future deployment and operation in the end user environments.
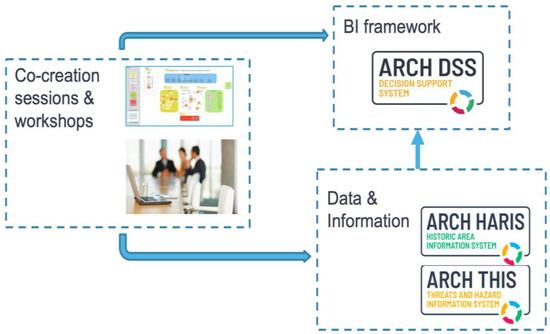
Figure 2.
ARCH DSS agile development model, encompassing co-creation activities, ARCH HArIS and THIS and the ARCH DSS hosted in a low-code environment for business intelligence.
The individual steps of the development method are detailed in the following subsections.
3.2.2. The Co-Creation Method
The ARCH co-creation activities have been targeting the following main goals.
- -
- Achieve a shared agreement on the definitions and approaches to be taken for performing risk and impact assessments;
- -
- Co-identify vulnerabilities, risk, and impact scenarios meaningful for the city’s specific decision-making processes that are relevant to the Disaster Risk Reduction/Climate Change Adaptation DRR/CCA cycle (Figure 1);
- -
- Co-create the scope and format of decision support tools and analysis of ARCH Decision Support System (DSS) dashboards for the visualization of the selected impact scenarios.
The co-creation process and supporting tools has been defined for:
- -
- Non-technical, non-expert stakeholders that must deal with the challenge to conduct co-creation activities related to risk and impact assessment within an historic area or within a wider urban area.
- -
- Expert in the field of risk and impact scenario assessment aiming to include co-creation in the process of conceiving and building a DSS of various kinds; the process of co-creation is deemed fundamental to avoid creating “black boxes” (non-transparent, non-replicable, not editable, etc.) and/or assessments and related tools not useful to inform any decision process and/or non-understandable by the stakeholders.
As a matter of fact, the lack or paucity of co-creation practices in the field of risk and impact scenario assessment has certainly contributed to the fact that tools created so far have not been taken up or have been adopted to a very limited extent by stakeholders and/or public administration. Figure 3 provides a schematic representation of the co-created impact and risk assessment process that was originally defined as part of the ARCH project.
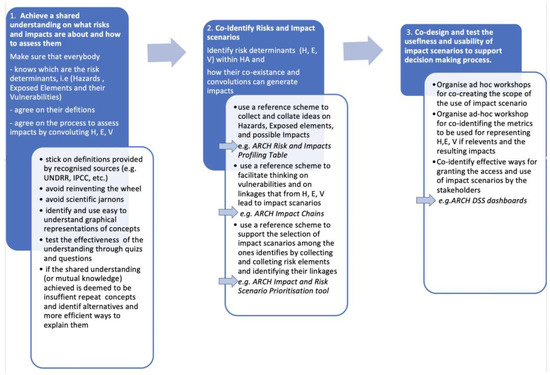
Figure 3.
Schematic representation of the co-created impact and risk assessment process that has been originally defined as part of the ARCH project.
As far as the first step of the co-creation process is concerned (Figure 3), i.e., “Achieve a shared understanding on risks and impacts and how to assess them”, reference is made to consolidated definitions and best-practices, which are presented avoiding scientific jargon and preferably using the country’s language [32]. As for the second step, i.e., “Co-identify risk and impact scenarios”, an ad-hoc supporting toolbox has been originally conceived and developed as part of the ARCH project [2], referred to as ARCH Risk Scenario Toolbox (Figure 2), made available through the ARCH HUB.
The ARCH Risk Scenario Toolbox is a set of tools and methods to support the co-identification, co-prioritization, and co-definition of risks, impacts, and the cause-effect relationships between them. The resulting toolbox consists of: (i) a risk profiling table; (ii) a scenario prioritization tool and; (iii) a Miro-Virual whiteboard (available at https://miro.com, accessed on 5 December 2022) template for the creation of Impact Chains [33]. These are (informal) conceptual models representing cause-effect chains linking factors and processes to describe climate risks in a specific context. The three elements of the toolbox build on each other. The risk profiling table should be filled in as a first step, then scenarios are prioritized using the prioritization tool, and finally, for the highest rated risk scenarios, Impact Chains are created. Finally, for the last step, devoted to validation by the stakeholders, the usability and usefulness of the co-created impact scenarios and of the ARCH DSS for their representation and use, ad hoc questionnaires have been created and distributed as reported in Appendix A.
Figure 3 summarizes each one of the aforementioned steps (that are reported in the blue boxes), a white box summarizes which elements have been introduced in the process, going beyond the regular (i.e., non-co-created) risk assessment process and including what “new” methodologies and tools (highlighted with the small arrows) have been introduced and implemented in the co-creative process.
3.2.3. Lift from Data and Information to Resilience Knowledge
The ARCH DSS outputs risks/impacts knowledge representations, achieved by organizing, conceptualizing and synthetizing contextual data and information, to enhance comprehension and awareness for informed decision-making on pre-specified objectives. Essentially, the ARCH DSS tool displays the risk/impact information as a combination of the relevant KPIs for its Hazard, Vulnerability and Exposure components, as a result of an analysis process. These KPIs were selected from those identified through the co-creation workshops and implemented by using the data of the city and the hazard scenarios provided by the ARCH Information System. With this meaning, the ARCH Information System and the ARCH DSS allow climbing of the Data Information Knowledge Wisdom (DIKW) pyramid [34] going from Data to Information and to Information to Knowledge, respectively. Data and information are collected, structured, and stored in the ARCH server repository and database to make them available in the information systems HArIS and THIS: depending on whether they concern elements for the characterization of HA aspects and their assets or of threats and hazards, respectively.
3.2.4. ARCH DSS Implementation
At high level of abstraction, the outputs of the ARCH DSS dashboards have been identified and classified in line with the types of data analytics works, as follows.
- -
- Context description: Summary of data and evidence on hazards, exposed elements and their vulnerability as well as of the impact factors of interest.
- -
- Predictive results: Estimation of risk maps and impact scenarios by combining hazard, exposure, and vulnerabilities.
- -
- Decision support: Resilience measures evaluated through estimation of modified impact scenarios.
From a software engineering perspective, the implementation of the ARCH DSS consists of three main steps: (1) definition of a data model devoted to the storage of the source data for the outputs above; (2) elaboration of the risk indicators and generation of the risk/impacts scenarios; (3) design of the user interfaces for the presentation of the results.
The data model, common to all the ARCH DSS dashboards, extends the risk conceptual model with entities related to time, geographical location, city contextual data and scenarios. To guide for the implementation of the data model in the PowerBI technology [7], these entities have been grouped in categories such as:
- -
- who (hazard),
- -
- what (object exposed to risk such as cultural heritage, population, buildings)
- -
- where (geographical location),
- -
- when (time/interval),
- -
- how (vulnerability indicators and impact types, risk matrix, resilience measures).
Figure 4 represents the followed data model for the dataset implementation.
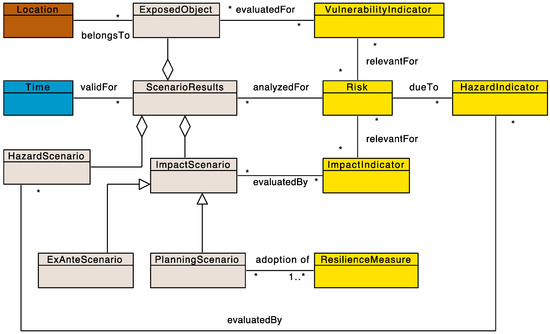
Figure 4.
Data model represented as a UML class diagram. The yellow color highlights the risk/resilience variables and definitions that are used to evaluate the scenarios (how). The Scenario-Results entity is a container for the Hazard-Scenario values, Exposure/Vulnerability values and the computed Impacts (what). Location refers to the geographic place of the objects exposed at risk (where) and Time to the time periods of reference for the scenarios (when), * stands for multiplicity.
For the developed prototypes, we realized an Excel dataset template, and created a new instance of it, with the specific data of each city and of its resilience aspects, when implementing a new dashboard.
The elaboration of the risk indicators (step 2) and the design of the user interfaces (step 3) are city-specific activities. Here we provide a general overview of these steps, whereas a detailed description for the city of Camerino is contained in Section 4.
For a case study, vulnerability and exposure indicators have been identified and elaborated on using the data available from the HArIS and THIS tools. Then, the most relevant impact scenarios for the given decision objective have been selected for representation in the ARCH DSS dashboard. Rules for data import, filtering, aggregation, and charts realization have been implemented using the PowerBI language and functionality, so that data updates in the source Excel file, such as new vulnerability indicators or types of impacts, are reflected in the interfaces by a refresh and a few graphical operations without essential re-coding. Impact and vulnerability functions assign a severity level to the object of the city under analysis (e.g., a district, population of a district, a historic building). These functions leverage on numerical thresholds to map the indicator values to an ordinal scale. Hence, following commonly used methods in qualitative risk assessment, risk levels for an object are obtained from a risk matrix, a two-dimensional table that combines severity of hazard and the impact/exposure level. Impact and vulnerability functions as well as the risk matrices used in the DSS tools are detailed in Section 4 describing the Camerino case study.
For the user interfaces, interactive visual objects, such as maps and basic statistics charts, to display and browse the data in a single page, have been preferred for a user friendly and essential presentation of the data. Each tool provides risk/impact maps as a main visualization means and one or two summary pages for exploration of quantitative aspects and elaboration details. The content of each dashboard has been organized to respond to user queries relevant for a given decision objective. To the aim of tools replicability to different cities, we have identified types of decision objectives, and we have defined corresponding interface structures. Examples of such objectives are “increase risk awareness of the population” and “planning the reconstruction of an historic centre.”
4. ARCH DSS for Camerino Case Study
This section details the activities of the ARCH DSS agile development process in Figure 2 accomplished for the municipality of Camerino.
4.1. Co-Creation Process and Results
The ARCH DSS co-creation process has been conceived as a four-step workshop (W1-W4) approach (following [35]); each workshop aimed to address specific questions as outlined below:
W1. Setting the scope, context, criteria: What is the overall scope of impact scenario assessment? More in detail: Why are you interested to know about potential impacts in your historic areas in the current situation, i.e., assessment of ex-ante scenario? Would it be beneficial for you to understand the extent of possible benefits arising from implementing mitigation strategies, i.e., assessment of ex-post scenarios? Which phase of the DRR/CCA should target the assessment (Figure 1)? What is the targeted decision-making process that this assessment is aiming to inform? Who are the stakeholders, decision makers and managers interested in this assessment and in the targeted decision-making process?
W2. Co-creating ex-ante impact scenarios and meaningful metrics/KPIs for ex-ante scenario representation: Which specific information/data/KPIs stakeholders might be interested in and/or might be more meaningful for them?
W3. Selection of resilience Strategies/Solutions, Co-creating ex-post impact scenarios and meaningful metrics/KPIs for ex-post scenario representation: Which are the resilience strategies and/or solutions that might support one specific or multiple phases of the DRR/CCA process, and to what extent might they be beneficial in supporting resilience? Which specific information/data/KPIs might be more meaningful/effective for representing resilience increase?
W4. Co-creating and testing of ARCH DSS’s functionalities: Which functionalities might facilitate the uptake, usability and usefulness of the ARCH DSS?
The targeted aims of each one of the workshops (W1–W4) are further outlined in Table 2.
Table 2.
Structure of the ARCH DSS co-creation process.
Table 3 below summarizes the key results that were achieved during each one of the ARCH DSS co-creation workshops W1-W4 in Camerino. These results are then further detailed in the following section, i.e., Section 4.2. Digital interactive boards were used to ease the collaborative work, as shown in Figure 5.
Table 3.
Summary of key results after the ARCH DSS co-creation workshops W1-W4 in Camerino.
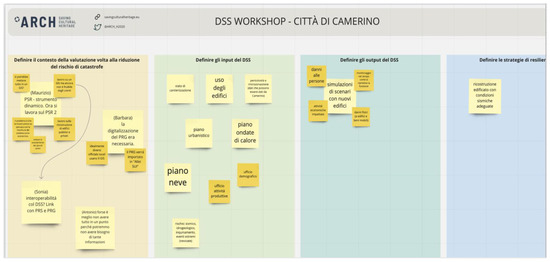
Figure 5.
On-line interactive board used to support co-creation related to the ARCH DSS Camerino activities in particular during Workshops W2 and W3.
4.2. Design of the DSS
A summary of the dashboard specification with the type of indicators selected and how the ARCH DSS dashboard links with the other ARCH tools is presented in Table 4.
Table 4.
Requirements for Camerino ARCH DSS dashboard.
The first step for the development has been the identification and the collection in HArIS and THIS of the data deemed to be relevant for what is described next.
4.3. Data and Information from HArIS and THIS
ARCH DSS dashboards sourced data and information from ARCH THIS and HArIS for the characterization of the exposure and hazard respectively.
THIS combines different data sources to offer indicators about threats and hazards potentially affecting the historic areas. With reference to the earthquake hazard, different information is available in THIS including historical events, recent events and continuous and real-time monitoring, as described in Table 5.
Table 5.
Information contained in THIS and available for the DSS.
For the hazard representation in Camerino, reference has been made to the Seismic Hazard Map and Historical earthquakes Database (first and third row in Table 5 above and Table 6 below).
Table 6.
Information contained in HArIS and available for the DSS.
A hazard map following earthquake events (e.g., [45,47]) can be realized by using the recordings from the Real-Time Urban Seismic Network deployed in and around the historic center of Camerino [46] (for seismic events causing acceleration peaks greater than 1 cm/s2 [45] and accounting for the different amplification of the ground motion due to the different peculiar morphology and soil conditions of the inhabited areas in the municipal territory of Camerino). This map, coupled with the automatic implementation of the analytical functions described in Section 4.4.1 would allow for the elaboration of impact scenarios a few minutes after a seismic event.
HArIS stores and structures information about movable and immovable assets in the HA, therefore data have been collated on both buildings and artworks (cf. [45]). Table 6 reports the main information collected for each asset depending on its typology. In black color are those that have been actually used for the ARCH DSS Camerino dashboards, while in blue color are those ones that have not been used for this specific implementation.
4.4. Tool Realization in the BI Environment
The ARCH DSS has been realized and deployed as an MS PowerBI report. The HArIS and THIS data, described in Section 4.3, has allowed instantiation of the model in Figure 4, and it has been used for the resilience analysis as follows.
4.4.1. Assessment and Representation of Ex-Ante and Ex-Post Scenarios
Impacts and damages to the built and natural environment, as well as to the social, economic and intangible dimensions of the historic areas potentially induced by climate changes and other hazards, can be estimated by convoluting:
- -
- the assessment of the hazards that might potentially affect the location of the historic area;
- -
- the characterization of the elements, both tangible and intangible, included in the different dimensions of the historic area, exposed to those hazards;
- -
- the assessment of the vulnerabilities of the historic area’s exposed elements to each specific hazard identified.
In summary, the determinants of risk assessment are: hazard, exposure and vulnerability; impacts induced by earthquake events for the historic areas of Camerino have been estimated as a function of those determinants. The abovementioned concept, specifically customized for historic areas, is universally recognized [48,49,50,51,52,53] and can be summarized in the following Equation:
where the symbol * has the meaning of convoluting and the symbol ≈ has the meaning of numerical approximations.
Impacts ≈ Hazard * Exposure * Vulnerability
An important aspect to be highlighted about risk and impact scenario assessment is in fact the incomplete knowledge in each one of the three abovementioned determinates, i.e., hazard assessment, exposure characterization and vulnerability assessment; these uncertainties that necessarily combine into an expanded uncertainty affecting the impact assessment do not necessarily have to be quantified [54], and in the ARCH project has been quantified only to a certain extent. However, it is imperative to be aware and make any potential users aware of the gaps in knowledge and resulting uncertainties. Therefore, an impact assessment is just targeting the estimation of “the potential for adverse impacts and consequences”, where the word “potential” is used to make clear and explicit the uncertainty affecting the assessment.
Hazard. Two different seismic hazard scenarios have been considered and represented in the Camerino ARCH DSS, i.e., produced by a low and a very high seismic event; Table 7 below summarizes the characteristics of these events, while all the details are provided in the ARCH deliverable D5.1 [55], including the explanation of how the data included in THIS has been used and exploited to define the hazard scenarios.
Table 7.
ARCH DSS Camerino, hazard scenarios.
Vulnerability. Reference has been made to an index-based method for assessing the seismic vulnerability of both residential and monumental buildings, referred to as macroseismic-mechanical vulnerability, according to which the seismic vulnerability is measured in terms of a Vulnerability Index V ranging from 0 to 1 computed by accounting for different typological and constructive features of the building as well as its state of maintenance and any retrofitting intervention; data on the aforementioned features were sourced from HArIS as reported in D4.2 [56] and D5.2 [57]. The seismic Vulnerability Index V approach, implemented for the Camerino ARCH DSS, is a cross-validated observed-based/expert-based/mechanical-based approach. This approach can be implemented with different levels of data availability, starting from very basic data. Then, the reliability of the estimated seismic vulnerability index V can be improved when further data about the building and/or evidence on the seismic performance of similar typologies become available. This data may come from on-the ground observations, in-situ or laboratory tests as well as from numerical analysis simulations. All the details of the methods are reported in [58,59], and summarized in D5.2 [57].
Physical Damage Assessment. Equation (2), proposed by [58,59] has been implemented in the Camerino ARCH DSS for the assessment of earthquake-induced physical damage to both residential and monumental buildings:
where, μD is the expected mean degree of damage for single buildings; the seismic hazard is represented using the macroseismic intensity IEMS-98, according to the European Macroseismic Scale EMS-98 [60]; the seismic vulnerability of single or sets of aggregated buildings and structures is assessed in terms of the Vulnerability Index V and Ductility Index Q; α and β are coefficients whose value can be assumed as follows: α = 6.25, β = 13.1, resulting by deriving Equation (2) from the damage probability matrices implicitly defined by EMS-98 [60] using a combined probabilistic and fuzzy-logic approach [58,59].
μ_D = 2.5[1+tanh((I_(EMS-98)+αV-β)/Q)]
The level of damage to each building or group of buildings can be allocated based on the resulting μD according to the EMS-98 physical damage scale [60] that considers five damage levels, Dk i.e., D1, D2, D3, D4, D5, plus the absence of damage, D0, enabling the qualitative description of the earthquake-induced physical damage to building structural and non-structural components (Table 8).
Table 8.
Attribution of damage level Dk (k = 0–5) based on μD ranges resulting from Equation (1).
Consequences on People. Starting from the level of earthquake-induced physical damage Dk (k = 0–5) estimated as for Equation (2) and Table 8 above, consequences, for each building and for the two different hazard scenarios estimated (Table 9), in terms of possible unavailability of the building and consequences for the people possibly present in the building and therefore exposed to the falls of non-structural elements, and/or the partial or global collapse of the structure have been estimated, as such:
Table 9.
Consequences on People estimated based on physical damage levels Dk (k = 0–5).
- Injured people, 5% of the people who are in buildings damaged at level D4 and 30% of those who are in buildings damaged at level D5;
- Dead people, 1% of people who are in buildings damaged at level D4 and 10% of those who are in buildings damaged at level D5.
- To assess the consequences on people as above-mentioned, reference has been made to the approach adopted by the Italian national Department of Civil Protection for assessing the seismic risk in Italy at a national scale [61].
Consequences on Artworks. These have been assessed starting from the assessment of the “downtime” of the building, i.e., the time during which the building hosting the artwork cannot be accessed due to inspections, propping, repair, or reconstruction activities. According to the adopted approach [61] building downtime can be estimated (Table 10) as such:
Table 10.
Assumed correlation between physical damage level Dk, the residual building usability and downtime, impacts on the artworks and loss of intangible value.
- -
- Buildings unusable in the short term for inspections and safety of non-structural elements or limited portions of the building: damaged buildings with a level of damage D1 and D2;
- -
- Buildings unusable in the long term for safety and repair or reconstruction work: buildings damaged with a damage level from D3 onwards.
As a function of the downtime levels, consequences on the artworks can be estimated (Table 10) as such:
- -
- Artworks to be evacuated, the ones contained in buildings unusable in the long term;
- -
- Artworks damaged: 1% of artworks contained in buildings damaged at level D3, 5% of the artworks contained in buildings damaged at level D4, and 30% of those that are in buildings damaged at level D5.
Furthermore, a more granular definition of downtime level and a first estimation in terms of the impact to intangible heritage attributes is proposed in Table 10.
Direct Economic Losses. These have been assessed limited to the costs of building repair and reconstruction calculating as a first step a value for each building (i.e., by multiplying the total surface area of each building by an assumed Unit Cost [euro/m2] equal to 1350 euro/m2); secondly the repair/replacement costs have been estimated by multiplying the resulting building value by the level Ck (ranging percentages from 0–100% of the building value) corresponding to the damage level Dk suffered by each building in the assessed scenario, as reported in Table 11.
Table 11.
Assumed correlation between physical damage level Dk, and cost level Ck defined of [%] of building value required for repair or rebuilding interventions.
The Impact levels Ik, (k = 1–5) used to provide a visual representation, further to the numerical one, in the ARCH DSS Camerino dashboard of the consequences on people, artworks and direct economic losses (i.e., repair/reconstruction costs for the damaged buildings) have been organized as reported in Table 12.
Table 12.
Assumed impact levels Ik (k = 0–5) for the numerical ranges of the consequences estimated for people, artworks and direct losses in the ARCH DSS Camerino.
Ex post scenarios. After the implementation of solutions and strategies selected from the ARCH RMI, the positive effects of realizing structural interventions on buildings to reduce seismic vulnerability, adopted at the maximum possible extent, vernacular constructive techniques have been assessed and represented in the ARCH DSS Camerino. Two hypotheses of resilience strategies have been analyzed, i.e., heavy and light structural interventions on the buildings and the benefits have been represented in the ARCH DSS Camerino in terms of reduction of the impacts estimated for people, artworks and economic losses for the two hazard scenarios under analysis (i.e., low and devastating, as in Table 2) compared to the status-quo impact scenario. ARCH deliverables D5.2 [57] and ARCH D6.2 [62] report on how the vulnerability and ductility indexes, V and Q have been modified to reflect the implementation of the structural interventions on the buildings. Damages and Impacts for the ex-post scenarios have been assessed as a function of the updated V, Q by implementing Equation (2) and the following steps, as described above.
4.4.2. User Interfaces
The ARCH DSS user interfaces have been designed based on the objective of the decision processes of interest and the type and granularity of the information to be presented. Within the overall objective of the DSS, such as support planning resilience building of the historic area, two more specific objectives were agreed with the Camerino municipality stakeholders for the tool, namely: (OA) planning the reconstruction and (OB) preservation of the artworks. For each of these objectives, a set of design questions were defined to select and organize the information into a tool available for usage in a short time. These are:
(Q_OA) What earthquake scenarios are the most relevant? What is the impact for the city? Which building would be most affected if no intervention is planned? How do different structural interventions compare?
(Q_OB) Which buildings are the most vulnerable from the perspective of the CH preservation? What is the most effective intervention for CH?
From these questions, data visualization objects have been built by using the functions of PowerBI, and a sort of storytelling-based and interactive report has been realized. The first page of the report, shown in Figure 6, represents on a map some impact scenarios assuming the situation on the built environment as is (ex-ante as built). Impact levels for selected types are presented, that aggregate results from simulated earthquake scenarios of low and very high severity. The second page provides a view of two impact maps enabling a comparison between ex-ante (no intervention) and ex-post light structural interventions. The third page allows a comparison of impact scenarios after two different resilience strategies, such as light structural intervention and heavy structural intervention (see Figure A1 and Figure A2 in Appendix B). The fourth page provides more details on the results by means of data charts.
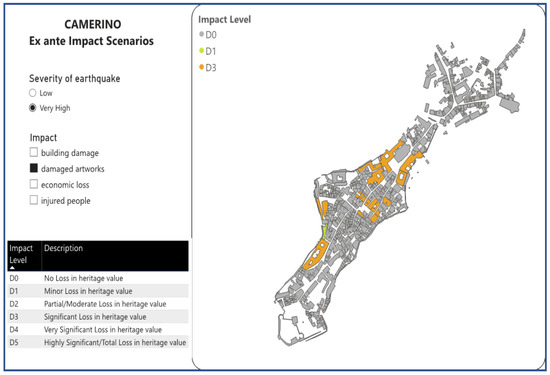
Figure 6.
Visualization of ex ante impact scenarios.
As described in Table 1, the ARCH DSS Camerino dashboard has been designed to be adaptable to late requirements. In this respect, the following extensions are envisaged, which will be delivered in additional pages of the report without impact on the current interfaces:
- -
- “Calibration” where HARIS “Damage” information is used to compare and calibrate the damage scenarios estimated and already represented in ARCH DSS;
- -
- “Climate-change impact scenario” where HArIS data about “percentages of materials on the façade” is used to estimate the possible impacts in terms of erosion and material degradation exacerbated by extreme events induced by climate change; the idea is to depict and represent in ARCH DSS dashboards the cause-effect relationships between various stressors (sudden and/or extreme changes in temperature, precipitation, atmospheric moisture, and wind intensity) and their impacts on cultural heritage. This will allow other researchers, stakeholders, and possibly decision-makers to determine the potential impacts of climate change on a specific cultural heritage asset, with special focus on façades as a first step.
- -
- “Intangible values and intangible impacts” where HArIS data about “Social/cultural values” is used to support the prioritization of retrofitting interventions and/or post-disaster reconstruction based on the local communities’ intangible values, such as their wellbeing and sense of belonging.
Similarly, as the current version of the ARCH DSS dashboard supports only representation of static scenarios, temporal evolution of the resilience, that is by its nature a time-dependent characteristic, can be displayed as a future extension of the tool, following what envisaged in [5,63,64,65].
4.5. End Users Feedback
The ARCH DSS tool was first demonstrated at a co-creation workshop with stakeholders of the Camerino municipality, as described in Section 4.1. Then the tool was made publicly accessible on the Internet, and additional users from the municipality were invited to evaluate it off-line until the end of the project (period from May to July 2022). A survey, prepared for all case studies, was supplied to them to collect feedback. The survey is presented in Appendix A, together with the collected results. As shown, positive feedback has been received from users having different roles at the Camerino municipality, relevant for the case study, who also provided constructive suggestions for improvement, regarding both the tools’ functionality and the type of information presented.
5. Conclusions, Future Works and Practical Implications
The paper described an innovative fully co-creative-based approach to develop user friendly tools for democratizing the knowledge and awareness on possible impacts that might arise from natural hazards in the built environments, with special focus on historical areas. In particular, the possibilities and extent of the benefits that might arise, after significant resilience interventions, have been elaborated on for the tools to support informed decision making.
The paper showcases the process and implementation of the proposed methods on the case study of Camerino Municipality. This application has been focused on the possible impacts induced by earthquakes and on the benefits that can be obtained by the retrofitting of the building, at different level of strength, in terms of a significative reduction of the impacts expected on the population, built environment, as well as on the peculiar and precious artworks hosted by the several monumental buildings in Camerino.
The process activities, from requirements collection to the validation of the tools, which have been performed iteratively, have actively involved expert end-users at the Camerino Municipality.
Future aims for practical usage of the ARCH DSS dashboard have been envisaged in this process, including support to emergency management, with the possibility of handling and representing real time hazard mapping, and estimation of impacts, after real events. Capabilities to handle dynamic data (i.e., data that varies over time), to represent and update socio-economic KPIs and intangible impacts KPIs, can be added with low development effort within the same framework.
With respect to future research from a technological viewpoint, enhancing the decision support with methods of artificial intelligence or agent-based and/or of systems dynamics, could be investigated to face the complexity of human decisions in relation to the tangible and intangible dimensions of the historic areas.
This work provides several practical implications both from a technological and a methodological perspective. The first is related to the usability and potential benefits of the ARCH DSS, as conceived within the ARCH project, after the project itself, possibly extended to, or customized for, different end users. In this case, stakeholders as well as members of the community can refer to and use the ARCH DSS dashboards to inform and support all the phases of the DRR/CCA cycle. In the pre-disaster disaster phase, the ARCH DSS dashboards can be used to create awareness among the population of hazards, vulnerabilities, and impacts; in particular the ARCH DSS dashboards can be seen as an education supporting tool, starting from the primary school level, to create awareness among the young generations on the feasibility and effectiveness of implementing mitigation actions and on taking a proactive role in disaster prevention. For workers, managers and directors of civil protection offices, the ARCH DSS dashboards may inform, enrich and make readily available, consultable civil protection plans. For asset managers and urban planning and workers, the ARCH DSS dashboards may inform and complement urban plans, allowing to account for hazards and make wise decisions for post-disaster reconstruction and/or for business-as-usual urban planning so that any future growing and development of the city or conservation strategies for historic area can avoid or mitigate impacts.
No less important is the methodological implication. The detailed description of the experience of Camerino provided in this paper is exemplary for how to replicate the ARCH DSS development process in further case studies, e.g., different cities and/or different hazards and/or different resilience metrics. This would allow for gaining feedback and lessons-learnt that are useful for improving the methodology itself.
Author Contributions
Conceptualization, Sonia Giovinazzi, Maria Luisa Villani and Antonio Costanzo; methodology, Sonia Giovinazzi and Maria Luisa Villani; software, Maria Luisa Villani and Antonio Costanzo; validation, Sonia Giovinazzi and Maria Luisa Villani; investigation, Antonio Costanzo and Sonia Giovinazzi; resources, Sonia Giovinazzi, Maria Luisa Villani and Antonio Costanzo; data curation, Maria Luisa Villani and Antonio Costanzo; writing—original draft preparation, Maria Luisa Villani, Sonia Giovinazzi and Antonio Costanzo; visualization, Maria Luisa Villani and Sonia Giovinazzi; funding acquisition, Sonia Giovinazzi and Antonio Costanzo All authors have read and agreed to the published version of the manuscript.
Funding
The research activities have been funded by the project “ARCH—Advancing Resilience of historic areas against Climate-related and other Hazards” funded by Horizon 2020—European Union Research and Innovation Program under grant agreement No. 820999. The sole responsibility for the content of this publication lies with the authors. It does not necessarily represent the opinion of the European Union. Neither the EASME, nor REA, nor the European Commission is responsible for any use that may be made of the information contained therein. The work is also funded by Project 1.7 “Technologies for the efficient penetration of the electric vector in the final uses” within the “Electrical System Research” PTR 22–24.
Institutional Review Board Statement
Not applicable.
Informed Consent Statement
Not applicable.
Data Availability Statement
The data supporting reported results can be found in the ARCH HaRIS and THIS tools accessible through the ARCH Geoportal https://www.cs.ingv.it/ARCHPortal/ (accessed on 5 December 2022).
Acknowledgments
The authors would like to thank the Municipality of Camerino and especially Eng. Quintilio Piattoni, and Arch. Matteo Iommi for supporting and advising during all the co-creation activities, including the deployment of the ARCH DSS survey, and for facilitating the contact and continuous dialogue with the local stakeholders. Authors warmly acknowledge the interesting discussions and useful suggestions provided by several colleagues involved in the ARCH project: FHG team and in particular Daniel Lückerath for all the advice and inputs on the ARCH Risk Scenario Toolbox and for being the amazing project manager of the ARCH project; the University of Camerino team lead by Andrea Dell’Asta and including Graziella Roselli, Enrica Petrucci, Eng. Michele Morici, about the vulnerability assessment of both residential and monumental buildings; ICLEI team and in particular Luca Arbau and Jole Lutzu that guided and advised all the activities for co-creating impact scenarios and for co-creating the features and outlook of the ARCH DSS; TECNALIA team that conceived the RMI tool, and in particular Saioa Zorita.
Conflicts of Interest
The authors declare no conflict of interest.
Appendix A. ARCH DSS Usability and Usefulness Survey: Questions and Results
As part of the DSS survey that was deployed after the co-creation workshop W4, participants have been invited to provide a little personal information including: city; gender; working role; department, and email address. The Working Role (open question) of the seven respondents included: Director of the Office for Reconstruction of the Private buildings; General affairs manager; Technical Management Instructor (2); Technical Office Instructor (two of them); non-declared (two of them).
The DSS survey included two Likert scale questions and two open-ended questions. For the Likert scale questions, a five-level scale was adopted for expressing a judgment on the usefulness and on the ease of interpretation of the tool. The questions and the correspondent answers of Likert type from the participants are reported in the table below.
| ARCH DSS Survey—Questions | Answers |
| Q1. To what extent are the interactive risk maps easy to interpret? (score easy to interpret on a scale from 0 to 5) | 4, 5, 4, 4, 4, 4, 5 |
| Q2. How useful do you think the ARCH DSS might be to: (score usefulness on a scale from 0 to 5) | |
| 4, 5, 4,4, 5, 5, 5 |
| 5, 5, 4,4, 4, 5, 5 |
| 5, 5, 5, 5, 5, 5, 5 |
| Q3. Is there anything else you would like to comment or suggest on the ARCH DSS tool? (open question) | |
| Q4. Do you have any suggestion about possible improvements to the graphical representation of the ARCH DSS and/or about further additional indicators and features to be included (open question) |
Results concerning ease of interpretation and usefulness of the tool are overall very positive. As for the open questions to collate feedback and suggestions for improvements (i.e., Q3 and Q4) it is worth highlighting that the stakeholders had the opportunity to directly test the ARCH DSS beforehand the deployment of the survey.
As far as question Q3 is concerned, the following feedbacks were collected about:
- -
- The possibility for Camerino Municipality to directly have access to the GIS layers or geo-referred data to overlay them with the GIS layers used for the “Extraordinary Program for the Reconstruction, EPR”; or the other way around, i.e., the ARCH DSS including the EPR files.
- -
- The possibility to integrate and update data in real time (e.g., about on-going reconstruction and/or retrofitting intervention on-going or finalized) (3 times).
- -
- The possibility to export data in different format (e.g., text and excel spreadsheets) so that they can be available for modifications and/or further processing (2 times).
As far as question Q4 is concerned the following feedback was collected about:
- -
- The possibility of exporting the graphical outputs (i.e., the maps representing the ex-ante and ex-post scenarios) in different formats such as *.doc, *.xls, *.mdb, etc.
- -
- The possibility of adding some further information on how to interpret resilience outputs for the ex-post scenarios.
Appendix B. Ex-Post Scenarios
Figure A1 and Figure A2 present the ex-post scenarios after the implementation of solutions and strategies selected from the ARCH RMI. In particular, Figure A1 shows the positive effects of realizing a light structural intervention on buildings to reduce the seismic vulnerability; the difference in terms of impacts (economic losses in particular can be seen in the picture) with respect to status-quo (or as built) conditions can be appreciated.

Figure A1.
Comparative Visualization of ex ante and ex-post impact scenarios: the effective of implementing a resilience option can be seen and compared with as-built scenarios.
Figure A1.
Comparative Visualization of ex ante and ex-post impact scenarios: the effective of implementing a resilience option can be seen and compared with as-built scenarios.

Figure A2 shows the dashboard page where the effectiveness of two different hypothesis of resilience interventions, i.e., heavy and light structural interventions on buildings, can be seen and compared.

Figure A2.
Comparative Visualization of ex post impact scenarios of two different resilience options so that their different effectiveness can be seen and compared.
Figure A2.
Comparative Visualization of ex post impact scenarios of two different resilience options so that their different effectiveness can be seen and compared.

References
- EU R & I Task Force for Climate Neutral and Resilient Historic Urban Districts. Paving the Way for Climate Neutral and Resilient Historic Districts. 2022. Available online: https://savingculturalheritage.eu/resources/eu-task-force-for-climate-neutral-and-resilient-historic-urban-districts (accessed on 5 December 2022).
- EU Horizon 2020 ARCH, Advancing Resilience of historic areas against Climate-related and other Hazards. Available online: https://savingculturalheritage.eu/ (accessed on 5 December 2022).
- Randazzo, G.; Italiano, F.; Micallef, A.; Tomasello, A.; Cassetti, F.P.; Zammit, A.; D’Amico, S.; Saliba, O.; Cascio, M.; Cavallaro, F.; et al. WebGIS Implementation for Dynamic Mapping and Visualization of Coastal Geospatial Data: A Case Study of BESS Project. Appl. Sci. 2021, 11, 8233. [Google Scholar] [CrossRef]
- Choukolaei, H.A.; Ghasemi, P.; Goodarzian, F. Evaluating the efficiency of relief centers in disaster and epidemic conditions using multi-criteria decision-making methods and GIS: A case study. Int. J. Disaster Risk Reduct. 2023, 85, 103512. [Google Scholar] [CrossRef] [PubMed]
- Giovinazzi, S.; Marchili, C.; Di Pietro, A.; Giordano, L.; Costanzo, A.; Porta, L.L.; Pollino, M.; Rosato, V.; Lückerath, D.; Milde, K.; et al. Assessing earthquake impacts and monitoring resilience of historic areas: Methods for GIS tools. ISPRS Int. J. Geo-Inf. 2021, 10, 461. [Google Scholar] [CrossRef]
- Dobariya, R.; Bano, D.; Momin, K.; Gurung, D.R.; Nasab, N. Community Level Risk Assessment Using GIS—An Innovative Method for Participatory Risk Assessment. Lect. Notes Civ. Eng. 2023, 294, 257–268. [Google Scholar] [CrossRef]
- MS PowerBI. Available online: https://powerbi.microsoft.com/ (accessed on 30 November 2022).
- Pentaho. Available online: https://sourceforge.net/projects/pentaho/ (accessed on 30 November 2022).
- Bhat, M.A.; Shah, R.M.; Ahmad, B. Cloud computing: A solution to geographical information systems (GIS). Inter. J. Comp. Sci. Eng. 2011, 3, 594–600. [Google Scholar]
- UN General Assembly. Transforming Our World: The 2030 Agenda for Sustainable Development. A/RES/70/1. 21 October 2015. Available online: https://www.refworld.org/docid/57b6e3e44.html (accessed on 5 December 2022).
- United Nations International Strategy for Disaster Reduction (UNISDR). Sendai Framework for Disaster Risk Reduction 2015–2030. Available online: https://www.undrr.org/publication/sendai-framework-disaster-risk-reduction-2015-2030 (accessed on 5 December 2022).
- GEM. Global Earthquake Model. Available online: https://www.globalquakemodel.org/gem (accessed on 5 December 2022).
- FEMA. HAZUS-MH Platform. Available online: https://www.fema.gov/flood-maps/products-tools/hazus (accessed on 5 December 2022).
- CAPRA. Probabilistic Risk Assessment Platform. Available online: https://ecapra.org/ (accessed on 5 December 2022).
- Newman, J.P.; Maier, H.R.; Riddell, G.A.; Zecchin, A.C.; Daniell, J.E.; Schaefer, A.M.; van Delden, H.; Khazai, B.; O’Flaherty, M.J.; Newland, C.P. Review of literature on decision support systems for natural hazard risk reduction: Current status and future research directions. Environ. Model. Softw. 2017, 96, 378–409. [Google Scholar] [CrossRef]
- Matassoni, L.; Fiaschi, A.; Giovinazzi, S.; Pollino, M.; La Porta, L.; Rosato, V. A geospatial decision support tool for seismic risk management: Florence (Italy) case study. In Computational Science and Its Applications—ICCSA 2017; Lecture Notes in Computer Science, Part II, LNCS 10405; Springer International Publishing: Cham, Switzerland, 2017; pp. 278–293. [Google Scholar]
- Bocchini, G.M.; Pomonis, A.; So, E.; King, A.B.; Giovinazzi, S. The GEM Earthquake Consequences Database and New Zea-land’s Contributions. 2014 NZSEE Conference. Available online: https://www.researchgate.net/publication/283934626_The_GEM_earthquake_consequences_database_and_New_Zealand\T1\textquoterights_contributions (accessed on 5 December 2022).
- Vecere, A.; Monteiro, R.; Ammann, W.J.; Giovinazzi, S.; Santos, R.H.M. Predictive models for post disaster shelter needs assessment. Int. J. Disaster Risk Reduct. 2017, 21, 44–62. [Google Scholar] [CrossRef]
- Balbi, A.; Galasco, S.; Giovinazzi, S.; Lagormarsino, S.; Parodi, S. “Scenario Sismico”: A Tool For Real Time Damage Scenarios. In Proceedings of the First European Conference on Earthquake Engineering and Seismology, Geneva, Switzerland, 3–8 September 2006; p. 912. [Google Scholar]
- Pollino, M.; Fattoruso, G.; La Porta, L.; Della Rocca, A.B.; James, V. Collaborative Open Source Geospatial Tools and Maps Supporting the Response Planning to Disastrous Earthquake Events. Future Internet 2012, 4, 451–468. [Google Scholar] [CrossRef]
- Steiniger, S.; Hunter, A.J.S. Free and Open Source GIS Software for Building a Spatial Data Infrastructure. In Geospatial Free and Open Source Software in the 21st Century; Bocher, E., Neteler, M., Eds.; Springer: Berlin/Heidelberg, Germany, 2011; pp. 247–261. [Google Scholar]
- Ferreira, T.M.; Eudave, R.R. Assessing and Managing Risk in Historic Urban Areas: Current Trends and Future Research Directions. Front. Earth Sci. 2022, 10, 847959. [Google Scholar] [CrossRef]
- Coletti, A.; De Nicola, A.; Di Pietro, A.; La Porta, L.; Pollino, M.; Rosato, V.; Vicoli, G.; Villani, M.L. A Comprehensive System for Semantic Spatiotemporal Assessment of Risk in Urban Areas. J. Contingencies Crisis Manag. 2020, 28, 178–193. [Google Scholar] [CrossRef]
- Coletti, A.; De Nicola, A.; Villani, M.L. Building climate change into risk assessments. Nat. Hazards 2016, 84, 1307–1325. [Google Scholar] [CrossRef]
- Praharaj, S.; Wentz, E. Building community resilience through geospatial information dashboards. Int. Arch. Photogramm. Remote Sens. Spat. Inf. Sci.-ISPRS Arch. 2022, 48, 151–157. [Google Scholar] [CrossRef]
- Schlesinger, P.; Rahman, N. Self-Service Business Intelligence Resulting in Disruptive Technology. J. Comput. Inf. Syst. 2016, 56, 11–21. [Google Scholar] [CrossRef]
- Lennerholt, C.; van Laere, J.; Söderström, E. Implementation challenges of self service business intelligence: A literature review. In Proceedings of the Annual Hawaii International Conference on System Sciences (HICSS), Hilton Waikoloa Village, HI, USA, 3–6 January 2018; pp. 5055–5063. [Google Scholar]
- Bani-Hani, I.; Chowdhury, S.; Kurti, A. The Triadic Relationship of Sense-Making, Analytics, and Institutional Influences. Informatics 2022, 9, 3. [Google Scholar] [CrossRef]
- Patriarca, R.; Di Gravio, G.; Cioponea, R.; Licu, A. Democratizing business intelligence and machine learning for air traffic management safety. Saf. Sci. 2022, 146, 105530. [Google Scholar] [CrossRef]
- Wang, B. Safety intelligence as an essential perspective for safety management in the era of Safety 4.0: From a theoretical to a practical framework. Process. Saf. Environ. Prot. 2021, 148, 189–199. [Google Scholar] [CrossRef]
- De Nicola, A.; Giovinazzi, S.; Guarascio, M.; Rizzi, P.; Villani, M.L. Gamified Decision Making for a Participatory Post-Crisis Recovery: A Model based Process. In Proceedings of the 30th European Safety and Reliability Conference and the 15th Probabilistic Safety Assessment and Management Conference, Venice, Italy, 1–5 November 2020; pp. 1937–1943. [Google Scholar] [CrossRef]
- Giovinazzi, S.; Villani, M.L.; Giordano, L.; Lückerath, D.; Zorita, S.; Costanzo, A. D3.5 ARCH Deliverable, “Co-Creating the Impact and Risk Assessment”. July 2022. Available online: https://savingculturalheritage.eu/resources/deliverables (accessed on 5 December 2022).
- Zebisch, M.; Terzi, S.; Pittore, M.; Renner, K.; Schneiderbauer, S. Climate Impact Chains—A Conceptual Modelling Approach for Climate Risk Assessment in the Context of Adaptation Planning. In Climate Adaptation Modelling; Springer Climate: Cham, Switzerland, 2022. [Google Scholar] [CrossRef]
- Rowley, J. The wisdom hierarchy: Representations of the DIKW hierarchy. J. Inf. Sci. 2007, 33, 163–180. [Google Scholar] [CrossRef]
- UNI CWA 17727:2022. City Resilience Development—Guide to Combine Disaster Risk Management and Climate Change Ad-aptation—Historic Areas. Available online: https://store.uni.com/en/uni-cwa-17727-2022 (accessed on 5 December 2022).
- Stucchi, M.; Rovida, A.; Gomez Capera, A.A.; Alexandre, P.; Camelbeeck, T.; Demircioglu, M.B.; Gasperini, P.; Kouskouna, V.; Musson, R.M.W.; Radulian, M.; et al. The SHARE European Earthquake Catalogue (SHEEC) 1000–1899. J. Seism. 2013, 17, 523–544. [Google Scholar] [CrossRef]
- Grünthal, G.; Wahlström, R.; Stromeyer, D. The SHARE European Earthquake Catalogue (SHEEC) for the time period 1900–2006 and its comparison to the European-Mediterranean Earthquake Catalogue (EMEC). J. Seismol. 2013, 17, 1339–1344. [Google Scholar] [CrossRef]
- Guidoboni, E.; Ferrari, G.; Mariotti, D.; Comastri, A.; Tarabusi, G.; Sgattoni, G.; Valensise, G. CFTI5Med, Catalogo dei Forti Terremoti in Italia (461 a.C.-1997) e nell’area Mediterranea (760 a.C.-1500); Istituto Nazionale di Geofisica e Vulcanologia (INGV): Roma, Italy, 2018. [Google Scholar] [CrossRef]
- Guidoboni, E.; Ferrari, G.; Tarabusi, G.; Sgattoni, G.; Comastri, A.; Mariotti, D.; Ciuccarelli, C.; Bianchi, M.G.; Valensise, G. CFTI5Med, the new release of the catalogue of strong earthquakes in Italy and in the Mediterranean area. Sci. Data 2019, 6, 80. [Google Scholar] [CrossRef]
- Basili, R.; Kastelic, V.; Demircioglu, M.B.; Moreno, D.G.; Nemser, E.S.; Petricca, P.; Sboras, S.P.; Besana-Ostman, G.M.; Cabral, J.; Camelbeeck, T.; et al. European Database of Seismogenic Faults (EDSF) compiled in the framework of the Project SHARE. 2013. Available online: https://edsf13.ingv.it/ (accessed on 5 December 2022).
- DISS Working Group. Database of Individual Seismogenic Sources (DISS), Version 3.3.0; A Compilation of Potential Sources for Earthquakes Larger than M 5.5 in Italy and Surrounding Areas; Istituto Nazionale di Geofisica e Vulcanologia (INGV): Roma, Italy, 2021. [Google Scholar] [CrossRef]
- Giardini, D.; Wössner, J.; Danciu, L. Mapping Europe’s Seismic Hazard. EOS 2014, 95, 261–262. [Google Scholar] [CrossRef]
- Stucchi, M.; Meletti, C.; Montaldo, V.; Akinci, A.; Faccioli, E.; Gasperini, P.; Malagnini, L.; Valensise, G. Pericolosità Sismica di Riferimento per il Territorio Nazionale MPS04 [Data Set]; Istituto Nazionale di Geofisica e Vulcanologia (INGV): Roma, Italy, 2004. [Google Scholar] [CrossRef]
- INGV FDSNWS Services. Available online: https://www.fdsn.org/datacenters/detail/INGV/ (accessed on 30 November 2022).
- Costanzo, A.; Falcone, S.; D’Alessandro, A.; Vitale, G.; Giovinazzi, S.; Morici, M.; Dall’Asta, A.; Buongiorno, M.F. A Technological System for Post-Earthquake Damage Scenarios Based on the Monitoring by Means of an Urban Seismic Network. Sensors 2021, 21, 7887. [Google Scholar] [CrossRef] [PubMed]
- Vitale, G.; D’Alessandro, A.; Di Benedetto, A.; Figlioli, A.; Costanzo, A.; Speciale, S.; Piattoni, Q.; Cipriani, L. Urban Seismic Network Based on MEMS Sensors: The Experience of the Seismic Observatory in Camerino (Marche, Italy). Sensors 2022, 22, 4335. [Google Scholar] [CrossRef] [PubMed]
- Costanzo, A. Shaking Maps Based on Cumulative Absolute Velocity and Arias Intensity: The Cases of the Two Strongest Earthquakes of the 2016–2017 Central Italy Seismic Sequence. ISPRS Int. J. Geo-Information 2018, 7, 244. [Google Scholar] [CrossRef]
- White, G.F. Natural hazards research. In Directions in Geography; Methuen and Co.: London, UK, 1973; pp. 193–216. [Google Scholar]
- UNDRO. Natural Disasters and Vulnerability Analysis; Report of Expert Group Meeting (9–12 July 1979); UNDRO: Geneva, Switzerland, 1980. [Google Scholar]
- Cardona, O.; van Aalst, M.; Birkmann, J.; Fordham, M.; McGregor, G.; Perez, R.; Pulwarty, R.; Schipper, E.; Sinh, B. Determinants of risk: Exposure and vulnerability. In Managing the Risks of Extreme Events and Disasters to Advance Climate Change Adaptation; A Special Report of Working Groups I and II of the Intergovernmental Panel on Climate Change (IPCC); Cambridge University Press: Cambridge, UK; New York, NY, USA, 2012; pp. 65–108. [Google Scholar]
- UNDHA. Internationally Agreed Glossary of Basic Terms Relating to Disaster Management; UNDHA: Geneva, Switzerland, 1992. [Google Scholar]
- Birkmann, J. Measuring vulnerability to promote disaster-resilient societies: Conceptual frameworks and definitions. In Measuring Vulnerability to Natural Hazards: Towards Disaster Resilient Societies; United Nations University Press: Tokyo, Japan, 2006; pp. 9–54. [Google Scholar]
- Lavell, A.; Oppenheimer, M.; Diop, C.; Hess, J.; Lempert, R.; Li, J.; Muir-Wood, R.; Myeong, S. Climate change: New dimensions in disaster risk, exposure, vulnerability, and resilience. In Managing the Risks of Extreme Events and Disasters to Advance Climate Change Adaptation; A Special Report of Working Groups I and II of the Intergovernmental Panel on Climate Change (IPCC); Cambridge University Press: Cambridge, UK; New York, NY, USA, 2012; pp. 25–64. [Google Scholar]
- IPCC. Summary for Policymakers. In Climate Change 2014: Impacts, Adaptation, and Vulnerability; Part A: Global and Sectoral Aspects. Contribution of Working Group II to the Fifth Assessment Report of the Intergovernmental Panel on Climate; IPCC: Geneva, Switzerland, 2014. [Google Scholar]
- Giovinazzi, S.; Costanzo, A.; Pollino, M.; Giordano, L.; Sciortino, M.; Di Pietro, A.; Rosato, V.; Fuentenebro, M.P.; Rodríguez Gelpi, I.R.; Zorita Castresana, S.; et al. D5.1 ARCH Deliverable, “Hazard Models for Impact Assessment”. Available online: https://savingculturalheritage.eu/resources/deliverables#c1052 (accessed on 5 December 2022).
- Krukowski, A.; Costanzo, A.; Falcone, S.; Giovinazzi, S.; Morici, M. D4.2 Deliverable of H2020 ARCH Project, GA no. 820999, “Historic Area Information System”. Available online: https://savingculturalheritage.eu/resources/delivera-bles#c1040 (accessed on 5 December 2022).
- Dall’Asta, A.; Morici, M.; Roselli, G.; Petrucci, E.; Giovinazzi, S.; Giordano, L.; Sciortino, M. D5.2 Deliverable of H2020 ARCH Project, GA no. 820999, “Handbook on Heritage Asset Vulnerability”. Available online: https://savingculturalheri-tage.eu/resources/deliverables#c1046 (accessed on 5 December 2022).
- Giovinazzi, S. The Vulnerability Assessment and the Damage Scenario in Seismic Risk Analysis. Ph.D. Thesis, University of Florence (I) and TU-Braunschweig (D), Florence, Italy, 2005. [Google Scholar]
- Lagomarsino, S.; Giovinazzi, S. Macroseismic and mechanical models for the vulnerability and damage assessment of current buildings. Bull. Earthq. Eng. 2006, 4, 415–443. [Google Scholar] [CrossRef]
- Grünthal, G. European Macroseismic Scale 1998. In Chaiers du Centre Europèen de Gèodynamique et de Seismologie; Grünthal, G., Musson, R.M.W., Schwarz, J., Stucchi, M., Eds.; Conseil de l’Europe: Luxemburg, 1998; Volume 15, 100p, ISBN 2-87977-008-4. [Google Scholar]
- Dolce, M.; Prota, A.; Borzi, B.; da Porto, F.; Lagomarsino, S.; Magenes, G.; Moroni, C.; Penna, A.; Polese, M.; Speranza, E.; et al. Seismic risk assessment of residential buildings in Italy. Bull. Earthq. Eng. 2021, 19, 2999–3032. [Google Scholar] [CrossRef]
- Matesanz Parellada, A.; Buxen, O.N.; Peña Cerezo, N.; Gato, A.S.; Turienzo López, E.; Zorita Castresana, S.; Pedone, L.; Rosca, C.; Giovinazzi, S.; Morici, M.; et al. D6.2 Deliverable of H2020 ARCH Project, GA no. 820999, “Assessment of long-term implementation options”. Available online: https://savingculturalheritage.eu/re-sources/deliverables#c1114 (accessed on 5 December 2022).
- Pedone, L.; Bianchi, S.; Giovinazzi, S.; Pampanin, S. A Framework and Tool for Knowledge-Based Seismic Risk Assessment of School Buildings: SLaMA-School. Sustainability 2022, 14, 9982. [Google Scholar] [CrossRef]
- Jacques, C.C.; McIntosh, J.; Giovinazzi, S.; Kirsch, T.D.; Wilson, T.; Mitrani-Reiser, J. Resilience of the Canterbury Hospital System to the 2011 Christchurch Earthquake. Earthq. Spectra 2014, 30, 533–554. [Google Scholar] [CrossRef]
- Giovinazzi, S.; Pollino, M.; Kongar, I.; Rossetto, T.; Caiaffa, E.; Pietro, A.D.; Porta, L.L.; Rosato, V.; Tofani, A. Towards a Decision Support Tool for Assessing, Managing and Mitigating Seismic Risk of Electric Power Networks. In Computational Science and Its Applications—ICCSA 2017; Lecture Notes in Computer Science; Springer Verlag: Cham, Switzerland, 2017; Volume 10406, pp. 389–414. [Google Scholar] [CrossRef]


Disclaimer/Publisher’s Note: The statements, opinions and data contained in all publications are solely those of the individual author(s) and contributor(s) and not of MDPI and/or the editor(s). MDPI and/or the editor(s) disclaim responsibility for any injury to people or property resulting from any ideas, methods, instructions or products referred to in the content. |
© 2023 by the authors. Licensee MDPI, Basel, Switzerland. This article is an open access article distributed under the terms and conditions of the Creative Commons Attribution (CC BY) license (https://creativecommons.org/licenses/by/4.0/).