Review

Self-Supervised Representation Learning for Geographical Data—A Systematic Literature Review

School of Computer Science & Informatics, Cardiff University, Cardiff CF24 4AG, UK
*
Author to whom correspondence should be addressed.
ISPRS Int. J. Geo-Inf. 2023, 12(2), 64; https://doi.org/10.3390/ijgi12020064
Submission received: 30 December 2022 / Revised: 7 February 2023 / Accepted: 10 February 2023 / Published: 12 February 2023

Abstract

:
Self-supervised representation learning (SSRL) concerns the problem of learning a useful data representation without the requirement for labelled or annotated data. This representation can, in turn, be used to support solutions to downstream machine learning problems. SSRL has been demonstrated to be a useful tool in the field of geographical information science (GIS). In this article, we systematically review the existing research literature in this space to answer the following five research questions. What types of representations were learnt? What SSRL models were used? What downstream problems were the representations used to solve? What machine learning models were used to solve these problems? Finally, does using a learnt representation improve the overall performance?

1. Introduction

Machine learning may be defined as the use of methods that can automatically detect patterns in data, and in turn use these patterns to predict future data, or to perform other kinds of decision making under uncertainty [1]. Deep learning is a type of machine learning which involves the use of artificial neural networks with many layers [2]. Deep learning has proven to be useful for solving problems in the fields of natural language processing (NLP) and computer vision, where it significantly outperforms traditional statistical machine learning models such as the support vector machine (SVM) and random forest. More recently, the success of deep learning translated to many other fields. This includes the field of geographical information science (GIS), where it has been successfully applied to a large array of problems. For example, Derrow-Pinion et al. [3] describe how Google Maps uses deep learning to predict travel times. Zhang et al. [4] describe how deep learning can also be used to perform land-use and land-cover classification.
Supervised learning is an approach for training machine learning models using labelled or annotated data [1]. In most cases, the labels are created by manual annotation. Statistical machine learning models can be successfully trained using supervised learning with relatively small amounts of labelled data. On the other hand, to successfully train deep learning models using supervised learning, it is generally necessary to use large amounts of labelled data. However, in some cases, obtaining large amounts of labelled data represents a significant challenge [5], which limits the applicability of deep learning models. In the context of problems within the GIS domain, this challenge stems from many reasons, including user privacy concerns related to sharing data, the cost of labelling data, and the lack of physical access to some geographical locations. For example, it is challenging to obtain labelled data necessary to train models for location or point-of-interest (POI) recommendation [6]. This is known as the cold start problem and occurs when some POIs and users have no known previous visits or check-ins [7]. It is also challenging to obtain labelled data necessary to train models for predicting spatiotemporal phenomena such as air quality [8].
Many solutions to this challenge have been proposed, including transfer learning, semi-supervised learning, and active learning. However, one of the most promising solutions, which has gained a lot of recent attention in the domains of computer vision and NLP, is self-supervised representation learning (SSRL) [9]. An SSRL model aims to learn a useful data representation where semantically similar inputs have similar representations, which in turn simplifies the problem of supervised learning from such representations. Consequently, subsequent or downstream supervised deep learning models can be successfully trained using less-labelled data. SSRL models pose the problem of learning a data representation as a supervised learning problem where the labels in question are derived from unlabelled data in an automated manner. For example, this can be done by masking or hiding parts of the unlabelled data and defining these parts as labels. The most famous examples of SSRL models are word embeddings in the field of NLP, such as word2vec [10] and BERT [11], which learn representations of individual words. These learnt representations capture the semantics of words and as such are commonly used to solve many downstream NLP problems, such as sentiment analysis and question answering.
More recently, many researchers have started to consider the application of SSRL to geographical data. For example, Jeawak et al. [12] proposed a method for learning representations of the environmental characteristics of geographical regions. The authors subsequently showed that these representations could successfully be used to solve many downstream problems including predicting species distribution and climate features. Note that many authors in the GIS domain use the term representation learning when referring to SSRL.
Despite being a relatively new paradigm, SSRL has been demonstrated by many authors to help solve machine learning problems in the field of GIS. Therefore, in this article, we systematically review the scientific literature in this space. The aim of this review is threefold. Firstly, to summarise the existing articles. Secondly, to identify gaps in current research and identify future research directions. Finally, to provide readers with a framework for positioning new research.
The remainder of this article is structured as follows. In Section 2, we review necessary background material relating to SSRL. In this section, we also summarise existing literature reviews of SSRL and discuss the contribution of our literature review. In Section 3, we describe the methodology used to perform the literature review, which includes the identification of the research questions this article aims to answer. Subsequently, in Section 4 we answer these research questions. Finally, in Section 5 we summarise the findings of this literature review and draw pertinent conclusions.

2. Background

In this section, we review background material relating to SSRL that will be used to frame the present review. The aim of this article is not to provide an introduction to the topic of SSRL. Therefore, we do not provide a detailed description of the background material in question. A broader introduction to the topic of SSRL can already be found in [9].
As discussed in the introduction, an SSRL model aims to learn a useful representation of the data using labelled data that are derived automatically from unlabelled data. The labels in question are commonly referred to as pseudo-labels. SSRL can be considered a special form of unsupervised learning. However, SSRL models are distinct from traditional unsupervised learning models, such as clustering, because SSRL models formulate the learning problem as a supervised learning problem using pseudo-labels. To help relate and contrast different SSRL models, it is useful to define a taxonomy or classification scheme for these models. In many cases, the boundaries between different types of models are not clearly defined and this has resulted in different authors defining the boundaries differently. Furthermore, as the research field of SSRL developed, different taxonomies have been proposed to reflect the development of new and improved models. In this article, we adopt the taxonomy proposed by Deldari et al. [13], which is illustrated in Figure 1. In this taxonomy, models are grouped with respect to the loss or objective function that learning attempts to optimise (e.g., cross-entropy and triplet loss). It is a useful taxonomy in the context of this review because it was designed to be general and not specific to a particular type of data such as image or text data.
The taxonomy divides SSLR models into two main groups of generative and discriminative models. Generative models attempt to learn a useful data representation by learning to generate new data elements that have similar characteristics to the original data elements. An example of a generative model is a variational autoencoder. On the other hand, discriminative models attempt to learn a useful data representation by learning to discriminate between different elements of the original data. The taxonomy subdivides this group of discriminative models into the four subgroups of pretext, contrastive, clustering, and non-contrastive models. Note that Deldari et al. [13] refers to non-contrastive models as regularisation models. We adopt the former term because it is more frequently used in the literature when referring to this subgroup [14]. One may wonder why the taxonomy for generative models is not as fine-grained as the taxonomy for discriminate models. This is a consequence of the fact that the latter group of models have been shown to empirically outperform the latter [15]. Hence, most research articles consider the problem of developing new discriminative models.
We now define each of the four discriminative model subgroups in turn. Pretext models attempt to learn a useful data representation by learning to predict the pseudo-labels. This prediction problem is commonly referred to as a pretext task. In many cases, these models use a traditional supervised learning model and an objective such as cross-entropy. A commonly used pretext task involves masking or hiding a subset of the data and using a supervised learning model to learn to predict this subset [11]. Contrastive models attempt to learn a useful data representation such that data elements with similar pseudo-labels are close in this representation whereas data elements with dissimilar pseudo-labels are far apart in this representation. An example of an objective function used by contrastive models is the triplet loss [16]. The popular SSRL model word2vec is commonly trained using a contrastive objective function known as noise contrastive estimation [10].
Clustering models attempt to learn a useful data representation such that data elements with similar pseudo-labels are clustered together in this representation. Clustering models can be considered a generalisation of contrastive models where the generalisation in question is from data points to data clusters. Examples of clustering models are DeepCluster [17] and SwAV [18].
Non-contrastive models attempt to learn a useful data representation such that data elements with similar pseudo-labels are close in this representation. Non-contrastive models are distinct from contrastive models in the sense that they do not require one to explicitly specify pairs of data elements with dissimilar pseudo-labels. Specifying such pairs is one of the greatest challenges to implementing contrastive models, and this was the motivation for the development of non-contrastive models [19]. Examples of non-contrastive models are BYOL [19] and Barlow twins [20].
To date, several SSRL review articles have been published. For example, Jing and Tian [21] and Liu et al. [22] review the applications of SSRL to computer vision and graph data, respectively. To the authors’ knowledge, there currently exists no review that considers the application of SSRL to geographical data. Mai et al. [23] present a review that considers different representations for geographical data that can be used in downstream machine learning models. However, this article does not consider the topic of SSRL per se. Wang and Biljecki [24] review the application of unsupervised learning to urban systems but only mention SSRL in passing. Wang et al. [25] review the application of SSRL to remotely sensed data, which is only one type of geographical data. As discussed later in this article, to limit the scope of our review and minimise overlap with [25], we excluded articles that considered remotely sensed data.
Finally, it is important to note that SSRL is a relatively new and emerging research field. As a consequence, many of the state-of-the-art models discussed above have only been applied to a limited set of data types with image and text data being the most common types. Generalising these models so that they can be applied to different types of data, such as geographical data, is non-trivial. Furthermore, even if these models could be generalised in such a way, it is unclear if the representations learnt would be useful.

3. Methodology

As discussed in the introduction to this article, we aim to perform a systematic literature review of existing articles that consider the application of SSRL to geographical data. The methodology used to perform this task is based on the recommended best practice described by Kitchenham [26], which has previously been used in many other studies [27]. It consists of the following seven steps:
  • Formulate the research questions in order to describe the overall aims of the review.
  • Design an efficient and reproducible search strategy to retrieve all relevant studies with respect to the research questions.
  • Specify inclusion and exclusion criteria to control the review’s scope.
  • Assess the quality of the included studies to ensure their scientific validity as well as the validity of the systematic review findings.
  • Extract data from the included studies to gather specific evidence relevant to the research questions.
  • Perform narrative synthesis of findings from the extracted data in order to answer the research questions.

3.1. Research Questions

The purpose of this systematic literature review is to answer the following research questions regarding the application of SSRL to geographical data.
RQ1:
What types of representations were learnt?
RQ2:
What SSRL models were used?
RQ3:
What downstream problems were the learnt representations used to solve?
RQ4:
What machine learning models were used to solve the downstream problems?
RQ5:
Did using a learnt representation improve performance relative to applying a machine learning model to the raw data or another representation not obtained using SSRL?

3.2. Search Strategy

The purpose of defining a search strategy is to identify the vast majority of relevant articles systematically. In our search strategy, we used the Web of Science document search facility. It indexes all major conferences and journals in the field of GIS and therefore we were confident that it would allow us to identify the vast majority of relevant articles. The Web of Science search facility requires that searches be specified in the form of a search query containing many fields. The fields in question include the article title and topic. The search query needed to be carefully designed to ensure that the set of articles returned had both high precision and high recall. Following an iterative specification and evaluation process, we defined the following search query:
  • (geographic OR geographical OR geo OR GIS OR location OR place OR spatiotemporal OR spatial OR road or street OR address OR GPS OR route OR trajectory OR POI OR points of interest) (Title) and (encoding OR embedding OR representation OR vectorization OR metric learning OR self-supervised) (Title) and learning (Topic)
We restricted the search to articles published in the year 2013 and afterwards. The cutoff year was based on the publication date of the word2vec method for representation learning in NLP [10]. This method was one of the first to demonstrate the usefulness of SSRL and the current wave of interest in the topic can be at least partly attributed to it. We found that many authors mentioned that the success of word2vec was one of their main motivations for considering SSRL. Furthermore, many methods are named after word2vec, such as gps2vec [28] and poi2vec [29]. The search query executed on 23 August 2022 retrieved a total of 375 articles.

3.3. Selection Criteria

To filter the articles returned by the search strategy and to ensure only those articles that provide direct evidence to answer the research questions were included, we defined inclusion and exclusion criteria. These criteria are presented in Table 1 and Table 2, respectively. Remotely sensed data represents an important type of geographical data. Due to the large overlap between the domain of remote sensing and the domains of image processing and computer vision, there exists a large number of studies that consider the application of SSRL to remotely sensed data [30,31]. A recent review of such studies can be found in [25]. Therefore, to limit the scope of our review and minimise overlap with [25], we excluded articles that considered remotely sensed data. This was implemented using the exclusion criterion EX6 in Table 2. We also excluded methods other than SSRL, such as manual feature engineering, that were used to determine the representations in question. This was implemented using the exclusion criterion EX7 in Table 2.
The retrieved articles were independently evaluated by two annotators with respect to the inclusion and exclusion criteria. An inter-annotator agreement of 89% was calculated using the Cohen kappa coefficient [32]. Disagreements were resolved by discussion between the annotators and a more detailed analysis of the articles in question. Subsequently, three articles were excluded from further analysis because full versions of the articles in question could not be obtained. A further seven articles were excluded because even though they referred to the use of “representation learning” in their corresponding title or abstract, these articles did not use SSRL to learn the representations in question. The representations were instead learnt in an end-to-end manner using the downstream problems. Following this, a total of 108 articles were retained for further processing. A complete list of these articles is presented in the Supplementary Material.

4. Analysis

In this section, we present answers to each of the five research questions described in Section 3.1.

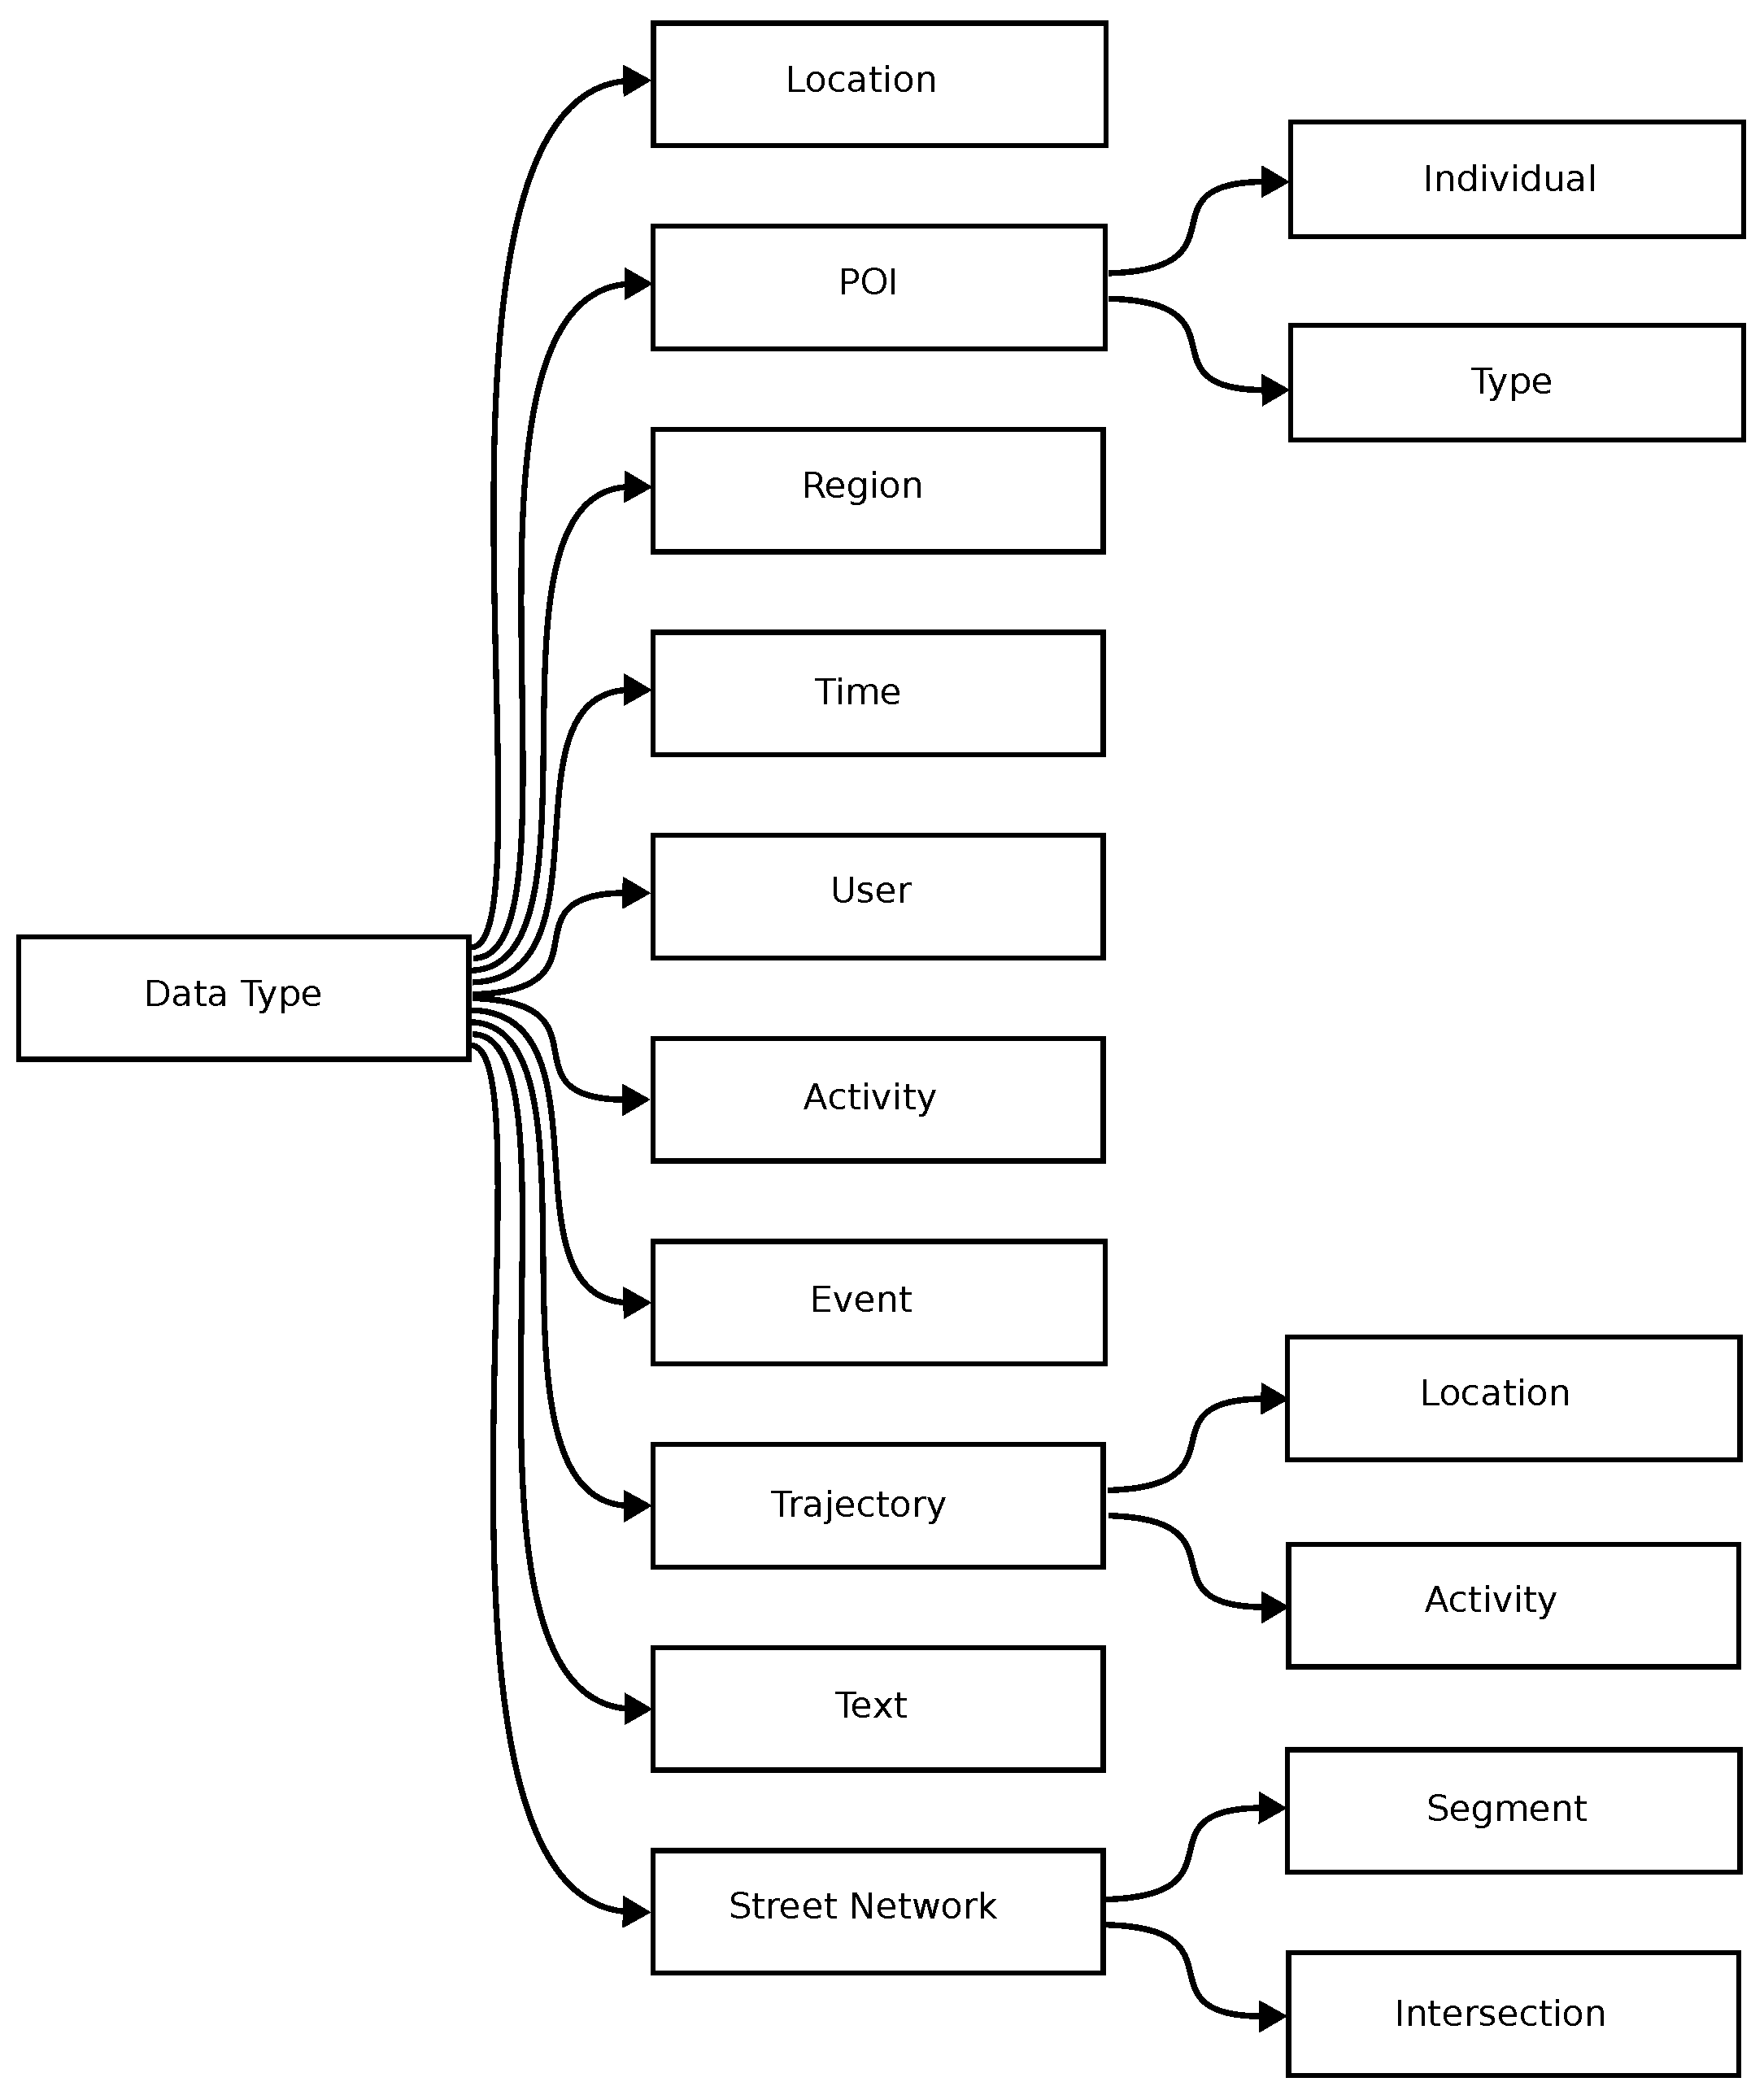
4.1. What Types of Representations Were Learnt?

A large proportion of all data has a geographical or spatial element. In fact, some authors argue that this proportion is 80% or more [33]. To help structure the types of representations learnt, we designed a taxonomy of the geographical data types most commonly considered in the works reviewed in this study. This is displayed in Figure 2. Other authors have previously proposed taxonomies of geographical data types. However, we found that these mostly contained classical geographical data types and did not capture many of the data types encountered in our study. For example, the taxonomy proposed by Scheider et al. [34] does not contain the data types of user or text. These specific data types were frequently encountered in our study.
A location is a geographical location represented by a latitude and longitude pair. Location data is commonly obtained using a GPS receiver. A POI is a location with additional data attached that describes the type or category of an object at that location. Examples of POIs include pubs, shops, and gyms. SSRL can be used to learn specific representations for each individual POI or learn general representations of each POI type. For example, one could learn a representation of a particular pub (e.g., Pen & Wig pub located at 1 Park Grove, Cardiff, CF10 3BJ) or learn a more general representation of a pub as a class of objects (e.g., a kind of drinking establishment that is licensed to serve alcoholic drinks for consumption on the premises). A region is a geographical object that has an area greater than zero and examples include postal codes, cities, and countries. Note that a region may contain many locations and/or POIs. The above definitions of location, POI and region are motivated by the definitions of location, POI, and place, respectively, proposed by the World Wide Web Consortium (W3C) (https://www.w3.org/2010/POI/wiki/Main_Page (accessed on 29 December 2022)).
A user is a person who uses something, such as a place, facility, product, or service, e.g., a user of a location-based social network (LBSN). An activity is an action performed by one or more users. An example is a user performing a POI check-in operation in a LBSN or posting on a social media platform such as Twitter. An event is something that happens or takes place, especially something of importance. Examples of events include a party, a traffic accident, or a weather event such as a storm. An activity is distinct from an event in the sense that the former is user centric while the latter is not.
An example of text is a social media post on Twitter or a postal address. Street segments and street intersections are two types of street network elements. A trajectory corresponds to a sequence of elements where the elements in question may be locations or activities. An example is a sequence of POI check-in operations in a LBSN performed by a given user. Note that there exist a lot of inconsistencies in the literature with respect to the names and definitions of the above geographical data types. For example, some authors will define a place to coincide with our definitions of a location or a POI. To ensure consistency, within this article we always use the terms and definitions described above.
In the remainder of this section, we state the number of articles that considered the problem of learning representations of each geographical data type covered by the taxonomy in Figure 2. We illustrate each data type using examples from the corresponding articles. A complete list of articles and descriptions can be found in the Supplementary Material. A few articles considered learning representations of a unique and less general data type that does not correspond to any element in the taxonomy. We review these articles at the end of this section. Several articles considered learning representations where the data type in question corresponds to more than one element in the taxonomy. For example, in [35] individual POIs are modelled using a tuple of an individual POI plus a user. Consequently, personalised individual POI representations were learnt. We highlight these articles throughout this section. Finally, several articles considered learning more than one data type representation. For example, Yang et al. [36] proposed learning representations of both users and individual POIs in an LBSN. We will review these articles and some aspects of the learning process later in Section 4.2.

4.1.1. Location Representations

A total of 11 articles considered the problem of learning location representations. In [37], the locations correspond to those of buses travelling across a street network. In [38,39], the locations correspond to that of telecommunication base stations that mobile devices connect to. In [40], the locations correspond to that of WiFi hotspots that mobile devices connect to.

4.1.2. Individual POI Representations

A total of 31 articles considered the problem of learning representations of individual POIs. In many cases, the POIs correspond to those represented in two LBSNs, Foursquare, and Gowalla. Examples include [7,41]. In [36] the POIs correspond to businesses reviewed on the crowdsourcing platform Yelp.
In some cases, individual POIs are modelled as a tuple of multiple features. In [35], individual POIs are modelled as a tuple of an individual POI plus a user. Consequently, personalised individual POI representations were learnt. In [42], individual POIs are modelled as a tuple of an individual POI plus a time. Consequently, temporal individual POI representations were learnt.

4.1.3. POI-Type Representations

A total of nine articles considered the problem of learning representations of POI types. In [41], the POIs correspond to those represented in the LBSNs Foursquare and Gowalla. In [43,44], the POIs correspond to the types of businesses (e.g., restaurants, beauty salons, dental practices, etc.) reviewed on Yelp. In [45], the POIs correspond to those represented in a POI dataset (e.g., dental surgery) from the Ordnance Survey, which is the national mapping agency for the UK.

4.1.4. Region Representations

A total of 18 articles considered the problem of learning representations of regions. In [12], the regions correspond to grid cells of size 10 km × 10 km. Note that, in this article, a region is modelled as a tuple of a cell plus a time. Hence, a spatiotemporal representation was learnt. In other articles, the regions correspond to less regular shapes than rectangular cells. In [46], the regions correspond to cities. In [47], the regions correspond to neighborhood statistical areas defined by the USA government.

4.1.5. Time Representations

A total of seven articles considered the problem of learning representations of time. All of them divided time into time windows and learnt their representations. For example, in [12] the time windows correspond to months of the year. Similarly, in [42,48] the time windows correspond to days of the week.

4.1.6. User Representations

A total of 27 articles considered the problem of learning representations of users. In [36,49], the users correspond to users in a LBSN. In [50,51], the users correspond to users of the social media platform Twitter. In [52], the users correspond to customers that have products delivered to their homes.

4.1.7. Activity Representations

A total of 10 articles considered the problem of learning representations of activities. In [6,53], the activities correspond to LBSN POI checkins. In many cases, activities are modelled as tuples of multiple features. For example, in [6] a check in combines an individual POI, the region containing this POI, the user who performed the check in, and the time the check in happened into a tuple. In [54,55] the activities correspond to posting on the social media platform Twitter. In both of these articles, the activities are modelled as a tuple of the text, time, and location of the post.

4.1.8. Event Representations

A total of four articles considered the problem of learning representations of events. In [56], representations of traffic accidents were learnt. In [47], representations of crime types were learnt. In [57], representations of event types were learnt. In this article, an event is modelled as a location and time tuple.

4.1.9. Location Trajectory Representations

A total of 15 articles considered the problem of learning representations of location trajectories. In [58,59], the trajectories correspond to GPS trajectories. In [39,60], the trajectories correspond to trajectories of telecommunication base station locations that mobile devices connect to.

4.1.10. Activity Trajectory Representations

A total of seven articles considered the problem of learning representations of activity trajectories. In all articles, the trajectories correspond to trajectories of LBSN POI check ins [61,62].

4.1.11. Text Representations

A total of 12 articles considered the problem of learning representations of texts. In [63,64], the texts correspond to postal addresses. In [62,65], the text corresponds to written descriptions of LBSN POI check ins.

4.1.12. Street Segment & Intersection Representations

A total of six articles considered the problem of learning representations of street network segments. These articles include [58,66].
Only two articles, [66,67], considered the problem of learning representations of street network intersections.

4.1.13. Other Representations

Finally, a total of six articles considered learning representations of a data type that does not correspond to any element in the proposed taxonomy. In [68], representations of houses were learnt. In [69], representations of knowledge graph entities and relations were learnt where these entities and relations model geographical knowledge. In [70], representations of bike-sharing stations were learnt.

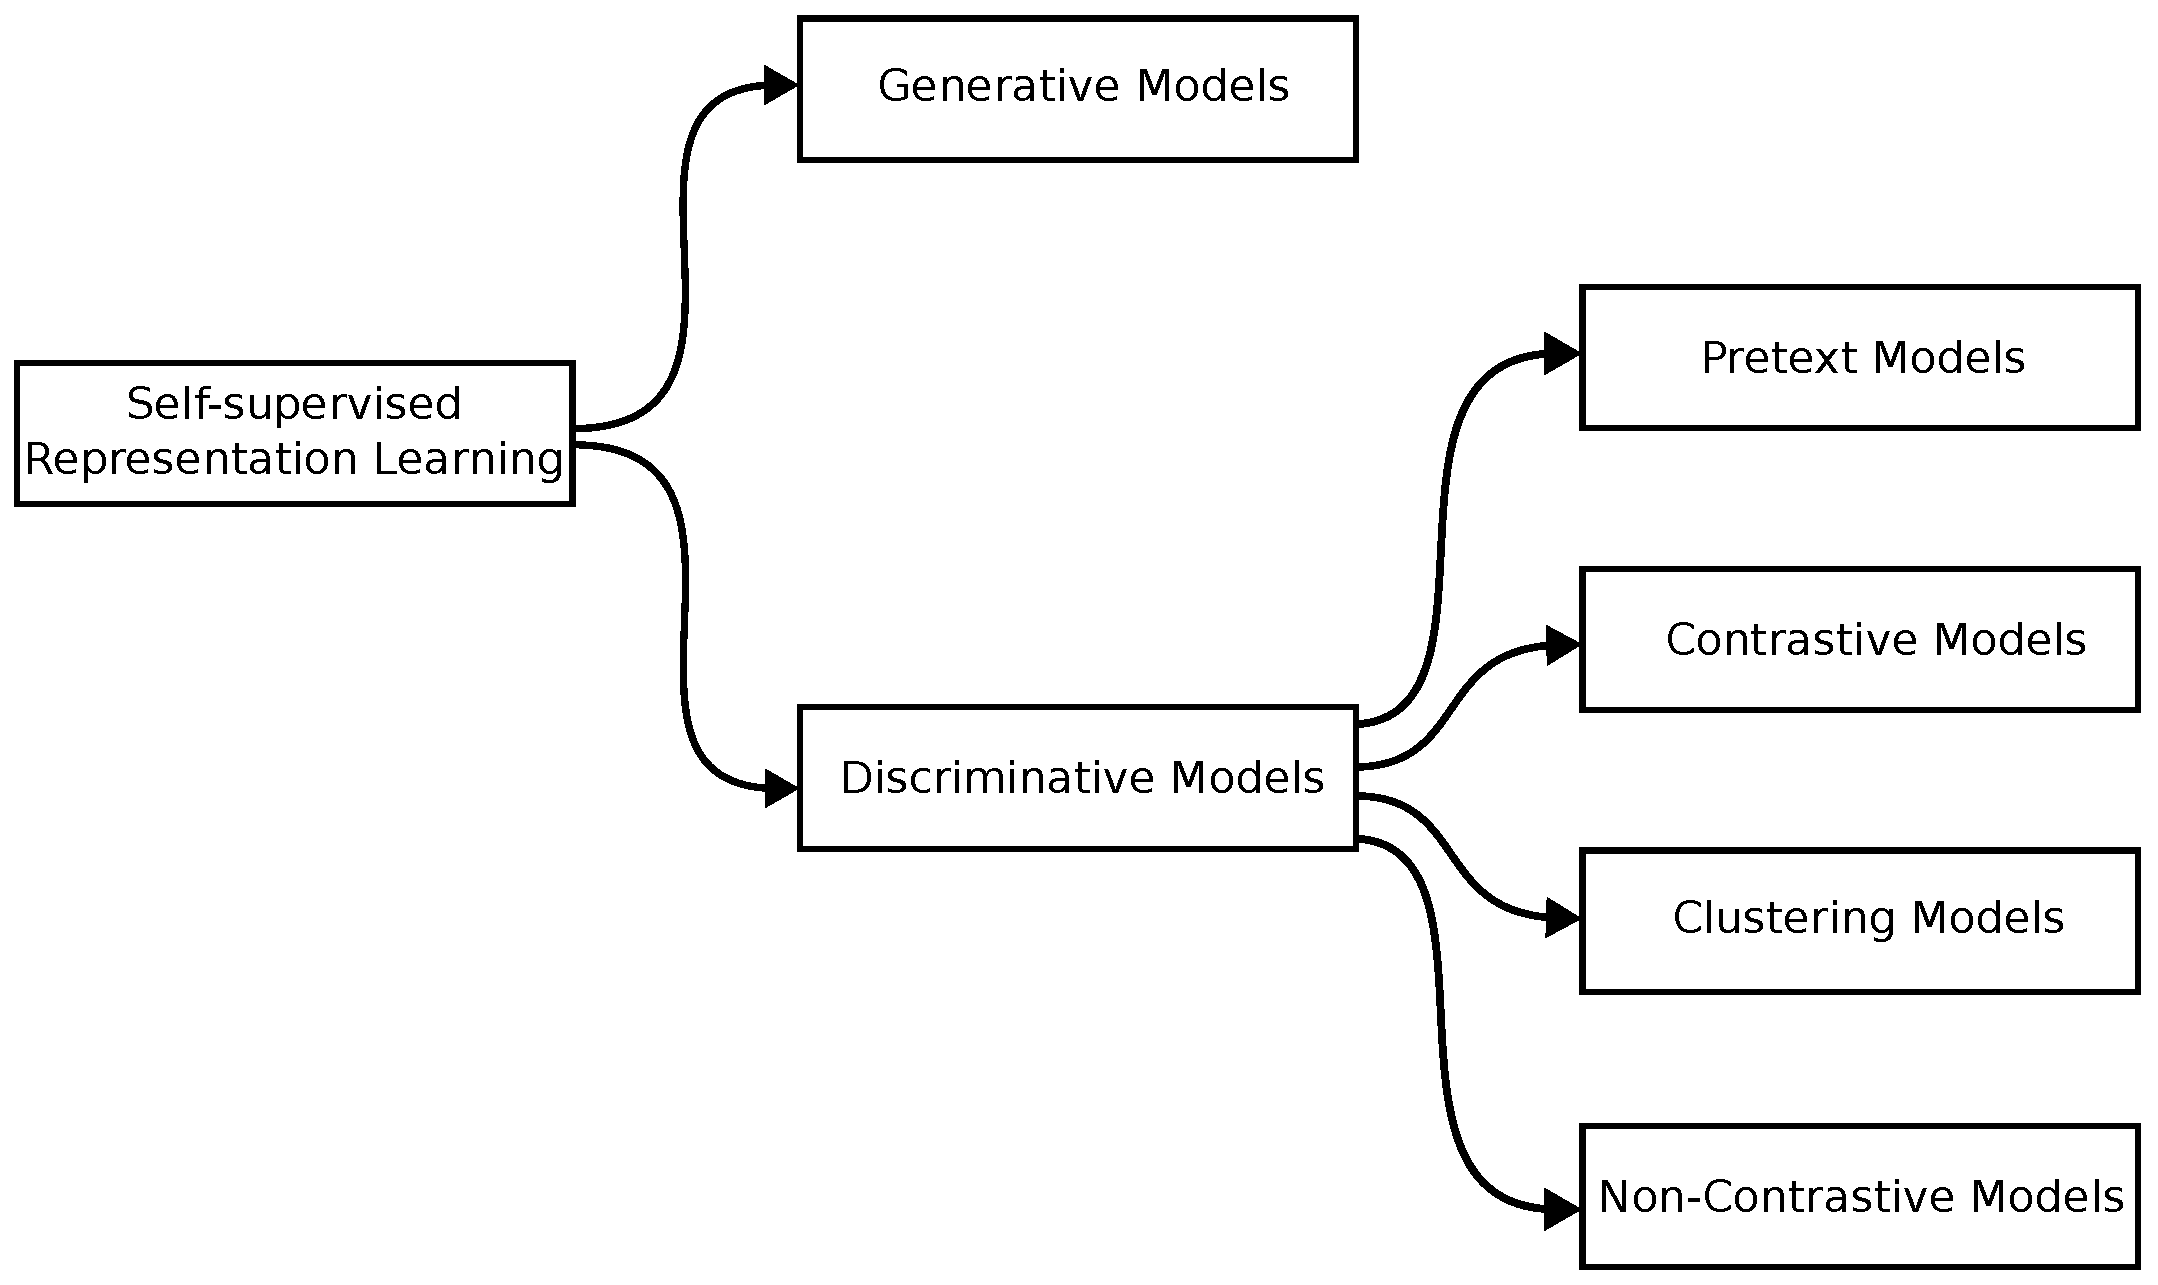
4.2. What SSRL Models Were Used?

We wish to identify the SSRL models used to learn representations of the different geographical data types. As previously discussed, many articles learnt representations of more than one data type. For example, Yang et al. [36] proposed to learn representations of both individual POIs and users in an LBSN. There are two main approaches by which such representation can be learnt. In the first approach, the different representations are learnt independently and sometimes even concurrently. For example, this approach was used in the article by Yang et al. [36] mentioned above. In the second approach, the different representations are learnt hierarchically, where one representation is used to define another recursively. For example, Chen et al. [49] used this approach to learn representations of activities and users. The authors first learnt activity representations and subsequently used these representations to learn user representations. In this case, the process of learning user representations equates to modelling a user as a distribution of their corresponding activity representations.
The remainder of this section is structured as follows. In Section 4.2.1, we identify the SSRL models used to learn representations. Section 4.2.2 and Section 4.2.3 review those articles that learn representations in an independent and a hierarchical manner, respectively.

4.2.1. SSRL Models Used

We defined a taxonomy of SSRL models in Figure 1. For each model in this taxonomy, we identified the articles that used this model to learn representations. Some works used more than one model type, for example, when learning more than one data type representation [36]. In total, 61 articles used a contrastive SSRL model. In total, 19 articles used an autoencoder, which is considered a pretext SSRL model. In total, 32 articles used a pretext SSRL model other than an autoencoder. Only two articles used a generative SSRL model. Finally, four articles used a model based on matrix factorization. For each of these model types, the corresponding list of articles is provided in the Supplementary Material. Interestingly, no articles used clustering or non-contrastive SSRL models. We believe this can be attributed to the fact that these types of models are relatively new inventions.

4.2.2. Learning Representations Independently

In total, 26 articles learnt more than one data type representation in an independent manner. The full list of articles is provided in the supplementary material. Here, we reference a handful of representative examples. The combinations of representations learnt independently include those of individual POIs and users in a LBSN [7,36], individual POIs and POI types [41], knowledge graph entities and relations [69], street network segments and intersections [66], users and regions [46].

4.2.3. Learning Representations Hierarchically

In total, 18 articles learnt more than one data-type representation in a hierarchical manner. The full list of articles is provided in the supplementary material. Here, we reference a handful of representative examples. The combinations of representations learnt hierarchically include those of individual POIs and users [71], street segments and location trajectories [58], individual POIs and bike share stations [70], POI types and regions [45,72], crime types and regions [47].

4.3. What Downstream Problems Were the Learnt Representations Used to Solve?

The articles reviewed used learnt representations in a diverse collection of downstream applications. This can in part be attributed to the fact that GIS is an application-focused research field. Many of these articles used a single data type representation while many others used more than one data type representation. For example, many articles use both LBSN user and individual POI representations for POI recommendation.
A total of 64 articles describe applications that used a single learnt representation of a relevant type. The full list of articles is provided in the Supplementary Material. A total of 44 articles describe applications that used more than one learnt representation. Again, the full list of articles is provided in the Supplementary Material. Given the diverse nature of the applications, the authors felt it was not feasible to develop a concise application taxonomy. Therefore, we grouped the corresponding applications according to the type of representation they used. The following subsections describe some example applications for each type of representation.

4.3.1. Location Representations

The authors [28,38] predict the next location a user will visit. The authors [73] detected financial fraud and performed customer segmentation. The financial fraud in question refers to a customer failing to make required payments.

4.3.2. Individual POI Representations

Refs. [74,75] recommended POIs to users. Refs. [76,77] classified POI types and clustered individual POIs. Finally, ref. [78] focused on POI search auto-completion.

4.3.3. POI Type Representations

Ref. [79] determined urban functional regions. Ref. [43] measured POI type similarity. Finally, ref. [44] analysed different POI type representations within a given city. They also analysed the same POI type representations between different cities.

4.3.4. Region Representations

Ref. [80] predicted house prices. Ref. [8] predicted air quality. Ref. [81] classified land use. Ref. [12] predicted climate features and the distribution of animal species. Ref. [82] predicted the number of second-hand house sales. Finally, ref. [83] predicted the number of POI check-ins.

4.3.5. User Representations

Ref. [84] recommended POIs. Ref. [51] predicted the location of Twitter users. Ref. [85] predicted the duration of a trip. Ref. [86] clustered vehicle drivers. Finally, in [52], the problem of clustering of users, to allow better routing of delivery vehicles, was considered.

4.3.6. Activity Representations

Ref. [6] recommended POIs. Ref. [53] predicted the keywords, location and time of an activity. Finally, ref. [87] predicted properties of an activity, such as its time and location.

4.3.7. Event Representations

Ref. [56] used representations of traffic accidents to predict traffic congestion. Ref. [57] used representations of event type to perform event recommendation. Ref. [54] detected events such as a protest or a disaster. Ref. [88] used representations of weather conditions and bike stations to predict bike sharing station demand.

4.3.8. Location Trajectory Representations

Refs. [59,89] measured location trajectory similarity. Ref. [90] detected trajectory anomalies. Ref. [91] scored driving performances and detected dangerous driving regions. Ref. [92] predicted traffic flow/volume entering and leaving different regions. Ref. [60] predicted the next location in a trajectory. Finally, refs. [59,93] clustered trajectories.

4.3.9. Activity Trajectory Representations

Ref. [94] recommended trajectories. Ref. [95] clustered trajectories. Ref. [96] predicted the next locations visited, and matched trajectories to corresponding users.

4.3.10. Text Representations

Ref. [63] matched addresses (i.e., mapped addresses to locations). Ref. [97] predicted address locations. Ref. [98] disambiguated named entities by assigning similar representations to the same spatial locations or places. Ref. [99] performed a qualitative spatiotemporal analysis of social media posts. Finally, ref. [100] determined the locations of posts on Twitter.

4.3.11. Street Intersection and Segment Representations

Ref. [101] classified street types. Ref. [102] classified street types and speed limits. Ref. [67] measured location trajectory similarity.

4.3.12. Other Representations

Ref. [103] used representations of trajectories of transportation hubs to perform trajectory recommendation.

4.3.13. Multiple Representations

As mentioned previously, a total of 44 articles proposed applications that used more than one learnt representation. The full list of articles is provided in the Supplementary Material. Here we discuss several examples.
A total of 16 articles considered the application of POI recommendation in an LBSN. The majority of these works used representations of individual POIs and users [104,105]. Ref. [106] used representations of individual POIs, users, and user reviews to implement POI recommendation. Ref. [46] used representations of users and regions to recommend travel destinations. This is distinct from POI recommendation because cities instead of POIs are recommended. Refs. [29,107] used representations of individual POIs and users to predict which users will visit which POIs and identify the most influential users.
A total of five articles considered the application of social link prediction or friend recommendation in an LBSN. All of these works used representations of individual POIs and users [108,109].
Ref. [110] used representations of locations, names, addresses, and places to disambiguate place names. Ref. [111] used representations of users and activities to identify functional zones and predict crimes. Ref. [42] used representations of individual POIs, times, and regions to identify thriving communities. Ref. [70] used representations of individual POIs and bike-share stations to predict bike demand for both existing and new bike stations. Ref. [68] used representations of houses and POI types to predict house prices. Ref. [37] used representations of locations and activities to detect anomalous trajectories, classify activities, and classify bus routes. Ref. [112] used representations of locations, location trajectories, and users to identify trajectories generated by the same individual. Finally, ref. [69] used representations of knowledge graph entities and relations to answer logic queries.

4.4. What Machine Learning Models Were Used to Solve the Downstream Problems?

In each of the articles reviewed, machine learning models were applied to one or more learnt representations to solve one or more downstream problems. A large spectrum of models were considered. Therefore, to concisely summarise the corresponding articles reviewed, we developed a taxonomy such that most articles use models that correspond to elements in this taxonomy. The taxonomy in question contains the following eight elements: supervised neural network models (e.g., multilayer perceptron), supervised linear models (e.g., linear regression), traditional supervised models (e.g., support vector machine and random forest), logistic regression, unsupervised clustering models (e.g., k-means), visualisation models (e.g., t-SNE), distance measure in the representation space (e.g., Euclidean distance), and other model types (e.g., a Bayesian graphical model or a collaborative filtering model). To illustrate how a distance measure may be used to solve a downstream problem consider the case where one wishes to perform POI recommendation in an LBSN. If suitable representations of individual POIs and users have been learnt, then POI recommendation for a given user may be performed by determining the POIs whose representations are close to the representation of the user in question [7].
A total of 34 articles used supervised neural network models, 13 used supervised linear models, 12 used traditional supervised models, 3 used logistic regression models, 13 used unsupervised clustering models, 4 used visualisation models, 32 used a distance measure in the representation space, and 7 used other model types. The corresponding articles are listed in the supplementary material.

4.5. Did Using a Learnt Representation Provide Improved Performance?

The articles reviewed universally found that applying machine learning models to learnt representations provided superior performance relative to applying these models directly to the corresponding raw data. Furthermore, several authors found that performing visual analytics using the learnt representations uncovered novel insights [39]. This result is in line with the findings in other research fields such as NLP where the use of learnt representations is universally accepted to provide superior performance. However, it is worth noting that the nature of academic publications to only promote positive results may introduce bias into any such analysis.
In recent years, as the use of learnt representations became common, most articles evaluated their proposed representations against other previously proposed representations [105,113]. In an interesting result, Das et al. [68] found that applying machine learning models to the concatenation of learnt representations with the corresponding raw data gave the best overall performance.

5. Summary and Conclusions

In this section, we present a summary of and draw conclusions from the answers to the five research questions presented in this systematic literature review.
SSRL has been used to learn representations of many geographical data types. Some of the most commonly considered data types are locations, individual POIs, users, and regions. This is partially driven by the public availability of the corresponding datasets. For example, there exist several LBSN datasets from platforms such as Gowalla and Foursquare, that have frequently been used to learn representations of individual POIs and users. We found that a large percentage of articles learnt representations of more than one data type.
The SSRL models most commonly used to learn representations of geographical data types are pretext and contrastive models. We found that no articles used more recent SSRL models, such as clustering and non-contrastive models. However, we expect this to change in the future, as researchers in the field gradually adopt more recent models. As mentioned above, a large percentage of articles learnt representations of more than one data type. We found that these articles learnt the representations in question independently or hierarchically.
Representations of geographical data types learnt using SSRL have been used in a diverse collection of downstream applications or problems. Many of these articles used a single data-type representation while many others used multiple data-type representation. The machine learning models most commonly used to solve these problems include neural networks, linear models, visualisation models, and clustering models. It was found that applying machine learning models to representations learnt using SSRL provided superior performance. This demonstrates that the success of SSRL in the fields of computer vision and NLP does also translate to the field of GIS. This finding should further promote and accelerate the adoption of SSRL methods in the field of GIS. Furthermore, in the future, learned representations in all three fields could be fused to enable more useful and powerful machine learning applications.

Supplementary Materials

The following supporting information can be downloaded at: https://www.mdpi.com/article/10.3390/ijgi12020064/s1. The supplementary material document for this article is stored on figshare—Corcoran, Padraig; Spasić, Irena (2023): Self-Supervised Representation Learning for Geographical Data—A Systematic Literature Review. Supplementary Material. figshare. Journal contribution. https://doi.org/10.6084/m9.figshare.22082159.v2 accessed on 29 December 2022.

Author Contributions

All authors contributed to all aspects of the manuscript. All authors have read and agreed to the published version of the manuscript.

Funding

This research received no external funding.

Data Availability Statement

No new data were created or analysed in this study. Data sharing is not applicable to this article.

Conflicts of Interest

The authors declare no conflict of interest.

Abbreviations

The following abbreviations are used in this manuscript:
NLPNatural language processing
SVMSupport vector machine
GISGeographical information science
POIPoint-of-interest
SSRLSelf-supervised representation learning
LBSNLocation-based social network

References

  1. Murphy, K.P. Machine Learning: A Probabilistic Perspective; MIT Press: Cambridge, MA, USA, 2012. [Google Scholar]
  2. Goodfellow, I.; Bengio, Y.; Courville, A. Deep Learning; MIT Press: Cambridge, MA, USA, 2016. [Google Scholar]
  3. Derrow-Pinion, A.; She, J.; Wong, D.; Lange, O.; Hester, T.; Perez, L.; Nunkesser, M.; Lee, S.; Guo, X.; Wiltshire, B.; et al. ETA prediction with graph neural networks in Google Maps. In Proceedings of the ACM International Conference on Information & Knowledge Management, Online, 1–5 November 2021; pp. 3767–3776. [Google Scholar]
  4. Zhang, C.; Sargent, I.; Pan, X.; Li, H.; Gardiner, A.; Hare, J.; Atkinson, P.M. Joint Deep Learning for land cover and land use classification. Remote Sens. Environ. 2019, 221, 173–187. [Google Scholar] [CrossRef]
  5. Spasic, I.; Nenadic, G. Clinical text data in machine learning: Systematic review. JMIR Med. Inform. 2020, 8, e17984. [Google Scholar] [CrossRef]
  6. Qian, T.; Liu, B.; Nguyen, Q.V.H.; Yin, H. Spatiotemporal representation learning for translation-based POI recommendation. ACM Trans. Inf. Syst. 2019, 37, 1–24. [Google Scholar] [CrossRef]
  7. Qiao, Y.; Luo, X.; Li, C.; Tian, H.; Ma, J. Heterogeneous graph-based joint representation learning for users and POIs in location-based social network. Inf. Process. Manag. 2020, 57, 102151. [Google Scholar] [CrossRef]
  8. Lin, Y.; Chiang, Y.Y.; Franklin, M.; Eckel, S.P.; Ambite, J.L. Building autocorrelation-aware representations for fine-scale spatiotemporal prediction. In Proceedings of the IEEE International Conference on Data Mining, Sorrento, Italy, 17–20 November 2020; pp. 352–361. [Google Scholar]
  9. Ericsson, L.; Gouk, H.; Loy, C.C.; Hospedales, T.M. Self-Supervised Representation Learning: Introduction, advances, and challenges. IEEE Signal Process. Mag. 2022, 39, 42–62. [Google Scholar] [CrossRef]
  10. Mikolov, T.; Sutskever, I.; Chen, K.; Corrado, G.S.; Dean, J. Distributed representations of words and phrases and their compositionality. Adv. Neural Inf. Process. Syst. 2013, 26. [Google Scholar]
  11. Devlin, J.; Chang, M.W.; Lee, K.; Toutanova, K. BERT: Pre-training of Deep Bidirectional Transformers for Language Understanding. In Proceedings of the Conference of the North American Chapter of the Association for Computational Linguistics: Human Language Technologies, Minneapolis, MN, USA, 2–7 June 2019; Association for Computational Linguistics. pp. 4171–4186. [Google Scholar]
  12. Jeawak, S.S.; Jones, C.B.; Schockaert, S. Predicting environmental features by learning spatiotemporal embeddings from social media. Ecol. Inform. 2020, 55, 101031. [Google Scholar] [CrossRef]
  13. Deldari, S.; Xue, H.; Saeed, A.; He, J.; Smith, D.V.; Salim, F.D. Beyond Just Vision: A Review on Self-Supervised Representation Learning on Multimodal and Temporal Data. arXiv 2022, arXiv:2206.02353. [Google Scholar]
  14. Tian, Y.; Chen, X.; Ganguli, S. Understanding self-supervised learning dynamics without contrastive pairs. In Proceedings of the International Conference on Machine Learning, PMLR, Virtual, 18–24 July 2021; pp. 10268–10278. [Google Scholar]
  15. Liu, X.; Zhang, F.; Hou, Z.; Mian, L.; Wang, Z.; Zhang, J.; Tang, J. Self-supervised learning: Generative or contrastive. IEEE Trans. Knowl. Data Eng. 2021, 35, 857–876. [Google Scholar] [CrossRef]
  16. Schroff, F.; Kalenichenko, D.; Philbin, J. Facenet: A unified embedding for face recognition and clustering. In Proceedings of the IEEE Conference on Computer Vision and Pattern Recognition, Boston, MA, USA, 7–12 June 2015; pp. 815–823. [Google Scholar]
  17. Caron, M.; Bojanowski, P.; Joulin, A.; Douze, M. Deep clustering for unsupervised learning of visual features. In Proceedings of the European Conference on Computer Vision, Munich, Germany, 8–14 September 2018; pp. 132–149. [Google Scholar]
  18. Caron, M.; Misra, I.; Mairal, J.; Goyal, P.; Bojanowski, P.; Joulin, A. Unsupervised learning of visual features by contrasting cluster assignments. Adv. Neural Inf. Process. Syst. 2020, 33, 9912–9924. [Google Scholar]
  19. Grill, J.B.; Strub, F.; Altché, F.; Tallec, C.; Richemond, P.; Buchatskaya, E.; Doersch, C.; Avila Pires, B.; Guo, Z.; Gheshlaghi Azar, M.; et al. Bootstrap your own latent-a new approach to self-supervised learning. Adv. Neural Inf. Process. Syst. 2020, 33, 21271–21284. [Google Scholar]
  20. Zbontar, J.; Jing, L.; Misra, I.; LeCun, Y.; Deny, S. Barlow twins: Self-supervised learning via redundancy reduction. In Proceedings of the International Conference on Machine Learning, Virtual, 18–24 July 2021; pp. 12310–12320. [Google Scholar]
  21. Jing, L.; Tian, Y. Self-supervised visual feature learning with deep neural networks: A survey. IEEE Trans. Pattern Anal. Mach. Intell. 2020, 43, 4037–4058. [Google Scholar] [CrossRef] [PubMed]
  22. Liu, Y.; Jin, M.; Pan, S.; Zhou, C.; Zheng, Y.; Xia, F.; Yu, P. Graph self-supervised learning: A survey. IEEE Trans. Knowl. Data Eng. 2023. [Google Scholar] [CrossRef]
  23. Mai, G.; Janowicz, K.; Hu, Y.; Gao, S.; Yan, B.; Zhu, R.; Cai, L.; Lao, N. A review of location encoding for GeoAI: Methods and applications. Int. J. Geogr. Inf. Sci. 2022, 36, 639–673. [Google Scholar] [CrossRef]
  24. Wang, J.; Biljecki, F. Unsupervised machine learning in urban studies: A systematic review of applications. Cities 2022, 129, 103925. [Google Scholar] [CrossRef]
  25. Wang, Y.; Albrecht, C.M.; Braham, N.A.A.; Mou, L.; Zhu, X.X. Self-supervised Learning in Remote Sensing: A Review. IEEE Geosci. Remote. Sens. Mag. 2023; in press. [Google Scholar]
  26. Kitchenham, B. Guidelines for Performing Systematic Literature Reviews in Software Engineering; Technical Report EBSE-2007-01; Keele University: Keele, UK; University of Durham: Durham, UK, 2007. [Google Scholar]
  27. Zunic, A.; Corcoran, P.; Spasic, I. Sentiment analysis in health and well-being: Systematic review. JMIR Med. Inform. 2020, 8, e16023. [Google Scholar] [CrossRef]
  28. Yin, Y.; Zhang, Y.; Liu, Z.; Wang, S.; Shah, R.R.; Zimmermann, R. GPS2Vec: Pre-trained Semantic Embeddings for Worldwide GPS Coordinates. IEEE Trans. Multimed. 2021, 24, 890–903. [Google Scholar] [CrossRef]
  29. Feng, S.; Cong, G.; An, B.; Chee, Y.M. Poi2vec: Geographical latent representation for predicting future visitors. In Proceedings of the AAAI Conference on Artificial Intelligence, San Francisco, CA, USA, 4–9 February 2017. [Google Scholar]
  30. Lu, X.; Zheng, X.; Yuan, Y. Remote sensing scene classification by unsupervised representation learning. IEEE Trans. Geosci. Remote Sens. 2017, 55, 5148–5157. [Google Scholar] [CrossRef]
  31. Li, W.; Chen, K.; Chen, H.; Shi, Z. Geographical Knowledge-Driven Representation Learning for Remote Sensing Images. IEEE Trans. Geosci. Remote Sens. 2021, 60, 5405516. [Google Scholar] [CrossRef]
  32. Cohen, J. A coefficient of agreement for nominal scales. Educ. Psychol. Meas. 1960, 20, 37–46. [Google Scholar] [CrossRef]
  33. Hahmann, S.; Burghardt, D.; Weber, B. “80% of All Information is Geospatially Referenced”??? Towards a Research Framework: Using the Semantic Web for (In) Validating this Famous Geo Assertion. In Proceedings of the 14th AGILE Conference on Geographic Information Science, Utrecht, The Netherlands, 18–21 April 2011. [Google Scholar]
  34. Scheider, S.; Meerlo, R.; Kasalica, V.; Lamprecht, A.L. Ontology of core concept data types for answering geo-analytical questions. J. Spat. Inf. Sci. 2020, 20, 167–201. [Google Scholar] [CrossRef]
  35. Kim, J.Y.; Lim, K.H.; Cho, S.B. Personalized POI embedding for successive POI recommendation with large-scale smart card data. In Proceedings of the IEEE International Conference on Big Data, Los Angeles, CA, USA, 9–12 December 2019; pp. 3583–3589. [Google Scholar]
  36. Yang, K.; Zhu, J.; Guo, X. POI neural-rec model via graph embedding representation. Tsinghua Sci. Technol. 2020, 26, 208–218. [Google Scholar] [CrossRef]
  37. Cruz, M.; Barbosa, L. Learning GPS Point Representations to Detect Anomalous Bus Trajectories. IEEE Access 2020, 8, 229006–229017. [Google Scholar] [CrossRef]
  38. Wan, H.; Li, F.; Guo, S.; Cao, Z.; Lin, Y. Learning time-aware distributed representations of locations from spatio-temporal trajectories. In Proceedings of the International Conference on Database Systems for Advanced Applications, Chiang Mai, Thailand, 22–25 April 2019; pp. 268–272. [Google Scholar]
  39. Crivellari, A.; Beinat, E. From motion activity to geo-embeddings: Generating and exploring vector representations of locations, traces and visitors through large-scale mobility data. ISPRS Int. J. Geo-Inf. 2019, 8, 134. [Google Scholar] [CrossRef]
  40. Sassi, A.; Brahimi, M.; Bechkit, W.; Bachir, A. Location embedding and deep convolutional neural networks for next location prediction. In Proceedings of the LCN Symposium on Emerging Topics in Networking, Osnabrück, Germany, 14–17 October 2019; pp. 149–157. [Google Scholar]
  41. Li, Y.; Chen, H.; Wang, L.; Xiao, Q. POI representation learning by a hybrid model. In Proceedings of the IEEE International Conference on Mobile Data Management, Hong Kong, 10–13 June 2019; pp. 485–490. [Google Scholar]
  42. Keerthi Chandra, D.; Wang, P.; Leopold, J.; Fu, Y. Collective Embedding with Feature Importance: A Unified Approach for Spatiotemporal Network Embedding. In Proceedings of the ACM International Conference on Information & Knowledge Management, Galway, Ireland, 19–23 October 2020; pp. 615–624. [Google Scholar]
  43. Yan, B.; Janowicz, K.; Mai, G.; Gao, S. From itdl to place2vec: Reasoning about place type similarity and relatedness by learning embeddings from augmented spatial contexts. In Proceedings of the ACM SIGSPATIAL International Conference on Advances in Geographic Information Systems, Redondo Beach, CA, USA, 7–10 November 2017; pp. 1–10. [Google Scholar]
  44. Liu, X.; Andris, C.; Rahimi, S. Place niche and its regional variability: Measuring spatial context patterns for points of interest with representation learning. Comput. Environ. Urban Syst. 2019, 75, 146–160. [Google Scholar] [CrossRef]
  45. Niu, H.; Silva, E.A. Delineating urban functional use from points of interest data with neural network embedding: A case study in Greater London. Comput. Environ. Urban Syst. 2021, 88, 101651. [Google Scholar] [CrossRef]
  46. Dadoun, A.; Troncy, R.; Ratier, O.; Petitti, R. Location embeddings for next trip recommendation. In Proceedings of the World Wide Web Conference, San Francisco, CA, USA, 13–17 May 2019; pp. 896–903. [Google Scholar]
  47. Crivellari, A.; Ristea, A. CrimeVec-Exploring Spatial-Temporal Based Vector Representations of Urban Crime Types and Crime-Related Urban Regions. ISPRS Int. J. Geo-Inf. 2021, 10, 210. [Google Scholar] [CrossRef]
  48. Zhao, S.; Zhao, T.; King, I.; Lyu, M.R. Geo-teaser: Geo-temporal sequential embedding rank for point-of-interest recommendation. In Proceedings of the International Conference on World Wide Web Companion, Perth, Australia, 3–7 April 2017; pp. 153–162. [Google Scholar]
  49. Chen, M.; Zhao, Y.; Liu, Y.; Yu, X.; Zheng, K. Modeling spatial trajectories with attribute representation learning. IEEE Trans. Knowl. Data Eng. 2020, 34, 1902–1914. [Google Scholar] [CrossRef]
  50. Silva, A.; Karunasekera, S.; Leckie, C.; Luo, L. USTAR: Online multimodal embedding for modeling user-guided spatiotemporal activity. In Proceedings of the IEEE International Conference on Big Data, Los Angeles, CA, USA, 9–12 December 2019; pp. 1211–1217. [Google Scholar]
  51. Tian, H.; Zhang, M.; Luo, X.; Liu, F.; Qiao, Y. Twitter user location inference based on representation learning and label propagation. In Proceedings of the The Web Conference 2020, Taipei, Taiwan, 20–24 April 2020; pp. 2648–2654. [Google Scholar]
  52. Feng, L.; Huang, Y.; Tsang, I.W.; Gupta, A.; Tang, K.; Tan, K.C.; Ong, Y.S. Towards faster vehicle routing by transferring knowledge from customer representation. IEEE Trans. Intell. Transp. Syst. 2020, 23, 952–965. [Google Scholar] [CrossRef]
  53. Liu, Y.; Ao, X.; Dong, L.; Zhang, C.; Wang, J.; He, Q. Spatiotemporal activity modeling via hierarchical cross-modal embedding. IEEE Trans. Knowl. Data Eng. 2020, 34, 462–474. [Google Scholar] [CrossRef]
  54. Zhang, C.; Liu, L.; Lei, D.; Yuan, Q.; Zhuang, H.; Hanratty, T.; Han, J. Triovecevent: Embedding-based online local event detection in geo-tagged tweet streams. In Proceedings of the ACM SIGKDD International Conference on Knowledge Discovery and Data Mining, Halifax, NS, Canada, 3–17 August 2017; pp. 595–604. [Google Scholar]
  55. Wei, H.; Anjaria, J.; Samet, H. Learning embeddings of spatial, textual and temporal entities in geotagged tweets. In Proceedings of the ACM SIGSPATIAL International Conference on Advances in Geographic Information Systems, Chicago, IL, USA, 5–8 November 2019; pp. 484–487. [Google Scholar]
  56. Liyong, W.; Vateekul, P. Traffic Prediction Using Attentional Spatial-Temporal Deep Learning with Accident Embedding. In Proceedings of the International Conference on Computational Intelligence and Applications (ICCIA), Nanchang, China, 21–23 June 2019; pp. 98–103. [Google Scholar]
  57. Wang, Y.; Tang, J. Event2Vec: Learning event representations using spatial-temporal information for recommendation. In Proceedings of the Pacific-Asia Conference on Knowledge Discovery and Data Mining, Macau, China, 14–17 April 2019; pp. 314–326. [Google Scholar]
  58. Fu, T.Y.; Lee, W.C. Trembr: Exploring road networks for trajectory representation learning. ACM Trans. Intell. Syst. Technol. 2020, 11, 1–25. [Google Scholar] [CrossRef]
  59. Boonchoo, T.; Ao, X.; He, Q. Multi-Aspect Embedding for Attribute-Aware Trajectories. Symmetry 2019, 11, 1149. [Google Scholar] [CrossRef]
  60. Lv, M.; Zeng, D.; Chen, L.; Chen, T.; Zhu, T.; Ji, S. Private Cell-ID Trajectory Prediction Using Multi-Graph Embedding and Encoder-Decoder Network. IEEE Trans. Mob. Comput. 2021, 21, 2967–2977. [Google Scholar] [CrossRef]
  61. Yang, K.; Zhu, J. Next poi recommendation via graph embedding representation from h-deepwalk on hybrid network. IEEE Access 2019, 7, 171105–171113. [Google Scholar] [CrossRef]
  62. Zhang, Y.; Liu, A.; Liu, G.; Li, Z.; Li, Q. Deep representation learning of activity trajectory similarity computation. In Proceedings of the IEEE International Conference on Web Services, Milan, Italy, 8–13 July 2019; pp. 312–319. [Google Scholar]
  63. Shan, S.; Li, Z.; Yang, Q.; Liu, A.; Zhao, L.; Liu, G.; Chen, Z. Geographical address representation learning for address matching. World Wide Web 2020, 23, 2005–2022. [Google Scholar] [CrossRef]
  64. Yassine, M.; Beauchemin, D.; Laviolette, F.; Lamontagne, L. Leveraging Subword Embeddings for Multinational Address Parsing. In Proceedings of the Congress on Information Science and Technology (CiSt), Virtual, 28–31 July 2021; pp. 353–360. [Google Scholar]
  65. Liu, A.; Zhang, Y.; Zhang, X.; Liu, G.; Zhang, Y.; Li, Z.; Zhao, L.; Li, Q.; Zhou, X. Representation learning with multi-level attention for activity trajectory similarity computation. IEEE Trans. Knowl. Data Eng. 2020, 34, 2387–2400. [Google Scholar] [CrossRef]
  66. Wang, M.X.; Lee, W.C.; Fu, T.Y.; Yu, G. On Representation Learning for Road Networks. ACM Trans. Intell. Syst. Technol. 2020, 12, 1–27. [Google Scholar] [CrossRef]
  67. Zhang, R.; Rong, Y.; Wu, Z.; Zhuo, Y. Trajectory Similarity Assessment On Road Networks Via Embedding Learning. In Proceedings of the International Conference on Multimedia Big Data, New Delhi, India, 24–26 September 2020; pp. 1–8. [Google Scholar]
  68. Das, S.S.S.; Ali, M.E.; Li, Y.F.; Kang, Y.B.; Sellis, T. Boosting house price predictions using geo-spatial network embedding. Data Min. Knowl. Discov. 2021, 35, 2221–2250. [Google Scholar] [CrossRef]
  69. Mai, G.; Janowicz, K.; Cai, L.; Zhu, R.; Regalia, B.; Yan, B.; Shi, M.; Lao, N. SE-KGE: A location-aware knowledge graph embedding model for geographic question answering and spatial semantic lifting. Trans. GIS 2020, 24, 623–655. [Google Scholar] [CrossRef]
  70. Zhou, Y.; Huang, Y. Place Representation Based Bike Demand Prediction. In Proceedings of the IEEE International Conference on Big Data, Los Angeles, CA, USA, 9–12 December 2019; pp. 1577–1586. [Google Scholar]
  71. Xie, M.; Yin, H.; Wang, H.; Xu, F.; Chen, W.; Wang, S. Learning graph-based poi embedding for location-based recommendation. In Proceedings of the ACM International on Conference on Information and Knowledge Management, Indianapolis, IN, USA, 24–28 October 2016; pp. 15–24. [Google Scholar]
  72. Zhu, X.; Wu, Y.; Chen, L.; Jing, N. Spatial keyword query of region-of-interest based on the distributed representation of point-of-interest. ISPRS Int. J. Geo-Inf. 2019, 8, 287. [Google Scholar] [CrossRef]
  73. Jiang, J.; Ni, B.; Wang, C. Financial fraud detection on micro-credit loan scenario via fuller location information embedding. In Proceedings of the Web Conference, Ljubljana, Slovenia, 19–23 April 2021; pp. 238–246. [Google Scholar]
  74. Zhao, W.X.; Zhou, N.; Sun, A.; Wen, J.R.; Han, J.; Chang, E.Y. A time-aware trajectory embedding model for next-location recommendation. Knowl. Inf. Syst. 2018, 56, 559–579. [Google Scholar] [CrossRef]
  75. Canturk, D.; Karagoz, P. SgWalk: Location Recommendation by User Subgraph-Based Graph Embedding. IEEE Access 2021, 9, 134858–134873. [Google Scholar] [CrossRef]
  76. Chandra, D.K.; Wang, P.; Leopold, J.; Fu, Y. Collective representation learning on spatiotemporal heterogeneous information networks. In Proceedings of the ACM SIGSPATIAL International Conference on Advances in Geographic Information Systems, Chicago, IL, USA, 5–8 November 2019; pp. 319–328. [Google Scholar]
  77. Zhou, Y.; Huang, Y. Deepmove: Learning place representations through large scale movement data. In Proceedings of the IEEE International Conference on Big Data, Langkawi, Malaysia, 21–22 November 2018; pp. 2403–2412. [Google Scholar]
  78. Huang, J.; Wang, H.; Fan, M.; Zhuo, A.; Li, Y. Personalized prefix embedding for POI auto-completion in the search engine of Baidu Maps. In Proceedings of the ACM SIGKDD International Conference on Knowledge Discovery & Data Mining, Virtual, 6–10 July 2020; pp. 2677–2685. [Google Scholar]
  79. Hu, S.; He, Z.; Wu, L.; Yin, L.; Xu, Y.; Cui, H. A framework for extracting urban functional regions based on multiprototype word embeddings using points-of-interest data. Comput. Environ. Urban Syst. 2020, 80, 101442. [Google Scholar] [CrossRef]
  80. Jenkins, P.; Farag, A.; Wang, S.; Li, Z. Unsupervised representation learning of spatial data via multimodal embedding. In Proceedings of the ACM International Conference on Information and Knowledge Management, Beijing, China, 3–7 November 2019; pp. 1993–2002. [Google Scholar]
  81. Shimizu, T.; Yabe, T.; Tsubouchi, K. Improving land use classification using human mobility-based hierarchical place embeddings. In Proceedings of the IEEE International Conference on Pervasive Computing and Communications, Kassel, Germany, 22–26 March 2021; pp. 305–311. [Google Scholar]
  82. Du, J.; Zhang, Y.; Wang, P.; Leopold, J.; Fu, Y. Beyond geo-first law: Learning spatial representations via integrated autocorrelations and complementarity. In Proceedings of the IEEE International Conference on Data Mining, Beijing, China, 8–11 November 2019; pp. 160–169. [Google Scholar]
  83. Fu, Y.; Wang, P.; Du, J.; Wu, L.; Li, X. Efficient region embedding with multi-view spatial networks: A perspective of locality-constrained spatial autocorrelations. In Proceedings of the AAAI Conference on Artificial Intelligence, Honolulu, HI, USA, 27 January–1 February 2019; Volume 33, pp. 906–913. [Google Scholar]
  84. Xu, Y.; Li, X.; Li, J.; Wang, C.; Gao, R.; Yu, Y. SSSER: Spatiotemporal sequential and social embedding rank for successive point-of-interest recommendation. IEEE Access 2019, 7, 156804–156823. [Google Scholar] [CrossRef]
  85. Fang, X.; Huang, J.; Wang, F.; Liu, L.; Sun, Y.; Wang, H. SSML: Self-supervised meta-learner for en route travel time estimation at Baidu maps. In Proceedings of the ACM SIGKDD Conference on Knowledge Discovery & Data Mining, Virtual, 14–18 August 2021; pp. 2840–2848. [Google Scholar]
  86. Wang, W.; Xia, F.; Nie, H.; Chen, Z.; Gong, Z.; Kong, X.; Wei, W. Vehicle trajectory clustering based on dynamic representation learning of internet of vehicles. IEEE Trans. Intell. Transp. Syst. 2020, 22, 3567–3576. [Google Scholar] [CrossRef]
  87. Zhang, C.; Liu, M.; Liu, Z.; Yang, C.; Zhang, L.; Han, J. Spatiotemporal activity modeling under data scarcity: A graph-regularized cross-modal embedding approach. In Proceedings of the AAAI Conference on Artificial Intelligence, New Orleans, LA, USA, 2–7 February 2018; Volume 32. [Google Scholar]
  88. Li, Y.; Zhu, Z.; Kong, D.; Xu, M.; Zhao, Y. Learning heterogeneous spatial-temporal representation for bike-sharing demand prediction. In Proceedings of the AAAI Conference on Artificial Intelligence, Honolulu, HI, USA, 27 January–1 February 2019; Volume 33, pp. 1004–1011. [Google Scholar]
  89. Chen, Y.; Yu, P.; Chen, W.; Zheng, Z.; Guo, M. Embedding-based similarity computation for massive vehicle trajectory data. IEEE Internet Things J. 2021, 9, 4650–4660. [Google Scholar] [CrossRef]
  90. Wang, Z.; Yuan, G.; Pei, H.; Zhang, Y.; Liu, X. Unsupervised learning trajectory anomaly detection algorithm based on deep representation. Int. J. Distrib. Sens. Netw. 2020, 16, 1550147720971504. [Google Scholar] [CrossRef]
  91. Wang, P.; Li, X.; Zheng, Y.; Aggarwal, C.; Fu, Y. Spatiotemporal representation learning for driving behavior analysis: A joint perspective of peer and temporal dependencies. IEEE Trans. Knowl. Data Eng. 2019, 33, 728–741. [Google Scholar] [CrossRef]
  92. Zhao, L.; Gao, M.; Wang, Z. ST-GSP: Spatial-Temporal Global Semantic Representation Learning for Urban Flow Prediction. In Proceedings of the ACM International Conference on Web Search and Data Mining, Houston, TX, USA, 5–9 February 2022; pp. 1443–1451. [Google Scholar]
  93. Yao, D.; Zhang, C.; Zhu, Z.; Hu, Q.; Wang, Z.; Huang, J.; Bi, J. Learning deep representation for trajectory clustering. Expert Syst. 2018, 35, e12252. [Google Scholar] [CrossRef]
  94. Zhou, F.; Yue, X.; Trajcevski, G.; Zhong, T.; Zhang, K. Context-aware variational trajectory encoding and human mobility inference. In Proceedings of the The World Wide Web Conference, San Francisco, CA, USA, 13–17 May 2019; pp. 3469–3475. [Google Scholar]
  95. Cao, H.; Xu, F.; Sankaranarayanan, J.; Li, Y.; Samet, H. Habit2vec: Trajectory semantic embedding for living pattern recognition in population. IEEE Trans. Mob. Comput. 2019, 19, 1096–1108. [Google Scholar] [CrossRef]
  96. Zhou, F.; Dai, Y.; Gao, Q.; Wang, P.; Zhong, T. Self-supervised human mobility learning for next location prediction and trajectory classification. Knowl.-Based Syst. 2021, 228, 107214. [Google Scholar] [CrossRef]
  97. Xu, L.; Du, Z.; Mao, R.; Zhang, F.; Liu, R. GSAM: A deep neural network model for extracting computational representations of Chinese addresses fused with geospatial feature. Comput. Environ. Urban Syst. 2020, 81, 101473. [Google Scholar] [CrossRef]
  98. Joko, H.; Oka, R.; Uchide, H.; Itsui, H.; Otsuka, T. Learning Word Embeddings Using Spatial Information. In Proceedings of the IEEE International Conference on Systems, Man and Cybernetics, Bari, Italy, 6–9 October 2019; pp. 2959–2964. [Google Scholar]
  99. Arendt, D.; Volkova, S. Esteem: A novel framework for qualitatively evaluating and visualizing spatiotemporal embeddings in social media. In Proceedings of the Annual Meeting of the Association for Computational Linguistics, Vancouver, BC, Canada, 30 July–4 August 2017; pp. 25–30. [Google Scholar]
  100. Hasni, S.; Faiz, S. Word embeddings and deep learning for location prediction: Tracking Coronavirus from British and American tweets. Soc. Netw. Anal. Min. 2021, 11, 1–20. [Google Scholar] [CrossRef]
  101. Gharaee, Z.; Kowshik, S.; Stromann, O.; Felsberg, M. Graph representation learning for road type classification. Pattern Recognit. 2021, 120, 108174. [Google Scholar] [CrossRef]
  102. Jepsen, T.S.; Jensen, C.S.; Nielsen, T.D.; Torp, K. On network embedding for machine learning on road networks: A case study on the danish road network. In Proceedings of the IEEE International Conference on Big Data, Seattle, WA, USA, 10–13 December 2018; pp. 3422–3431. [Google Scholar]
  103. Liu, H.; Han, J.; Fu, Y.; Zhou, J.; Lu, X.; Xiong, H. Multi-modal transportation recommendation with unified route representation learning. VLDB Endow. 2020, 14, 342–350. [Google Scholar] [CrossRef]
  104. Chang, B.; Jang, G.; Kim, S.; Kang, J. Learning graph-based geographical latent representation for point-of-interest recommendation. In Proceedings of the ACM International Conference on Information & Knowledge Management, Online, 19–23 October 2020; pp. 135–144. [Google Scholar]
  105. Feng, S.; Tran, L.V.; Cong, G.; Chen, L.; Li, J.; Li, F. Hme: A hyperbolic metric embedding approach for next-poi recommendation. In Proceedings of the ACM SIGIR Conference on Research and Development in Information Retrieval, Xi’an, China, 25–30 July 2020; pp. 1429–1438. [Google Scholar]
  106. Xiong, X.; Qiao, S.; Li, Y.; Han, N.; Xiong, F.; He, L. Affective impression: Sentiment-awareness POI suggestion via embedding in heterogeneous LBSNs. IEEE Trans. Affect. Comput. 2019, 13, 272–284. [Google Scholar] [CrossRef]
  107. Jin, Z.; Shang, J.; Ni, W.; Zhao, L.; Liu, D.; Qiang, B.; Xie, W.; Min, G. IM2Vec: Representation learning-based preference maximization in geo-social networks. Inf. Sci. 2022, 604, 170–196. [Google Scholar] [CrossRef]
  108. Zhao, W.X.; Fan, F.; Wen, J.R.; Chang, E.Y. Joint representation learning for location-based social networks with multi-grained sequential contexts. ACM Trans. Knowl. Discov. Data 2018, 12, 1–21. [Google Scholar] [CrossRef]
  109. Zhou, N.; Zhao, W.X.; Zhang, X.; Wen, J.R.; Wang, S. A general multi-context embedding model for mining human trajectory data. IEEE Trans. Knowl. Data Eng. 2016, 28, 1945–1958. [Google Scholar] [CrossRef]
  110. Yang, C.; Hoang, D.H.; Mikolov, T.; Han, J. Place deduplication with embeddings. In Proceedings of the World Wide Web Conference, San Francisco, CA, USA, 13–17 May 2019; pp. 3420–3426. [Google Scholar]
  111. Yang, J.; Eickhoff, C. Unsupervised learning of parsimonious general-purpose embeddings for user and location modeling. ACM Trans. Inf. Syst. 2018, 36, 1–33. [Google Scholar] [CrossRef]
  112. Wang, G.; Liao, D.; Li, J. Complete user mobility via user and trajectory embeddings. IEEE Access 2018, 6, 72125–72136. [Google Scholar] [CrossRef]
  113. Dai, S.; Yu, Y.; Fan, H.; Dong, J. Spatio-Temporal Representation Learning with Social Tie for Personalized POI Recommendation. Data Sci. Eng. 2022, 7, 44–56. [Google Scholar] [CrossRef]
Figure 1. A taxonomy of SSRL models, adopted from that proposed by Deldari et al. [13].
Ijgi 12 00064 g001
Figure 2. A taxonomy of geographical data types is displayed.
Ijgi 12 00064 g002
Table 1. Inclusion criteria.
IDCriterion
IN1The article is written in English
IN2The article considers the problem of SSRL for geographical data.
Table 2. Exclusion criteria.
IDCriterion
EX1The article is not peer-reviewed.
EX2The article is a review article.
EX3The full text of the article is not available to the academic community.
EX4The article was published before 1 January 2013.
EX5The article was published after 23 August 2022 (the Web of Science search date).
EX6The article considers the problem of SSRL for remotely sensed data.
EX7The article does not use SSRL.
Disclaimer/Publisher’s Note: The statements, opinions and data contained in all publications are solely those of the individual author(s) and contributor(s) and not of MDPI and/or the editor(s). MDPI and/or the editor(s) disclaim responsibility for any injury to people or property resulting from any ideas, methods, instructions or products referred to in the content.

