Next Issue
Volume 10, December
Previous Issue
Volume 10, October


ISPRS Int. J. Geo-Inf., Volume 10, Issue 11 (November 2021) – 82 articles

Cover Story (view full-size image): 
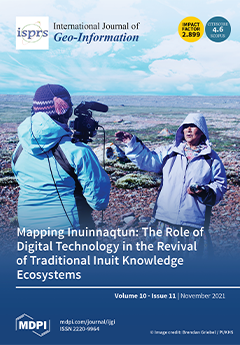
Pamela Gross documents elder Mary Avalak recalling memories of the Iqaluktuuq region, on Victoria Island, Nunavut, Canada. This oral history initiative was one of many that created digital content for Inuinnaqtun mapping platforms by the Inuit research organization Pitquhirnikkut Ilihautiniq/Kitikmeot Heritage Society. View this paper
  • Issues are regarded as officially published after their release is announced to the table of contents alert mailing list.
  • You may sign up for e-mail alerts to receive table of contents of newly released issues.
  • PDF is the official format for papers published in both, html and pdf forms. To view the papers in pdf format, click on the "PDF Full-text" link, and use the free Adobe Reader to open them.
Order results
Result details
Select all
Export citation of selected articles as:
19 pages, 1564 KiB  
Article
Climate Change and Vulnerability: The Case of MENA Countries
by Razieh Namdar, Ezatollah Karami and Marzieh Keshavarz
ISPRS Int. J. Geo-Inf. 2021, 10(11), 794; https://doi.org/10.3390/ijgi10110794 - 22 Nov 2021
Cited by 23 | Viewed by 5248
Abstract
Climate is changing and mitigation of the corresponding impacts requires assessment of vulnerability and adaptation building. This issue is particularly important in Middle East and North Africa (MENA), which is recognized as one of the most water scarce regions of the world and [...] Read more.
Climate is changing and mitigation of the corresponding impacts requires assessment of vulnerability and adaptation building. This issue is particularly important in Middle East and North Africa (MENA), which is recognized as one of the most water scarce regions of the world and vulnerable to climate change. Therefore, the objective of this study was an assessment of the different sectors’ vulnerability as well as the overall vulnerability of the MENA countries to climate change. The Notre Dame-Global Adaptation Index (ND-GAIN) was used to investigate climate change vulnerability. Cluster analysis revealed the very high, high, medium and low levels of vulnerability for the MENA countries by distinguishing their extent of exposure, sensitivity and adaptive capacity. Further results indicated that the MENA countries have an acceptable status of infrastructure and habitat, tolerable health and ecosystem statuses, and inappropriate water and food conditions. Water shortage is also a serious problem in this region, to the extent that it is often assumed that water shortage is the root cause of all other types of vulnerability in MENA. However, the obtained results do not support this assumption. These findings provide insight about the adaptation challenges that should be faced and the choices that should be made in response to climate change, in MENA. Full article
(This article belongs to the Special Issue Multi-Hazard Spatial Modelling and Mapping)
Show Figures

Figure 1

19 pages, 2970 KiB  
Article
Earth Observation Systems and Pasture Modeling: A Bibliometric Trend Analysis
by Lwandile Nduku, Ahmed Mukalazi Kalumba, Cilence Munghemezulu, Zinhle Mashaba-Munghemezulu, George Johannes Chirima, Gbenga Abayomi Afuye and Emmanuel Tolulope Busayo
ISPRS Int. J. Geo-Inf. 2021, 10(11), 793; https://doi.org/10.3390/ijgi10110793 - 20 Nov 2021
Cited by 3 | Viewed by 2452
Abstract
An Earth observation system (EOS) is essential in monitoring and improving our understanding of how natural and managed agricultural landscapes change over time or respond to climate change and overgrazing. Such changes can be quantified using a pasture model (PM), a critical tool [...] Read more.
An Earth observation system (EOS) is essential in monitoring and improving our understanding of how natural and managed agricultural landscapes change over time or respond to climate change and overgrazing. Such changes can be quantified using a pasture model (PM), a critical tool for monitoring changes in pastures driven by the growing population demands and climate change-related challenges and thus ensuring a sustainable food production system. This study used the bibliometric method to assess global scientific research trends in EOS and PM studies from 1979 to 2019. This study analyzed 399 published articles from the Scopus indexed database with the search term “Earth observation systems OR pasture model”. The annual growth rate of 19.76% suggests that the global research on EOS and PM has increased over time during the survey period. The average growth per article is n = 74, average total citations (ATC) = 2949 in the USA, is n = 37, ATC = 488, in China and is n = 22, ATC = 544 in Italy). These results show that the field of the study was inconsistent in terms of ATC per article during the study period. Furthermore, these results show three countries (USA, China, and Italy) ranked as the most productive countries by article publications and the Netherlands had the highest average total citations. This may suggest that these countries have strengthened research development on EOS and PM studies. However, developing counties such as Mexico, Thailand, Sri Lanka, and other African countries had a lower number of publications during the study period. Moreover, the results showed that Earth observation is fundamental in understanding PM dynamics to design targeted interventions and ensure food security. In general, the paper highlights various advances in EOS and PM studies and suggests the direction of future studies. Full article
(This article belongs to the Special Issue The Use of Geo-Spatial Tools in Forestry)
Show Figures

Figure 1

26 pages, 60948 KiB  
Article
Prediction of Groundwater Level Variations in a Changing Climate: A Danish Case Study
by Rebeca Quintero Gonzalez and Jamal Jokar Arsanjani
ISPRS Int. J. Geo-Inf. 2021, 10(11), 792; https://doi.org/10.3390/ijgi10110792 - 20 Nov 2021
Cited by 8 | Viewed by 2467
Abstract
Shallow groundwater is a key resource for human activities and ecosystems, and is susceptible to alterations caused by climate change, causing negative socio-economic and environmental impacts, and increasing the need to predict the evolution of the water table. The main objective of this [...] Read more.
Shallow groundwater is a key resource for human activities and ecosystems, and is susceptible to alterations caused by climate change, causing negative socio-economic and environmental impacts, and increasing the need to predict the evolution of the water table. The main objective of this study is to gain insights about future water level changes based on different climate change scenarios using machine learning algorithms, while addressing the following research questions: (a) how will the water table be affected by climate change in the future based on different socio-economic pathways (SSPs)?: (b) do machine learning models perform well enough in predicting changes of the groundwater in Denmark? If so, which ML model outperforms for forecasting these changes? Three ML algorithms were used in R: artificial neural networks (ANN), support vector machine (SVM) and random forest (RF). The ML models were trained with time-series data of groundwater levels taken at wells in the Hovedstaden region, for the period 1990–2018. Several independent variables were used to train the models, including different soil parameters, topographical features and climatic variables for the time period and region selected. Results show that the RF model outperformed the other two, resulting in a higher R-squared and lower mean absolute error (MAE). The future prediction maps for the different scenarios show little variation in the water table. Nevertheless, predictions show that it will rise slightly, mostly in the order of 0–0.25 m, especially during winter. The proposed approach in this study can be used to visualize areas where the water levels are expected to change, as well as to gain insights about how big the changes will be. The approaches and models developed with this paper could be replicated and applied to other study areas, allowing for the possibility to extend this model to a national level, improving the prevention and adaptation plans in Denmark and providing a more global overview of future water level predictions to more efficiently handle future climate change scenarios. Full article
(This article belongs to the Special Issue Earth Observation and GIScience for Agricultural Applications)
Show Figures

Figure 1

19 pages, 2006 KiB  
Article
Exploring the Influences of Point-of-Interest on Traffic Crashes during Weekdays and Weekends via Multi-Scale Geographically Weighted Regression
by Xinyu Qu, Xinyan Zhu, Xiongwu Xiao, Huayi Wu, Bingxuan Guo and Deren Li
ISPRS Int. J. Geo-Inf. 2021, 10(11), 791; https://doi.org/10.3390/ijgi10110791 - 19 Nov 2021
Cited by 13 | Viewed by 2649
Abstract
Some studies on the impact of traditional land use factors on traffic crashes do not take into account the limitations of spatial heterogeneity and spatial scale. To overcome these limitations this study presents a systematic method based on multi-scale geographically weighted regression (MGWR), [...] Read more.
Some studies on the impact of traditional land use factors on traffic crashes do not take into account the limitations of spatial heterogeneity and spatial scale. To overcome these limitations this study presents a systematic method based on multi-scale geographically weighted regression (MGWR), which considers spatial heterogeneity and spatial scale differences of different influencing factors, to explore the influence of reclassified points-of-interest (POI) on traffic crashes occurring on weekdays and weekends. Experiments were conducted on 442 communities in Hankou, Wuhan, and the performance of the proposed method was compared against traditional methods based on ordinary least squares (OLS), spatial lag model (SLM), spatial error model (SEM), and geographically weighted regression (GWR). The experiments show that the proposed method yielded the best fitness of models and more accurate model results of local coefficient estimates. The highlights of the results are as follows: There are differences in the scale of the predictor variables. Residential POI, scenic POI, and transportation POI have a global effect on traffic crashes. Commercial service POI and industrial POI affects traffic crashes at the regional scale, while public service POI affects crashes at the local scale. The local coefficient estimates from residential POI and scenic POI have little impact on traffic crashes. During weekdays, more transportation POI in the entire study area leads to more traffic crashes. While on weekends, transportation POI has a significant positive effect on crashes only in some communities. The local coefficient estimates for industrial POI vary at different periods. Commercial service POI and public service POI may increase the risk of crashes in some communities, which can be observed on weekdays and weekends. Exploring the influence of POI on traffic crashes at different periods is helpful for traffic management strategies and in reducing traffic crashes. Full article
Show Figures

Graphical abstract

27 pages, 7048 KiB  
Article
Impact of the Geographic Resolution on Population Synthesis Quality
by Mohamed Khachman, Catherine Morency and Francesco Ciari
ISPRS Int. J. Geo-Inf. 2021, 10(11), 790; https://doi.org/10.3390/ijgi10110790 - 19 Nov 2021
Cited by 2 | Viewed by 1633
Abstract
Microsimulation-based models, increasingly used in the transportation domain, require richer datasets than traditional models. Precisely enumerated population data being usually unavailable, transportation researchers generate their statistical equivalent through population synthesis. While various synthesizers are proposed to optimize the accuracy of synthetic populations, no [...] Read more.
Microsimulation-based models, increasingly used in the transportation domain, require richer datasets than traditional models. Precisely enumerated population data being usually unavailable, transportation researchers generate their statistical equivalent through population synthesis. While various synthesizers are proposed to optimize the accuracy of synthetic populations, no insight is given regarding the impact of the geographic resolution on population synthesis quality. In this paper, we synthesize populations for the Census Metropolitan Areas of Montreal, Toronto, and Vancouver at various geographic resolutions using the enhanced iterative proportional updating algorithm. We define accuracy (representativeness of the sociodemographic characteristics of the entire population) and precision (representativeness of the real population’s spatial heterogeneity) as metrics of synthetic populations’ quality and measure the impact of the reference resolution on them. Moreover, we assess census targets’ harmonization and double geographic resolution control as means of quality improvement. We find that with a less aggregate reference resolution, the gain in precision is higher than the loss in accuracy. The most disaggregate resolution is thus found to be the best choice. Harmonization proves to further optimize synthetic populations while double control harms their quality. Hence, synthesizing at the Dissemination Area resolution using harmonized census targets is found to yield optimal synthetic populations. Full article
Show Figures

Figure 1

20 pages, 6188 KiB  
Article
The Evolvement of Rail Transit Network Structure and Impact on Travel Characteristics: A Case Study of Wuhan
by Jiandong Peng, Changwei Cui, Jiajie Qi, Zehan Ruan, Qi Dai and Hong Yang
ISPRS Int. J. Geo-Inf. 2021, 10(11), 789; https://doi.org/10.3390/ijgi10110789 - 18 Nov 2021
Cited by 8 | Viewed by 2317
Abstract
The expansion of the rail transit network has a positive impact on travel characteristics under spatial and temporal constraints by changing accessibility. However, few empirical studies have examined the longitudinal evolution of the impact of accessibility and travel characteristics. In this paper, a [...] Read more.
The expansion of the rail transit network has a positive impact on travel characteristics under spatial and temporal constraints by changing accessibility. However, few empirical studies have examined the longitudinal evolution of the impact of accessibility and travel characteristics. In this paper, a model of the Wuhan rail transit network is constructed and the evolution of the spatial pattern of accessibility over different periods is analyzed. The correlation of accessibility with rail transit travel characteristics is studied longitudinally to provide theoretical support for rail transit construction and traffic demand management. The study shows that: (1) Wuhan’s rail transit network has evolved from a tree to a ring, improving the operational efficiency. (2) The accessibility of Wuhan’s rail transit network has evolved into a circular structure, showing a decreasing trend away from the city center. (3) The change of accessibility greatly affects travel characteristics. The higher the accessibility, the higher the traffic volume, and the lower the travel frequency, the more residents travel during peak hours, and the shorter the travel distance. These findings are useful for gaining insight into public transportation demand in large cities, and thus for developing reasonable transportation demand management policies. Full article
(This article belongs to the Special Issue Geo-Information for Developing Urban Infrastructures)
Show Figures

Figure 1

20 pages, 13613 KiB  
Article
Spatial Modelling of Kaolin Deposit Demonstrated on the Jimlíkov-East Deposit, Karlovy Vary, Czech Republic
by Marcela Jarošová and František Staněk
ISPRS Int. J. Geo-Inf. 2021, 10(11), 788; https://doi.org/10.3390/ijgi10110788 - 18 Nov 2021
Viewed by 1685
Abstract
The present study is focused on spatial modelling of a kaolin deposit in Karlovy Vary, Czech Republic, and the methodical procedure of development, evaluation and visualization of a 3D model are described step by step. The implementation of this methodology is performed in [...] Read more.
The present study is focused on spatial modelling of a kaolin deposit in Karlovy Vary, Czech Republic, and the methodical procedure of development, evaluation and visualization of a 3D model are described step by step. The implementation of this methodology is performed in Visual Studio 2019 with use of the Surfer and Voxler objects from Golden Software. This methodology combined with the newly developed software (Kaolin_A and Kaolin_Viz programs) allow a user to create a variant dynamic model for the same or similar types of deposits. It enables a quick update of the model when changing the input data, based on the new mining exploration or when changing the modelling parameters. The presented approach leads to a more advanced evaluation of deposits, including various estimates of reserves according to pre-specified usability conditions. The efficiency of the developed methodology and the software for the evaluation of the deposit are demonstrated on the kaolin deposit Jimlíkov-East, located near the village Jimlíkov about 5 km west of Karlovy Vary in the Czech Republic. Full article
(This article belongs to the Special Issue Application of Geology and GIS)
Show Figures

Figure 1

21 pages, 21809 KiB  
Article
Massively Parallel Discovery of Loosely Moving Congestion Patterns from Trajectory Data
by Chunchun Hu and Si Chen
ISPRS Int. J. Geo-Inf. 2021, 10(11), 787; https://doi.org/10.3390/ijgi10110787 - 17 Nov 2021
Viewed by 1270
Abstract
The efficient discovery of significant group patterns from large-scale spatiotemporal trajectory data is a primary challenge, particularly in the context of urban traffic management. Existing studies on group pattern discovery mainly focus on the spatial gathering and moving continuity of vehicles or animals; [...] Read more.
The efficient discovery of significant group patterns from large-scale spatiotemporal trajectory data is a primary challenge, particularly in the context of urban traffic management. Existing studies on group pattern discovery mainly focus on the spatial gathering and moving continuity of vehicles or animals; these studies either set too many limitations in the shape of the cluster and time continuity or only focus on the characteristic of the gathering. Meanwhile, little attention has been paid to the equidirectional movement of the aggregated objects and their loose coherence moving. In this study, we propose the concept of loosely moving congestion patterns that represent a group of moving objects together with similar movement tendency and loose coherence moving, which exhibit a potential congestion characteristic. Meanwhile, we also develop an accelerated algorithm called parallel equidirectional cluster-recombinant (PDCLUR) that runs on graphics processing units (GPUs) to detect congestion patterns from large-scale raw taxi-trajectory data. The case study results demonstrate the performance of our approach and its applicability to large trajectory dataset, and we can discover some significant loosely moving congesting patterns and when and where the most congested road segments are observed. The developed algorithm PDCLUR performs satisfactorily, affording an acceleration ratio of over 65 relative to the traditional sequential algorithms. Full article
Show Figures

Figure 1

21 pages, 703 KiB  
Article
Knowledge-Based Recommendation for On-Demand Mapping: Application to Nautical Charts
by Bilal Koteich, Éric Saux and Wissame Laddada
ISPRS Int. J. Geo-Inf. 2021, 10(11), 786; https://doi.org/10.3390/ijgi10110786 - 17 Nov 2021
Cited by 1 | Viewed by 2305
Abstract
Maps have long been seen as a single cartographic product for different uses, with the user having to adapt their interpretation to his or her own needs. On-demand mapping reverses this paradigm in that it is the map that adapts to the user’s [...] Read more.
Maps have long been seen as a single cartographic product for different uses, with the user having to adapt their interpretation to his or her own needs. On-demand mapping reverses this paradigm in that it is the map that adapts to the user’s needs and context of use. Still often manual and reserved for professionals, on-demand mapping is evolving toward an automation of its processes and a democratization of its use. An on-demand mapping service is a chain of several consecutive steps leading to a target map that precisely meets the needs and requirements of a user. This article addresses the issue of selecting relevant thematic layers with a specific context of use. We propose a knowledge-based recommendation approach that aims to guide a cartographer through the process of map-making. Our system is based on high- and low-level ontologies, the latter modeling the concepts specific to different types of maps targeted. By focusing on maritime maps, we address the representation of knowledge in this context of use, where recommendations rely on axiomatic and rule-based reasoning. For this purpose, we choose description logics as a formalism for knowledge representation in order to make cartographic knowledge machine readable. Full article
Show Figures

Figure 1

17 pages, 7032 KiB  
Communication
Improved A-Star Algorithm for Long-Distance Off-Road Path Planning Using Terrain Data Map
by Zhonghua Hong, Pengfei Sun, Xiaohua Tong, Haiyan Pan, Ruyan Zhou, Yun Zhang, Yanling Han, Jing Wang, Shuhu Yang and Lijun Xu
ISPRS Int. J. Geo-Inf. 2021, 10(11), 785; https://doi.org/10.3390/ijgi10110785 - 17 Nov 2021
Cited by 36 | Viewed by 5161
Abstract
To overcome the limitation of poor processing times for long-distance off-road path planning, an improved A-Star algorithm based on terrain data is proposed in this study. The improved A-Star algorithm for long-distance off-road path planning tasks was developed to identify a feasible path [...] Read more.
To overcome the limitation of poor processing times for long-distance off-road path planning, an improved A-Star algorithm based on terrain data is proposed in this study. The improved A-Star algorithm for long-distance off-road path planning tasks was developed to identify a feasible path between the start and destination based on a terrain data map generated using a digital elevation model. This study optimised the algorithm in two aspects: data structure, retrieval strategy. First, a hybrid data structure of the minimum heap and 2D array greatly reduces the time complexity of the algorithm. Second, an optimised search strategy was designed that does not check whether the destination is reached in the initial stage of searching for the global optimal path, thus improving execution efficiency. To evaluate the efficiency of the proposed algorithm, three different off-road path planning tasks were examined for short-, medium-, and long-distance path planning tasks. Each group of tasks corresponded to three different off-road vehicles, and nine groups of experiments were conducted. The experimental results show that the processing efficiency of the proposed algorithm is significantly better than that of the conventional A-Star algorithm. Compared with the conventional A-Star algorithm, the path planning efficiency of the improved A-Star algorithm was accelerated by at least 4.6 times, and the maximum acceleration reached was 550 times for long-distance off-road path planning. The simulation results show that the efficiency of long-distance off-road path planning was greatly improved by using the improved algorithm. Full article
Show Figures

Figure 1

22 pages, 17914 KiB  
Article
Morpho-tectonic Assessment of the Abu-Dabbab Area, Eastern Desert, Egypt: Insights from Remote Sensing and Geospatial Analysis
by Abdelrahman Khalifa, Bashar Bashir, Abdullah Alsalman and Nazik Öğretmen
ISPRS Int. J. Geo-Inf. 2021, 10(11), 784; https://doi.org/10.3390/ijgi10110784 - 17 Nov 2021
Cited by 12 | Viewed by 2018
Abstract
The Abu-Dabbab area, located in the central part of the Egyptian Eastern Desert, is an active seismic region where micro-earthquakes (≈ML < 2.0) are recorded regularly. Earthquake epicenters are concentrated along an ENE–WSW trending pattern. In this study, we used morphological indexes, [...] Read more.
The Abu-Dabbab area, located in the central part of the Egyptian Eastern Desert, is an active seismic region where micro-earthquakes (≈ML < 2.0) are recorded regularly. Earthquake epicenters are concentrated along an ENE–WSW trending pattern. In this study, we used morphological indexes, including the valley floor width-to-valley floor height ratio (Vf), mountain front sinuosity (Smf), the asymmetry factor index (Af), the drainage basin shape index (Bs), the stream length–gradient index (SL), hypsometric integral (Hi) water drainage systems, and a digital elevation model analysis, to identify the role of tectonics. These indexes were used to define the relative tectonic activity index (RTAI), which can be utilized to distinguish low (RTAI < 1.26), moderate (RTAI = 1.26–1.73), and high (RTAI > 1.73) tectonic activity signals all over the study area. Firstly, our results indicate low to medium tectonic activity and general anomaly patterns detected along the major tectonic zones of the study area. Secondly, based on most of the low to medium tectonic activity distributed in the study area and the detected anomalies, we discuss two potential drivers of the seismicity in the Abu-Dabbab area, which are fault-controlled and deep-rooted activities. Full article
(This article belongs to the Special Issue Application of Geology and GIS)
Show Figures

Figure 1

19 pages, 2417 KiB  
Article
Between Consultation and Collaboration: Self-Reported Objectives for 25 Web-Based Geoparticipation Projects in Urban Planning
by Ian Babelon, Jiří Pánek, Enzo Falco, Reinout Kleinhans and James Charlton
ISPRS Int. J. Geo-Inf. 2021, 10(11), 783; https://doi.org/10.3390/ijgi10110783 - 17 Nov 2021
Cited by 10 | Viewed by 3752
Abstract
Web-based participatory mapping technologies are being increasingly harnessed by local governments to crowdsource local knowledge and engage the public in urban planning policies as a means of increasing the transparency and legitimacy of planning processes and decisions. We refer to these technologies as [...] Read more.
Web-based participatory mapping technologies are being increasingly harnessed by local governments to crowdsource local knowledge and engage the public in urban planning policies as a means of increasing the transparency and legitimacy of planning processes and decisions. We refer to these technologies as “geoparticipation”. Current innovations are outpacing research into the use of geoparticipation in participatory planning practices. To address this knowledge gap, this paper investigates the objectives of web-based geoparticipation and uses empirical evidence from online survey responses related to 25 urban planning projects in nine countries across three continents (Europe, North America, and Australia). The survey adopts the objectives of the Spectrum for Public Participation that range from information empowerment, with each category specifying promises about how public input is expected to influence decision-making (IAP2, 2018). Our findings show that geoparticipation can leverage a ‘middle-ground’ of citizen participation by facilitating involvement alongside consultation and/or collaboration. This paper constitutes a pilot study as a step toward more robust and replicable empirical studies for cross-country comparisons. Empowerment (or citizen control) is not yet a normative goal or outcome for web-based geoparticipation. Our evidence also suggests that information is pursued alongside other objectives for citizen participation, and therefore functions not as a “low-hanging fruit” as portrayed in the literature, but rather as a core component of higher intensities of participation. Full article
Show Figures

Figure 1

19 pages, 6022 KiB  
Article
Dynamic Intervisibility Analysis of 3D Point Clouds
by Ling Bai, Yinguo Li and Ming Cen
ISPRS Int. J. Geo-Inf. 2021, 10(11), 782; https://doi.org/10.3390/ijgi10110782 - 17 Nov 2021
Cited by 1 | Viewed by 1929
Abstract
With the popularity of ground and airborne three-dimensional laser scanning hardware and the development of advanced technologies for computer vision in geometrical measurement, intelligent processing of point clouds has become a hot issue in artificial intelligence. The intervisibility analysis in 3D space can [...] Read more.
With the popularity of ground and airborne three-dimensional laser scanning hardware and the development of advanced technologies for computer vision in geometrical measurement, intelligent processing of point clouds has become a hot issue in artificial intelligence. The intervisibility analysis in 3D space can use viewpoint, view distance, and elevation values and consider terrain occlusion to derive the intervisibility between two points. In this study, we first use the 3D point cloud of reflected signals from the intelligent autonomous driving vehicle’s 3D scanner to estimate the field-of-view of multi-dimensional data alignment. Then, the forced metrics of mechanical Riemann geometry are used to construct the Manifold Auxiliary Surface (MAS). With the help of the spectral analysis of the finite element topology structure constructed by the MAS, an innovative dynamic intervisibility calculation is finally realized under the geometric calculation conditions of the Mix-Planes Calculation Structure (MPCS). Different from advanced methods of global and interpolation pathway-based point clouds computing, we have removed the 99.54% high-noise background and reduced the computational complexity by 98.65%. Our computation time can reach an average processing time of 0.1044 s for one frame with a 25 fps acquisition rate of the original vision sensor. The remarkable experimental results and significant evaluations from multiple runs demonstrate that the proposed dynamic intervisibility analysis has high accuracy, strong robustness, and high efficiency. This technology can assist in terrain analysis, military guidance, and dynamic driving path planning, Simultaneous Localization And Mapping (SLAM), communication base station siting, etc., is of great significance in both theoretical technology and market applications. Full article
(This article belongs to the Special Issue Advanced Research Based on Multi-Dimensional Point Cloud Analysis)
Show Figures

Figure 1

30 pages, 6720 KiB  
Article
A Comprehensive Analysis of Hurricane Damage across the U.S. Gulf and Atlantic Coasts Using Geospatial Big Data
by Gainbi Park
ISPRS Int. J. Geo-Inf. 2021, 10(11), 781; https://doi.org/10.3390/ijgi10110781 - 17 Nov 2021
Cited by 6 | Viewed by 4544 | Correction
Abstract
(1) Background: Hurricane events are expected to increase as a consequence of climate change, increasing their intensity and severity. Destructive hurricane activities pose the greatest threat to coastal communities along the U.S. Gulf of Mexico and Atlantic Coasts in the conterminous United States. [...] Read more.
(1) Background: Hurricane events are expected to increase as a consequence of climate change, increasing their intensity and severity. Destructive hurricane activities pose the greatest threat to coastal communities along the U.S. Gulf of Mexico and Atlantic Coasts in the conterminous United States. This study investigated the historical extent of hurricane-related damage, identifying the most at-risk areas of hurricanes using geospatial big data. As a supplement to analysis, this study further examined the overall population trend within the hurricane at-risk zones. (2) Methods: The Sea, Lake, and Overland Surges from Hurricanes (SLOSH) model and the HURRECON model were used to estimate the geographical extent of the storm surge inundation and wind damage of historical hurricanes from 1950 to 2018. The modeled results from every hurricane were then aggregated to a single unified spatial surface to examine the generalized hurricane patterns across the affected coastal counties. Based on this singular spatial boundary coupled with demographic datasets, zonal analysis was applied to explore the historical population at risk. (3) Results: A total of 775 counties were found to comprise the “hurricane-prone coastal counties” that have experienced at least one instance of hurricane damage over the study period. The overall demographic trends within the hurricane-prone coastal counties revealed that the coastal populations are growing at a faster pace than the national average, and this growth puts more people at greater risk of hurricane hazards. (4) Conclusions: This study is the first comprehensive investigation of hurricane vulnerability encompassing the Atlantic and Gulf Coasts stretching from Texas to Maine over a long span of time. The findings from this study can serve as a basis for understanding the exposure of at-risk populations to hurricane-related damage within the coastal counties at a national scale. Full article
Show Figures

Figure 1

25 pages, 85347 KiB  
Article
A GIS-Based Approach to Estimate Electricity Requirements for Small-Scale Groundwater Irrigation
by Anna Nilsson, Dimitrios Mentis, Alexandros Korkovelos and Joel Otwani
ISPRS Int. J. Geo-Inf. 2021, 10(11), 780; https://doi.org/10.3390/ijgi10110780 - 15 Nov 2021
Cited by 3 | Viewed by 2280
Abstract
Access to modern energy services is a precondition to improving livelihoods and building resilience against climate change. Still, electricity reaches only about half of the population in Sub-Saharan Africa (SSA), while about 40% live under the poverty line. Heavily reliant on the agriculture [...] Read more.
Access to modern energy services is a precondition to improving livelihoods and building resilience against climate change. Still, electricity reaches only about half of the population in Sub-Saharan Africa (SSA), while about 40% live under the poverty line. Heavily reliant on the agriculture sector and increasingly affected by prolonged droughts, small-scale irrigation could be instrumental for development and climate change adaptation in SSA countries. A bottom-up understanding of the demand for irrigation and associated energy services is essential for designing viable energy supply options in an effective manner. Using Uganda as a case study, the study introduces a GIS-based methodology for the estimation of groundwater irrigation requirements through which energy demand is derived. Results are generated for two scenarios: (a) a reference scenario and (b) a drought scenario. The most critical need is observed in the northern and southern regions of the country. The total annual irrigation demand is estimated to be ca. 90 thousand m3, with the highest demand observed in the months of December through February, with an average irrigation demand of 445 mm per month. The highest energy demand is observed in the northern part of the study area in January, reaching 48 kWh/ha. The average energy demand increases by 67% in the drought scenario. The study contributes to current gaps in the existing literature by providing a replicable methodological framework and data aimed at facilitating energy system planning through the consideration of location-specific characteristics at the nexus of energy–water–agriculture. Full article
(This article belongs to the Special Issue Geospatial Electrification and Energy Access Planning)
Show Figures

Figure 1

23 pages, 3092 KiB  
Article
An End-to-End Point of Interest (POI) Conflation Framework
by Raymond Low, Zeynep Duygu Tekler and Lynette Cheah
ISPRS Int. J. Geo-Inf. 2021, 10(11), 779; https://doi.org/10.3390/ijgi10110779 - 15 Nov 2021
Cited by 27 | Viewed by 2635
Abstract
Point of interest (POI) data serves as a valuable source of semantic information for places of interest and has many geospatial applications in real estate, transportation, and urban planning. With the availability of different data sources, POI conflation serves as a valuable technique [...] Read more.
Point of interest (POI) data serves as a valuable source of semantic information for places of interest and has many geospatial applications in real estate, transportation, and urban planning. With the availability of different data sources, POI conflation serves as a valuable technique for enriching data quality and coverage by merging the POI data from multiple sources. This study proposes a novel end-to-end POI conflation framework consisting of six steps, starting with data procurement, schema standardisation, taxonomy mapping, POI matching, POI unification, and data verification. The feasibility of the proposed framework was demonstrated in a case study conducted in the eastern region of Singapore, where the POI data from five data sources was conflated to form a unified POI dataset. Based on the evaluation conducted, the resulting unified dataset was found to be more comprehensive and complete than any of the five POI data sources alone. Furthermore, the proposed approach for identifying POI matches between different data sources outperformed all baseline approaches with a matching accuracy of 97.6% with an average run time below 3 min when matching over 12,000 POIs to result in 8699 unique POIs, thereby demonstrating the framework’s scalability for large scale implementation in dense urban contexts. Full article
(This article belongs to the Special Issue Intelligent Systems Based on Open and Crowdsourced Location Data)
Show Figures

Figure 1

30 pages, 8810 KiB  
Article
Assessing Potential Climatic and Human Pressures in Indonesian Coastal Ecosystems Using a Spatial Data-Driven Approach
by Adam Irwansyah Fauzi, Anjar Dimara Sakti, Balqis Falah Robbani, Mita Ristiyani, Rahiska Tisa Agustin, Emi Yati, Muhammad Ulin Nuha, Nova Anika, Raden Putra, Diyanti Isnani Siregar, Budhi Agung Prasetyo, Atriyon Julzarika and Ketut Wikantika
ISPRS Int. J. Geo-Inf. 2021, 10(11), 778; https://doi.org/10.3390/ijgi10110778 - 15 Nov 2021
Cited by 11 | Viewed by 4161
Abstract
Blue carbon ecosystems are key for successful global climate change mitigation; however, they are one of the most threatened ecosystems on Earth. Thus, this study mapped the climatic and human pressures on the blue carbon ecosystems in Indonesia using multi-source spatial datasets. Data [...] Read more.
Blue carbon ecosystems are key for successful global climate change mitigation; however, they are one of the most threatened ecosystems on Earth. Thus, this study mapped the climatic and human pressures on the blue carbon ecosystems in Indonesia using multi-source spatial datasets. Data on moderate resolution imaging spectroradiometer (MODIS) ocean color standard mapped images, VIIRS (visible, infrared imaging radiometer suite) boat detection (VBD), global artificial impervious area (GAIA), MODIS surface reflectance (MOD09GA), MODIS land surface temperature (MOD11A2), and MODIS vegetation indices (MOD13A2) were combined using remote sensing and spatial analysis techniques to identify potential stresses. La Niña and El Niño phenomena caused sea surface temperature deviations to reach −0.5 to +1.2 °C. In contrast, chlorophyll-a deviations reached 22,121 to +0.5 mg m−3. Regarding fishing activities, most areas were under exploitation and relatively sustained. Concerning land activities, mangrove deforestation occurred in 560.69 km2 of the area during 2007–2016, as confirmed by a decrease of 84.9% in risk-screening environmental indicators. Overall, the potential pressures on Indonesia’s blue carbon ecosystems are varied geographically. The framework of this study can be efficiently adopted to support coastal and small islands zonation planning, conservation prioritization, and marine fisheries enhancement. Full article
Show Figures

Figure 1

26 pages, 14112 KiB  
Article
A GIS-Based Multi-Criterion Decision-Making Method to Select City Fire Brigade: A Case Study of Wuhan, China
by Yuncheng Jiang, Aifeng Lv, Zhigang Yan and Zhen Yang
ISPRS Int. J. Geo-Inf. 2021, 10(11), 777; https://doi.org/10.3390/ijgi10110777 - 15 Nov 2021
Cited by 8 | Viewed by 2558
Abstract
Rapid urban expansion has brought new challenges to firefighting, with the speed of firefighting rescue being crucial for the safety of property and life. Thus, fire prevention and rescuing people in distress have become more challenging for city managers and emergency responders. Unfortunately, [...] Read more.
Rapid urban expansion has brought new challenges to firefighting, with the speed of firefighting rescue being crucial for the safety of property and life. Thus, fire prevention and rescuing people in distress have become more challenging for city managers and emergency responders. Unfortunately, existing research does not consider the negative effects of the current spatial distribution of fire-risk areas, land cover, location, and traffic congestion. To address these shortcomings, we use multiple methods (including geographic information system, multi-criterion decision-making, and location–allocation (L-A)) and multi-source geospatial data (including land cover, point-of-interest, drive time, and statistical yearbooks) to identify suitable areas for fire brigades. We propose a method for identifying potential fire-risk areas and to select suitable fire brigade zones. In this method, we first remove exclusion criteria to identify spatially undeveloped zones and use kernel density methods to evaluate the various fire-risk zones. Next, we use analytic hierarchy processes (AHPs) to comprehensively evaluate the undeveloped areas according to the location, orography, and potential fire-risk zones. In addition, based on the multi-time traffic situation, the average traffic speed during rush hour of each road is calculated, a traffic network model is established, and the travel time is calculated. Finally, the L-A model and network analysis are used to map the spatial coverage of the fire brigades, which is optimized by combining various objectives, such as the coverage rate of high-fire-risk zones, the coverage rate of building construction, and the maintenance of a sub-five-minute drive time between the proposed fire brigade and the demand point. The result shows that the top 50% of fire-risk zones in the central part of Wuhan are mainly concentrated to the west of the Yangtze River. Good overall rescue coverage is obtained with existing fire brigades, but the fire brigades in the north, south, southwest, and eastern areas of the study area lack rescue capabilities. The optimized results show that, to cover the high-fire-risk zones and building constructions, nine fire brigades should be added to increase the service coverage rate from 93.28% to 99.01%. The proposed method combines the viewpoint of big data, which provides new ideas and technical methods for the fire brigade site-selection model. Full article
Show Figures

Figure 1

20 pages, 6948 KiB  
Article
The Dynamic Influence of High-Speed Rail on the Spatial Structure of Economic Networks and the Underlying Mechanisms in Northeastern China
by Sanwei He, Lei Mei and Lei Wang
ISPRS Int. J. Geo-Inf. 2021, 10(11), 776; https://doi.org/10.3390/ijgi10110776 - 15 Nov 2021
Cited by 3 | Viewed by 1947
Abstract
Drawing on 185 cities in the northeastern region of China, this paper improves the radiation model by incorporating the accessibility index to characterize the asymmetric process of economic linkages before HSR in 2007 and after HSR in 2016. Then social network analysis is [...] Read more.
Drawing on 185 cities in the northeastern region of China, this paper improves the radiation model by incorporating the accessibility index to characterize the asymmetric process of economic linkages before HSR in 2007 and after HSR in 2016. Then social network analysis is utilized to examine the impact of HSR on the spatial structure of economic networks, including nodal centrality and community structures. Finally, spatial econometric models are employed to explore the driving factors of nodal centrality in economic networks and some policy implications are proposed. The major findings of this paper are the following. First, HSR services can weaken the core-peripheral inequality of economic linkages and a corridor economy is evident in northeastern China. Second, HSR services have significantly improved the out-degree centrality of prefecture-level cities but have slightly decreased the in-degree centrality of Liaoning. Third, there was a slight decline of coherence in the economic network after the construction of HSR and the within-modular connections were strengthened by HSR. Four, the spatial error model (SEM) is more desirable for explaining the distribution of in-degree centrality. GDP, fixed asset investment, education, population, and fiscal expenditure are important contributors to the in-degree centrality in economic networks. These findings give significant insights into city system planning, integrated transport and land use development, formulating regional poles and the coordinated development across administrative boundaries in northeastern China. Full article
Show Figures

Figure 1

14 pages, 3524 KiB  
Article
Trip Purpose Imputation Using GPS Trajectories with Machine Learning
by Qinggang Gao, Joseph Molloy and Kay W. Axhausen
ISPRS Int. J. Geo-Inf. 2021, 10(11), 775; https://doi.org/10.3390/ijgi10110775 - 13 Nov 2021
Cited by 8 | Viewed by 2249
Abstract
We studied trip purpose imputation using data mining and machine learning techniques based on a dataset of GPS-based trajectories gathered in Switzerland. With a large number of labeled activities in eight categories, we explored location information using hierarchical clustering and achieved a classification [...] Read more.
We studied trip purpose imputation using data mining and machine learning techniques based on a dataset of GPS-based trajectories gathered in Switzerland. With a large number of labeled activities in eight categories, we explored location information using hierarchical clustering and achieved a classification accuracy of 86.7% using a random forest approach as a baseline. The contribution of this study is summarized below. Firstly, using information from GPS trajectories exclusively without personal information shows a negligible decrease in accuracy (0.9%), which indicates the good performance of our data mining steps and the wide applicability of our imputation scheme in case of limited information availability. Secondly, the dependence of model performance on the geographical location, the number of participants, and the duration of the survey is investigated to provide a reference when comparing classification accuracy. Furthermore, we show the ensemble filter to be an excellent tool in this research field not only because of the increased accuracy (93.6%), especially for minority classes, but also the reduced uncertainties in blindly trusting the labeling of activities by participants, which is vulnerable to class noise due to the large survey response burden. Finally, the trip purpose derivation accuracy across participants reaches 74.8%, which is significant and suggests the possibility of effectively applying a model trained on GPS trajectories of a small subset of citizens to a larger GPS trajectory sample. Full article
Show Figures

Figure 1

18 pages, 5694 KiB  
Article
Assessment of a Rock Pillar Failure by Using Change Detection Analysis and FEM Modelling
by Claudio Vanneschi, Giovanni Mastrorocco and Riccardo Salvini
ISPRS Int. J. Geo-Inf. 2021, 10(11), 774; https://doi.org/10.3390/ijgi10110774 - 13 Nov 2021
Cited by 5 | Viewed by 1697
Abstract
In this paper, various methods have been used to control and evaluate engineering difficulties in mining accurately. Different unstable scenarios occurring at the surfaces of underground mine walls, have been identified by comparing 3D terrestrial laser scanning surveys and subsequent point cloud 3D [...] Read more.
In this paper, various methods have been used to control and evaluate engineering difficulties in mining accurately. Different unstable scenarios occurring at the surfaces of underground mine walls, have been identified by comparing 3D terrestrial laser scanning surveys and subsequent point cloud 3D analysis. These techniques, combined with a change detection analysis approach and the integration of rock mechanics’ modelling, represent an asset for the assessment and management of the risk in mining. The change detection analysis can be used as control of mining and industrial processes as well as to identify valid model scenarios for establishing possible failure causes. A pillar spalling failure has been identified in an Italian underground marble quarry and this topic represents the basis of the present paper. A Finite-Element Method was used to verify the occurrence of relatively high-stress concentrations in the pillar. The FEM modelling revealed that stresses in the proximity of the pillar may have sufficient magnitude to induce cracks growth and spalling failure. Full article
(This article belongs to the Special Issue Advancements in Remote Sensing Derived Point Cloud Processing)
Show Figures

Figure 1

17 pages, 3820 KiB  
Article
Predicting Spatiotemporal Demand of Dockless E-Scooter Sharing Services with a Masked Fully Convolutional Network
by Santi Phithakkitnukooon, Karn Patanukhom and Merkebe Getachew Demissie
ISPRS Int. J. Geo-Inf. 2021, 10(11), 773; https://doi.org/10.3390/ijgi10110773 - 13 Nov 2021
Cited by 7 | Viewed by 2531
Abstract
Dockless electric scooters (e-scooter) have emerged as a green alternative to automobiles and a solution to the first- and last-mile problems. Demand anticipation, or being able to accurately predict spatiotemporal demand of e-scooter usage, is one supply–demand balancing strategy. In this paper, we [...] Read more.
Dockless electric scooters (e-scooter) have emerged as a green alternative to automobiles and a solution to the first- and last-mile problems. Demand anticipation, or being able to accurately predict spatiotemporal demand of e-scooter usage, is one supply–demand balancing strategy. In this paper, we present a dockless e-scooter demand prediction model based on a fully convolutional network (FCN) coupled with a masking process and a weighted loss function, namely, masked FCN (or MFCN). The MFCN model handles the sparse e-scooter usage data with its masking process and weighted loss function. The model is trained with highly correlated features through our feature selection process. Next-hour and next 24-h prediction schemes have been tested for both pick-up and drop-off demands. Overall, the proposed MFCN outperforms other baseline models including a naïve forecasting, linear regression, and convolutional long short-term memory networks with mean absolute errors of 0.0434 and 0.0464 for the next-hour pick-up and drop-off demand prediction, respectively, and the errors of 0.0491 and 0.0501 for the next 24-h pick-up and drop-off demand prediction, respectively. The developed MFCN expands the collection of deep learning techniques that can be applied in the transportation domain, especially spatiotemporal demand prediction. Full article
Show Figures

Figure 1

21 pages, 12287 KiB  
Article
EnvSLAM: Combining SLAM Systems and Neural Networks to Improve the Environment Fusion in AR Applications
by Giulia Marchesi, Christian Eichhorn, David A. Plecher, Yuta Itoh and Gudrun Klinker
ISPRS Int. J. Geo-Inf. 2021, 10(11), 772; https://doi.org/10.3390/ijgi10110772 - 12 Nov 2021
Cited by 10 | Viewed by 3384
Abstract
Augmented Reality (AR) has increasingly benefited from the use of Simultaneous Localization and Mapping (SLAM) systems. This technology has enabled developers to create AR markerless applications, but lack semantic understanding of their environment. The inclusion of this information would empower AR applications to [...] Read more.
Augmented Reality (AR) has increasingly benefited from the use of Simultaneous Localization and Mapping (SLAM) systems. This technology has enabled developers to create AR markerless applications, but lack semantic understanding of their environment. The inclusion of this information would empower AR applications to better react to the surroundings more realistically. To gain semantic knowledge, in recent years, focus has shifted toward fusing SLAM systems with neural networks, giving birth to the field of Semantic SLAM. Building on existing research, this paper aimed to create a SLAM system that generates a 3D map using ORB-SLAM2 and enriches it with semantic knowledge originated from the Fast-SCNN network. The key novelty of our approach is a new method for improving the predictions of neural networks, employed to balance the loss of accuracy introduced by efficient real-time models. Exploiting sensor information provided by a smartphone, GPS coordinates are utilized to query the OpenStreetMap database. The returned information is used to understand which classes are currently absent in the environment, so that they can be removed from the network’s prediction with the goal of improving its accuracy. We achieved 87.40% Pixel Accuracy with Fast-SCNN on our custom version of COCO-Stuff and showed an improvement by involving GPS data for our self-made smartphone dataset resulting in 90.24% Pixel Accuracy. Having in mind the use on smartphones, the implementation aimed to find a trade-off between accuracy and efficiency, making the system achieve an unprecedented speed. To this end, the system was carefully designed and a strong focus on lightweight neural networks is also fundamental. This enabled the creation of an above real-time Semantic SLAM system that we called EnvSLAM (Environment SLAM). Our extensive evaluation reveals the efficiency of the system features and the operability in above real-time (48.1 frames per second with an input image resolution of 640 × 360 pixels). Moreover, the GPS integration indicates an effective improvement of the network’s prediction accuracy. Full article
(This article belongs to the Special Issue Deep Learning for Simultaneous Localization and Mapping (SLAM))
Show Figures

Figure 1

16 pages, 1758 KiB  
Article
Do Migrant and Native Robbers Target Different Places?
by Dongping Long and Lin Liu
ISPRS Int. J. Geo-Inf. 2021, 10(11), 771; https://doi.org/10.3390/ijgi10110771 - 12 Nov 2021
Cited by 4 | Viewed by 1715
Abstract
The spatial pattern of crime has been a central theme of criminological research. Recently, the spatial variation in the crime location choice of offenders by different population groups has been gaining more attention. This study addresses the issue of whether the spatial distribution [...] Read more.
The spatial pattern of crime has been a central theme of criminological research. Recently, the spatial variation in the crime location choice of offenders by different population groups has been gaining more attention. This study addresses the issue of whether the spatial distribution of migrant robbers’ crime location choices is different from those of native robbers. Further, what factors contribute to such differences? Using a kernel density estimation and the discrete spatial choice modeling, we combine the offender data, POI data, and mobile phone data to explain the crime location choice of the street robbers who committed offenses and were arrested from 2012 to 2016 in ZG City, China. The results demonstrate that the crime location choices between migrant robbers and native robbers have obvious spatial differences. Migrant robbers tend to choose the labor-intensive industrial cluster, while native robbers prefer the old urban areas and urban villages. Wholesale markets, sports stadiums, transportation hubs, and subway stations only affect migrant robbers’ crime location choices, but not native robbers’. These results may be attributable to the different spatial awareness between migrant robbers and native robbers. The implications of the findings for criminological theory and crime prevention are discussed. Full article
Show Figures

Figure 1

16 pages, 40476 KiB  
Article
Application of Territorial Laser Scanning in 3D Modeling of Traditional Village: A Case Study of Fenghuang Village in China
by Guiye Lin, Andrea Giordano, Kun Sang, Luigi Stendardo and Xiaochun Yang
ISPRS Int. J. Geo-Inf. 2021, 10(11), 770; https://doi.org/10.3390/ijgi10110770 - 12 Nov 2021
Cited by 7 | Viewed by 2767
Abstract
Historical villages bear historical, cultural, architectural, aesthetic, and landscape values, but they are facing a series of dangers and problems during the process of urbanization. Digital survey for traditional villages plays a crucial role in the preservation, planning, and development of this kind [...] Read more.
Historical villages bear historical, cultural, architectural, aesthetic, and landscape values, but they are facing a series of dangers and problems during the process of urbanization. Digital survey for traditional villages plays a crucial role in the preservation, planning, and development of this kind of heritage. The introduction of the terrestrial laser scanning technique is essential for heritage surveying, mapping, and modeling due to its advantages of noncontact measurement, accurate sensing of complex objects, and efficient operation. In recent years, TLS and related processing software (“SCENE”) have been widely presented as effective techniques for dealing with the management and protection of historical buildings in Fenghuang village. Thus, this paper highlights the process of using laser scanning to obtain architectural data, process point clouds, and compare the characteristics of historical buildings in Fenghuang village. The cloud-to-cloud registration technique is applied to build point clouds. As a result of model construction, some architectural patterns are summarized in this village, such as the spatial sequence of ancestral halls, the dominant position of memorial halls, and the character of building decorations and roof slopes. Furthermore, a BIM model is also explained to fulfill the statistical function for architectural components. In the future, more research can be fulfilled based on the built point cloud model, which will be beneficial for the development of the whole village. Full article
(This article belongs to the Special Issue Cultural Heritage Mapping and Observation)
Show Figures

Figure 1

13 pages, 4671 KiB  
Article
Impact Assessing of Traffic Lights via GPS Vehicle Trajectories
by Zhuhua Liao, Hao Xiao, Silin Liu, Yizhi Liu and Aiping Yi
ISPRS Int. J. Geo-Inf. 2021, 10(11), 769; https://doi.org/10.3390/ijgi10110769 - 12 Nov 2021
Cited by 7 | Viewed by 2009
Abstract
The adaptability of traffic lights in the control of vehicle traffic heavily affects the trafficability of vehicles and the travel efficiency of traffic participants in busy urban areas. Existing studies mainly have focused on the presence of traffic lights, but rarely evaluate the [...] Read more.
The adaptability of traffic lights in the control of vehicle traffic heavily affects the trafficability of vehicles and the travel efficiency of traffic participants in busy urban areas. Existing studies mainly have focused on the presence of traffic lights, but rarely evaluate the impact of traffic lights by analyzing traffic data, thus there is no solution for practicably and precisely self-regulating traffic lights. To address these issues, we propose a low-cost and fast traffic signal detection and impact assessment framework, which detects traffic lights from GPS trajectories and intersection features in a supervised way, and analyzes the impact range and time of traffic lights from intersection track data segments. The experimental results show that our approach gains the best AUC value of 0.95 under the ROC standard classification and indicates that the impact pattern of traffic lights at intersections is high related to the travel rule of traffic participants. Full article
Show Figures

Figure 1

16 pages, 5882 KiB  
Article
Mapping Mineral Prospectivity Using a Hybrid Genetic Algorithm–Support Vector Machine (GA–SVM) Model
by Xishihui Du, Kefa Zhou, Yao Cui, Jinlin Wang and Shuguang Zhou
ISPRS Int. J. Geo-Inf. 2021, 10(11), 766; https://doi.org/10.3390/ijgi10110766 - 12 Nov 2021
Cited by 7 | Viewed by 2264
Abstract
Machine learning (ML) as a powerful data-driven method is widely used for mineral prospectivity mapping. This study employs a hybrid of the genetic algorithm (GA) and support vector machine (SVM) model to map prospective areas for Au deposits in Karamay, northwest China. In [...] Read more.
Machine learning (ML) as a powerful data-driven method is widely used for mineral prospectivity mapping. This study employs a hybrid of the genetic algorithm (GA) and support vector machine (SVM) model to map prospective areas for Au deposits in Karamay, northwest China. In the proposed method, GA is used as an adaptive optimization search method to optimize the SVM parameters that result in the best fitness. After obtaining evidence layers from geological and geochemical data, GA–SVM models trained using different training datasets were applied to discriminate between prospective and non-prospective areas for Au deposits, and to produce prospectivity maps for mineral exploration. The F1 score and spatial efficiency of classification were calculated to objectively evaluate the performance of each prospectivity model. The best model predicted 95.83% of the known Au deposits within prospective areas, occupying 35.68% of the study area. The results demonstrate the effectiveness of the GA–SVM model as a tool for mapping mineral prospectivity. Full article
(This article belongs to the Special Issue Application of Geology and GIS)
Show Figures

Figure 1

22 pages, 51669 KiB  
Article
Deep Graph Convolutional Networks for Accurate Automatic Road Network Selection
by Jing Zheng, Ziren Gao, Jingsong Ma, Jie Shen and Kang Zhang
ISPRS Int. J. Geo-Inf. 2021, 10(11), 768; https://doi.org/10.3390/ijgi10110768 - 11 Nov 2021
Cited by 17 | Viewed by 2378
Abstract
The selection of road networks is very important for cartographic generalization. Traditional artificial intelligence methods have improved selection efficiency but cannot fully extract the spatial features of road networks. However, current selection methods, which are based on the theory of graphs or strokes, [...] Read more.
The selection of road networks is very important for cartographic generalization. Traditional artificial intelligence methods have improved selection efficiency but cannot fully extract the spatial features of road networks. However, current selection methods, which are based on the theory of graphs or strokes, have low automaticity and are highly subjective. Graph convolutional networks (GCNs) combine graph theory with neural networks; thus, they can not only extract spatial information but also realize automatic selection. Therefore, in this study, we adopted GCNs for automatic road network selection and transformed the process into one of node classification. In addition, to solve the problem of gradient vanishing in GCNs, we compared and analyzed the results of various GCNs (GraphSAGE and graph attention networks [GAT]) by selecting small-scale road networks under different deep architectures (JK-Nets, ResNet, and DenseNet). Our results indicate that GAT provides better selection of road networks than other models. Additionally, the three abovementioned deep architectures can effectively improve the selection effect of models; JK-Nets demonstrated more improvement with higher accuracy (88.12%) than other methods. Thus, our study shows that GCN is an appropriate tool for road network selection; its application in cartography must be further explored. Full article
Show Figures

Figure 1

22 pages, 669 KiB  
Article
FraudMove: Fraud Drivers Discovery Using Real-Time Trajectory Outlier Detection
by Eman O. Eldawy, Abdeltawab Hendawi, Mohammed Abdalla and Hoda M. O. Mokhtar
ISPRS Int. J. Geo-Inf. 2021, 10(11), 767; https://doi.org/10.3390/ijgi10110767 - 11 Nov 2021
Cited by 7 | Viewed by 1968
Abstract
Taxicabs and rideshare cars nowadays are equipped with GPS devices that enable capturing a large volume of traces. These GPS traces represent the moving behavior of the car drivers. Indeed, the real-time discovery of fraud drivers earlier is a demand for saving the [...] Read more.
Taxicabs and rideshare cars nowadays are equipped with GPS devices that enable capturing a large volume of traces. These GPS traces represent the moving behavior of the car drivers. Indeed, the real-time discovery of fraud drivers earlier is a demand for saving the passenger’s life and money. For this purpose, this paper proposes a novel time-based system, namely FraudMove, to discover fraud drivers in real-time by identifying outlier active trips. Mainly, the proposed FraudMove system computes the time of the most probable path of a trip. For trajectory outlier detection, a trajectory is considered an outlier trajectory if its time exceeds the time of this computed path by a specified threshold. FraudMove employs a tunable time window parameter to control the number of checks for detecting outlier trips. This parameter allows FraudMove to trade responsiveness with efficiency. Unlike other related works that wait until the end of a trip to indicate that it was an outlier, FraudMove discovers outlier trips instantly during the trip. Extensive experiments conducted on a real dataset confirm the efficiency and effectiveness of FraudMove in detecting outlier trajectories. The experimental results prove that FraudMove saves the response time of the outlier check process by up to 65% compared to the state-of-the-art systems. Full article
Show Figures

Figure 1

15 pages, 2250 KiB  
Article
A Multi-Level Analysis of Risky Streets and Neighbourhoods for Dissident Republican Violence in Belfast
by Zoe Marchment, Michael J. Frith, John Morrison and Paul Gill
ISPRS Int. J. Geo-Inf. 2021, 10(11), 765; https://doi.org/10.3390/ijgi10110765 - 11 Nov 2021
Cited by 1 | Viewed by 2961
Abstract
This paper uses graph theoretical measures to analyse the relationship between street network usage, as well as other street- and area-level factors, and dissident Republican violence in Belfast. A multi-level statistical model is used. Specifically, we employ an observation-level random-effects (OLRE) Poisson regression [...] Read more.
This paper uses graph theoretical measures to analyse the relationship between street network usage, as well as other street- and area-level factors, and dissident Republican violence in Belfast. A multi-level statistical model is used. Specifically, we employ an observation-level random-effects (OLRE) Poisson regression and use variables at the street and area levels. Street- and area-level characteristics simultaneously influence where violent incidents occur. For every 10% change in the betweenness value of a street segment, the segment is expected to experience 1.32 times as many incidents. Police stations (IRR: 22.05), protestant churches (IRR: 6.19) and commercial premises (IRR: 1.44) on each street segment were also all found to significantly increase the expected number of attacks. At the small-area level, for every 10% change in the number of Catholic residents, the number of incidents is expected to be 4.45 times as many. The results indicate that along with other factors, the street network plays a role in shaping terrorist target selection. Streets that are more connected and more likely to be traversed will experience more incidents than those that are not. This has important practical implications for the policing of political violence in Northern Ireland generally and for shaping specific targeted interventions. Full article
(This article belongs to the Special Issue Geographic Crime Analysis)
Show Figures

Figure 1

Previous Issue
Next Issue
Back to TopTop