Figure 1.
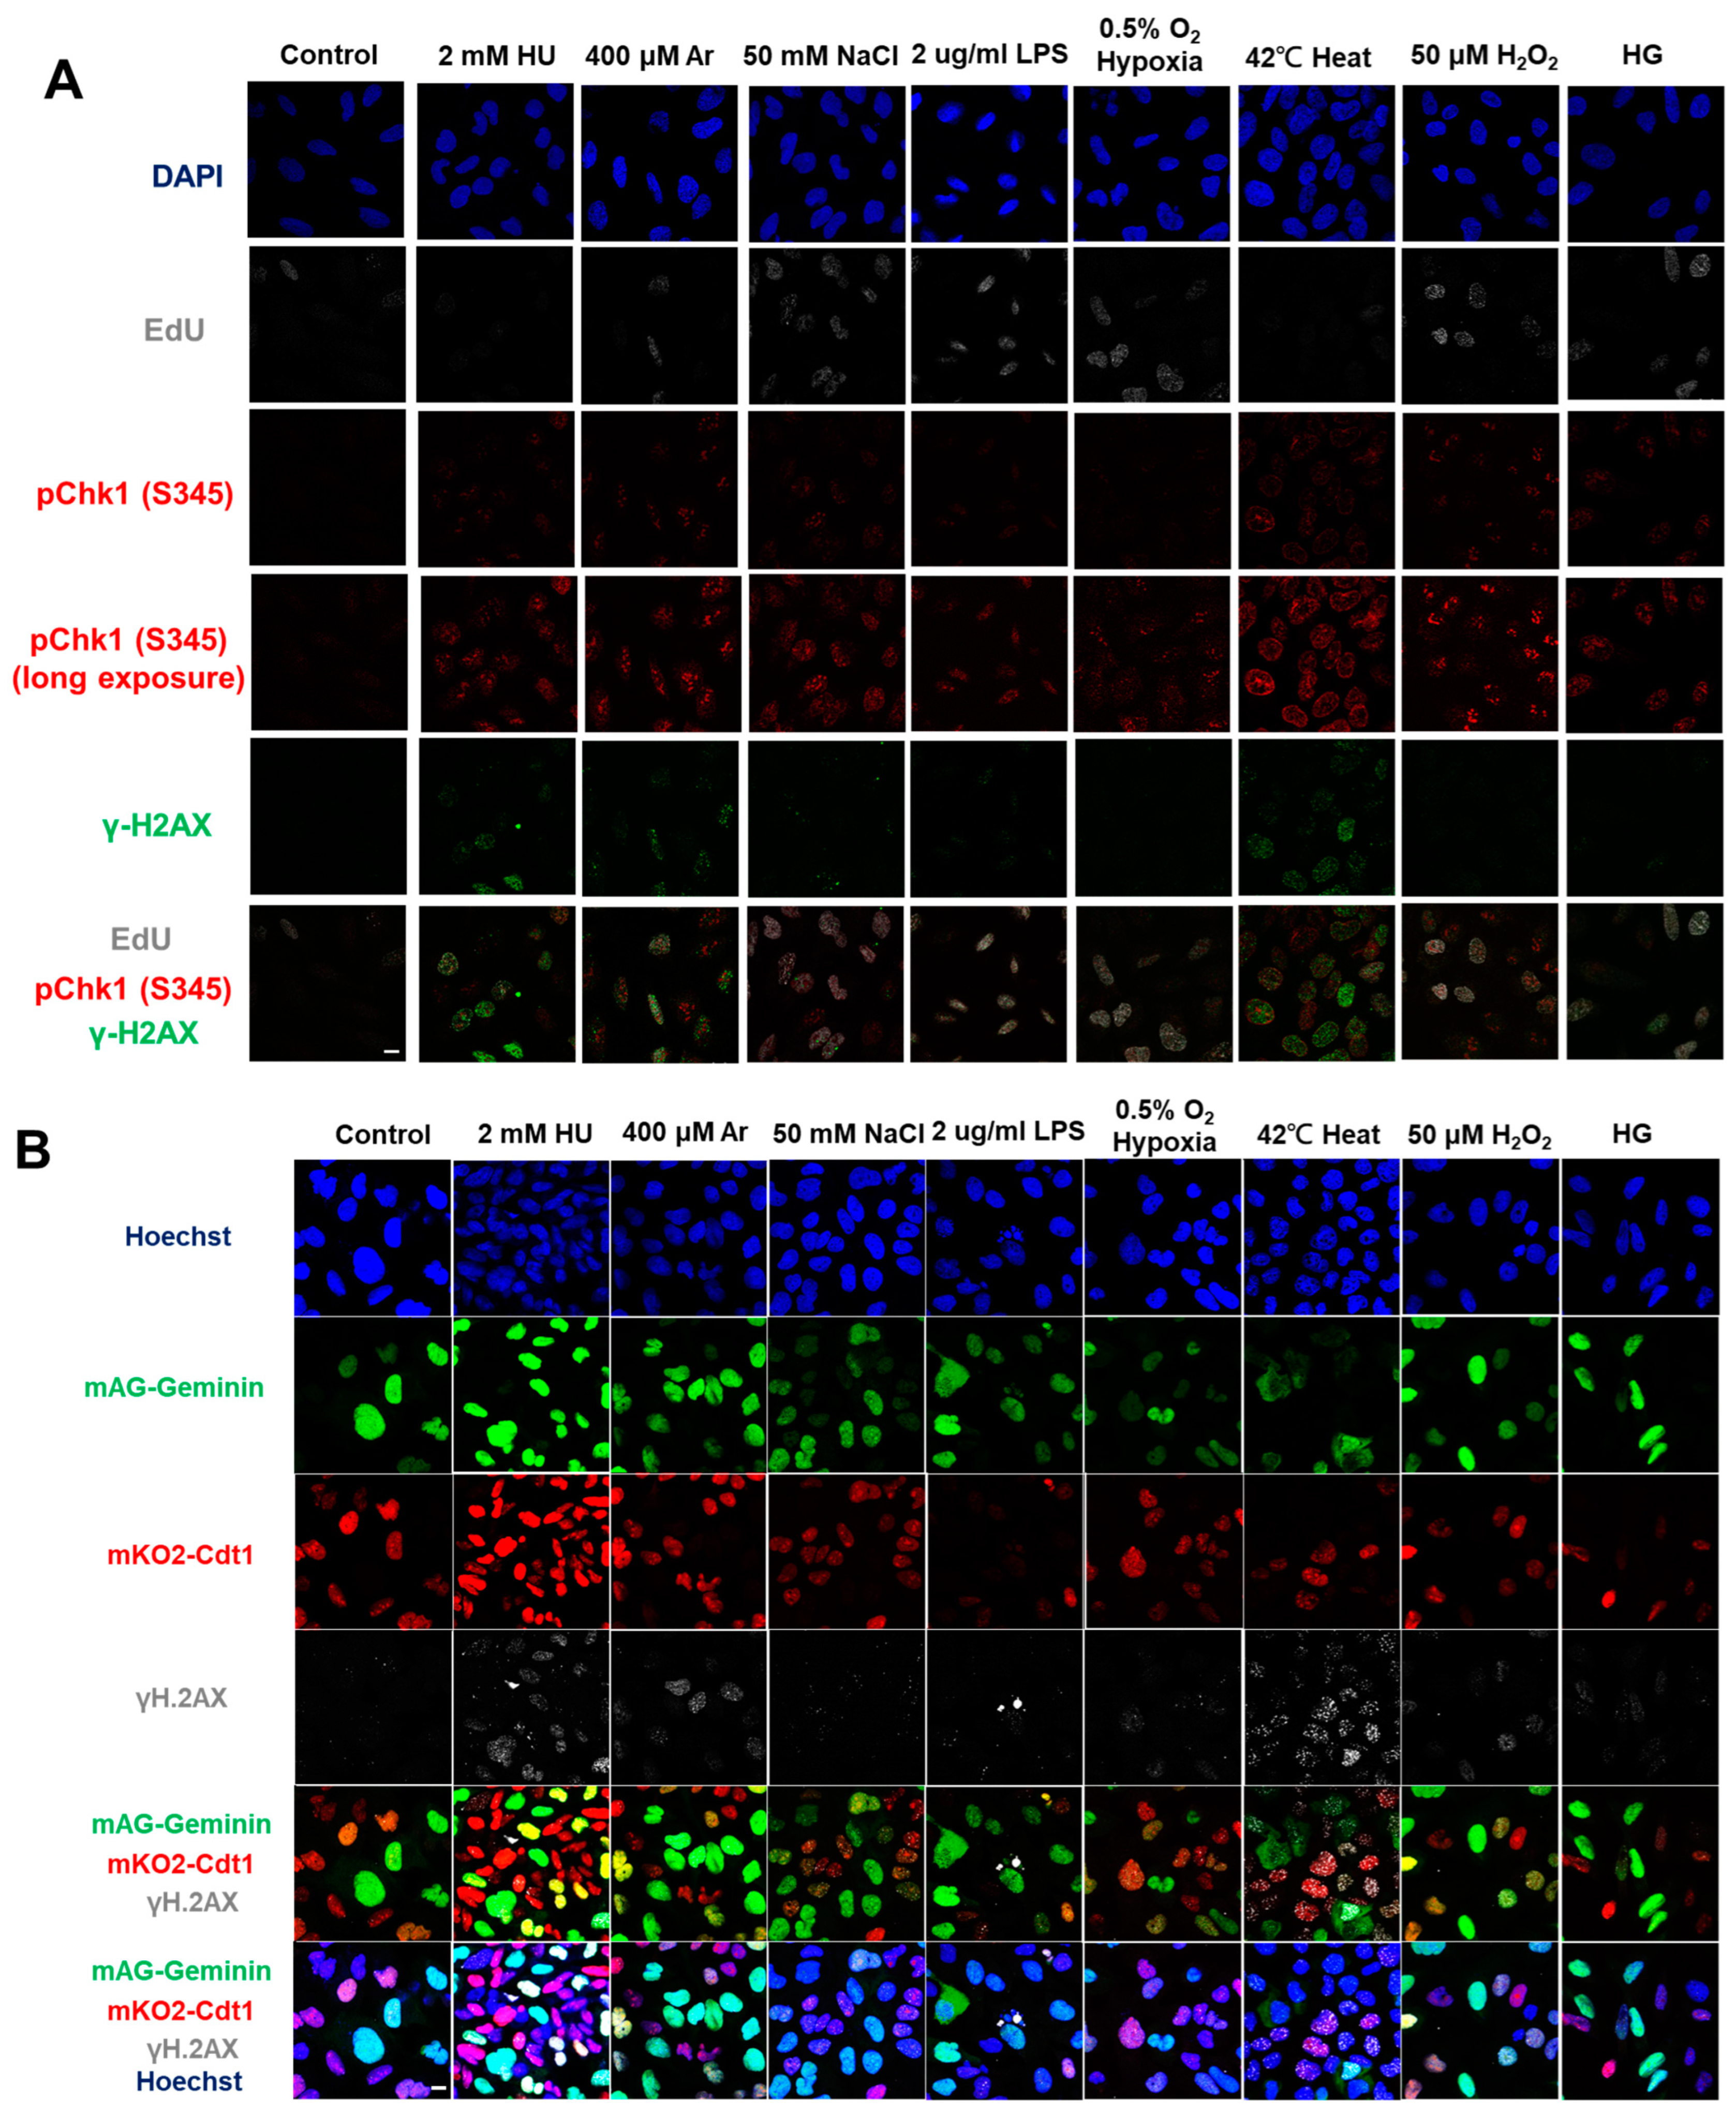
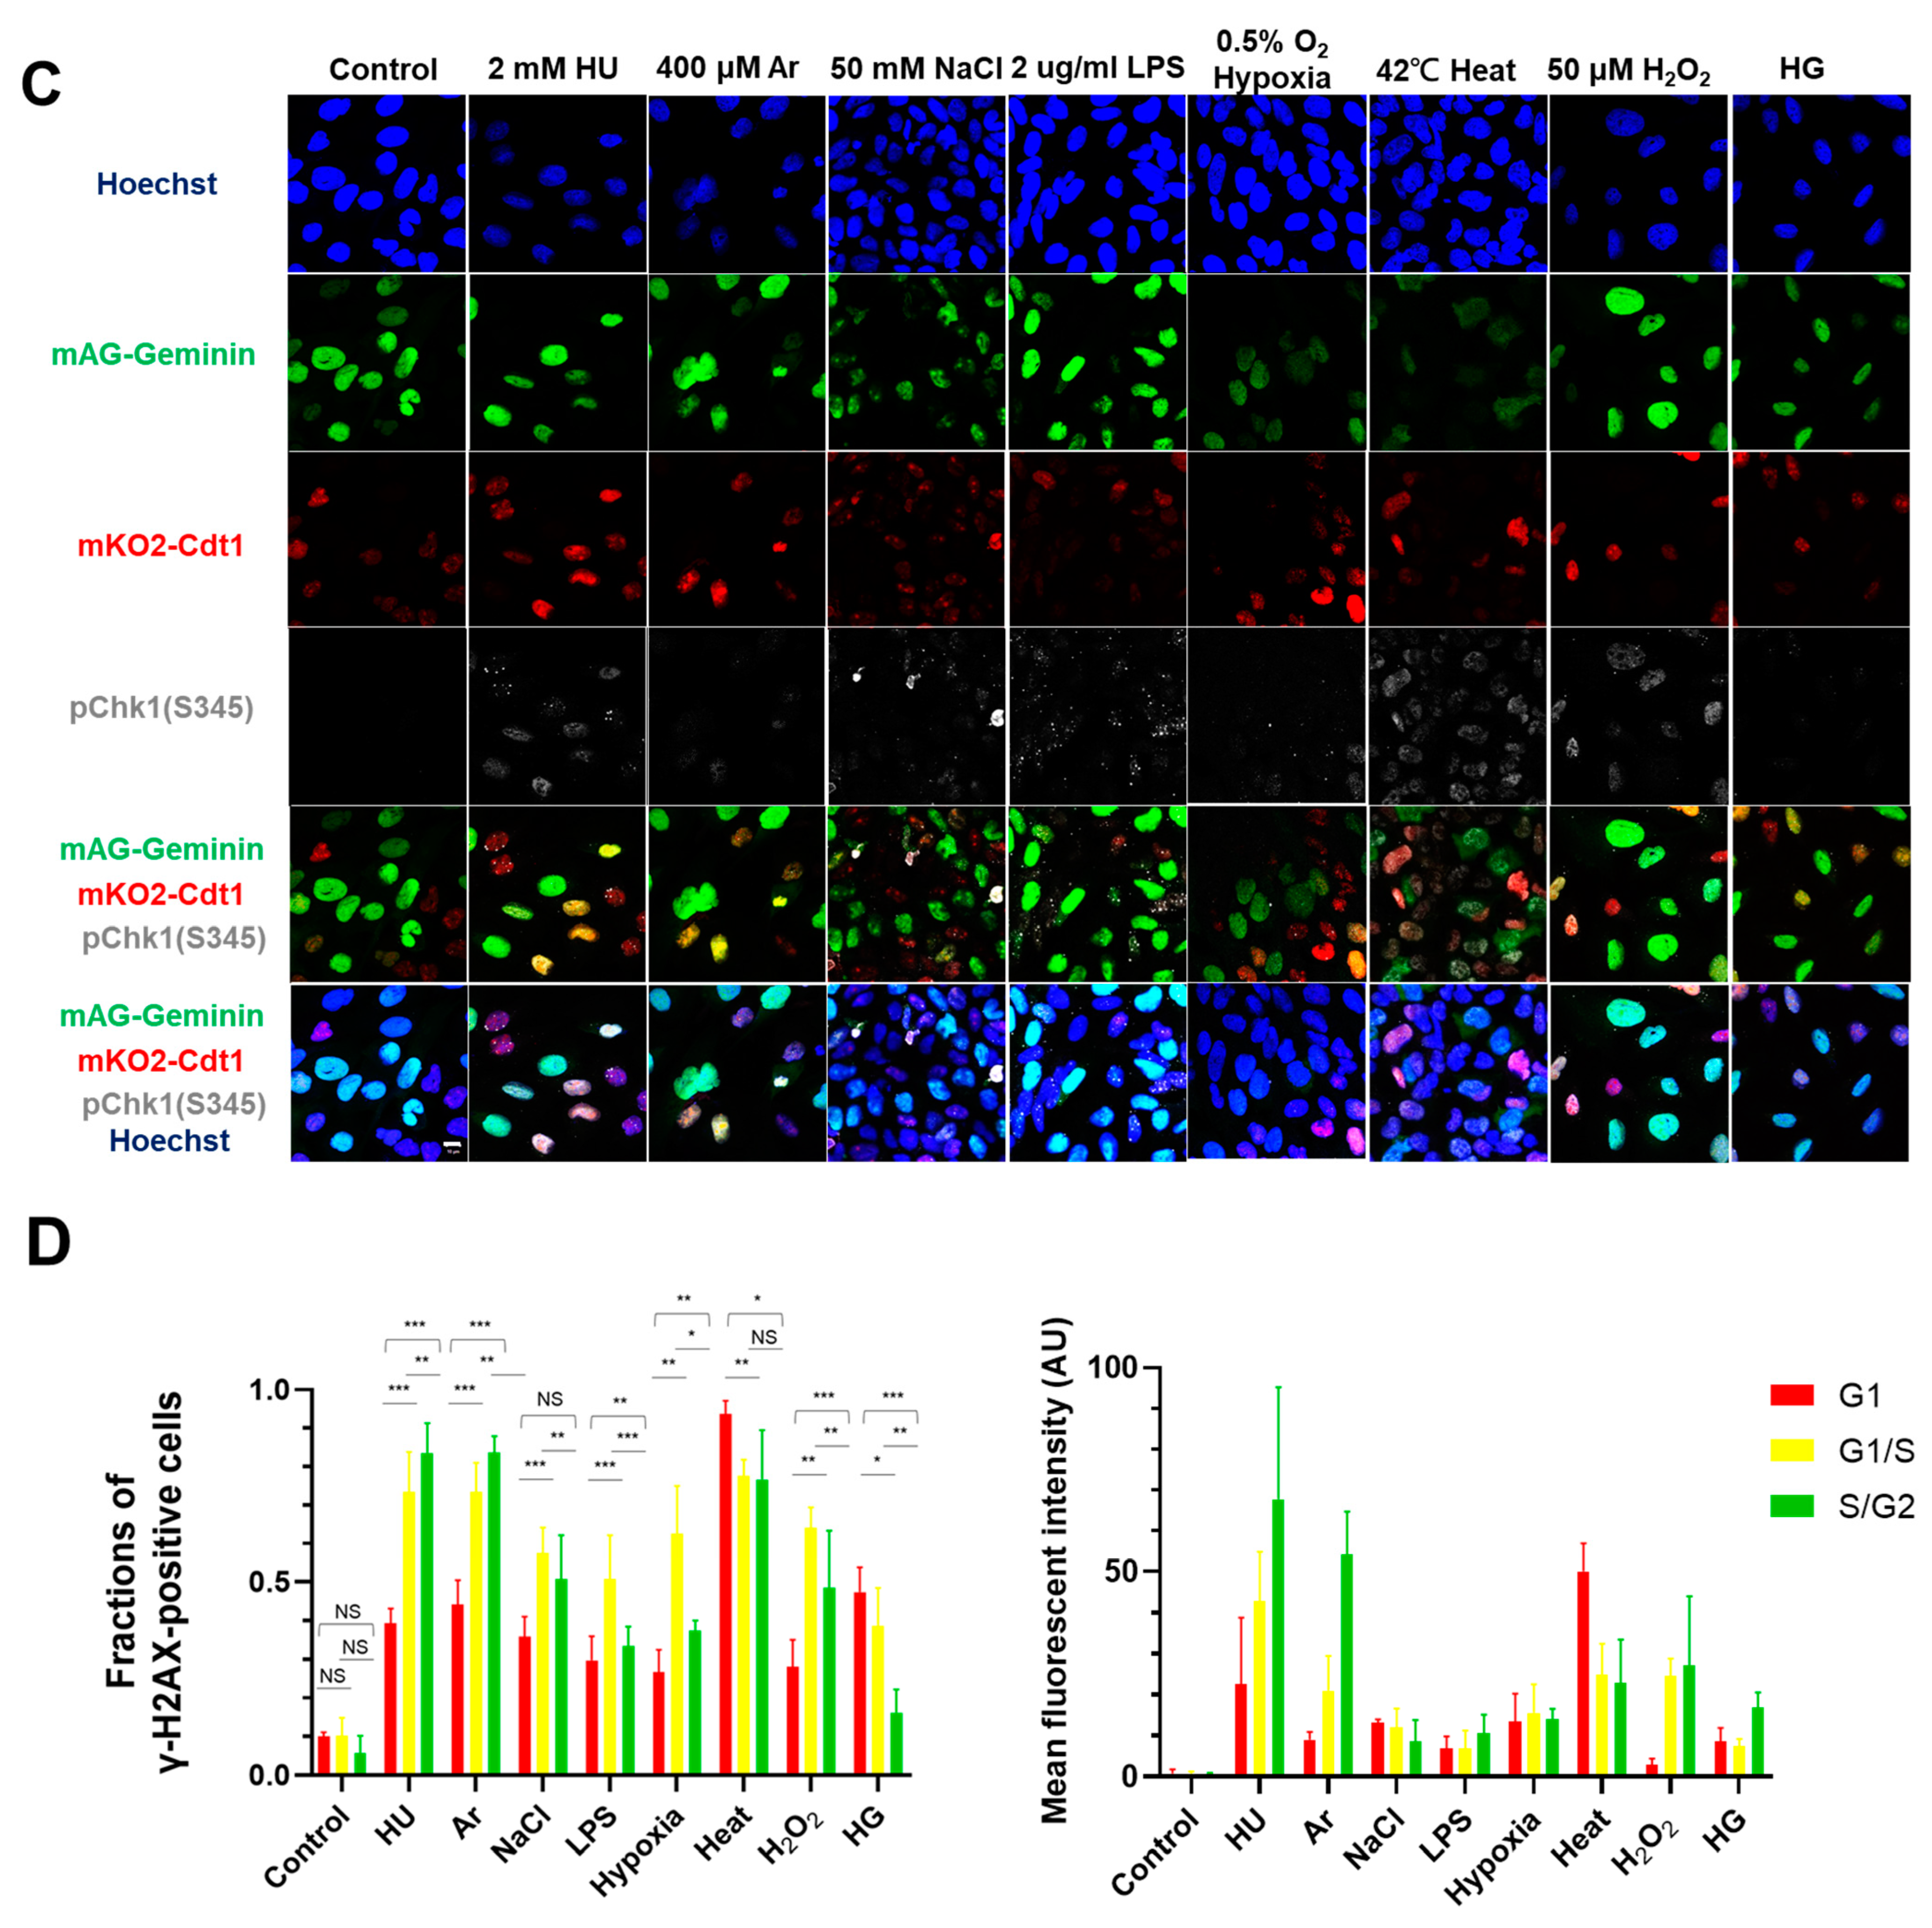
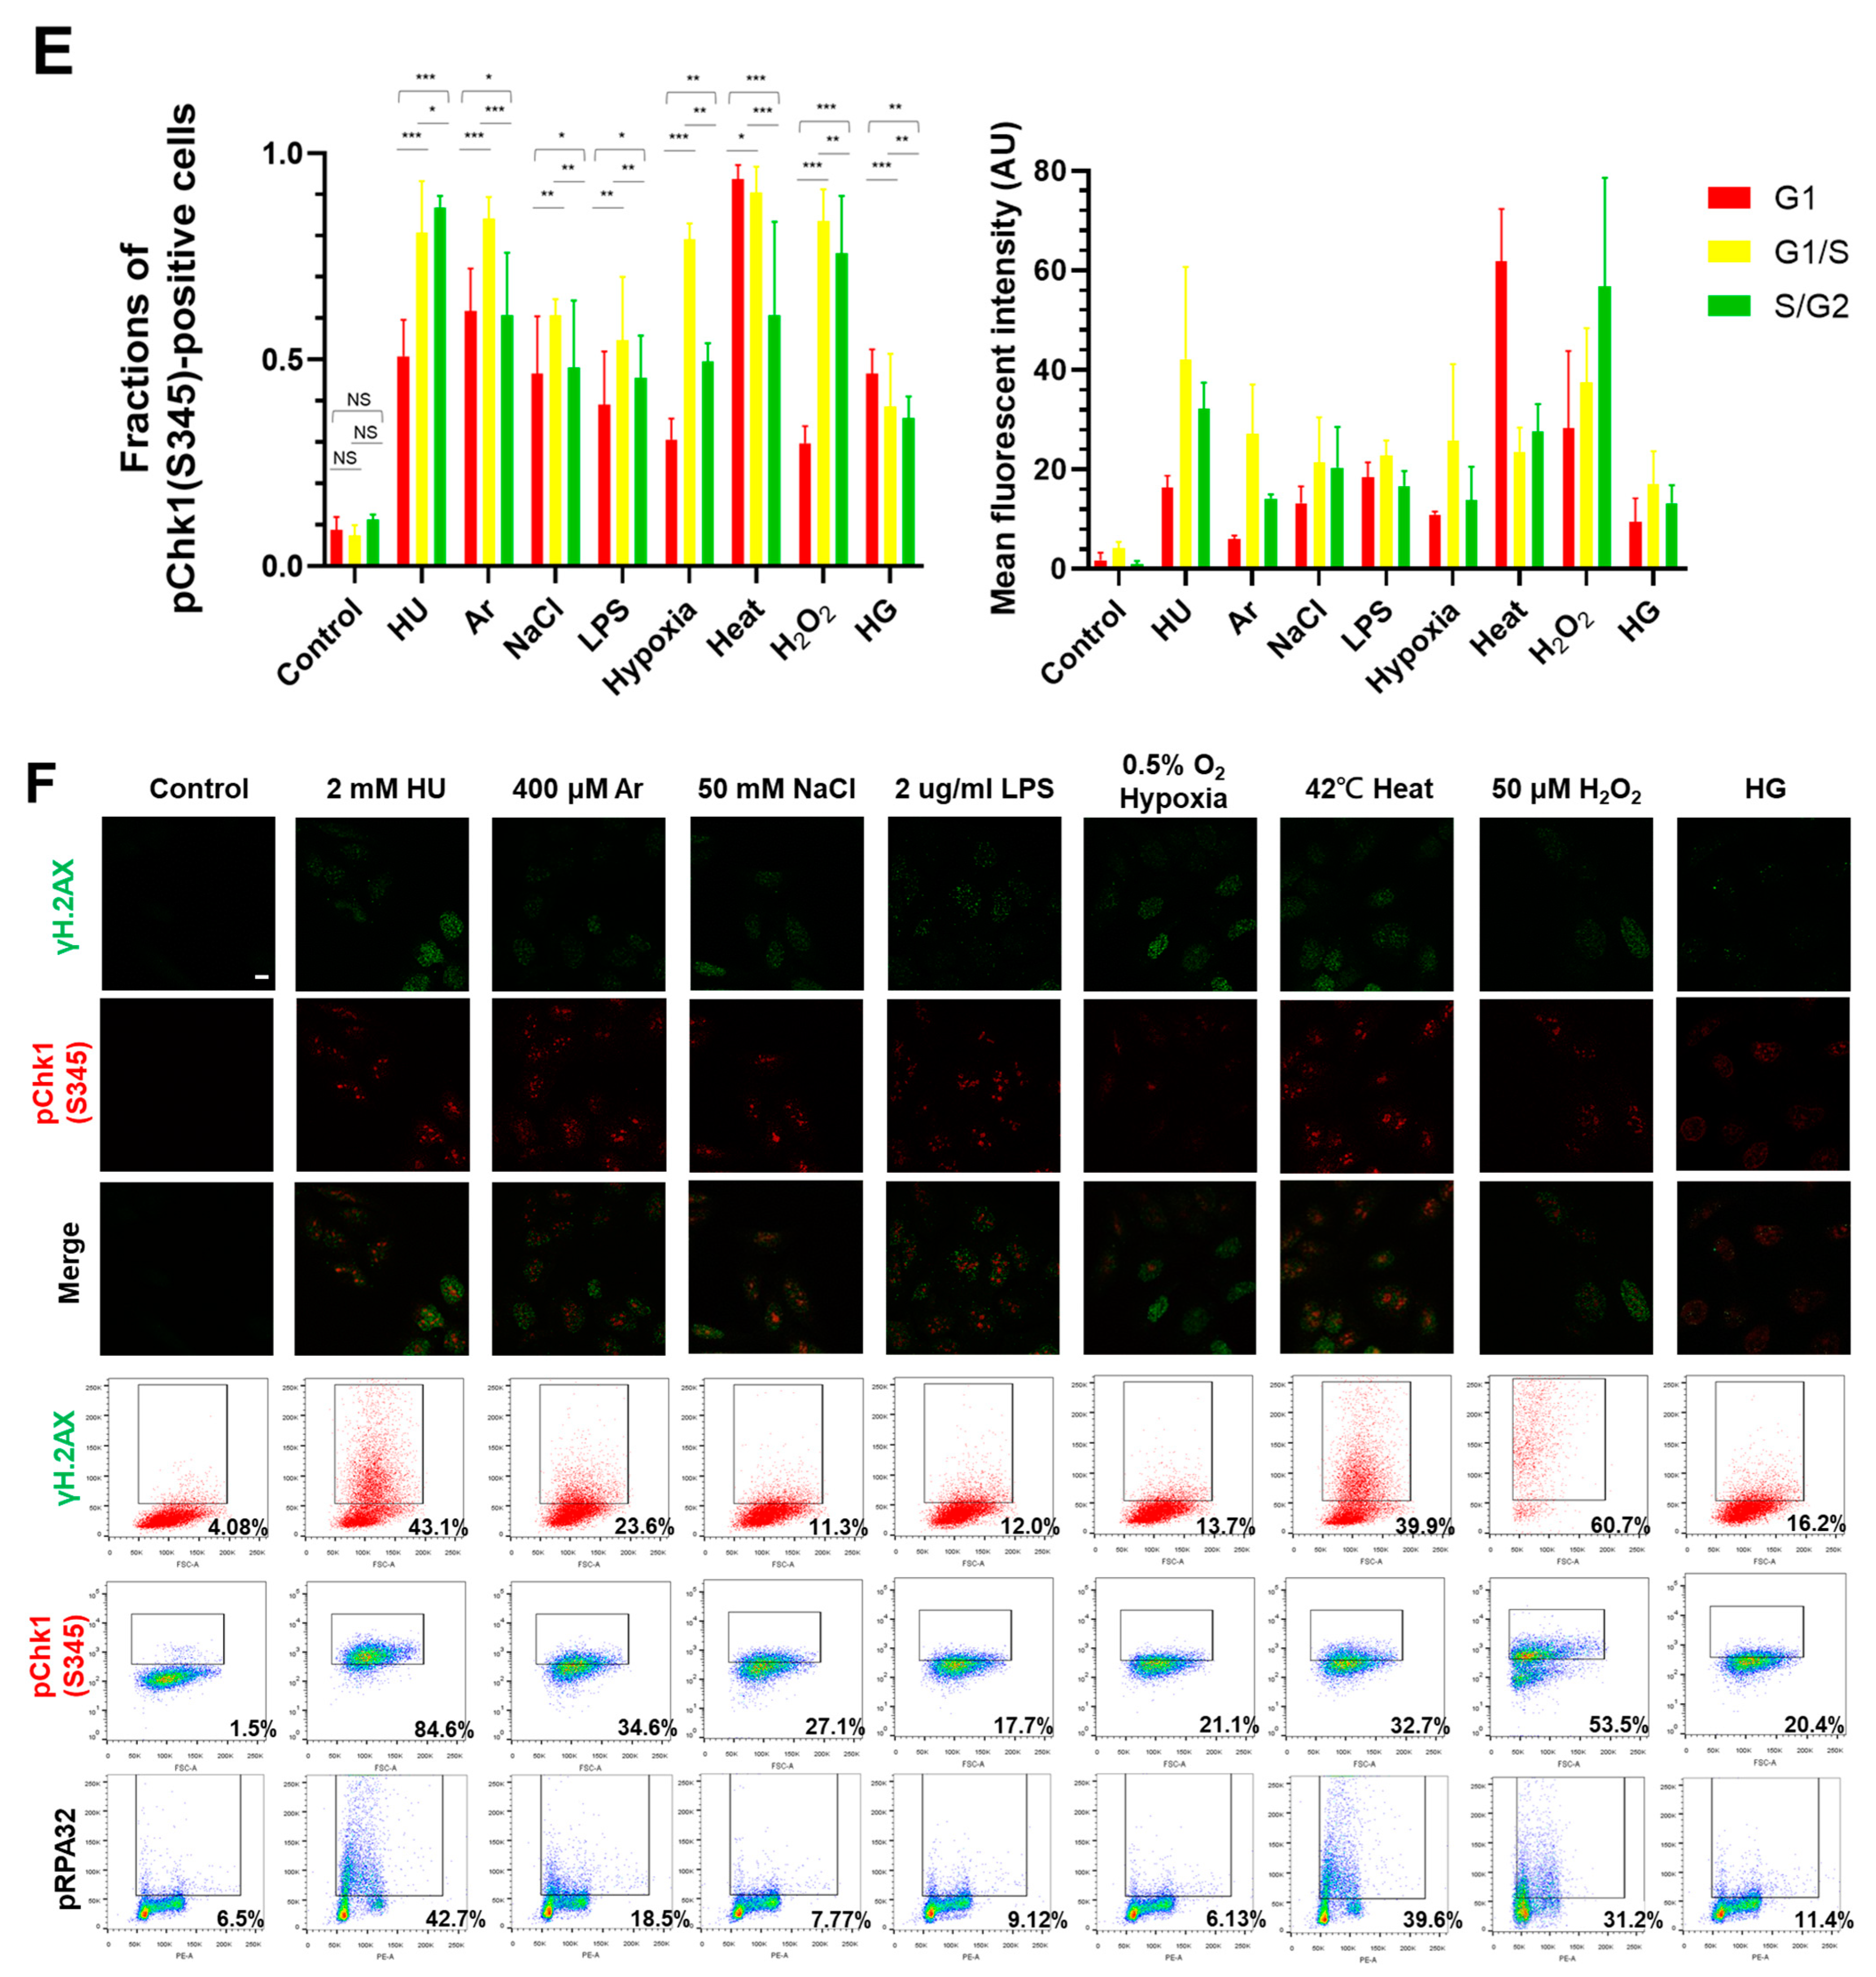
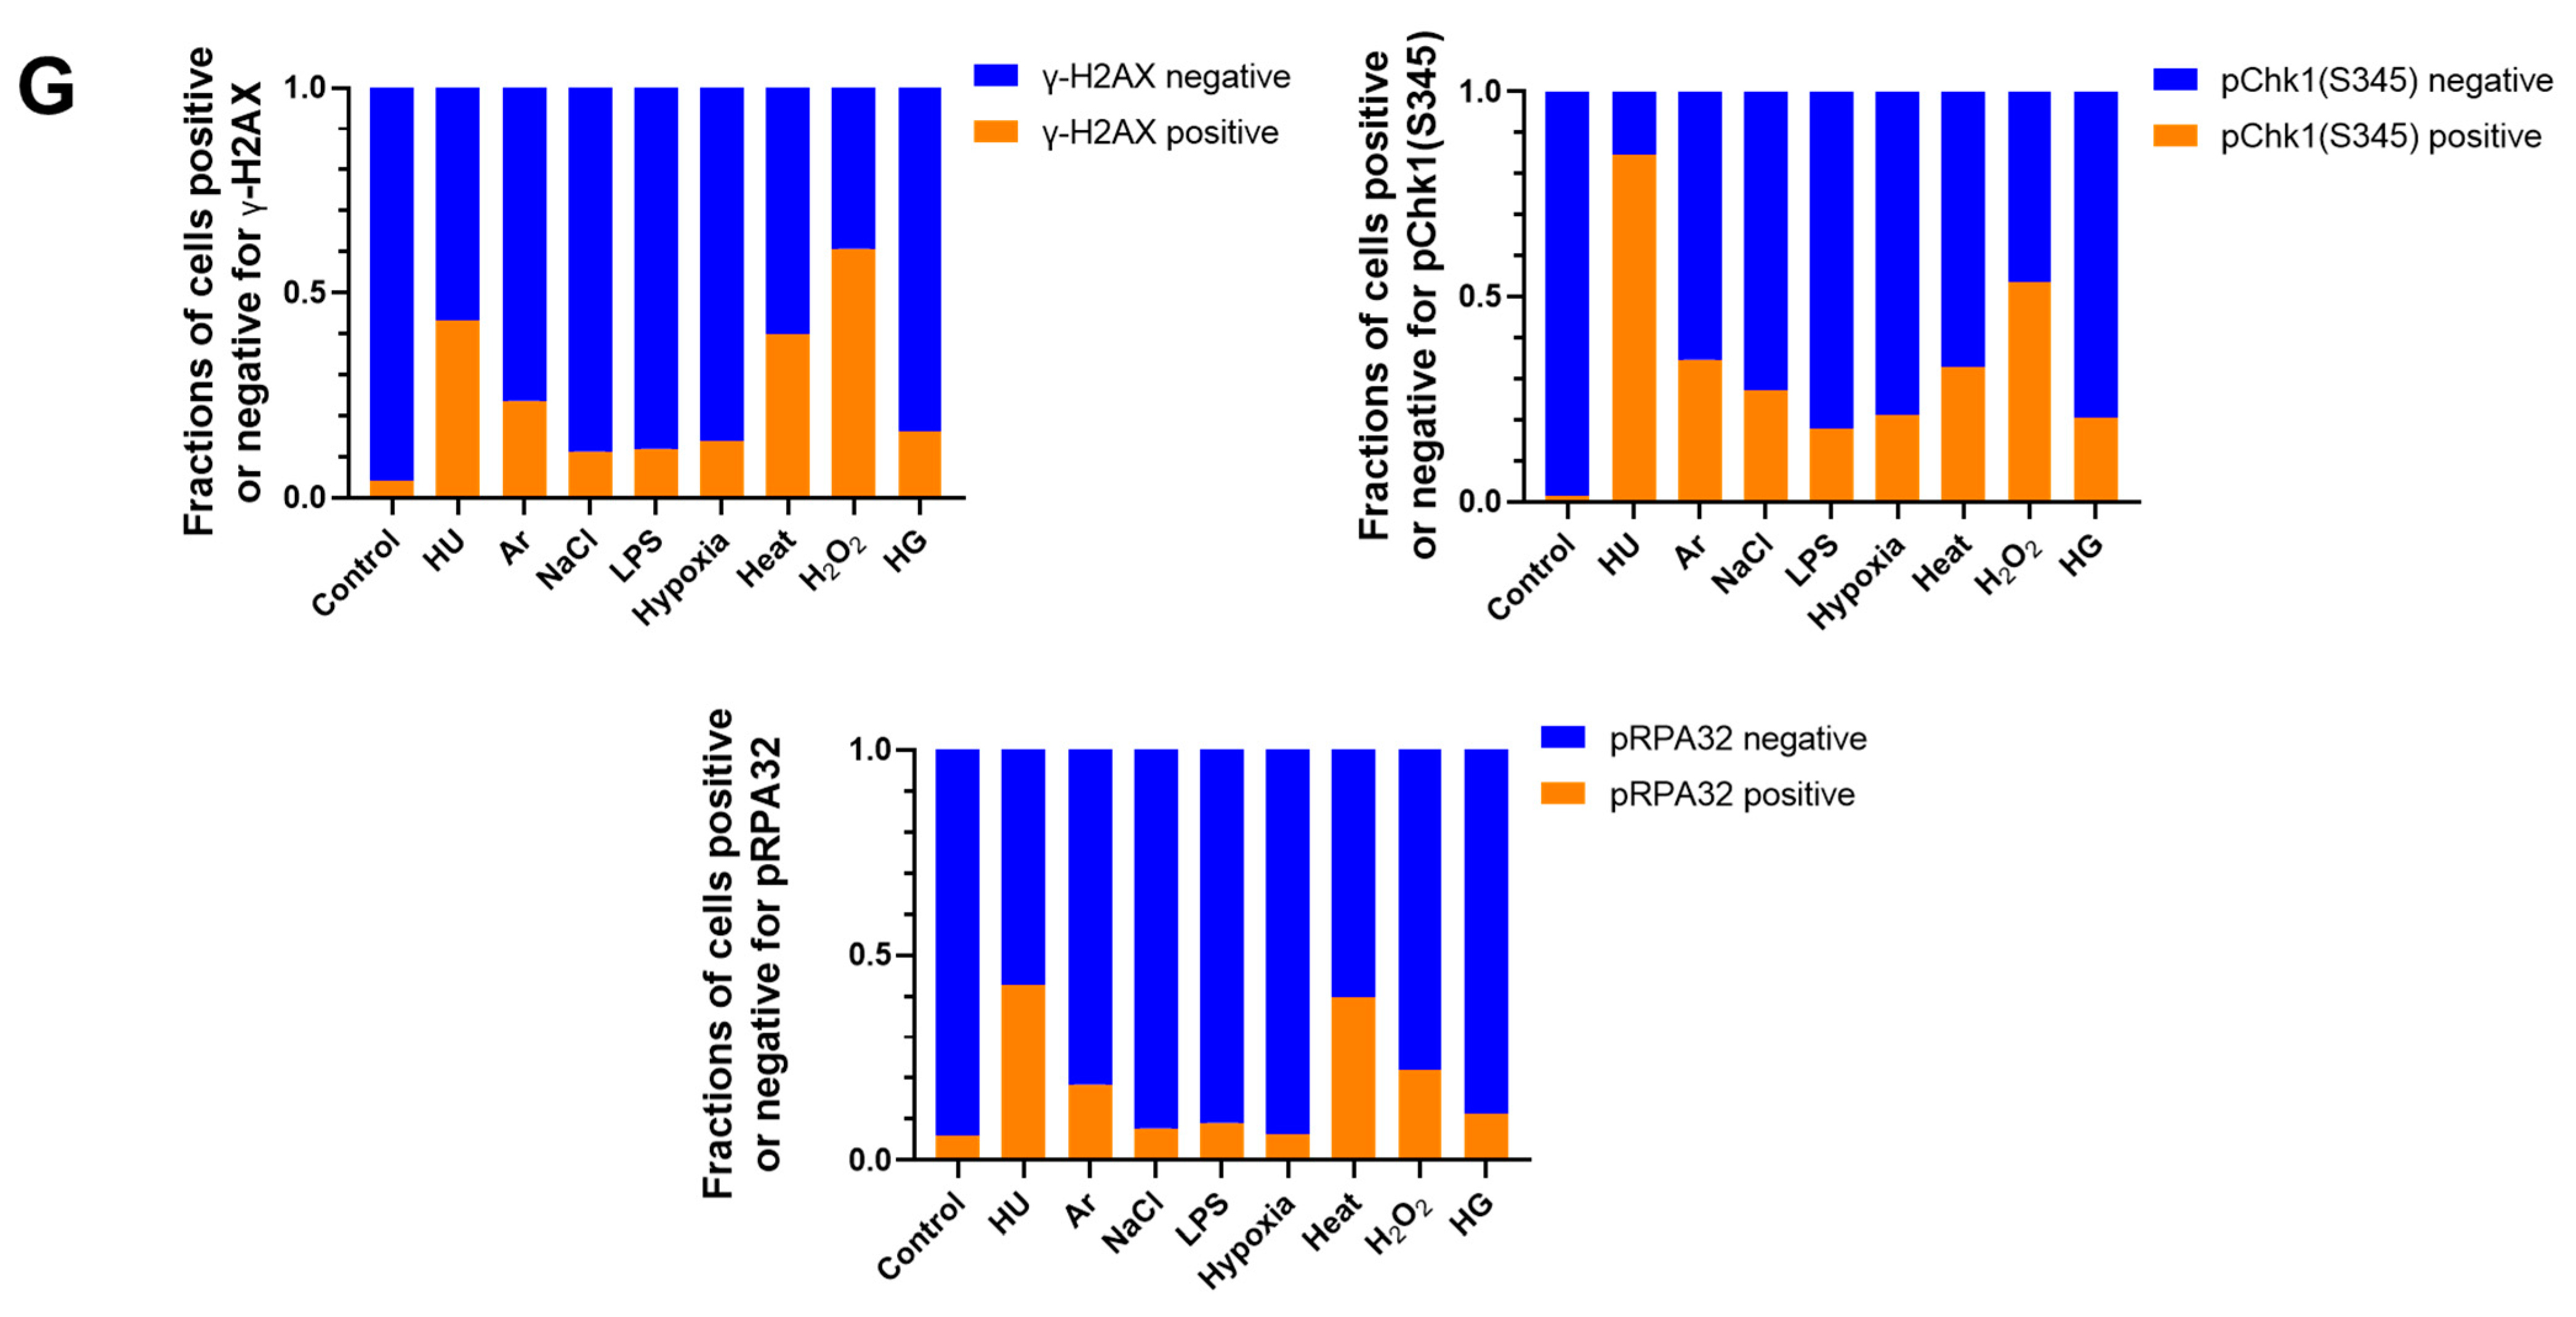
Differential effects on DNA replication and induction of DNA damage and replication checkpoint in a cell-cycle stage-dependent manner by various cellular stresses. (A) U2OS cells were exposed to indicated cellular stresses for 3 h, EdU-labeled for 15 min, and stained with indicated markers. Cells were then visualized and analyzed by confocal microscopy (Zeiss LSM780). Representative images are shown. Scale bar is 10 µm. Blue, DAPI (DNA); white, EdU (DNA synthesis); red, pChk1(S345) (replication checkpoint); green, γ-H2AX(DSB). A long-exposed version of pChk1 (S345) is also shown. (B,C) U2OS Fucci cells were exposed to indicated cellular stresses for 3 h and subjected to immunostaining. Cells were then analyzed by confocal microscopy (Zeiss LSM780). Representative images are shown. Scale bar is 10 μm. Blue, Hoechst (DNA); green, geminin (S/G2 marker): red, Cdt1 (G1 marker); white, γ-H2AX; yellow in the merged image, G1/S boundary. (D,E) Left: Fractions of U2OS Fucci cells containing γ-H2AX (D) and pChk1(S345) (E) foci were quantified for each cell-cycle population. Right: The mean fluorescent intensity of γ-H2AX (D) and pChk1(S345) (E) was quantified for each cell-cycle population. AU: arbitrary unit. (F) U2OS cells were exposed to different stresses for 3 h, and then were subjected to γ-H2AX (green), pChk1(S345) (red), and pRPA32 (S4/8) (phosphorylated single-stranded DNA binding protein representing DNA damage) staining, together with flow cytometry analyses. For γ-H2AX (green) and pChk1(S345) (red), cells were observed under confocal microscopy (Zeiss LSM780). Representative data and images are shown. Scale bar is 10 μm. (G) Quantification of the data from (F,G), fractions of γ-H2AX, pChk1(S345), or pRPA32 (S4/8)-positive populations are indicated for cells exposed to various stresses. Statistical analyses in (D,E) represent the mean values ± SEM under two independent experiments, all of which included three replicates (* p < 0.05, ** p < 0.01, *** p < 0.001, ns: no significant difference).
Figure 1.
Differential effects on DNA replication and induction of DNA damage and replication checkpoint in a cell-cycle stage-dependent manner by various cellular stresses. (A) U2OS cells were exposed to indicated cellular stresses for 3 h, EdU-labeled for 15 min, and stained with indicated markers. Cells were then visualized and analyzed by confocal microscopy (Zeiss LSM780). Representative images are shown. Scale bar is 10 µm. Blue, DAPI (DNA); white, EdU (DNA synthesis); red, pChk1(S345) (replication checkpoint); green, γ-H2AX(DSB). A long-exposed version of pChk1 (S345) is also shown. (B,C) U2OS Fucci cells were exposed to indicated cellular stresses for 3 h and subjected to immunostaining. Cells were then analyzed by confocal microscopy (Zeiss LSM780). Representative images are shown. Scale bar is 10 μm. Blue, Hoechst (DNA); green, geminin (S/G2 marker): red, Cdt1 (G1 marker); white, γ-H2AX; yellow in the merged image, G1/S boundary. (D,E) Left: Fractions of U2OS Fucci cells containing γ-H2AX (D) and pChk1(S345) (E) foci were quantified for each cell-cycle population. Right: The mean fluorescent intensity of γ-H2AX (D) and pChk1(S345) (E) was quantified for each cell-cycle population. AU: arbitrary unit. (F) U2OS cells were exposed to different stresses for 3 h, and then were subjected to γ-H2AX (green), pChk1(S345) (red), and pRPA32 (S4/8) (phosphorylated single-stranded DNA binding protein representing DNA damage) staining, together with flow cytometry analyses. For γ-H2AX (green) and pChk1(S345) (red), cells were observed under confocal microscopy (Zeiss LSM780). Representative data and images are shown. Scale bar is 10 μm. (G) Quantification of the data from (F,G), fractions of γ-H2AX, pChk1(S345), or pRPA32 (S4/8)-positive populations are indicated for cells exposed to various stresses. Statistical analyses in (D,E) represent the mean values ± SEM under two independent experiments, all of which included three replicates (* p < 0.05, ** p < 0.01, *** p < 0.001, ns: no significant difference).

