Abstract
We present the first results of medium-band photometric observations on the 1m Schmidt Telescope of Byurakan Astrophysical Observatory (Armenia). The object sample was created in the SA68 field. The medium-band filter set (13 filters with FWHM = 250 Å + 5 broadband SDSS filters) allowed us to create low-resolution spectra of each object in the SA68 field. We compared them with the template spectra to select AGNs and to determine their photometric redshifts. Our sample consists of 330 objects with 0.5–5.1 redshift range and complete up to 23.0 AB magnitude. The comparison of our sample with SDSS DR10 and BOSS + MMT QSO showed that sufficiently more objects in the 3.2–5.1 redshift range were found.
1. Introduction
In studies of quasar evolution we need to create a homogeneous sample of objects. The wide variety of methods to obtain such samples exists, and the most commonly used ones are described below.
1.1. Radio Surveys
Radio surveys are very powerful for searching AGN and were the original method of QSO selection. It works well at high luminosities, since almost all luminous radio sources are active nuclei. Additionally, the significant part of radio galaxies shows no strong evidence of non-thermal activity [1]. On the other hand, only near 10% of all AGN are “radio loud,” so the radio samples are respectively incomplete. Furthermore, the ratio of bolometric luminosity to radio luminosity varies by a factor of 105, and the fraction of the total energy radiated in the radio is small [1].
1.2. X-ray Surveys
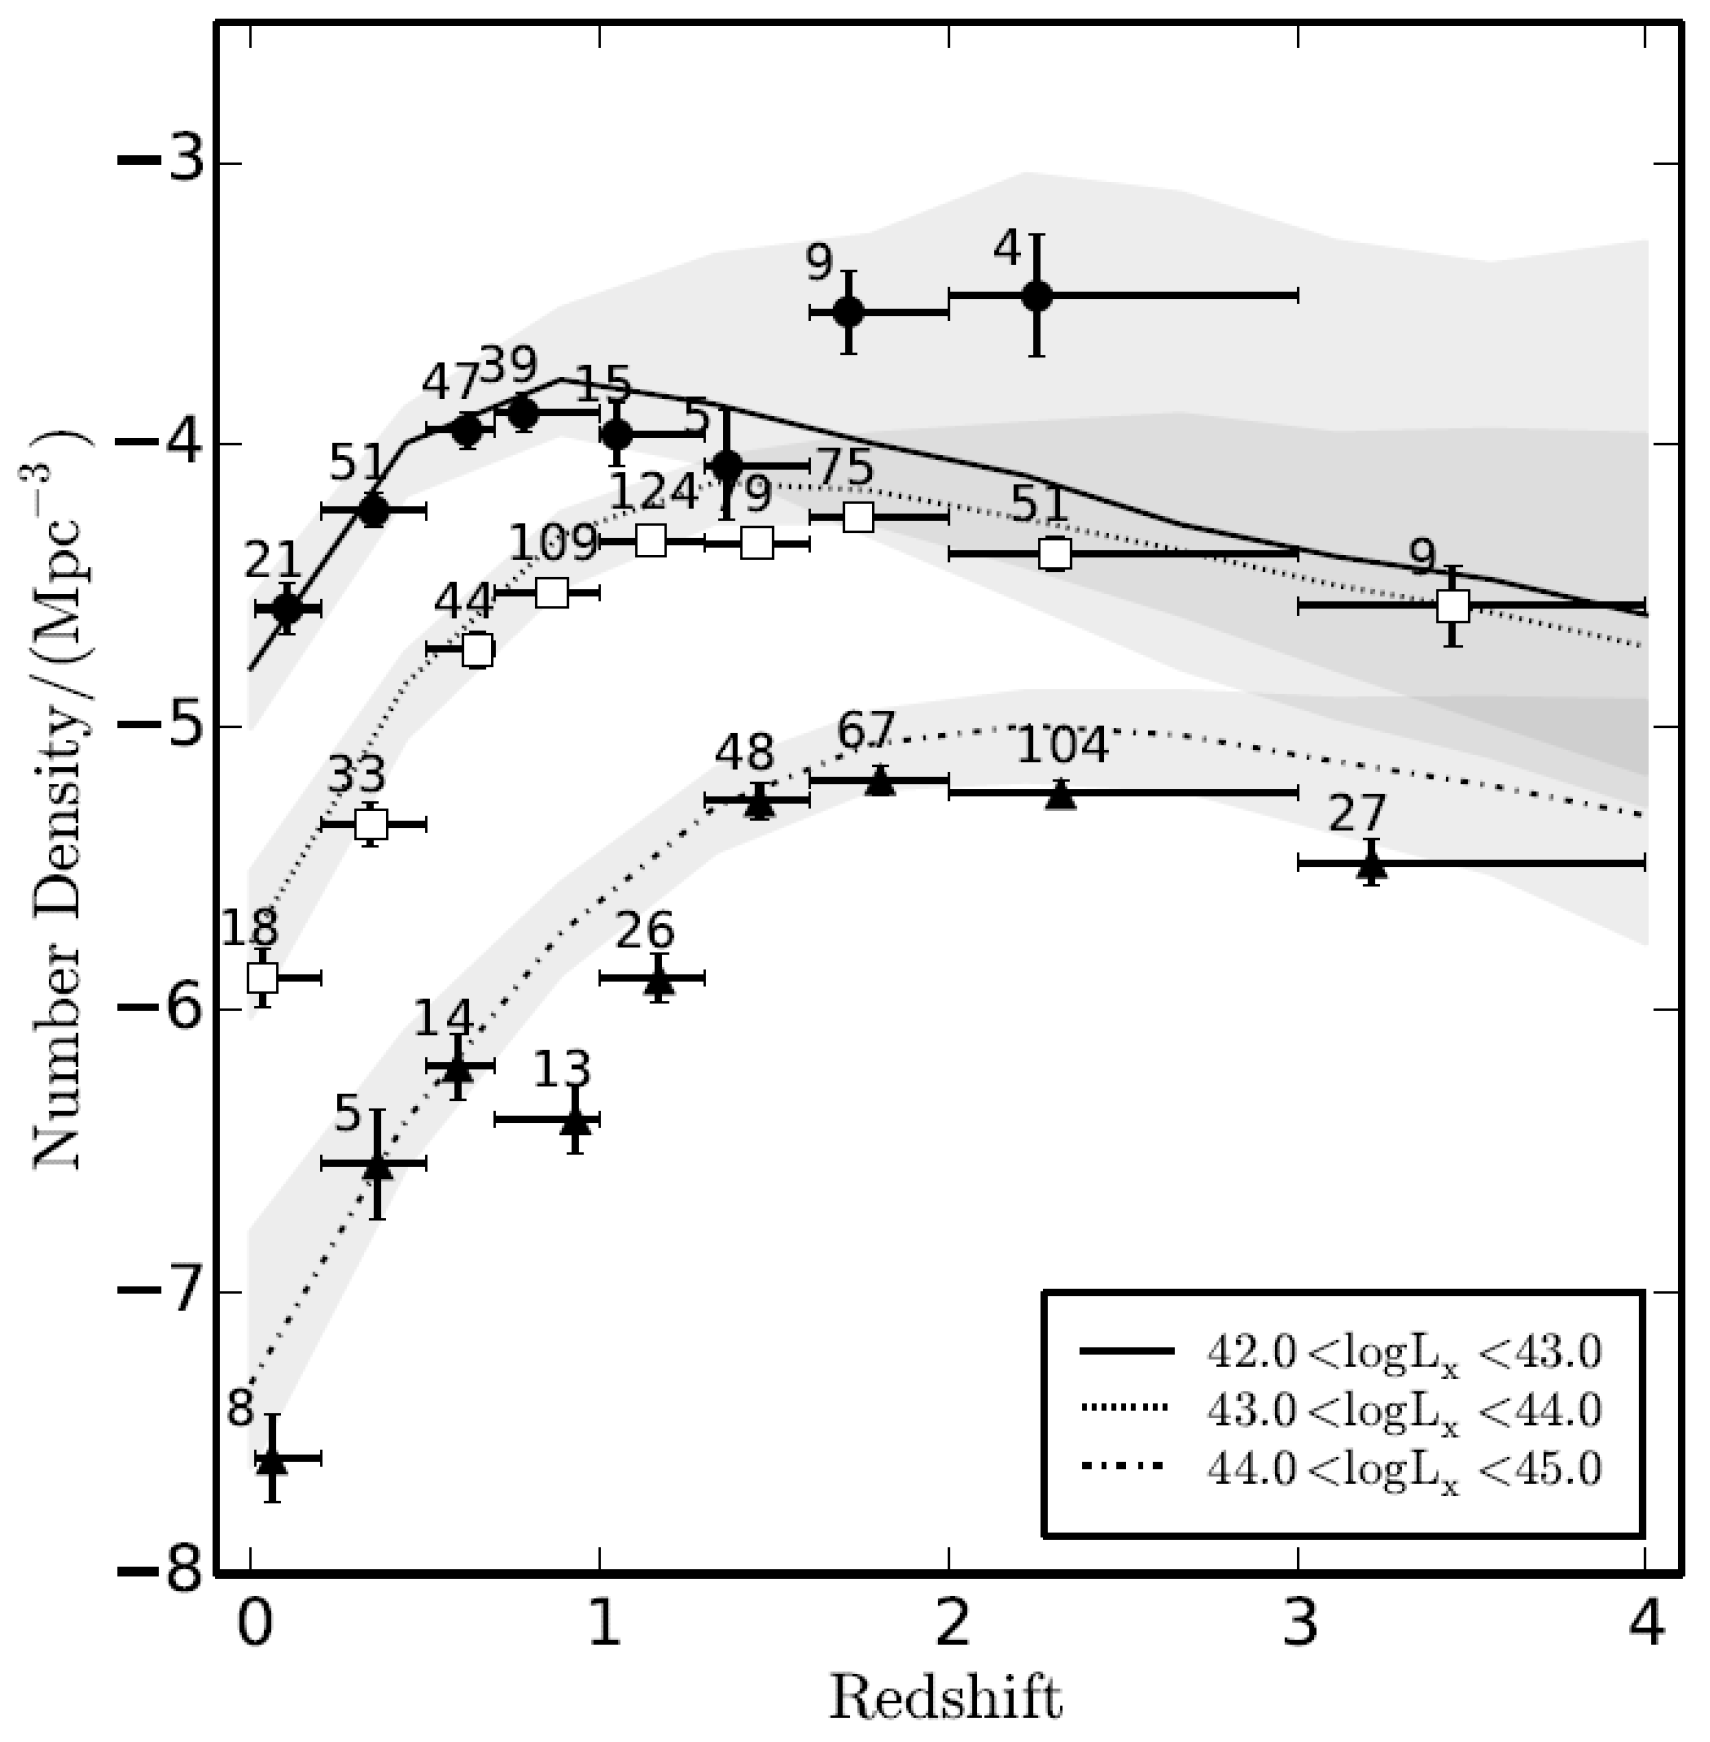
The X-ray advantage over the optical selection is that stars do not have high luminosities in this range; consequently, it greatly simplifies the selection of objects. However, to achieve sufficient depth for the detection of distant quasars, long exposure times are required, which is possible only in small fields. Thus, the samples consist of a small object number, and statistical studies based on them are not reliable (Figure 1) [2]. Additionally, the brightness of the quasars at the X-ray range strongly depends on the orientation of the active nucleus, that the part of the active nuclei in X-rays are faint for detection.
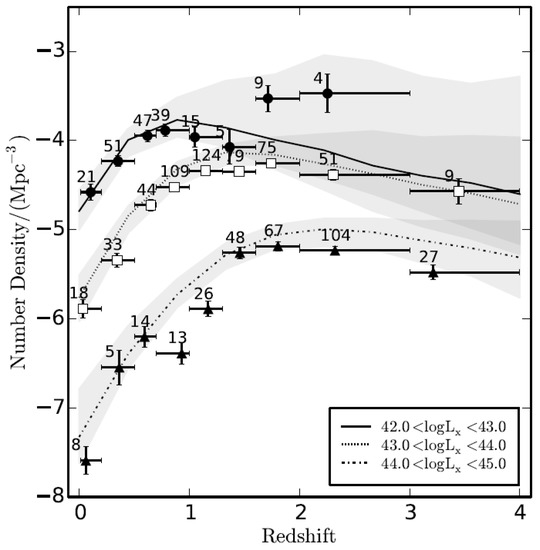
Figure 1.
The number density of quasars from X-ray data [2]. Solid, dashed, and dash-dotted lines show AGN number densities for different luminosity ranges.
1.3. Broadband Optical Photometry in the Combination with Infrared and Ultraviolet Surveys
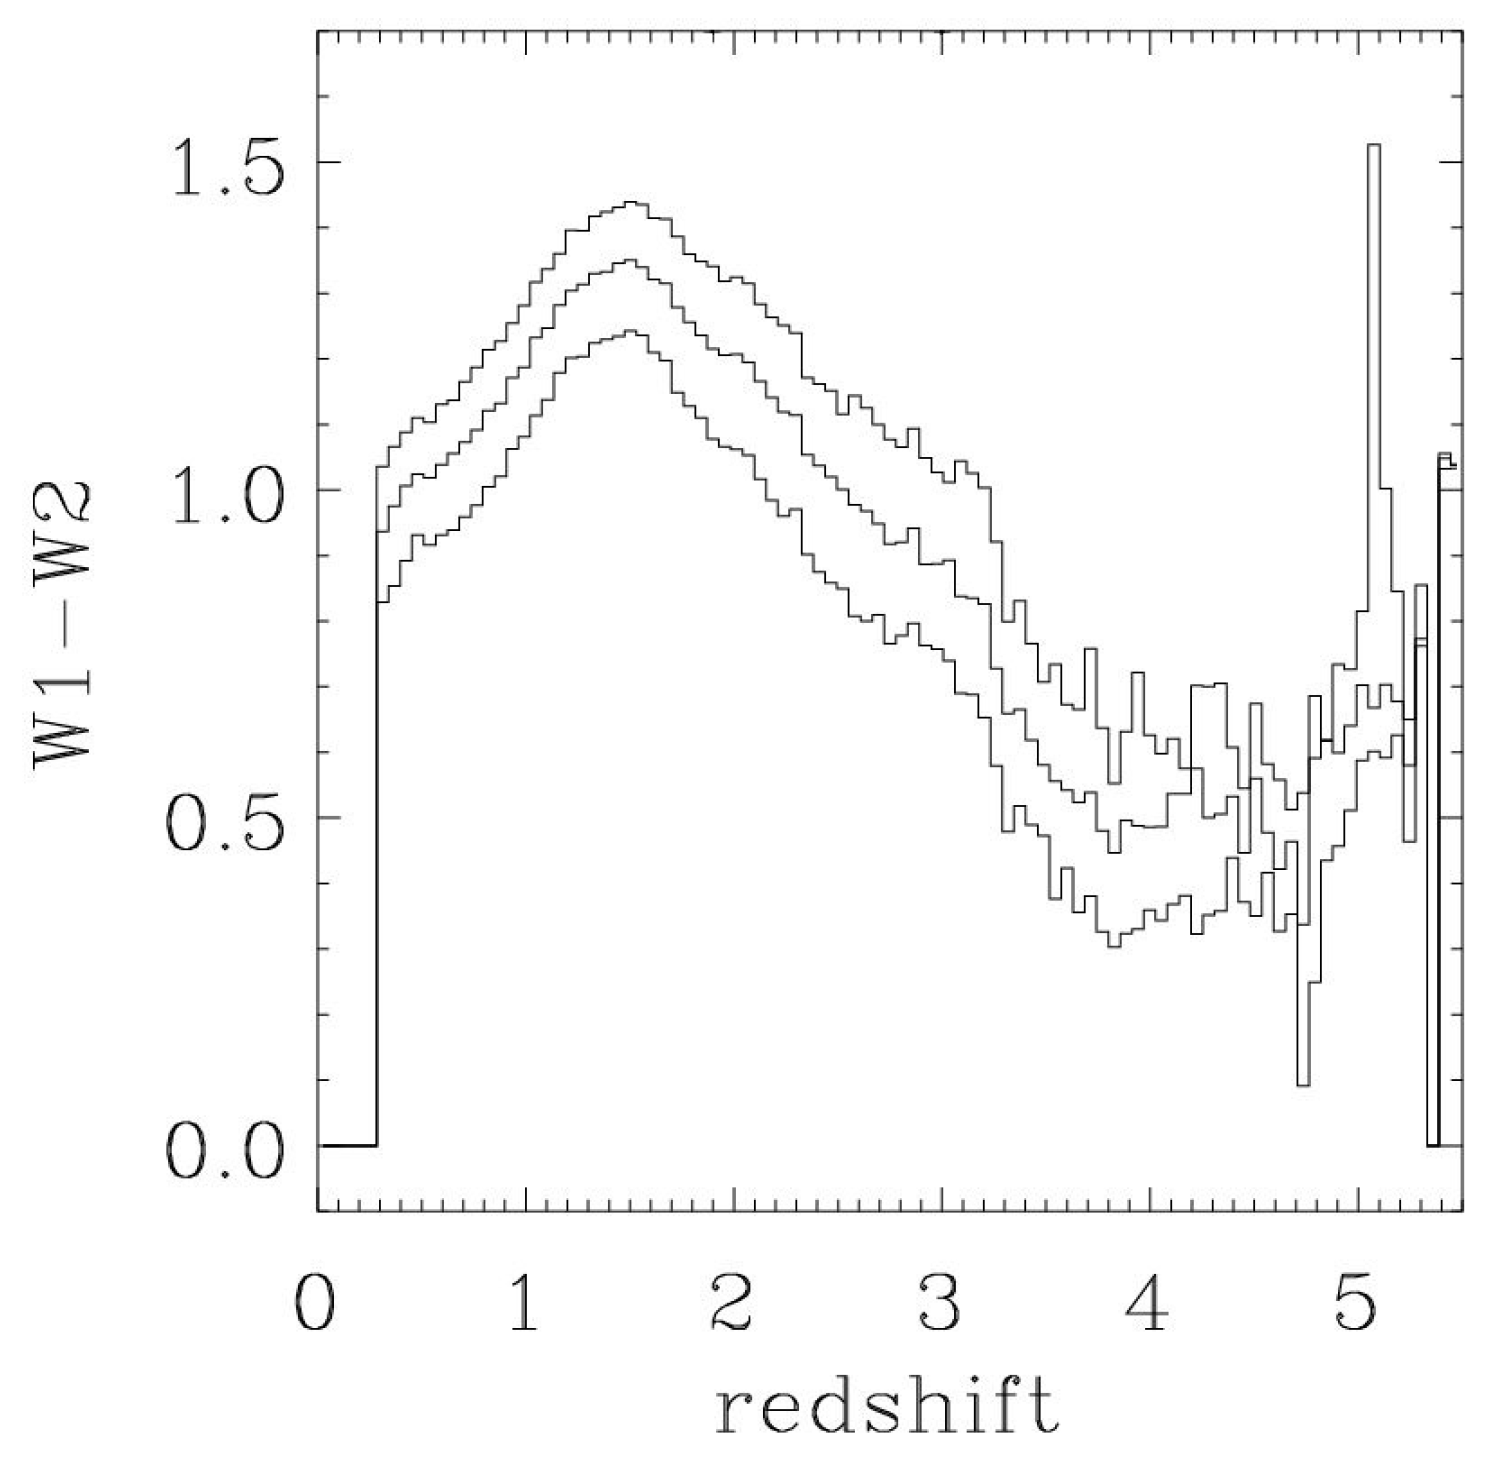
Broadband photometry as a method of active nuclei search has been used for approximately 50 years [3]. With a small number of broadband filters, observers can reach an appreciable depth with short exposure time and can classify field objects based on their color excesses. However, for quasar searching, this technique is confined: shifted emission lines, appearing in different filters, generate a large spread of values in the color space, and the ultraviolet excess does not reveal itself at z > 2.2. One possible solution is to supplement optical photometry with the data from infrared and ultraviolet surveys [4]. Yet, another difficulty is faced: one of the main selection criteria for the WISE infrared data (W1 − W2 > 0.8 proposed by [4]) stops working properly when z > 3 because a significant fraction of quasars is below this limit, which affects sample completeness (Figure 2) [5]. At large redshifts (z > 3), the Lyman break appears at the optical range, which theoretically makes it possible to separate quasars from stars. However, in practical terms, the color difference between two nearby broadband filters should be greater than 2m. Thus, for SDSS, at a magnitude limit of about 22m, we can reliably see this difference for objects no weaker than 20m, which allows us to observe only the brightest quasars at large redshifts. Active nuclei recorded with a lower signal-to-noise ratio are indistinguishable from red stars.
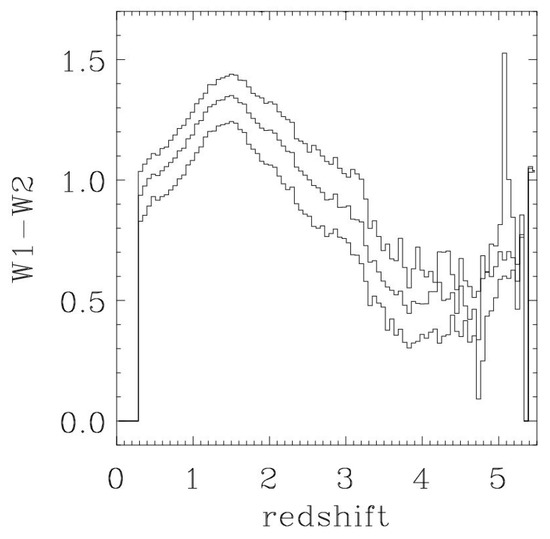
Figure 2.
The WISE infrared colors of AGNs. Central line shows averaged color-redshift diagram for selected AGNs; upper and lower lines shows data errors. It can be clearly seen that, for most quasars at z > 3, the W1 − W2 > 0.8 criterion is not met [5].
1.4. QSO Selection by Variability in the Optical Range
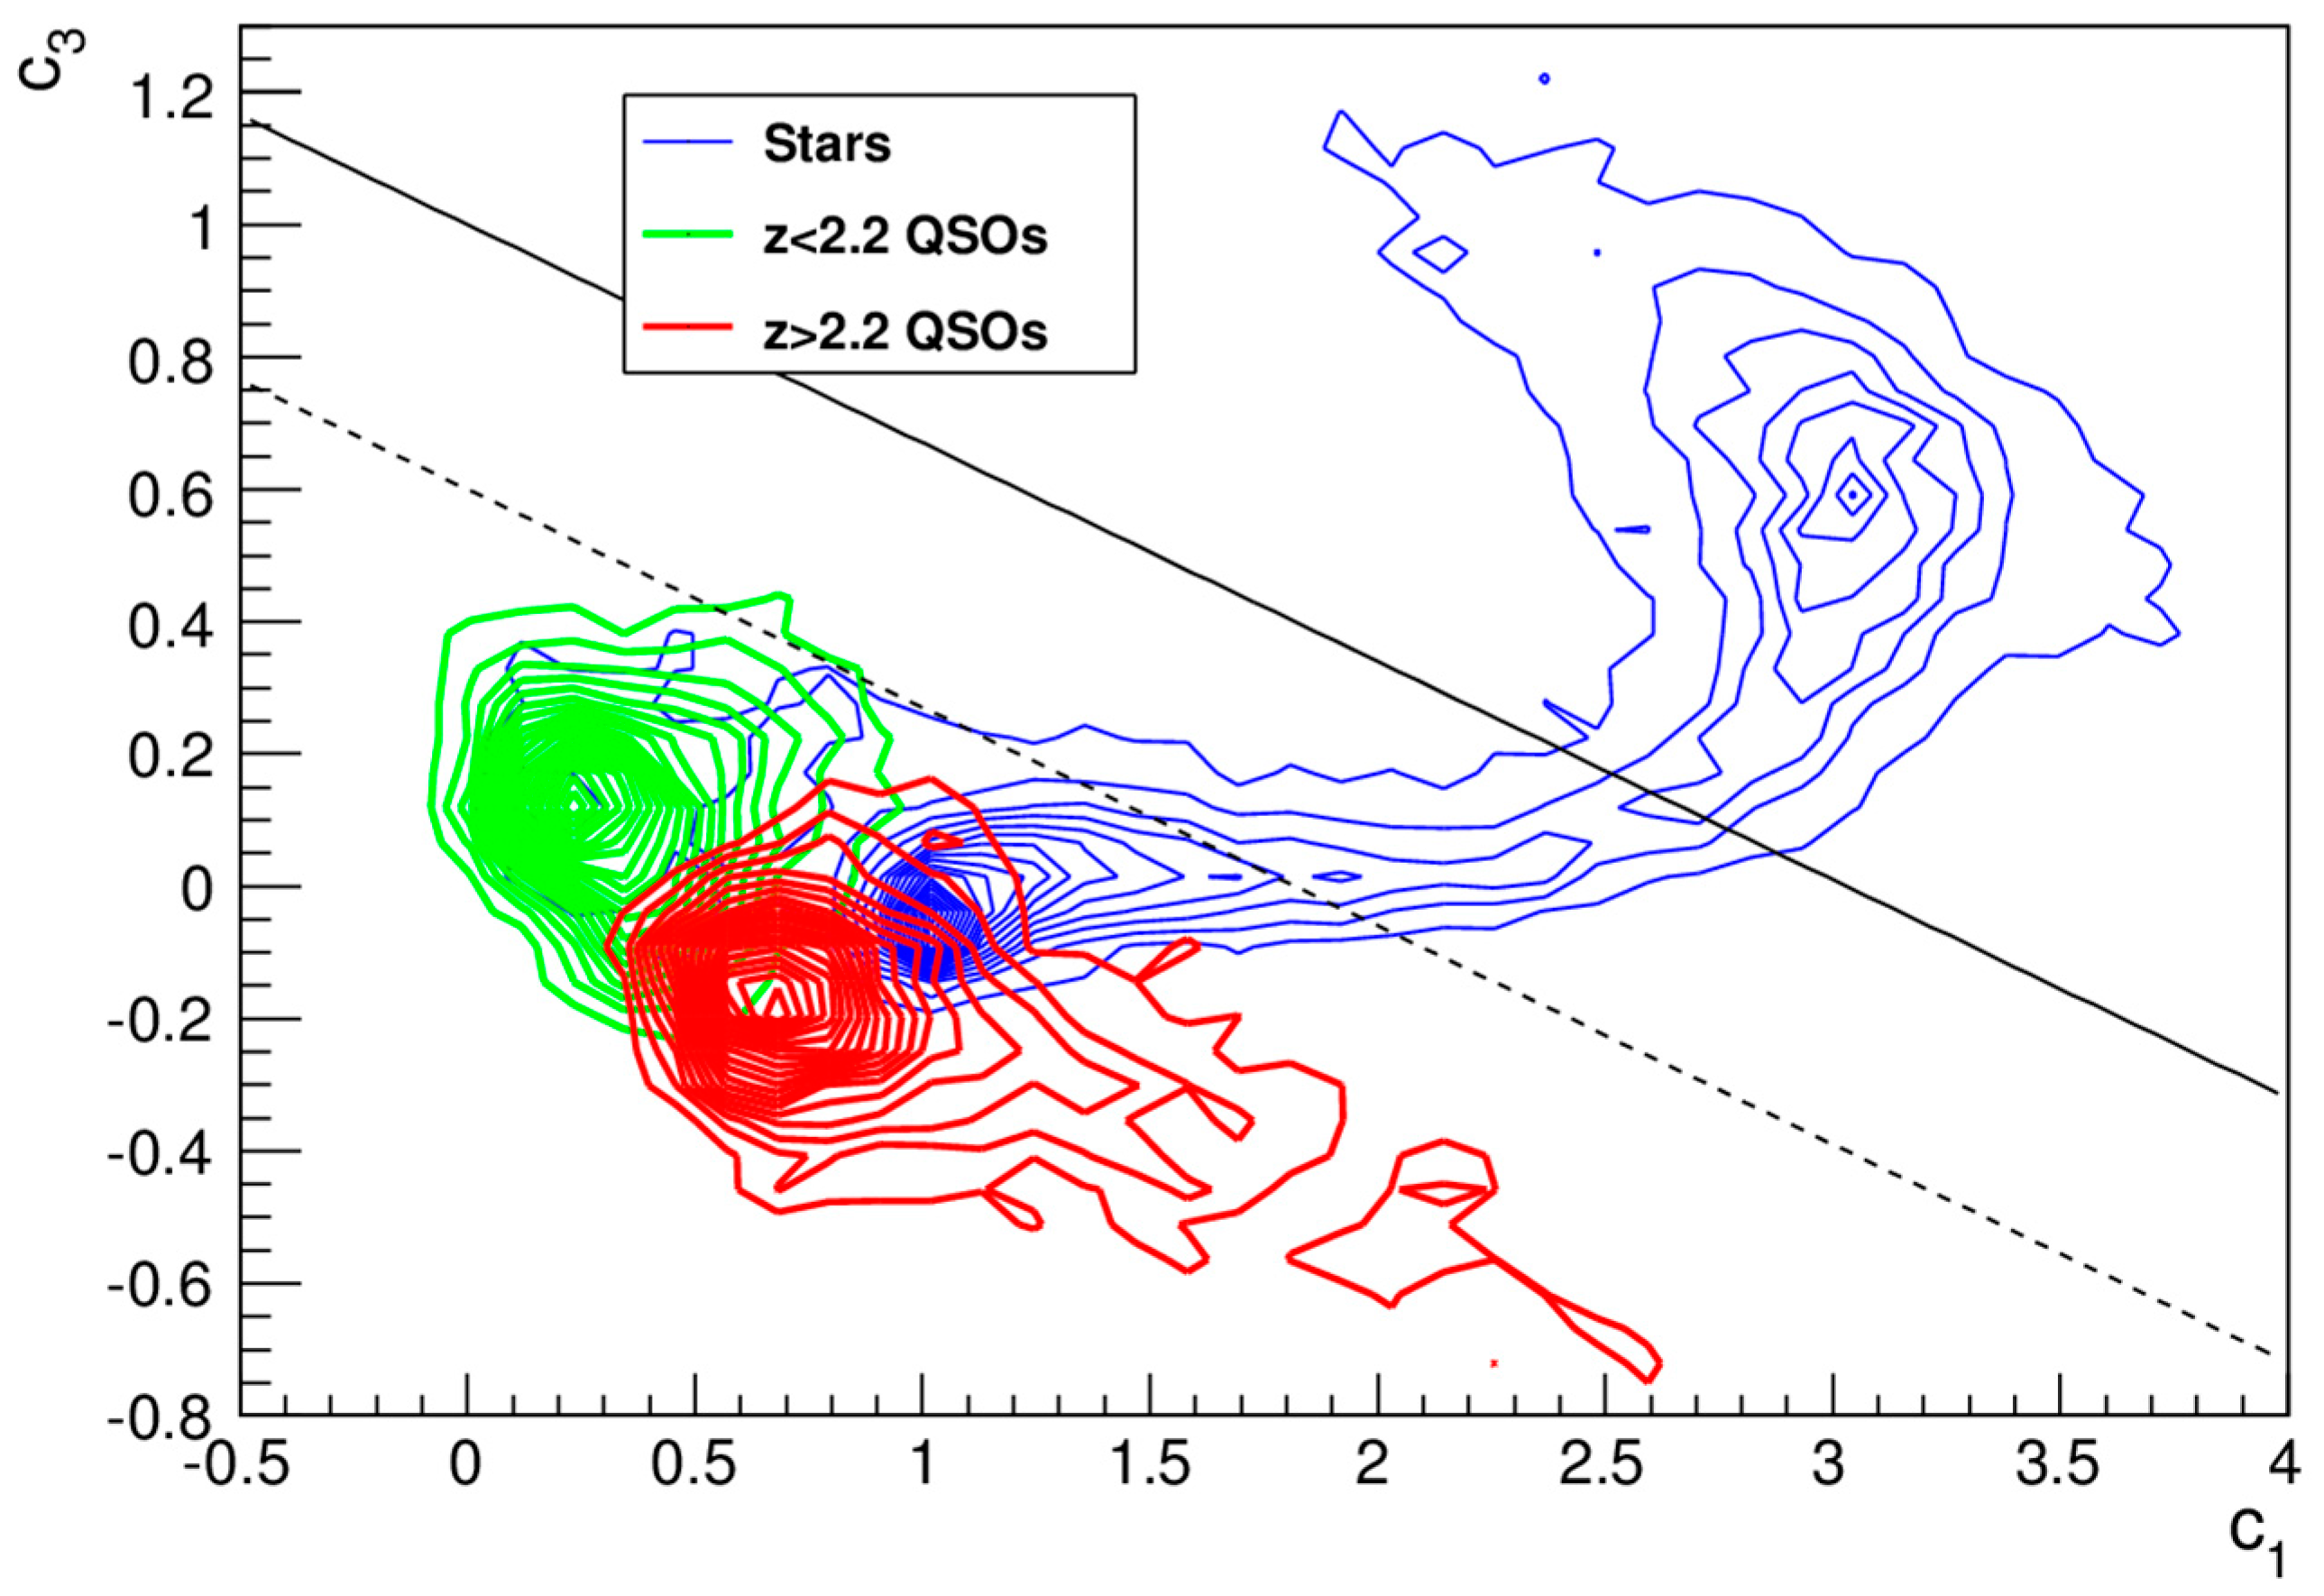
Most AGNs are variable objects at the long-periodical timescale and can be used as a selection criterion. This was implemented by Palanque-Delabrouille et al. using E-BOSS data [6]. Theoretically, quasar selection by variability does not require the use of colors. Practically, however, with only variability selection, some variable stars were included in the sample, and additional color selection was still essential (Figure 3) [6].
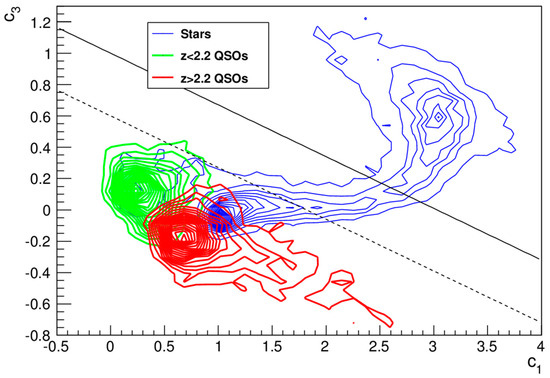
Figure 3.
The BOSS + MMT color selection criteria [6]. Locus of stars (upper blue contours), z < 2.2 quasars (lower left green contours), and z > 2.2 quasars (lower right red contours) in the c3 vs. c1 color-color plane. The upper solid line corresponds to the color cut c3 < 1.0 − c1/3 (loose, for point sources) and the lower dashed line to c3 < 0.6 − c1/3 (strict, for extended sources). c1 = 0.95(u − g) + 0.31(g − r) + 0.11(r − i), c3 = −0.39(u − g) + 0.79(g − r) + 0.47(r − i), where u, g, r, i and z are SDSS colors.
1.5. Medium-Band Photometry
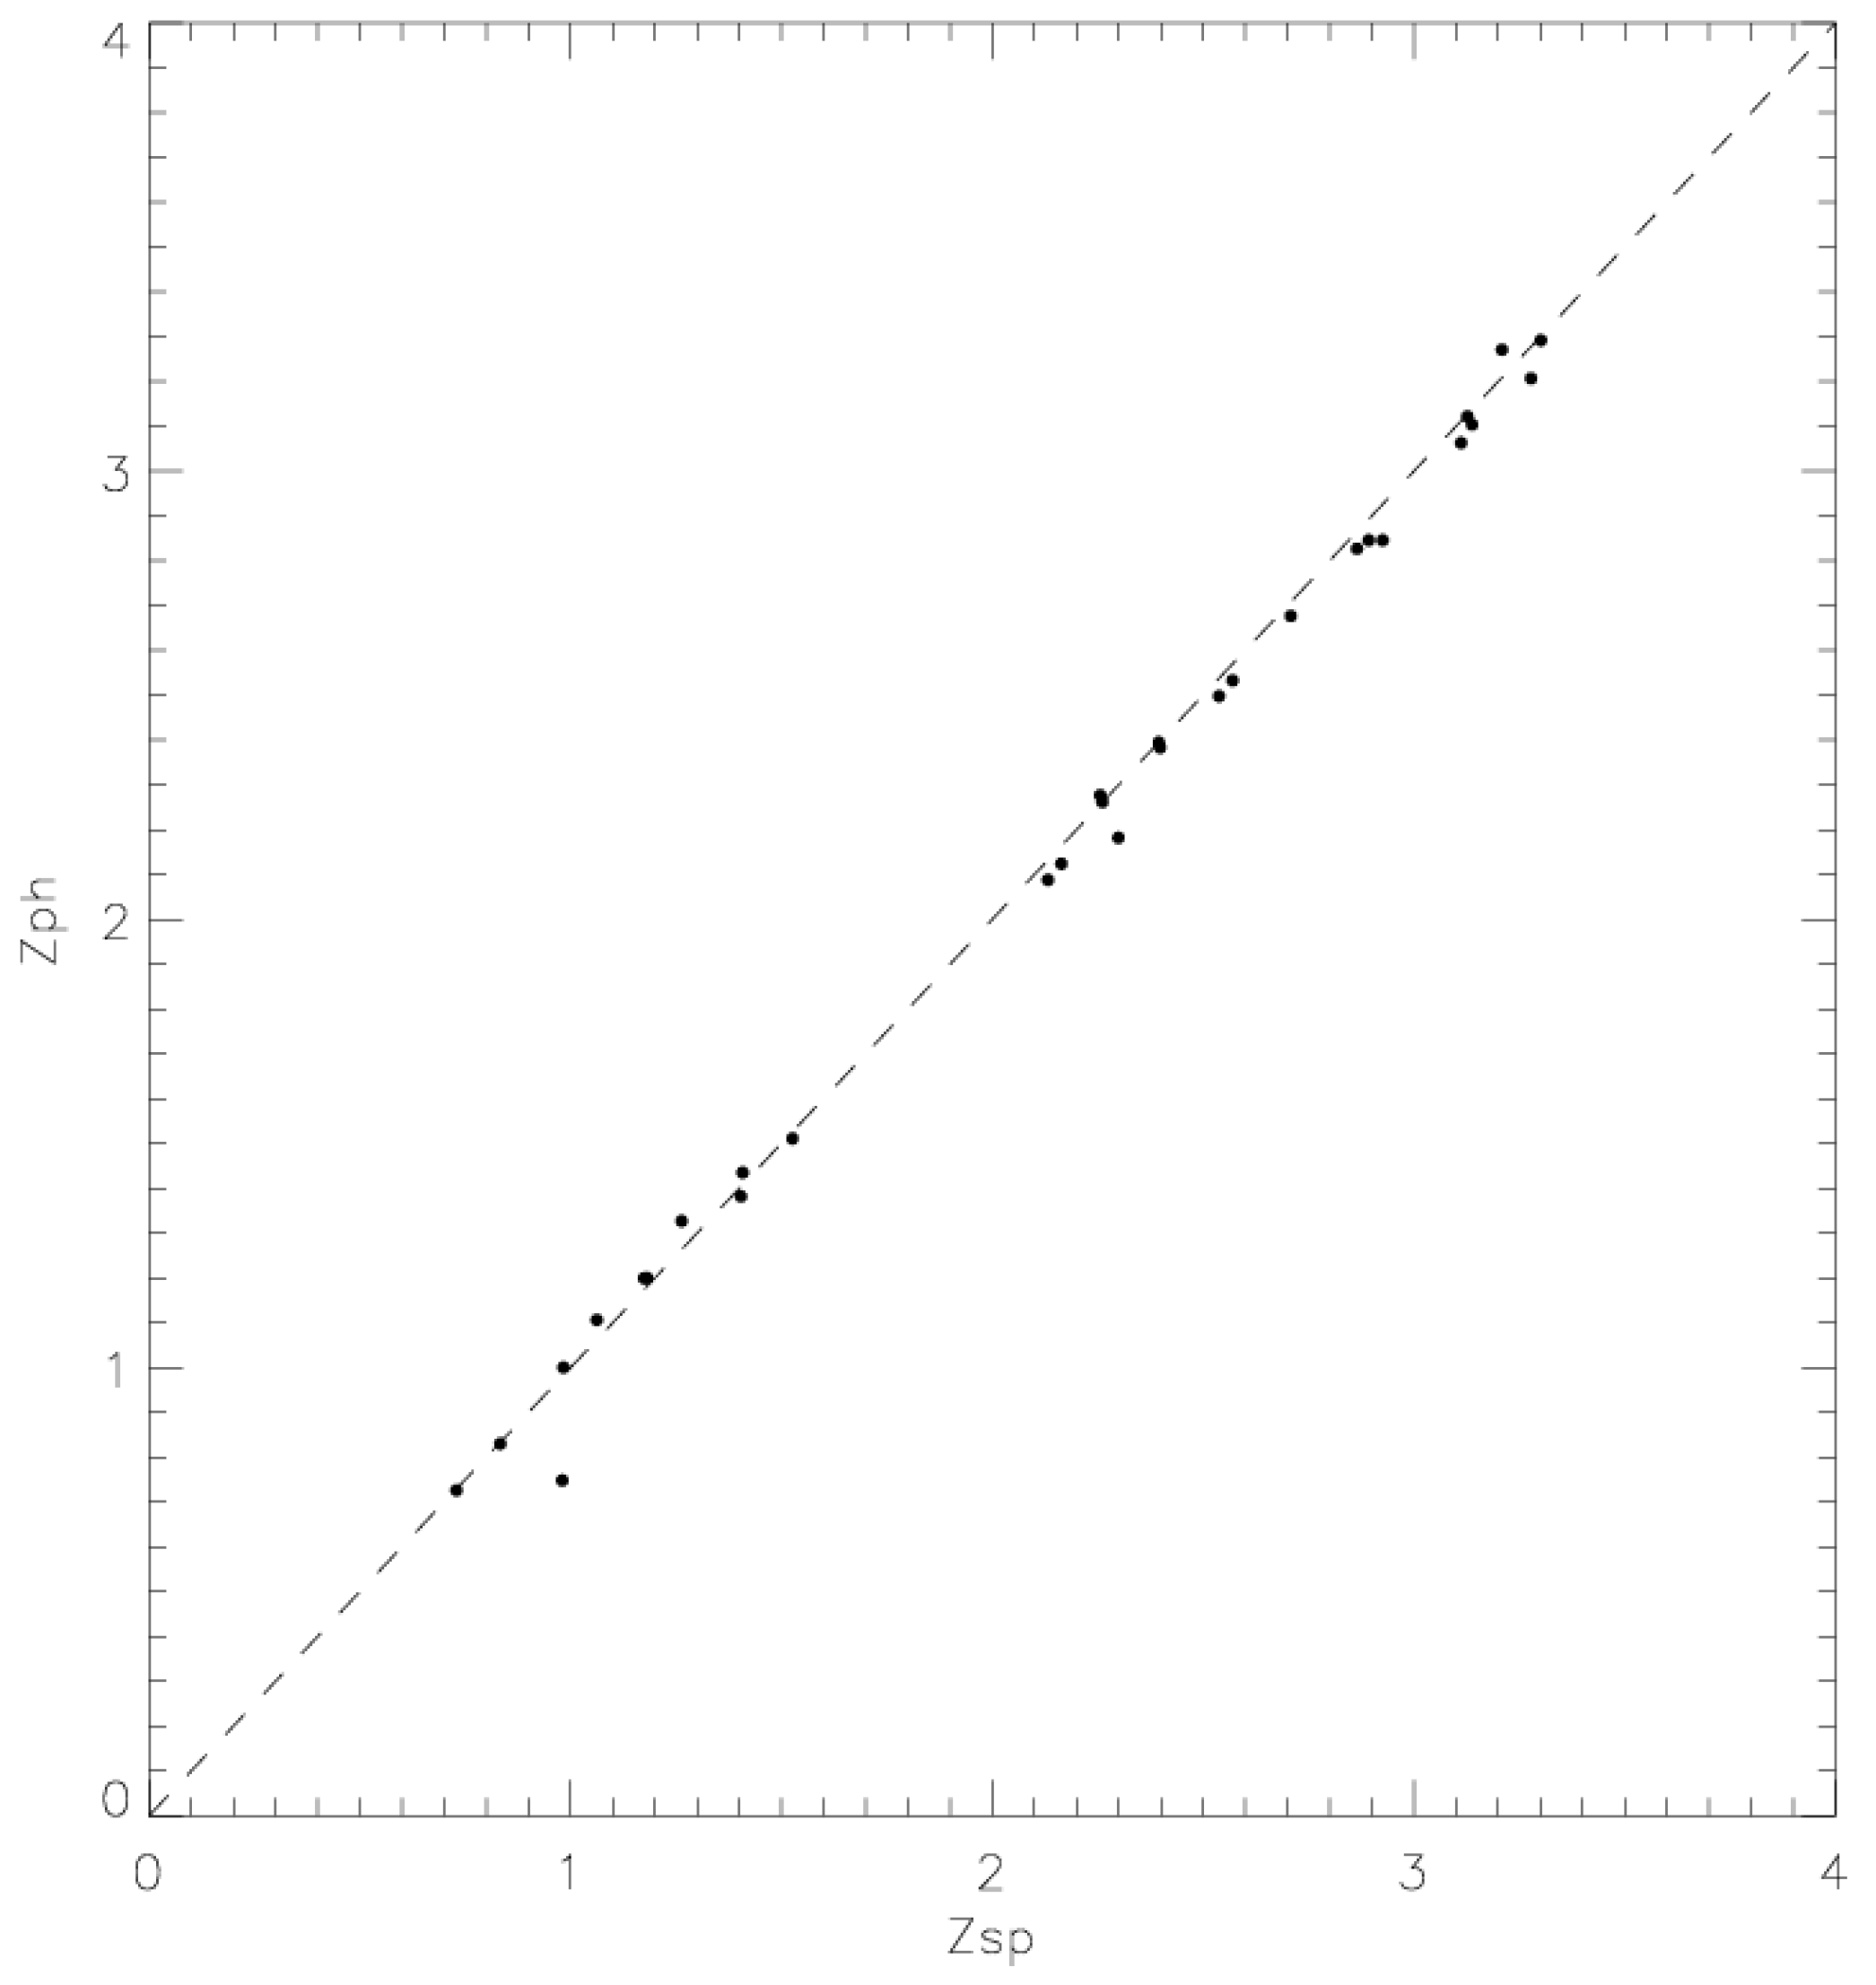
One of the problem solutions for quasars selection in the optical range is to increase the spectral resolution. By increasing the number of filters and by decreasing their width, we can obtain a spectral energy distribution of each of the field objects with a higher resolution, while the exposure time required to reach the same depth increases as well. Such an approach makes it possible to detect broad emission lines in the AGN spectrum, which presents an opportunity both to separate quasars from stars and to determine their photometric redshifts with sufficient accuracy (Figure 4). This method of AGN selection is self-sufficient, but the addition of medium-band photometry with infrared and X-ray data can greatly simplify the selection.
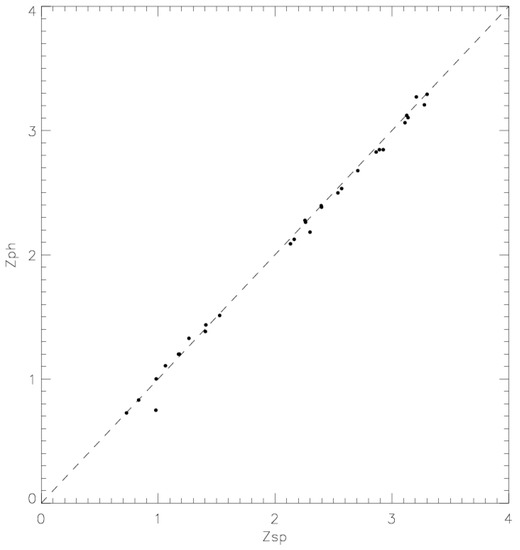
Figure 4.
The accuracy of the photometric redshift determination from the medium-band photometry data. Along the vertical axis—the photometric redshift of quasars, along the horizontal—their spectroscopic redshift. σ = 0.02 [9].
We examined quasar samples obtained with three different methods: broadband optical photometry in combination with infrared and ultraviolet data (SDSS DR10, [7]), optical variability selection (BOSS + MMT, [6]) and X-ray data ([2,8]). At large redshifts (z > 3), there is a decrease in the number of objects from the SDSS DR10 broadband photometry (Paris et al., 2013) and the BOSS + MMT sample ([6]). However, according to X-ray data, there is no such noticeable decline ([2,8]). Based on the assumption that the lack of distant active nuclei in optical surveys is due to selection effects, we decided to make a QSO sample using medium-band photometry and started the “Medium-Band Byurakan Survey” (MBBS).
2. Observations
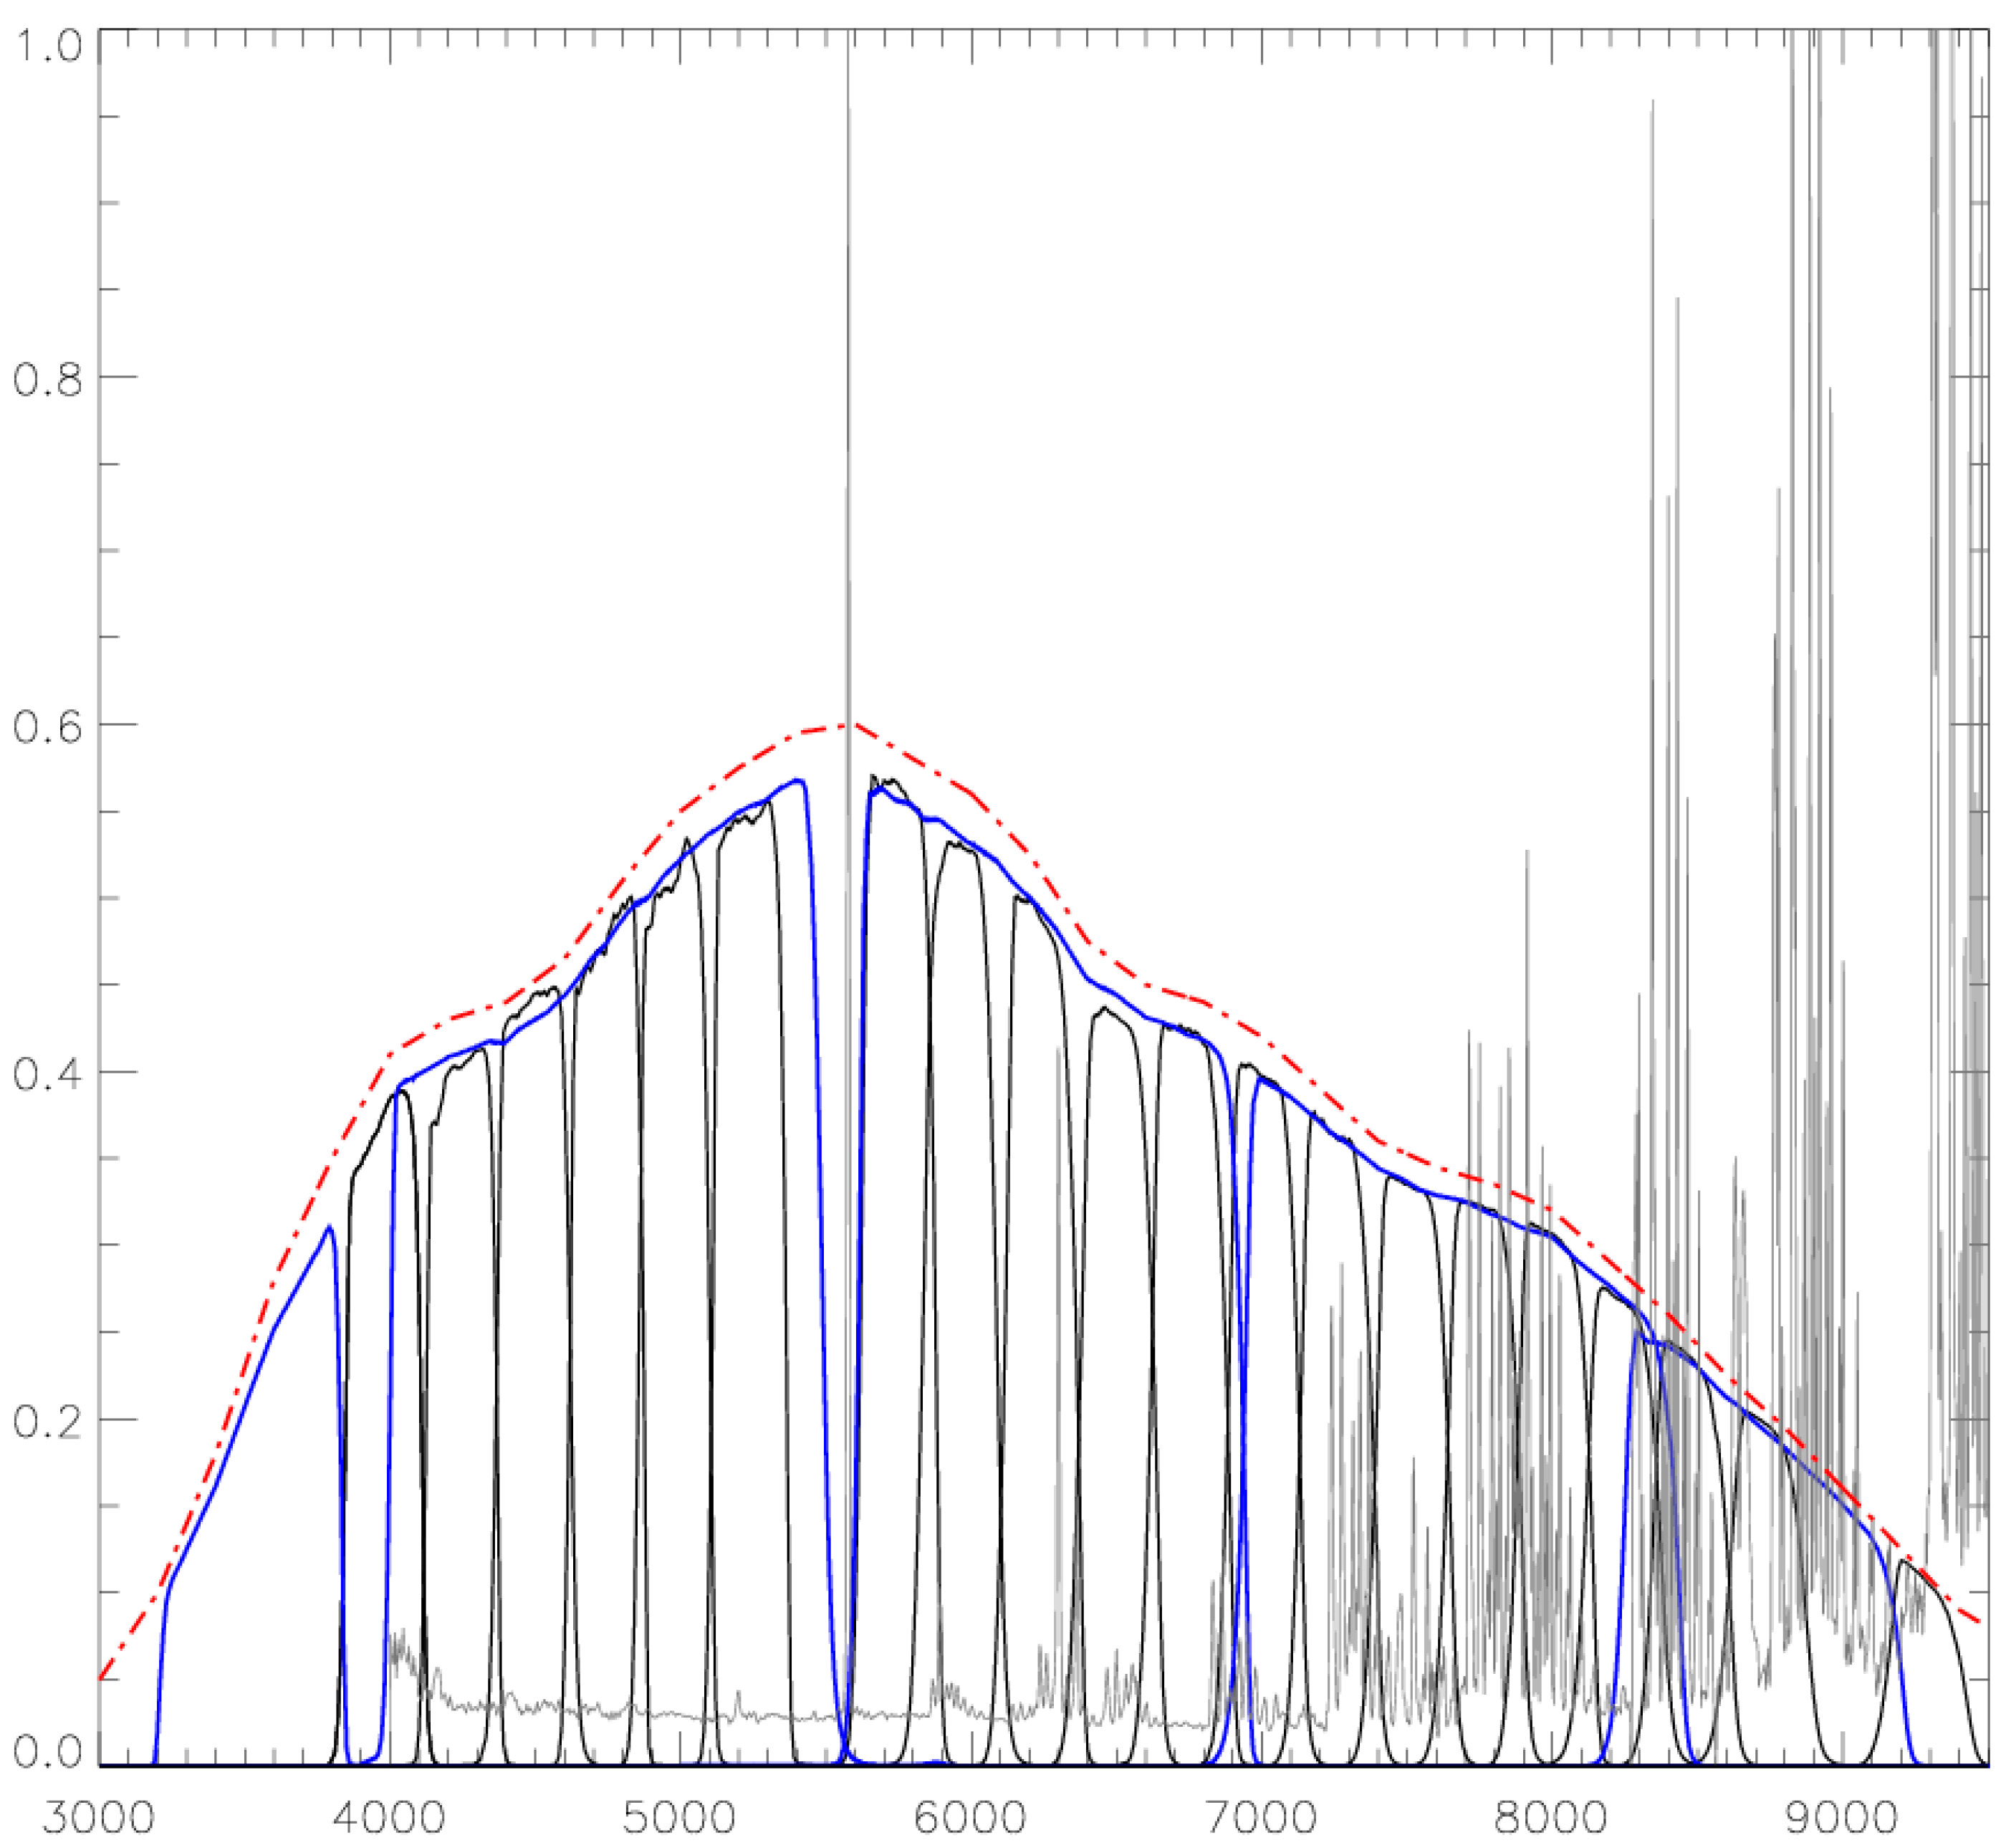
The medium-band survey of the SA68 field was made on the 1-m Schmidt telescope at the Byurakan Astrophysical Observatory of the National Academy of Sciences of Armenia (BAO). In 2013–2015 the Laboratory of Spectroscopy and Photometry of Extragalactic Objects of the Special Astrophysical Observatory of Russian Academy of Sciences together with the Armenian specialists was engaged in its modernization. The 1-m telescope of the Schmidt system (105/132/213) of the BAO is one of the largest instruments in the world: it is one of the five largest telescopes in terms of mirror size and the third in terms of the objective prisms size. In October 2015, we installed a CCD detector (4 k × 4 k, liquid-cooled, RON ~ 11.1 e, manufactured by Apogee, Apogee, Santa Monica, CA, USA) in the telescope focus with a resolution element of 0.868 arcsec, a field of view of about 1 square degree. The detector is equipped with filter wheels with 20 medium-band filters (FWHM = 250 Å, spectral range covering 4000–9000 Å), 5 broadband filters (u, g, r, i, z SDSS), and 3 narrowband filters (5000 Å, 6560 Å and 6760 Å, FWHM = 100 Å) (Figure 5). Observations were made by the authors of this paper over a period of two weeks in October and November 2016. Such a small observation period minimizes the influence of long-period AGN variability in the observational data.
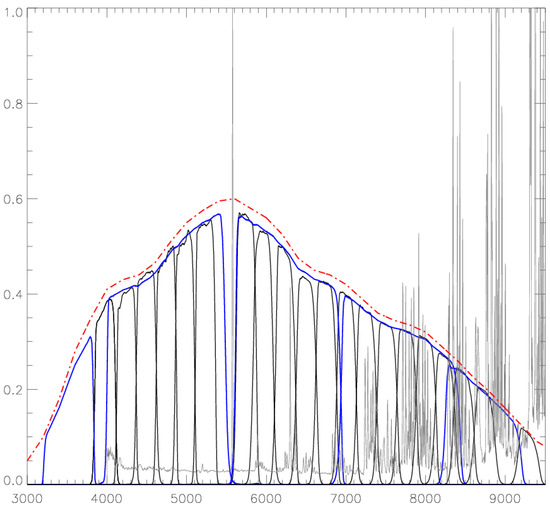
Figure 5.
Transmission of broadband (blue lines) and medium-band filters (black lines), taking into account the quantum efficiency of the detector (red dot-dash line). With the dash line, we illustrate a typical night sky spectrum. Filters were measured at laboratory with F/2 beam, corresponding to the focal ratio of the 1-m telescope.
3. Photometry and SED Construction
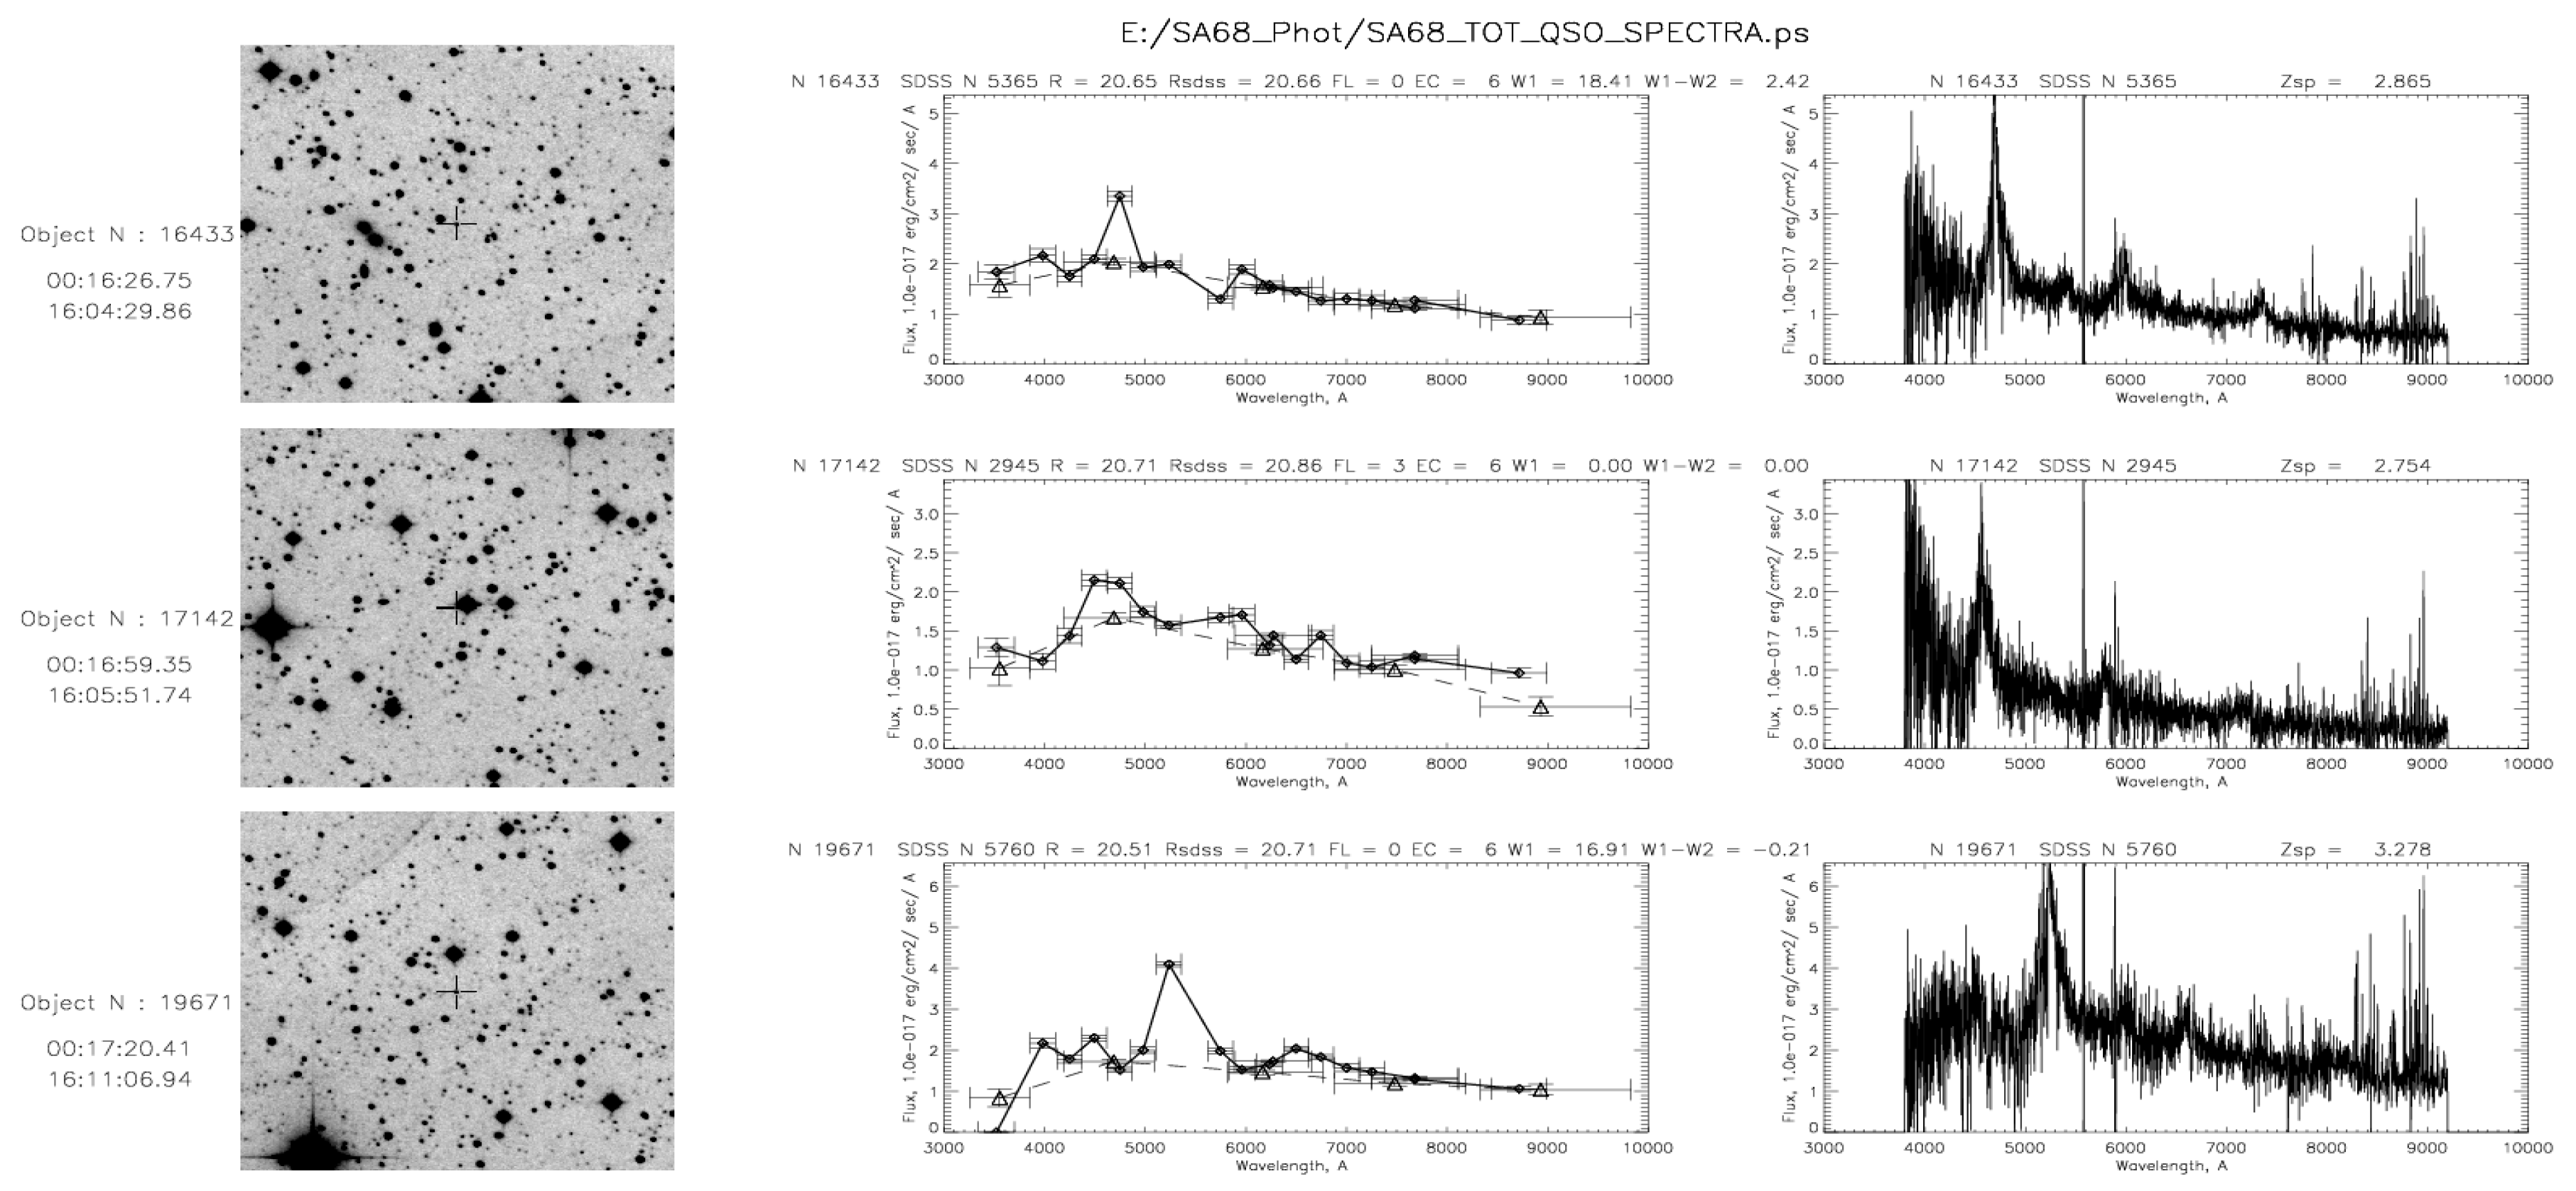
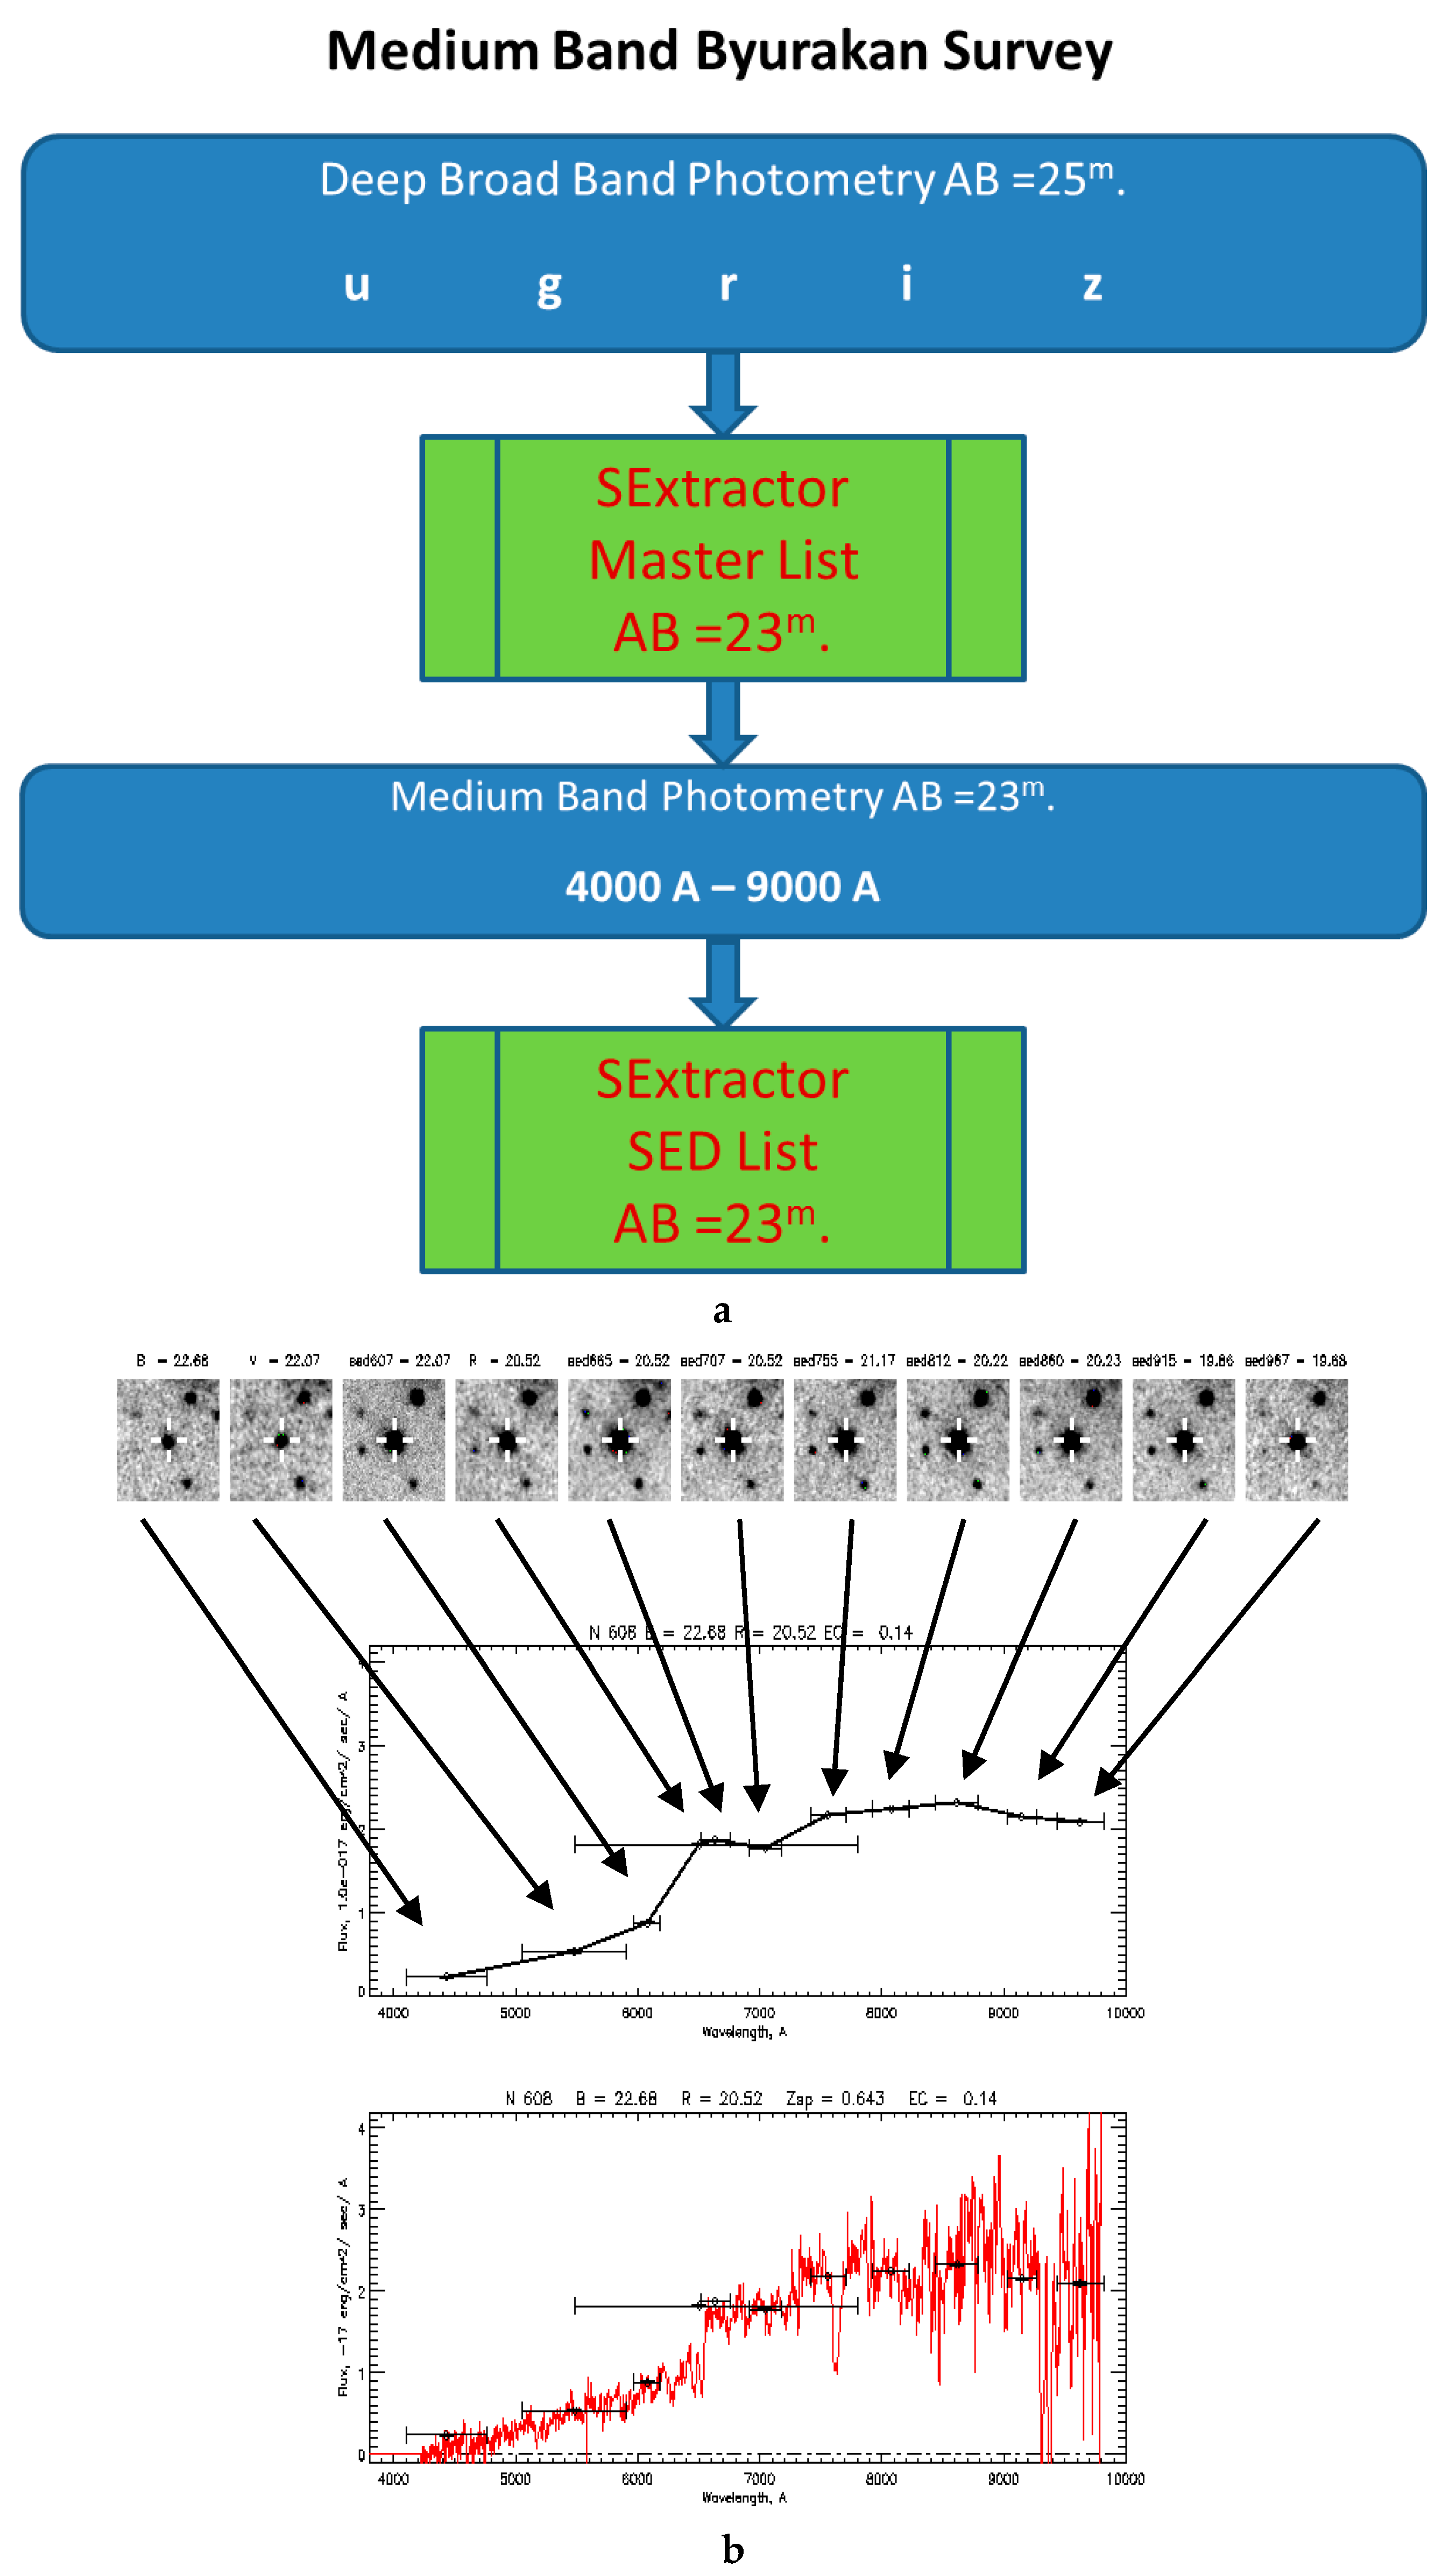
The SA68 field was exposed in 13 medium-band and 5 broadband filters. The width of medium-band filters was chosen so that the spectral resolution was sufficient to register the broad emission lines (Figure 6). To avoid color selection problems during the object detection, a basic object sample was created with a deep image, taken by summing g, r, and i filters (the limiting magnitude in broadband filters was about 25m). The sample was cut to 23m, which is explained by the depth of the medium-band images, for which exposure times of 40–60 min allowed us to register up to 23m objects with a signal-to-noise ratio higher than 5. This allow us to create the luminosity function of the quasars with MB > −23 up to Z = 3.2 and up to Z = 5 for objects with MB > −24.7. The master list was then created based on deep-image photometry (Figure 7). Thus, medium-band photometry of all field objects was performed, and spectral energy distribution [9] was constructed (Figure 7).
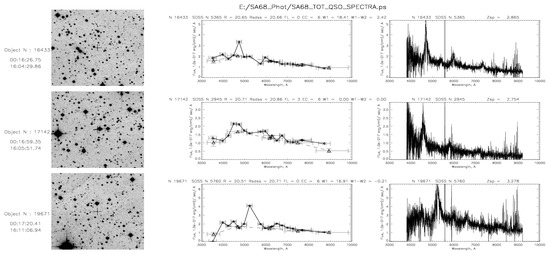
Figure 6.
Some of medium-band selected AGN characteristics. The left images shows the object positions. The center images show medium-band SEDs (black dots with solid line) and broad-band SEDs (triangles with dashed line). The spectra of objects obtained with the 6-m telescope of SAO RAS are shown on the right.
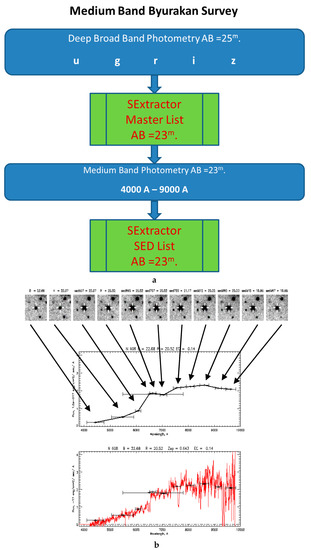
Figure 7.
(a) Photometry algorithm scheme and (b) scheme of SED construction based on medium-band data [9].
4. QSO Selection
The primary selection of quasar candidates was made automatically by comparing the SED of objects with the SED calculated from the model template spectra of the active nuclei. The probability that the object is active galactic nuclei was calculated, and the photometrical redshift determined, using LePhare templates package ([10,11]). Then, the SEDs of the selected objects were viewed manually to make sure the selection was correct.
5. Results
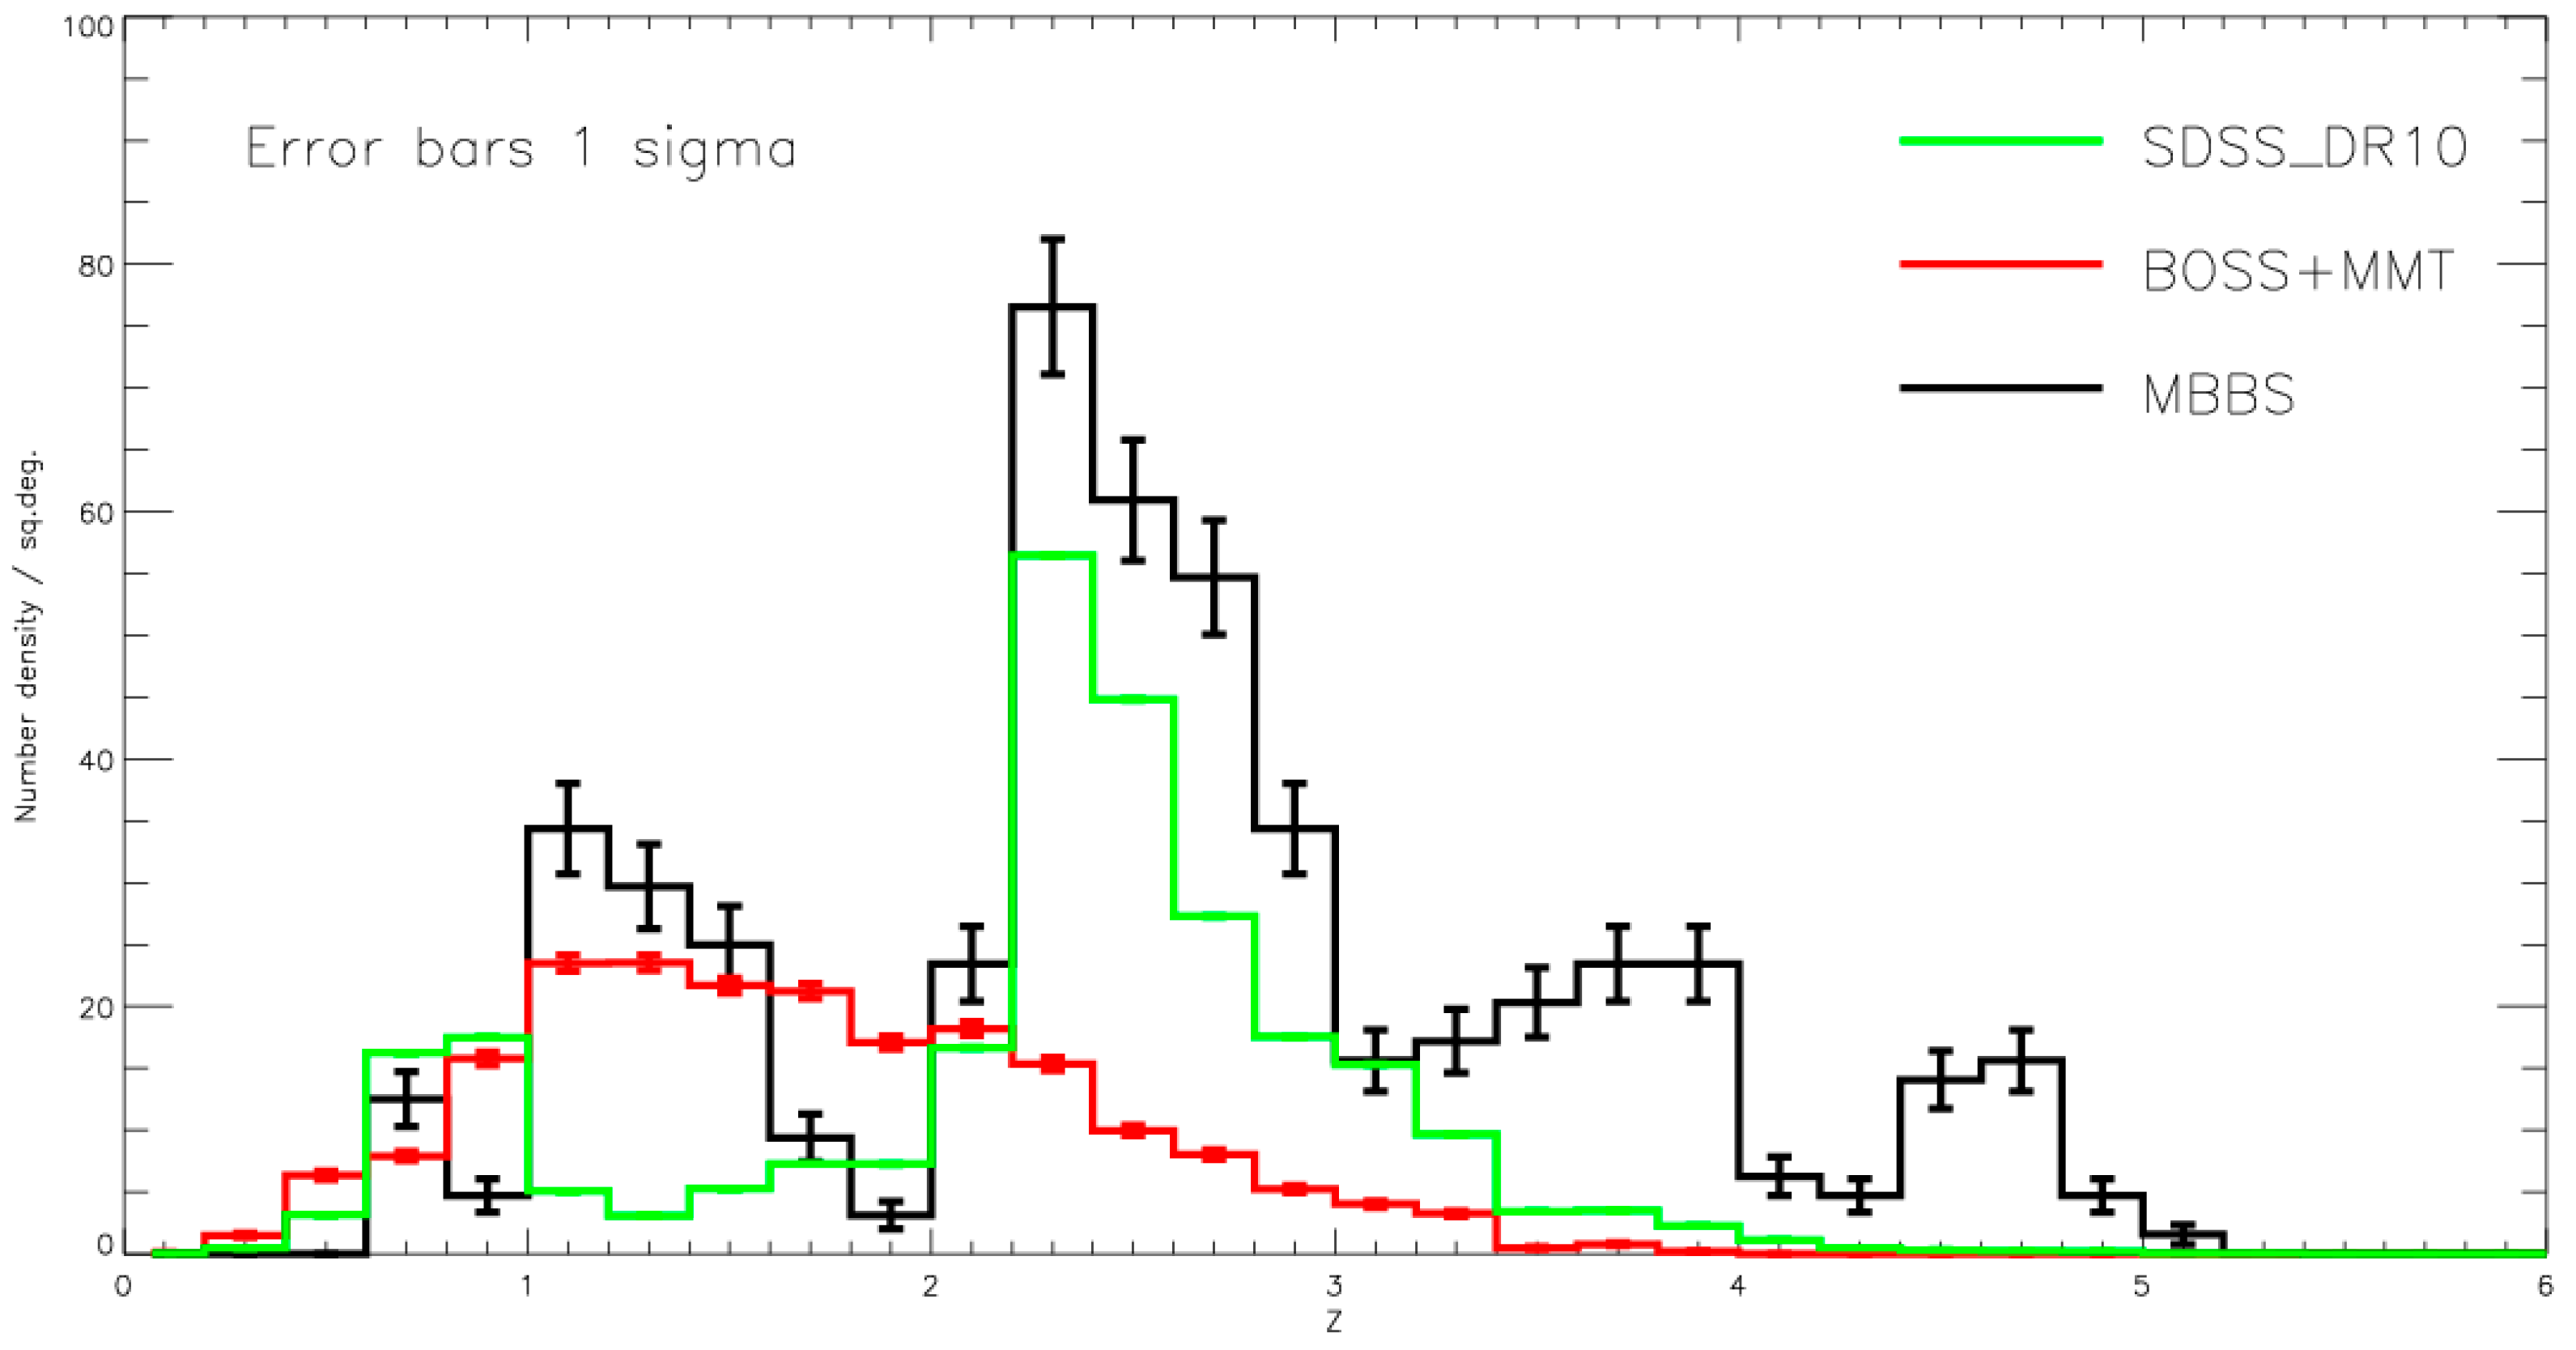
According to the selected objects, the dependencies of the quasar number density on the redshift were constructed, and a direct comparison was made with the SDSS DR10 and BOSS + MMT samples. It can be clearly seen that, for BOSS + MMT, a significant decrease in spatial density begins at z > 2.2; for SDSS DR10, a similar decline is noticeable at z > 3.5 (Figure 8). However, according to the MBBS data, there is no such significant decrease in object number, which is in good agreement with the X-ray data.
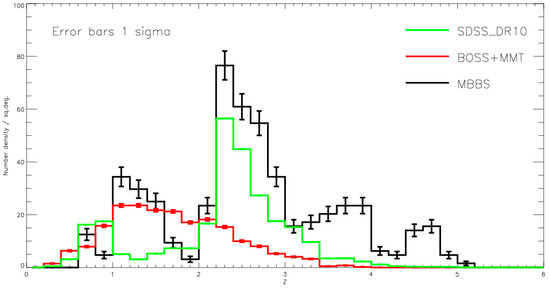
Figure 8.
The number densities of quasars based on three different samples. Δz = 0.2. The green line shows the QSO number density based on the SDSS data release 10 sample [7], and the red line shows that based on BOSS + MMT variability selection sample [6]. The black line shows the number density based on the Medium-Band Byurakan Survey sample in the SA68 field.
Acknowledgments
The work was supported by the Russian Science Foundation (the project number 17-12-01335).
Author Contributions
S.N. Dodonov conceived and designed the experiments; S.N. Dodonov and S.S. Kotov performed the experiments; S.N. Dodonov and S.S. Kotov analyzed the data; S.N. Dodonov and S.S. Kotov contributed reagents/materials/analysis tools; S.S. Kotov wrote the paper.
Conflicts of Interest
The authors declare no conflict of interest.
References
- Mushotzky, R. How Are AGN Found. In Astrophysics and Space Science Library; Springer: Berlin, Germany, 2004; Volume 308. [Google Scholar]
- Fotopoulou, S.; Buchner, J.; Georgantopoulos, I.; Hasinger, G.; Salvato, M.; Georgakakis, A.; Cappelluti, N.; Ranalli, P.; Hsu, L.T.; Brusa, M.; et al. The 5–10 keV AGN luminosity function at 0.01 < z < 4.0. Astron. Astrophys. 2016, 587, A142. [Google Scholar]
- Sandage, A.; Luyten, W.J. On the Nature of Faint Blue Objects in High Galactic Latitudes. I. Photometry, Proper Motions, and Spectra in PHL Field 1:36 + 6° and Richter Field M3, II. Astrophys. J. 1967, 148, 767. [Google Scholar] [CrossRef]
- Richards, G.T.; Myers, A.D.; Peters, C.M.; Krawczyk, C.M.; Chase, G.; Ross, N.P.; Fan, X.; Jiang, L.; Lacy, M.; McGreer, I.D.; et al. Bayesian High-Redshift Quasar Classification from Optical and Mid-IR Photometry. Astrophys. J. Suppl. Ser. 2015, 219, 39. [Google Scholar] [CrossRef]
- DiPompeo, M.A.; Bovy, J.; Myers, A.D.; Lang, D. Quasar probabilities and redshifts from WISE mid-IR through GALEX UV photometry. Mon. Not. R. Astron. Soc. 2015, 452, 3124–3138. [Google Scholar] [CrossRef][Green Version]
- Palanque-Delabrouille, N.; Magneville, C.; Yèche, C.; Pâris, I.; Petitjean, P.; Burtin, E.; Dawson, K.; McGreer, I.; Myers, A.D.; Rossi, G.; et al. The Extended Baryon Oscillation Spectroscopic Survey: Variability Selection and Quasar Luminosity Function. Astron. Astrophys. 2016, 587, A41. [Google Scholar] [CrossRef]
- Pâris, I.; Petitjean, P.; Aubourg, É.; Ross, N.P.; Myers, A.D.; Streblyanska, A.; Bailey, S.; Hall, P.B.; Strauss, M.A.; Anderson, S.F.; et al. The Sloan Digital Sky Survey quasar catalog: Tenth data release. Astron. Astrophys. 2014, 563, A54. [Google Scholar] [CrossRef]
- Miyaji, T.; Hasinger, G.; Schmidt, M. Evolution of the ROSAT AGN Luminosity Function. Astron. Astrophys. 1998, 353, 25. [Google Scholar]
- Dodonov, S.N. 1-m BAO Schmidt Telescope: First Results. In Proceedings of the HEA-2016, Moscow, Russia, 20–23 December 2016. [Google Scholar]
- Arnouts, S.; Cristiani, S.; Moscardini, L.; Matarrese, S.; Lucchin, F.; Fontana, A.; Giallongo, E. Measuring and modelling the redshift evolution of clustering: The Hubble Deep Field North. Mon. Not. R. Astron. Soc. 1999, 310, 540–556. [Google Scholar] [CrossRef]
- Ilbert, O.; Arnouts, S.; McCracken, H.J.; Bolzonella, M.; Bertin, E.; Le Fevre, O.; Mellier, Y.; Zamorani, G.; Pello, R.; Iovino, A.; et al. Accurate photometric redshifts for the CFHT legacy surveycalibrated using the VIMOS VLT deep survey. Astron. Astrophys. 2006, 457, 841–856. [Google Scholar] [CrossRef]
© 2017 by the authors. Licensee MDPI, Basel, Switzerland. This article is an open access article distributed under the terms and conditions of the Creative Commons Attribution (CC BY) license (http://creativecommons.org/licenses/by/4.0/).

