Abstract
Supernovae (SNe), the catastrophic end of stars’ lives, are among the most energetic phenomena in the universe. Mapping the aftermath of the explosions to the properties of pre-SN stars is challenging due to the lack of knowledge about the evolution of different types of stars. The immediate surroundings of pre-SN stars carry the signature of the progenitors, and radio observations are the best way to examine the ambient media. Since radio emission originates from the interaction of supersonic SN ejecta with the relatively stationary circumstellar medium, with a few years of radio study, the mass-loss history of progenitor stars can be probed from just before the explosion of the star to thousands of years before the onset of the SN. Moreover, this can provide crucial details about the explosions, which are poorly understood to date. In this paper, we review the radio properties of different types of core-collapse explosions and thermonuclear runaways to understand their mass-loss evolution—which allows us to unravel the imprints of the progenitors on the surrounding media and thus the nature of the exploded stars. Additionally, we discuss the current state of the art in this field, including existing and the next-generation radio facilities with enhanced capabilities that provide further details about these explosions.
1. Introduction
Radio emission from a supernova (SN) mainly originates from the interaction of supersonic SN ejecta with the circumstellar medium (CSM). This ambient medium is created by the mass loss from the progenitor star in different evolutionary phases. In the case of a core-collapse SN, mass loss toward the end of the star’s life affects its final phases significantly and thus influences the core-collapse process (e.g., see [1,2]). For thermonuclear explosions, similarly, mass loss plays a crucial role in the evolution of their progenitors (e.g., see thermonuclear runaways of white dwarfs (WDs) through different channels [3,4,5,6]).
Almost all types of core-collapse SNe have been detected at radio wavelengths. In contrast, only one Type Ia explosion, SN 2020eyj, has been detected at this frequency [7] after decades of observational campaigns in detecting these objects at radio waves. However, among all core-collapse SNe, only around 30% of these events were bright enough at radio wavelengths to be detected by radio facilities [8]. Even a significant number of nearby explosions were never detected at radio wavelengths. The light curves of detected SNe show significant variations with age and subtypes. However, because of an insufficient statistical sample, it becomes difficult to parameterize the radio light curves of different subtypes of SNe (nevertheless, see [8,9,10], where attempts were made to parameterize radio light curves of subclasses of core-collapse and thermonuclear SNe). One of the brightest SNe at radio wavelength in terms of the peak spectral luminosity () is SN 1998bw, with erg/s/Hz [11], which is associated with -ray burst GRB980425. Nevertheless, a considerable fraction of SNe have much lower than that of SN 1998bw. In addition, the time to reach the peak spectral luminosity differs from event to event. For progenitors with a significant mass loss just before the collapse, which is often the case for Type IIn explosions, the peak spectral luminosity is reached at a significantly later stage. For example, for SN 1986J, it takes around a year to attain the peak, while for SN 1987A, which is a Type IIP explosion, the peak occurs within a day [12]. However, increased radio emission was observed from this SN at a later time. Explosions such as SN 2014C, which was initially classified as a Type Ib explosion, later showed enhanced radio emission due to interaction with a large amount of ambient material, which was expelled from the progenitor sometime before the explosion [13,14]. One of the best-studied SNe at radio wavelength is Type IIb explosion SN 1993J. The light curves of this event displayed a sudden dip around 3000 days after the explosion, which was most likely due to a sudden decrease in mass-loss rates of the progenitor around 7000 years prior to its explosion [15,16].
In the case of Type Ia explosions, single radio-detected event SN 2020eyj allows for detection at radio wavelengths (at 5.1 GHz) more than approximately 1.5 years after the explosion. Recently, with the advancement of current-generation radio telescopes, by using them in wide-field radio surveys, such as the Very Large Array (VLA; [17,18,19]) Sky Survey (VLASS), and variable and slow transients (VAST) Pilot surveys [20] utilizing the Australian Square Kilometre Array Pathfinder (ASKAP; [21]), it has become feasible to reconstruct the mass-loss history of progenitor stars before their death by detecting the rebrightening of these explosions at late times, which provides robust constraints on the evolution of pre-SN stars.
In this paper, we review the radio properties of different types of core-collapse and thermonuclear runaways to understand their mass-loss evolution, hence the progenitors of these explosions, along with the current state of the art in this field. Detailed reviews of radio emission from supernovae until around the previous decade were summarized by Weiler et al. (2002, 2010) [9,22]. The layout of this paper is as follows: In the following section, Section 2, the interaction of SN ejecta with CSM is discussed. In Section 3, the theory of radio emission from SNe is described. The observations of radio emission from different types of core-collapse and thermonuclear explosions are discussed in Section 4. Finally, the discussion and conclusions are given in Section 5 and Section 6, respectively.
2. SN-CSM Interaction
After the explosions of stars, either in the core-collapse or thermonuclear scenario, the SN ejecta are thrown into the CSM with a speed ≥ km s−1 [23]. The velocity of the circumstellar medium is usually significantly lower compared with the velocity of the ejecta. As a result, the interaction of this high-velocity ejecta with the almost stationary ambient medium launches two shocks, with the first being the forward shock, which plows into the CSM, hence called the forward shock. The enormous pressure behind the forward shock launches another shock, which moves backward in the mass coordinates. This shock is called the reverse shock. The region between these two shocks contains shocked CS and ejecta material, as well as a contact discontinuity, as demonstrated in the left panel of Figure 1 for a wind-like ambient medium (figure reproduced from [24]). The variations in density, velocity, and pressure in this shell as a function of radius are displayed in the right panel of Figure 1 (figure reproduced from [25]). The region between the reverse shock and contact discontinuity contains shocked ejecta, which induce Rayleigh–Taylor (RT) instability [26]. This instability arises likely due to the presence of low-density material (see the right panel of Figure 1) behind the forward shock, which affects the expansion of the high-density matter behind the reverse shock. The growth of RT instability in the shocked ejecta for different effective adiabatic indices () of the gas is shown in Figure 2. This simulation is performed for a wind-like CSM and ejecta with an extreme outer part having a power-law profile with a power-law index of 7 (see Section 2.2 for details about the ejecta profile). The finger-like structures represent the RT instability, with the density color bar scaled with respect to the density of the CSM just ahead of the forward shock. As demonstrated, for higher , the instability stays close to the reverse shock area, while as decreases, the protrusions spread across the entire shocked region [27].
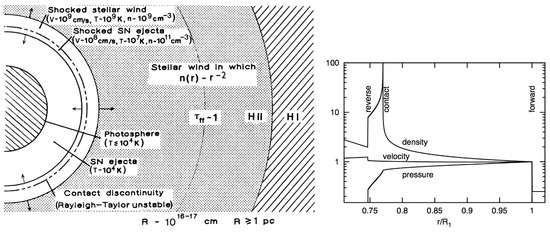
Figure 1.
(Left panel): Interaction of SN ejecta with a wind-like ambient medium. The different regions shown here are not to-scale. The contact discontinuity exists between the forward and reverse shocks. Figure reproduced from [24] with permission. (Right panel): For a wind-like CSM and ejecta with an extreme outer part having a power-law profile with a power-law index of 7, the density, velocity, and pressure profiles are displayed within the shocked shell, which is bounded by the forward and reverse shocks. The contact discontinuity between the two shocks is also depicted here. The X-axis is normalized with respect to the position of the forward shock (which is represented here by ), and the Y-axis is scaled according to pressure, velocity, and density values just behind the forward shock. Figure reproduced from [25] with permission.
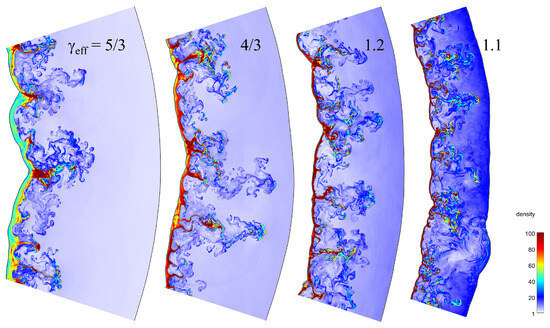
Figure 2.
The growth of the RT instability in the shocked ejecta for different effective adiabatic indices, , of the gas. This simulation is performed for a wind-like CSM and ejecta with an extreme outer part having a power-law profile with a power-law index of 7. The finger-like structures represent the RT instability with the density color bar scaled with respect to the density of the CSM just ahead of the forward shock. For higher , the instability stays close to the reverse shock area, while as decreases, the protrusions spread across the entire shocked region. Figure reproduced from [27] with permission.
The shocked region between the reverse and forward shocks is an ideal place for particle acceleration and magnetic field amplification [28,29,30]. Relativistic electrons gyrating in this magnetic field produce radio emission mainly through synchrotron radiation [31]. As the flux of this radiation is roughly proportional to the density of the ambient medium, the study of radio emission is an excellent tool to probe the mass-loss history of the progenitor star. Moreover, since different stars lose material from their outer surfaces at different rates, this investigation allows one to gain information about the pre-SN star. The ambient medium expected to prevail around the pre-SN star and the profile of the SN ejecta, which play crucial roles in the production of radio emissions from SNe, are discussed in Section 2.1 and Section 2.2, respectively.
2.1. CSM Structure
Massive stars, which end their life in core-collapse explosions, lose their envelope masses mainly through winds [32,33,34]. As a result, the density of the ambient medium decreases with the square of the radius. For a constant mass-loss rate, , the CSM density at a distance r from the star is , for a constant , where represents the speed at which mass is lost from the system. For example, compact stars like blue supergiants and Wolf–Rayet stars have wind speeds in the range of 1000 km s−1 to 3000 km s−1, with between and [2,35,36]. In the case of red supergiants, is significantly low, between 10 and 50 km s−1, and the mass loss is around –. However, there exist some stars that go through enormous mass loss, with , for a wind speed similar to that of red supergiants [2].
In the case of a single degenerate (SD) explosion channel of the thermonuclear explosion, similar wind-like CSM expected to prevail. However, the double degenerate (DD) scenario predicts an ambient medium of constant density, which can be expressed as , where and represent the constant particle density and mean atomic weight of the ambient material, respectively. Therefore, we write the density of the CSM as , where 2 with for a wind-like medium and 0 with for constant-density medium, which is a characteristic of the interstellar medium.
2.2. SN Ejecta Profile
Besides the density profile of the CSM, the ejecta structure of an SN plays a crucial role in determining the flux of radio emission from the interaction region. Analytical and numerical simulations have suggested that the inner part of SN ejecta follows almost a constant density up to a given radius, , which corresponds to the break velocity, and beyond , the density of the outer part of the SN decreases rapidly with the radius as , where n is the power-law index [37,38]. The density structure of an SN could be even more complicated, as demonstrated in Figure 3, where the solid lines illustrate the ejecta profiles of SN 1993J (left panel) and SN 2011dh (right panel) as obtained from numerical simulations that used multigroup radiation hydrodynamic simulations (STELLA) [16].
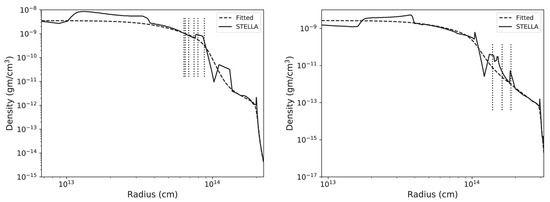
Figure 3.
SN ejecta profiles, as obtained from STELLA along with the fitted ones, for SN 1993J (left panel) and SN 2011dh (right panel), one day after the explosions. The dotted vertical lines in the ejecta profiles illustrate the reverse shock position at 1000, 2000, 3000, 5000, 7000, and 8000 days after the explosion of SN 1993J and that at 200, 500, and 1200 days after the explosion of SN 2011dh. Figure reproduced from [16] with permission.
The interaction between SN ejecta, which have a power-law profile, and a CSM, characterized by , can be described by a self-similar structure [39]. Soon after the explosion, the free or homologous expansion of the ejecta is established. The SN remains in the homologous phase as long as the reverse shock plows through the extreme outer part of the ejecta. The duration of the free expansion phase is estimated as , with [38]. Here, and represent the velocity and density of the extreme outer part of the inner ejecta, respectively. , and , with , , and being the forward shock, contact discontinuity, and reverse shock radii, respectively. For the wind-like medium and in the case of CSM of constant density, . is the ratio between the swept-up ejecta and the swept-up ambient matter, and represents a reference radius. At the end of the free expansion phase, when the reverse shock enters the flat inner part of the SN, the explosion moves into the Sedov–Taylor (ST) phase.
For a self-similar structure, the evolution of the radius of the forward shock () in the free expansion phase is , and the corresponding shock speed is given by , where t represents time [39]. Depending on the nature of the CSM and the values of n, the shocked shell can have variations in its thickness, with the maximum thickness of the interaction region being around 30% of the forward shock radius.
3. Radio Emission from SNe
According to diffusive shock acceleration theory (DSA), in the shocked region, the back-and-forth movements of charged particles across the shocks accelerate them to relativistic energies [40]. For a compression factor of 4, DSA suggests that the accelerated particles follow a power-law energy spectrum with , where and p are the normalization constant and the power-law index, respectively. However, along with the main shock, if a sub-shock is present, the spectrum steepens for low-energy particles with [41]. In addition, when different losses occur, such as synchrotron and inverse Compton losses, or particles escape from the shocked region, the resulting spectrum becomes softer by another factor. For supernovae that are believed to originate from compact progenitors, such as Type Ib/c SNe, the power-law index of relativistic electrons is estimated to be 3 [42,43]. However, for these events, the loss processes were found to be irrelevant. Particle acceleration is a complicated mechanism. In addition, a poor understanding of the acceleration process provides inadequate information on the precise value of p.
In the shocked region, the electrons over the protons are mainly responsible for synchrotron radiation, since the power of this radiation decreases inversely with the mass of the charged particle [31]. It is usually assumed that in the post-shock regime, all electrons get accelerated. If the fraction of post-shock energy density that goes to electrons is , where , for accelerated electrons, this implies that the population has a minimum energy, , for a constant value of [38]. Here, is the post-shock kinetic energy density, and represents the energy density of electrons. In the initial phase, the shock speed is so high that almost all electrons are in the relativistic regime, i.e., , where and c are the mass of an electron and the speed of light in vacuum, respectively. As a result, , with for [42]. However, with time, as the shocks get decelerated, a non-relativistic component of the electrons starts to appear, and we get , with representing the fraction of energy in non-relativistic electrons. As a result, we get [38]. Since synchrotron emission originates from relativistic electrons, it is assumed that electrons with energies greater than are responsible for this emission. Multidimensional hybrid simulations of non-relativistic shocks showed that energetic electrons can acquire a maximum of 10–20% of the bulk kinetic energy of the shock [29] when the background magnetic field is parallel or quasi-parallel.
Likewise, a fraction of the post-shock energy is converted into magnetic fields. If represents this fraction, , where is the magnetic field energy density and B represents the magnetic field strength, respectively. Our knowledge about particle acceleration and magnetic field amplification is limited, as both are highly complicated phenomena and require much higher computational facilities, which are currently not at hand (e.g., see [29,30] for B field amplifications in non-relativistic shocks explored using hybrid simulations). As a result, is a poorly constrained quantity.
Initially, the SN ejecta remain in the free expansion phase until the reverse shock continues to exist in the outer power-law part of the ejecta. In this phase, the intensity of synchrotron radiation, for a given frequency , with synchrotron self-absorption (SSA) as the main absorption mechanism can be given by
with [38]
for a shell of thickness . Here, is the absorption frequency for which the optical depth () is one. , represents the path length, normalized by the thickness of the shell, along which the radiations travel along the line of sight. The contribution of the emission from the entire shell is obtained by varying between 0 and 1 (). For , , and , with being the optical depth. Here, and are Boltzmann constant and brightness temperature, respectively. is the radiation peak frequency.
The radio luminosity of a shell with radius is , which can be written as [27]
where , with . In the optically thin regime, i.e., , the luminosity is reduced to
with [38]
where is the coefficient for the SSA. For and a wind-like ambient medium, i.e., for , decreases with t as
and for a constant-density medium (), the optically thin luminosity is [38]
where .
For stars with a higher mass loss prior to their explosions, the density of the ambient medium is high. This medium is expected to be ionized due to the emission of strong ultraviolet radiation at the time of shock breakout and X-ray radiation from the shocked region [44]. As a result, the synchrotron radiation will suffer from external free–free absorption. If we assume that the CSM is made up of hydrogen and helium with solar abundances, the free–free absorption coefficient can be given as [16,31]
where the temperature of the CSM is represented by . Here, is the density of electrons in the ambient medium and y is the ratio between the density of the helium atom to that of the hydrogen atom. and represent the velocity average Gaunt factor for hydrogen and helium, respectively. The temperature of the ambient medium is found to be around K [45]. For , where Z represents the atomic number of a given element, and radiation in the GHz frequency regime, which is the case for radio emission, . In the case of , [46], where h is the Planck constant.
When the external free–free absorption is important, the radio luminosity becomes , where is the free–free optical depth. In the case of wind-like ionized CSM that prevail up to a radius , .
4. Observing SNe at Radio Wavelengths
Though all types of stars go through mass-loss episodes during their lifetimes, we are successful in detecting radio emissions from around 30% of core-collapse SNe [8]. In the case of Type Ia SNe (i.e., thermonuclear explosions), only very recently was a thermonuclear explosion, SN 2020eyj, detected after trying to detect these events at radio frequencies over decades of observation campaigns [7]. In the following subsections, we discuss the properties of radio emission from different types of core-collapse and Type Ia SNe.
4.1. Core-Collapse SNe
As mentioned, in the case of core-collapse SNe, the ambient media often possess a wind-like density profile, which decreases with radius. However, there are significant variations in their light curves, as the mass loss is uncertain and not very well understood before the explosion of the stars. The light curves of different types of core-collapse SNe, at 4–10 GHz frequencies, are shown in Figure 4, Figure 5 and Figure 6. Here, Figure 4 demonstrates the evolution of spectral luminosity for 106 Type II SNe (excluding Type IIn), that are located at less than 100 Mpc. The light curve of Type IIP explosion SN 1987A is shown here at 2.3 GHz. Among all core-collapse explosions, a significant percentage of these were found to belong to the Type IIP category [47]. However, the similarities between their progenitors are less pronounced. During the plateau phase of Type IIP event SN 2016X, the VLA radio observations at 4.8 and 22 GHz revealed that in the self-similar scenario, to explain the detections, a significantly higher amount (almost 30 times more) of the shock energy is required to be channeled to electrons compared with that in magnetic fields [48]. The VLA observations of SN 2016X from 21 days to 75 days at 4.8 GHz and 22 GHz are shown in Figure 7. As expected, the SN becomes brighter at the lower frequency at a later phase, around 44 days, whereas at 22 GHz, it fades away and was not detected at the last epoch of observation. The evolution of the free–free optical depth as a function of frequency for four different epochs is displayed in Figure 8, which decreases with frequency over time.
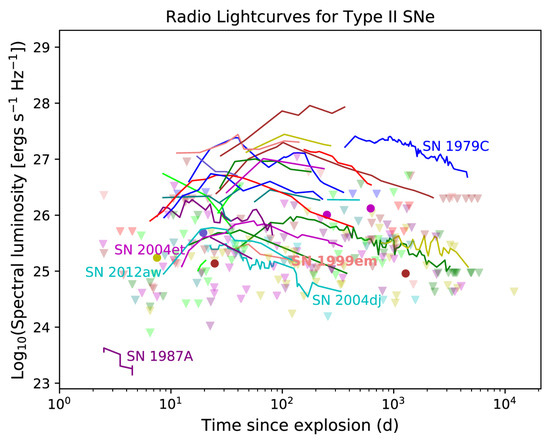
Figure 4.
Evolution of luminosities of different types of Type II explosions at 4–10 GHz, at a distance of less than 100 Mpc. The light curve of Type IIP SN 1987A is at 2.3 GHz. The continuous lines that connect different measurements of a given explosion represent SNe with multiple detections. The solid circles show single detections, and the triangles represent the upper limits. Figure reproduced from [8] with permission.
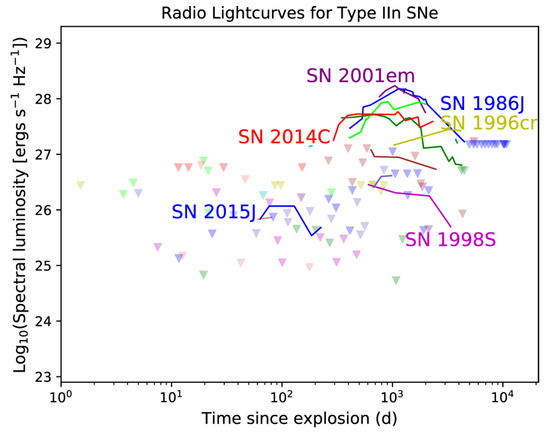
Figure 5.
Evolution of luminosities of different types of Type IIn explosions at 4–10 GHz, at a distance of less than 100 Mpc. See the caption of Figure 4 for the details about lines and symbols used in this diagram. Figure reproduced from [8] with permission.
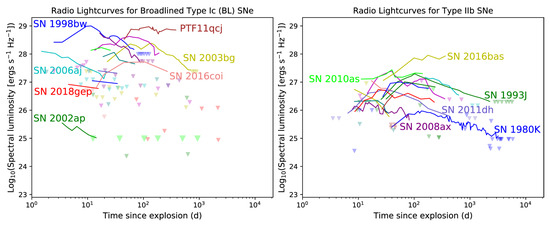
Figure 6.
Light curves of different types of Type Ic (broad line) and Type IIb are displayed in the left and right panels at 4–10 GHz. For Type Ic, explosions beyond 100 Mpc are included in this diagram, whereas for Type IIb, SNe within 100 Mpc are taken into consideration. For the details about lines and symbols used in this diagram, see the caption of Figure 4. Figure reproduced from [8] with permission.
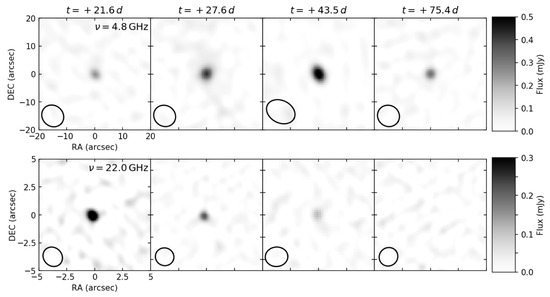
Figure 7.
VLA observations of SN 2016X from 21 days to 75 days at 4.8 GHz and 22 GHz. Figure reproduced from [48] with permission. For each image, the secondary beam size is different, as shown on the bottom left of each of them.
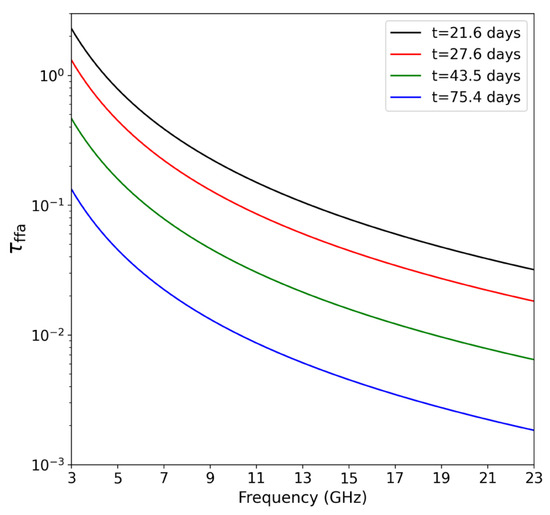
Figure 8.
Evolution of optical depth with frequency at four different epochs for SN 2016X. Figure reproduced from [48] with permission.
Among core-collapse SNe, the Type IIn progenitors eject a substantial amount of matter prior to their explosions. The light curves of a handful of Type IIn SNe are displayed in Figure 5. In most cases, these SNe start to be seen at radio wavelengths at a much later epoch, and they often remain visible for a longer duration compared with other types of core-collapse explosions. A peculiar double-exploded Type IIn event is SN 2009ip. This explosion raised significant doubts about the explosion of massive stars and their mass-loss episodes [49,50,51,52]. The spectral energy distribution (SED) of this explosion around the optical peak (30 September 2012) during the double-explosion episode in 2012 is shown in Figure 9 from radio to gamma rays. At radio wavelengths, the SN is not detected as a result of free–free absorption by the external high-density material. Compared with other X-ray-bright IIn events, SN 2009ip is a weak emitter of X-rays [51,53,54,55,56,57,58,59,60,61,62,63,64], as shown in Figure 10.
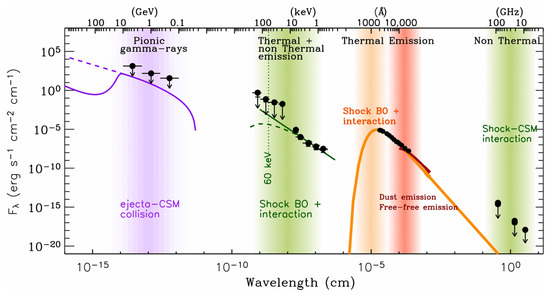
Figure 9.
The SED of SN 2009ip around the optical peak, 30 September 2012, from radio to gamma rays. At radio wavelength, the SN is not detected as a result of free–free absorption by the external high-density material. Figure reproduced from [51] with permission.
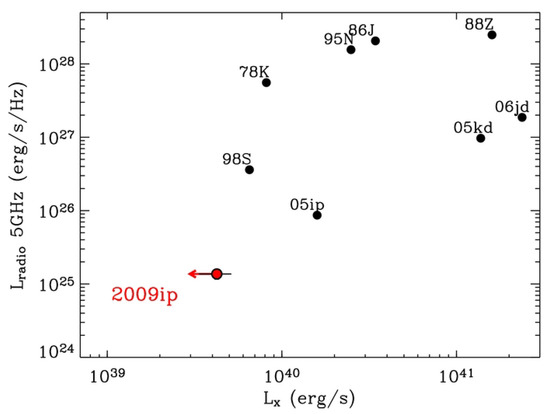
Figure 10.
Radio luminosity at 5 GHz peak and X-ray luminosity at radio peak for SN 2009ip along with X-ray-bright Type IIn SNe. As demonstrated here, SN 2009ip (represented by a red dot) is not a strong radio and X-ray emitter, like other IIn events, shown as black dots. At its radio peak, SN 2009ip was not detected at X-ray frequencies, as indicated by the red arrow. Figure reproduced from [51] with permission.
In Figure 6, the light curves of the fully (Type Ic) or partially (Type IIb) stripped-envelope SNe are shown in the frequency window of 4–10 GHz. While for Type IIb, only SNe within 100 Mpc are included, for Type Ic (broad line; BL), those beyond this distance are also considered. As illustrated in the left panel of Figure 6, SNe 1998bw and PTF11qcj have the highest spectral luminosities among all explosions observed to date. Additionally, the latter explosion continues to be brighter for a significantly longer duration. The early light curves of the Type Ic-BL explosions, SNe 1998bw and PTF11qcj, have revealed two radio peaks, as demonstrated in Figure 11. However, the second peak for PTF11qcj is brighter than the first peak, which is in contrast to what was observed for SN 1998bw, which is linked to a long Gamma-Ray Burst (GRB) event. While the second radio-bright peak could be due to a variation in the density of the CSM, it may indicate the presence of a GRB off-axis jet [65]. To further investigate the possibility of the association of the radio rebrightening of PTF11qcj with a GRB jet, this event was observed with Very-Long-Baseline Interferometry (VLBI) at 1.66 GHz and 15.37 GHz around 7.5 years after the explosion, which is shown in Figure 12. At the submillisecond level, the unresolved radio-emitting ejecta suggest the absence of relativistically ejected material [66], implying that this explosion is unlikely to be linked to an off-axis GRB event [66]. As a result, the enhancement in radio flux could be due to an interaction with a high-density ambient medium. The VLBI observations of PTF11qcj predict a radial expansion of around cm, which implies an angular diameter of around 0.4 mas [66]. The radial expansion of this SN with time, as shown in Figure 13, revealed a decelerated shock during the time of its second radio peak. This feature is found to be similar to that of SN 2014C, which was originally classified as a Type Ib explosion, but at a later stage, it emerged as a Type IIn event when it started to interact with a dense CSM ejected by the progenitor before the explosion [13,67,68].
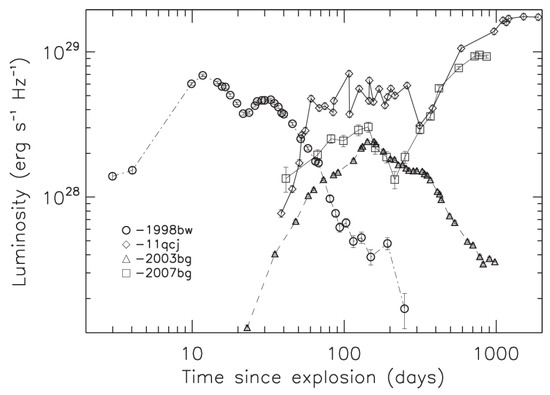
Figure 11.
Spectral luminosity variation with time at 5 GHz for two Type Ic-BL explosions, SNe 1998bw and PTF11qcj, along with that of Type Ibc/IIb SNe, SN 2003bg and 2007bg. Figure reproduced from [65] with permission.
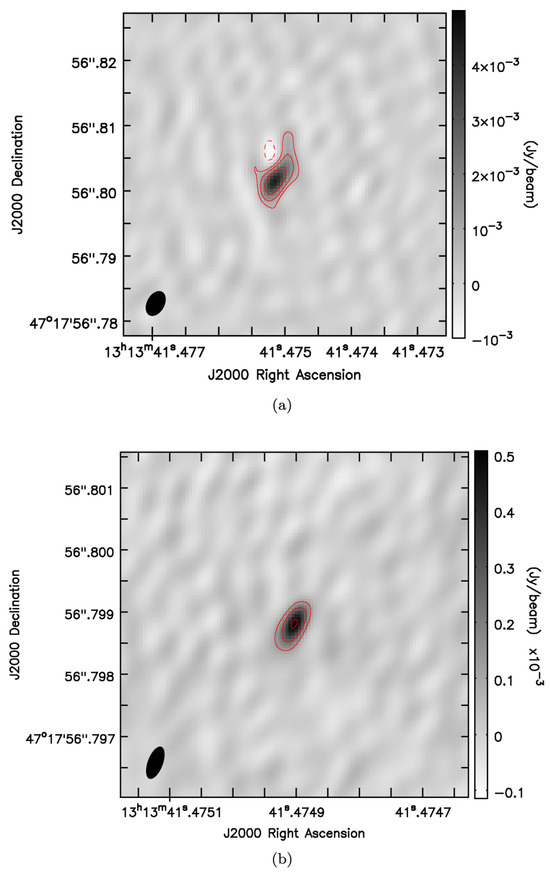
Figure 12.
The VLBI observations of Type Ic-BL PTF11qcj at (a) 1.66 GHz and (b) 15.37 GHz around 7.5 years after the explosion. The rms noises at these frequencies are 125 Jy/beam and 24 Jy/beam, respectively. The contours here represent () times the rms noise at the corresponding frequencies. Figure reproduced from [66] with permission.
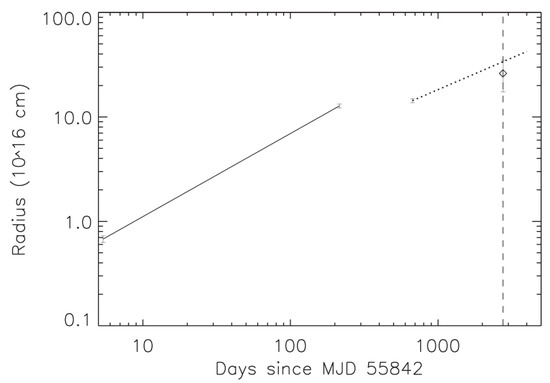
Figure 13.
The radial expansion of SN PTF11qcj as a function of time. The dashed line represents the 16 GHz VLBI observations. The VLBI 15 GHz detection, displayed by a diamond, predicts a radius of around cm, which implies an angular diameter of around 0.4 mas. The shock is decelerated during its rebrightening phase. Figure reproduced from [66] with permission.
Another stripped-envelope supernova that has radio luminosity comparable to that of SN 1998w is Type Ibc SN 2003L [69]. The Very-Long-Baseline Array (VLBA) observations of this SN at 4.9 GHz around 65 days after the explosion are shown in Figure 14. At this frequency, this event was detected with a flux density of Jy. This detection implies that around 65 days after the explosion, the SN did not expand beyond a radius of cm, suggesting the presence of subrelativistic ejecta for SN 2003L, which is in contrast to SN 1998bw, for which the radio-emitting shell is found to expand at mildly relativistic speed [69]. The evolution of the spectral indices of this SN as a function of time is shown in Figure 15. In the optically thin regime, the spectral index is estimated to be around −1.1 [69].
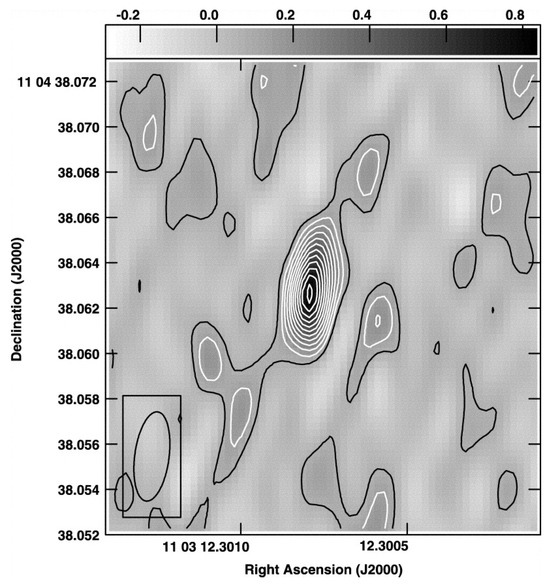
Figure 14.
The VLBA observations of Type Ibc SN 2003L at 4.9 GHz around 65 days after the explosion. The flux density at this frequency is found to be Jy. This detection implies that the SN did not expand beyond a radius of cm, suggesting the presence of subrelativistic ejecta for this event. The contours here represent an increment of 1 in flux density which is around 67 Jy. Figure reproduced from [69] with permission.
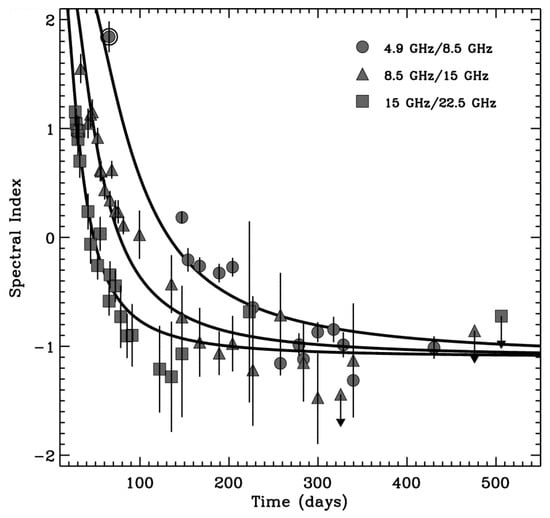
Figure 15.
Evolution of spectral indices of SN 2003L as a function of time at 4.9 GHz/8.5 GHz, 8.5 GHz/15 GHz, and 15 GHz/22.5 GHz displayed as solid circles, triangles, and squares, respectively. The circled dot represents the VLBA observation. The solid lines are the model predictions of the SSA model discussed in [69]. Figure reproduced from [69] with permission.
Generally, stripped-envelope SNe are believed to be explosions in binary systems, and it is the binary interactions that lead to the ejection of their complete or partial envelope [70]. Studies have shown that in isolation, stars with zero-age main-sequence (ZAMS) masses of more than 20 can undergo significant mass loss due to strong winds [71,72]. However, the number of single massive stars is not high enough to match the rate of stripped-envelope SNe. In addition, stars that end their lives with very low envelope masses can occur only for those within very shallow and specific ranges of their ZAMS masses [73]. A small fraction of these stripped-envelope explosions are expected to be associated with long GRB events such as SN 1998bw [74,75]. With late-time radio observations of around 70 Type Ibc SNe, Soderberg et al. 2006c [76] established that at most, a few percent of Type Ibc events are likely to have been associated with off-axis GRB jets. Figure 16 demonstrates late-time radio observations ((3 upper limits)) of these 68 Ibc events at 8.46 GHz, together with the GRB afterglow models for both wind-like and ISM media for the viewing angles of 30 °, 60 °, and 90 ° from the initially collimated direction of the GRB jet. For all these off-axis viewing angles, the models predict much higher radio luminosity for standard GRB parameters (where the beam-corrected ejecta energy is erg; the GRB jet opening angle = 5°; ; for a wind like medium km s−1, ; and for an ISM medium, the particle density is assumed to be 1 cm−3). Although the Very Large Array Intensive Study of Naked Supernovae ([77,78]) program has observed a good number of Type Ibc SNe at radio wavelengths [69,76,79,80,81,82,83,84], to establish a clear connection between GRB and stripped-envelope SNe, a larger sample of hydrogen-poor supernovae should be studied at both early and late epochs at wideband radio wavelengths.
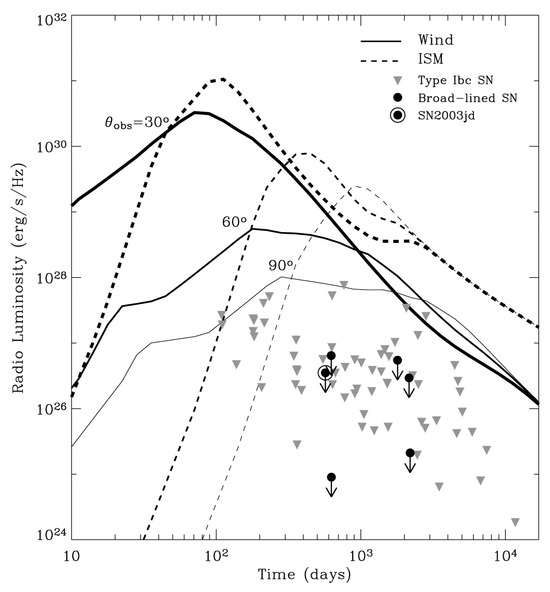
Figure 16.
Late-time radio observations (3 upper limits) of 62 Ibc events, in filled faded triangles, and 6 broad-lined SNe, in filled circles with arrows, at 8.46 GHz, along with the GRB afterglow models for both wind-like and ISM media for the viewing angles of 30 °, 60 °, and 90 ° from the initially collimated direction of the GRB jet. For all these off-axis viewing angles, the models predict much higher radio luminosity for standard GRB parameters (where the beam-corrected ejecta energy is erg; the GRB jet opening angle = 5°; ; for a wind-like medium km s−1, ; and for an ISM medium, the particle density is assumed to be 1 cm−3). Figure reproduced from [76] with permission.
Additionally, study on a limited sample of early and late-time radio observations of hydrogen-poor superluminous (SL) SNe, which are at least ten times more luminous than normal core-collapse SNe [85,86,87,88], reveals the absence of relativistic jets in the majority of Type I SLSNe. For comparison, the radio light curves of Type I SLSNe and GRBs are shown in Figure 17. After decades of effort, the earliest radio detection yield from SLSN 2017ens was around 3.3 years after the explosion [89]. The early detection of radio emissions from such events is crucial to probing the presence of mildly relativistic jets in the early phase of the explosion, as explained earlier.
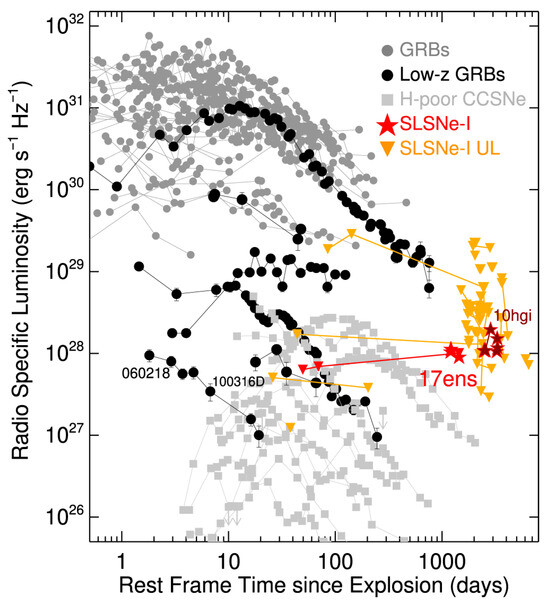
Figure 17.
The radio light curves of Type I SLSNe and GRBs. The triangles displays the radio upper limits for Type I SLSNe, while the red stars represents the radio detection that was obtained from SN 2017ens around 3.3 years after the explosion. Figure reproduced from [89] with permission.
Furthermore, to explore these hydrogen-poor SNe in the hundreds-of-GHz regime, the mass-loss history of the pre-SN star of the nearby Type Ic explosion SN 2020oi was investigated by Keichii et al. in 2021 [90] using radio observations of the Atacama Large Millimeter/submillimeter Array (ALMA). The results suggested a variable mass loss of the progenitor prior to the explosion with a time scale for each mass loss phase lasted less than a year. The radio spectral energy distributions (SEDs) of the SN on day 5, day 18, and day 51 after the explosion are shown in Figure 18 as red, blue, and black dashed lines, respectively. In the optically thick regime, the flux varies with frequency with a spectral index of 2.5, and in the optically thin regime, it is in the range of to . As observed in the SEDs, on day 5, the SN just becomes optically thin at 44 GHz, whereas it is in the fully thin regime at 100 GHz by this time, which provides a stringent limit on the density of the CSM around the SN.
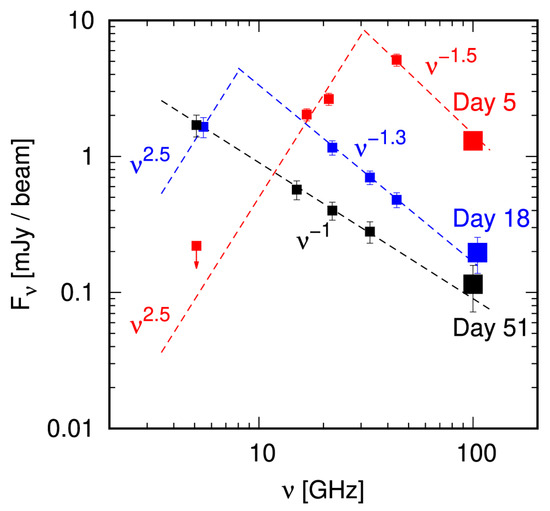
Figure 18.
SEDs of SN 2020oi on day 5, day 18, and day 51. In the optically thick regime, the flux varies with frequency with a spectral index of 2.5, and in the optically thin regime, it is in the range of to . As observed in the SEDs, on day 5, the SN just becomes optically thin at 44 GHz, whereas it is in the fully thin regime at 100 GHz by this time. Figure reproduced from [90] with permission.
The radio light curves of partially stripped hydrogen envelope explosions, called SNe of Type IIb, are shown in the right panel of Figure 6. Some Type IIb SNe have been found to remain bright at radio wavelengths for decades; one such SN is Type IIb SN 1993J, which was detected from a couple of weeks after the explosion up to several decades [15,91,92,93,94,95]. The almost spherical radio shell of this SN is well resolved by Very-Large-Baseline Interferometry (VLBI) (for details, see [92,93]). Analyzing the pre-explosion images, Chen et al. 1995 [96] identified the progenitor star of SN 1993J. Another Type IIb SN, which has shown radio evolution similar to that of SN 1993J, is SN 2011dh (see the SN 2011dh light curve in the right panel of Figure 6). The other few SNe for which pre-SN stars are detected are SN 2008ax, SN 2011dh, and SN 2013df [97,98,99]. In addition, using ultraviolet emissions, the binary companion of Type IIb SN 2001ig was recently detected by Ryder et al. in 2018 [100].
The radio light curves of SN 1993J have shown a sudden decrease in fluxes beyond around 3000 days after the explosion, as shown in Figure 19. Using the ejecta profile from STELLA (see left panel of Figure 3) and performing the hydrodynamical simulation of SN-CSM interaction, Kundu et al. (2019) [16] have concluded that this downturn of the radio fluxes could be associated with a much lower mass-loss rate beyond around 6600 years prior to the explosion. Beyond the main-sequence phase of the primary stage, the progenitor started to lose matter at a much higher rate, which caused a dense CSM around the SN. A similar decrease in X-rays is also observed around a similar time. By analyzing both radio and X-ray evolutions of SN 1993, it was found that a wind-like ambient medium with exists up to a radius of (≡) cm, which represents the evolution of the SN up to around 3000 days after the explosion. Beyond this, the density of the CSM decreases rapidly. To reproduce the evolution of radio and X-ray fluxes after 1000 days, the CSM is proposed to have a density profile of [38]
where , with . As the density of the CSM decreases beyond , when modeling the radio light curves, as displayed by the dashed lines in Figure 19, the free–free optical depth will have the form , where and , respectively. At , the medium is characterized by . The recent phase space analysis of by Sfaradi et al. (2025) [101], using radio-detected and non-detected Type II and stripped-envelope SNe, has ruled out a mass-loss rate that lies in the range of to for wind velocity , as shown in Figure 20.
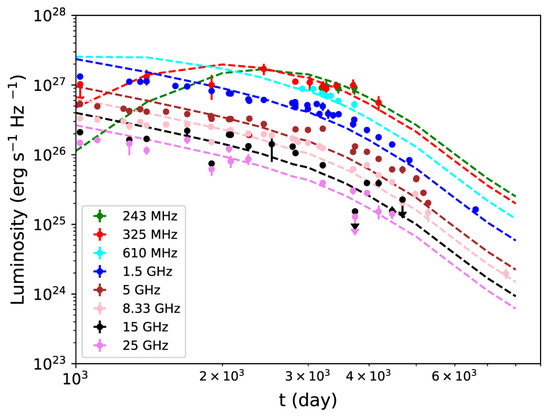
Figure 19.
Radio light curves of SN 1993J after 1000 days from explosion. Filled circles represent the detections, while the arrows show the 3 upper limits. The radio fluxes show a sudden downturn beyond around 3000 days. Before this decrease, the ambient medium can be characterized as . See text for details. Figure reproduced from [16] with permission.
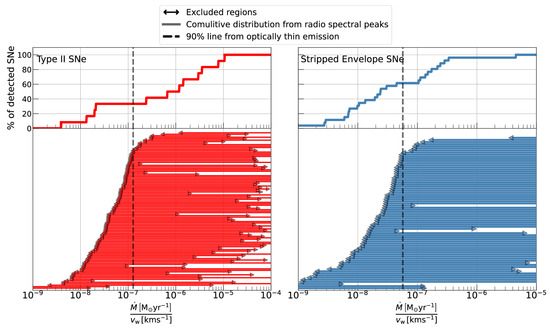
Figure 20.
The phase space for for radio-detected and non-detected SNe for Type II SNe (left panel) and stripped-envelope SNe (right panel). Figure reproduced from [101] with permission. At the top of the figure, the ‘Comulitive distribution’ should be read as ‘Cumulative distribution’.
A peculiar Type IIL/IIb explosion is SN 2018ivc, for which multiwavelength emissions are found to be primarily powered by SN-CSM interactions [102]. The radio images of this SN at 100 (Band 3) and 250 GHz (Band 6), using ALMA are shown in Figure 21 for four different epochs since the explosion. As displayed, from epochs 1 to 3, the SN gets brighter at 100 GHz, whereas it maintains almost similar brightness in the first two epochs at 250 GHz. In the last epoch, the SN has reduced flux densities at both frequencies. It is concluded from the radio study that the mass-loss rate of the pre-SN star was almost five times higher than that of SN 1993J in the last 200 years of its evolution [103]. The history of mass loss of this SN suggests that it is a transitional event from a Type II/IIL to a Type IIb/Ib/Ic event.
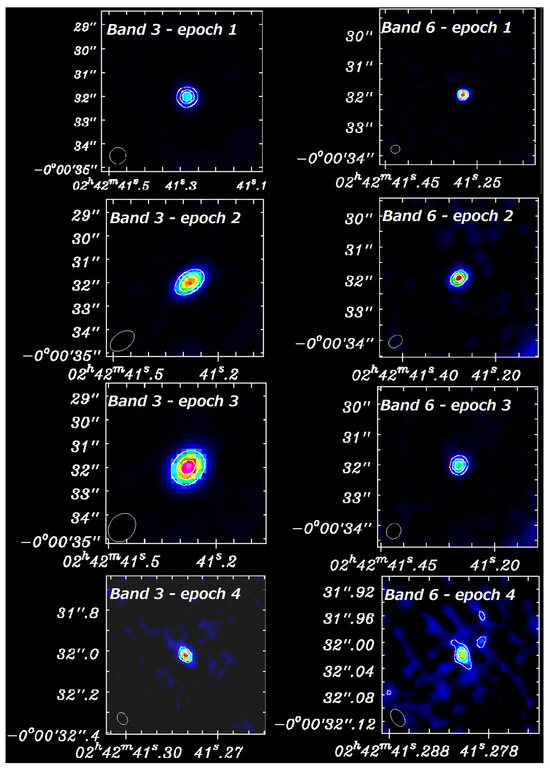
Figure 21.
Radio images of SN 2018ivc at 100 and 250 GHz, using ALMA, 4.1, 7.1, 17.1, and 198.6 days after the explosion. Band 3 corresponds to the 100 GHz observations, and Band 6 represents the observations at 250 GHz. The contours here represent 35%, 60% and 80% of the peak flux density. At 100 GHz, For the first three epochs, the color is normalized by the flux density in the range 0 to 10 mJy, and for the first three 250 GHz observations, it is in the range of 0 to 5 mJy. For the 4th epoch of observations, color normalization is performed in ranges of 0 to 0.4 mJy for Band 3 and 0 to 0.2 mJy for Band 6. Figure reproduced from [103] with permission.
Furthermore, using Markov Chain Monte Carlo analysis on 32 core-collapse SNe for which clear peaks were detected in their light curves, Matsuoka et al. (2025) [104] predicted that the mass-loss rate of stripped-envelope SNe could be an order of magnitude higher than that of Type II SNe. Although this investigation did not rule out the possibility of energy equipartition between the magnetic field and electrons, the authors found both .
Apart from these, in the past decade, with the large number of multiwavelength surveys, a different class of core-collapse SNe has been discovered; it has shown rapid evolution at optical wavelengths compared with other traditional SNe and was therefore named fast blue optical transients (FBOTs; [105,106,107,108,109,110,111]). The radio and millimeter observations of Zwicky Transient Facility (ZTF) detected FBOTs, as shown in Figure 22. Among the ZTF-detected FBOTs, three were categorized as Type Ibn, one as Type IIn, and one as Type IIn/Ibn explosion. As seen, these events are much less radio-bright compared with radio-loud FBOTs such as Cow/AT2018cow, Koala/AT2018lug [108,109,112,113,114,115], CSS161010 [113], and Camel/AT 2020xnd [116]. The Ic-BL SN included in this comparison is the rapidly rising stripped-envelope event SN2018gep [117].
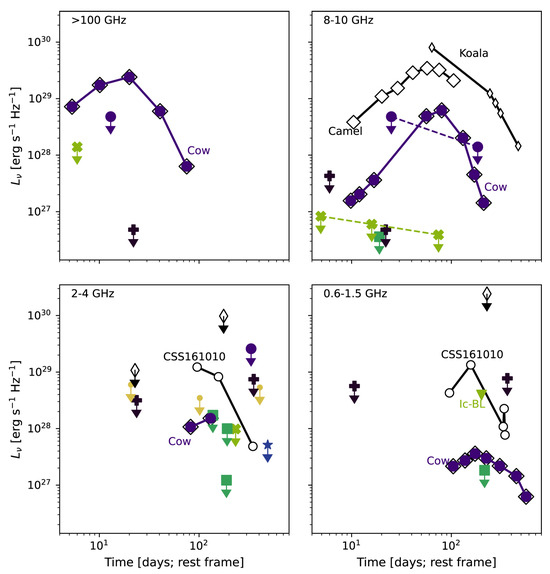
Figure 22.
The radio and millimeter observations of Zwicky Transient Facility (ZTF)-detected FBOTs. Here, the big purple circles, black pluses, green crosses, squares, stars, diamonds, and small gold circles represent IIn/Ibn, Ibn, Ic-BL, IIb, Ib, featureless, and unknown types of events. Among the ZTF-detected FBOTs, three are categorized as Type Ibn, one as Type IIn, and one as Type IIn/Ibn explosion. As seen, these events are much less radio-bright compared to radio-loud FBOTs such as Cow/AT2018cow, Koala/AT2018lug [108,109,112,113,114,115], CSS161010 [113], and Camel/AT 2020xnd [116]. The Ic-BL SN included in this comparison is the rapidly rising stripped-envelope event SN2018gep [117]. Figure reproduced from [112] with permission.
4.2. Thermonuclear SNe (Type Ia Explosions)
Thermonuclear explosions of WDs can occur mainly through two channels, the SD and DD channels. As explained in Section 2.1, for both scenarios, the density profiles of the circumbinary media are different. As a result, the evolution of the radio fluxes differs for the SD and DD channels. This provides stringent constraints on the pre-SN systems, which are very poorly understood for Type Ia explosions. However, despite several attempts made to detect these SNe at radio wavelengths, we were unsuccessful in detecting radio emission from all these events except from one very recent Type Ia SN, SN 2020eyj.
The nearest Type Ia explosion in the last few decades is SN 2014J [118] at a distance of around 3.4 Mpc, which gave us an enormous opportunity to study the circumbinary medium and thus explore the progenitor system of this event. To achieve these goals, this SN was observed at radio wavelengths from very early times, around 8 days after the explosion, to around 1.5 years [38,119]. None of these observations yielded detections. However, the upper limits obtained at different radio frequencies provide stringent constraints on the density of the CSM for both SD and DD scenarios. In Figure 23, the radio light curves of SN 2014J with the upper limits and the models, in solid lines, for the DD (left panel) and SD (right panel) channels are shown. Assuming equipartition of energy between electron and magnetic fields with 10% of the bulk kinetic energy channeling to each of them, i.e., and , the observation performed around 8 days after the explosion at 5.5 GHz limits for (see the right panel of Figure 23). For the same shock parameters, late-epoch observations at 1.66 GHz limit (see the left panel of Figure 23). Both provide the deepest limits on the CSM density for any Type Ia SNe to date, ruling out a significant number of pre-SN systems being the progenitors of SN 2014J. The radio non-detections and the modeling suggested that this SN could be the result of the merger of two WDs, which justified the tenuous medium around the event. Although these findings left little room for the SD scenario, the spin-up/-down channel and the recurrent novae system can cause very-low-density media to exist around the pre-SN system (see [38] for details).
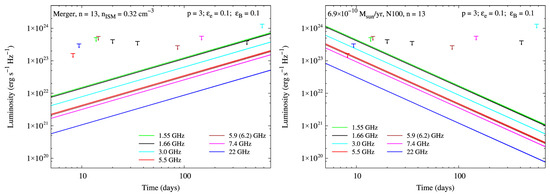
Figure 23.
Radio light curves of SN 2014J when it plows through a constant-density medium (left panel) and a wind-like medium (right panel). The arrows represent the 3 upper limit on radio fluxes at different frequencies. For , , and , late epoch observations at 1.66 GHz limit . For the same parameters, the observation performed around 8 days after the explosion at 5.5 GHz limits for . Figure reproduced from [38] with permission.
To explore the progenitors of these events, radio emission from an ensemble of Type Ia explosions was examined [10,120]. The radio light curves of different Ia SNe at various radio frequencies for a wind-like medium (i.e., ) and are shown in Figure 24. Assuming , the comparisons between the radio model and the observed upper limits constrain in the range of – for .
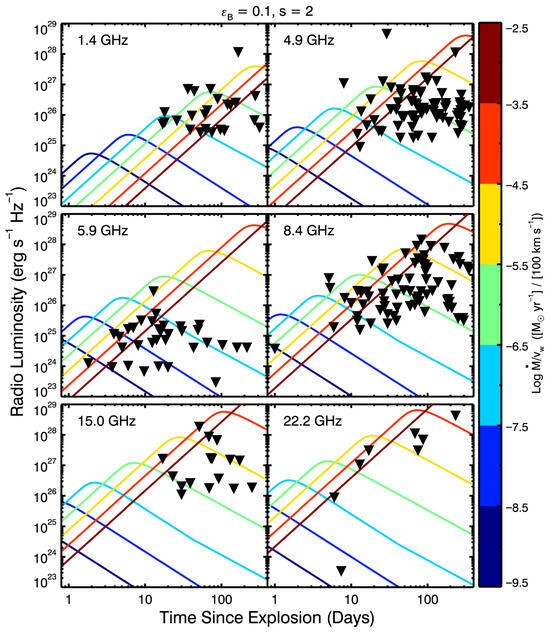
Figure 24.
Radio light curves of various Type Ia SNe at different radio frequencies for a wind-like medium (i.e., ) and . The inverted triangles are three sigma upper limits on radio emissions from different Type Ia SNe. The color bar on the right displays the different mass-loss rates of the pre-SN system in different colors for 100 km s−1. Figure reproduced from [10] with permission.
Constraints on the mass-loss rates for different Type Ia explosions obtained from these analyzes allow us to rule out and limit the possible progenitor systems for the SD scenario. As shown in Figure 25, in the case of SN 2014J, the modeling of radio non-detections allows only a small parameter space to be consistent with the observations, favoring the DD scenario for this event. Another nearby Type Ia explosion is SN 2011fe, for which a similar conclusion is drawn using rigorous modeling and radio observations for up to 4 years since the explosion (see [38] for details). For other thermonuclear explosions, the possible progenitor systems within the SD scenario are also displayed here. In the case of the presence of a symbiotic companion, like a red giant star, the radio emissions are expected to be much brighter. Since, for these SNe, no radio emission is detected, the possibility of the presence of a symbiotic star as a secondary star is ruled out for most of the progenitor systems.
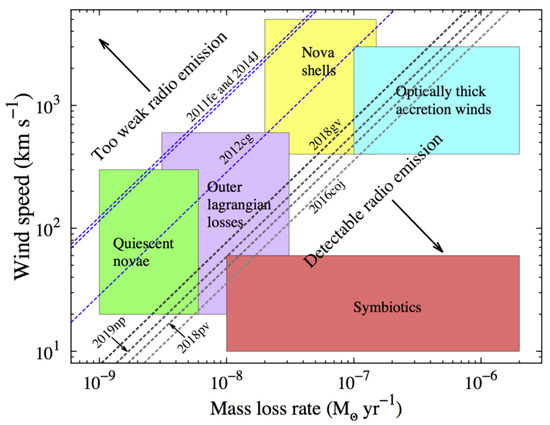
Figure 25.
For the SD scenario of thermonuclear explosion, the constraints on the parameter space. For low value of and high , the radio emission would be feeble, which is labeled as the Too weak radio emission regime in the figure. This scenario is true for SN 2014J (see text for details), which rules out a significant number of pre-SN systems for this SN. A similar conclusion can be drawn for SN 2011fe, which is another nearby Type Ia explosion. For other thermonuclear explosions, the possible progenitor systems within the SD scenario are also displayed. Figure reproduced from [120] with permission.
Categorizing around 80 Type Ia SNe according to their rise time in the B-band into eight different subgroups, Chomiuk et al. 2016 [10] estimated the upper limits of the CSM particle density from radio observations for the DD scenario, which is shown in Figure 26. The solid histograms give the limits for and the dotted histogram is that for . As demonstrated in Figure 26, for some Type Ia events, the density can be as high as ∼ cm−3, although for most of them, the ambient media have low densities.
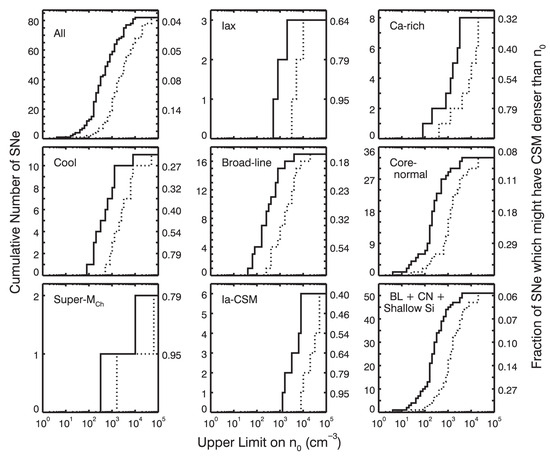
Figure 26.
Upper limits on the CSM particle density from radio observations for the DD scenario for different subgroups (for details about the subgroups, see [10] and references therein). The solid cumulative histograms give the limits for , and the dotted histogram is that for . Figure reproduced from [10] with permission.
To further investigate the non-detections of SNe of Type Ia at radio wavelengths, the efficiency of the cooling of the relativistic electrons responsible for radio synchrotron radiation behind the shock front as a function of time for different magnetic field strengths is examined by Harris et al. (2023) [121] using the SuperNova Explosion Code [122,123]. They concluded that after interaction, the relativistic electrons cool at a significantly faster pace, as shown in Figure 27.
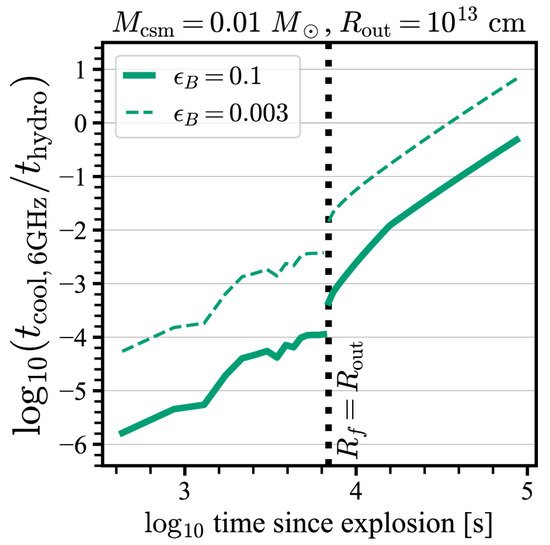
Figure 27.
Cooling efficiency of relativistic electrons responsible for radio synchrotron radiation behind the shock front as a function of time for different magnetic field strengths. Figure reproduced from [121] with permission. The black dotted vertical line represents the time at which the compact shell is overtaken by the shock.
Until now, the single Type Ia event detected at radio wavelength is SN 2020eyj [7]. The radio observations carried out around 605 and 741 days after the explosion of this SN yielded the detection at 5.1 GHz. The radio detections along with the model predictions are shown in Figure 28, suggesting an SD explosion channel for this event. The detections are consistent for a wind model (i.e., ) with between and for a when varies between and . The detections are also consistent with a shell model, where the CSM is concentrated in a shell. If this SN was due to the merger of double WDs, radio emission predicts that the ambient medium should then have a much higher density, with –600 .
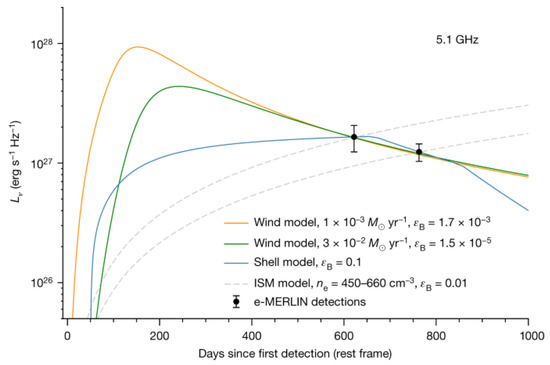
Figure 28.
SN 2020eyj radio light curves at 5.1 GHz. This is the only Type Ia SN that is detected at radio wavelengths, shown here by the filled circles (the observations were conducted with the e-MERLIN telescope). For both wind-like and constant-density medium, the radio emissions are modeled here to get the mass-loss rate of the progenitor systems or the ISM density for different values of . Figure reproduced from [7] with permission.
As several observation campaigns aimed at detecting radio emission from Type Ia events resulted in non-detections [38,119,120,121,124,125,126,127,128], nova outbursts could be a common cause that occurs in most Ia systems before explosions. These outbursts sweep the CSM into dense shells away from the pre-SN system and therefore create a tenuous medium close to the progenitor site [129,130,131]. The radio emissions from these dense CSM shells were investigated by Harries et al. in 2016 [132], as shown in Figure 29, who demonstrated that the radio emission expected from the two-shell model (2sh27) is drastically different from that of the one-shell model (1sh5, 1sh50). Additionally, there are episodes of no emission from the low-density media that exist between the shells.
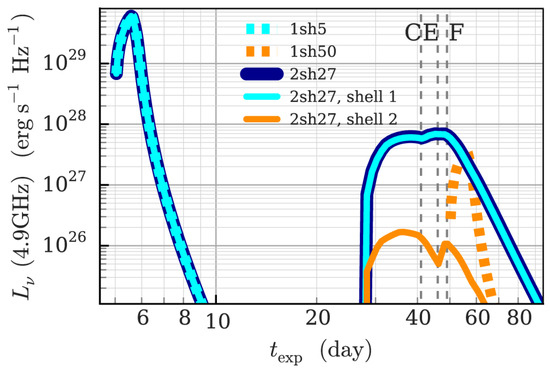
Figure 29.
Radio emissions from dense CSM shells, created due to recurrent novae. The single-shell models are represented by thick dashed lines. Figure reproduced from [132] with permission.
5. Discussion
The study of radio emissions from SNe is an excellent probe for gaining information about progenitor stars through their mass-loss history before the explosion. Several core-collapse SNe have shown excessive mass losses just before collapse, which caused enhanced radio emission from these events. Due to the gaps in our understanding of what happens just prior to and during the explosion and the lack of direct observational proof of stars’ behavior during these phases, the study of radio emission provides compelling information that allows us to explore the final stages of stars’ life leading to the explosions, which otherwise would not be possible to investigate.
Apart from the above, resolving SNe at radio wavelengths gives the maximum extent of the event and enables us to get information about possible asphericity in the explosions. As seen in the case of SN 1993J, the radio emissions trace a nearly spherical shell. Moreover, also for some SN remnants, similar spherical shell structures have been observed [133]. The best way to understand the expansion of the shocks, hence the SN, is through VLBI/VLBA observations because of their imaging capability at the milliarcsecond level, as described in the previous section. While a microarcsecond level of accuracy can be obtained using the Event Horizon Telescope, it can be achieved mainly for objects with higher brightness temperatures and frequencies higher than around 250 GHz. As mentioned earlier, a milliarcsecond level of accuracy is essential to understanding the GRB-SN connection and constrain the immediate surroundings of the explosions. Furthermore, a couple of fast radio burst (FRBs) events are found to be associated with SN explosions [134,135,136,137]. Since FRBs are mainly cosmological in origin, to investigate the connection between SNe and FRBs, Long-Baseline Interferometric observations have been proven to be fruitful [138,139,140,141].
Type Ia explosions are considered standard candles in cosmology; however, the progenitors of these explosions are poorly constrained. Although, to date, we have only one thermonuclear SN detected at radio frequencies, most Type Ia SN remnants show detectable radio emissions (e.g., see [142]). It is expected that a certain percentage of these explosions arise from the SD channels; however, the radio non-detections point towards a significant number of these events being due to the merger of two WDs. On the other hand, recurrent novae, which can cause a tenuous medium to exist around the pre-SN system, could be the reason for a significant number of these non-detections.
Besides providing stringent constraints on pre-SN systems, rigorous investigations of radio emissions from SNe allow us to understand the microparameters of shock physics. SN shocks have high Mach numbers (>1000), making them computationally unfathomable because of current computational limitations. As a result, the best diagnostic tool for exploring shock physics is through the investigation of radio emissions that originate from the shock-accelerated particles in the presence of magnetic fields, which get amplified in shocked shells. Using the radio observations of the nearest-two Type Ia explosions, SN 2014J and SN 2011fe, Kundu et al. (2017) tried to constrained the amplifications of magnetic fields in SN shocks [38]. This investigation favors low amplification of magnetic fields in SN shocks with .
6. Conclusions
With numerous applications, SNe, whether detected or not detected at radio wavelengths, enrich our understanding of a wide variety of objects and phenomena in the universe, ranging from exploring different types of stars leading to explosions to shock physics and explosion mechanisms. Wide-field all-sky radio surveys, such as the VLASS, with sky coverage above declination >−40° (equivalent to a coverage of around 33,885 ), in the frequency window of 2–4 GHz [143], and ASKAP VAST Pilot surveys, covering the southern hemisphere, have been successful in detecting the rebrightening of SNe at later stages of their lives [144,145]. These detections open new pathways for reconstructing the mass-loss history of progenitor stars much earlier than their catastrophic destruction occurred, which provides stringent constraints on the evolution of progenitor stars that are otherwise impossible to retrieve.
The current generation radio telescopes, such as the LOw-Frequency ARray (LOFAR) [146], the upgraded Giant Meterwave Radio telescope [147,148], MeerKAT [149], the ASKAP, Parkes [150], the Green Bank Telescope [151], the VLA [17,18,19], the Australia Telescope Compact Array [152], and the ALMA [153], along with VLBI/VLBA, have made it possible to observe SNe in regimes from as low as 100 MHz to a few hundred GHz. This wide range of coverage, combined with improved resolution, enables us to explore the underlying physics of explosions in greater detail and address the open issues in this field. The lack of detection of thermonuclear SNe at radio wavelengths raises significant doubts about the nature of their pre-SN systems. At present, most predictions regarding the progenitors of Type Ia events are based on early-time radio observations. However, for a clearer picture, periodic and systematic observations of these explosions at early and late times are crucial. In the case of core-collapse SNe, although around 30% of the explosions are detected at radio frequencies, for almost all (except for a few) explosions, the data are not well sampled, introducing larger uncertainties when determining the progenitor’s mass-loss episodes at different stages. In addition to these, other observational issues involve the non-detection of SNe as a result of the inadequate sensitivity of the telescopes.
Another major issue regarding the interpretation of radio emissions arises because of superficial knowledge of shock physics. The acceleration of charged particles and amplifications of magnetic fields, which play a crucial role in estimating the intensity of radio emission in SN shocks, are poorly constrained. Furthermore, there is ample evidence of asymmetric explosions and inhomogeneous matter distributions in ambient media. As a result, assumptions of spherical shock structure and homogeneous CSM distribution, which are widely considered when estimating radio emissions from SNe, prevent us from determining radio emission properties with higher accuracy. From the point of view of cosmology, the progenitors of Type Ia explosions are crucial to understanding and exploring the expanding universe to a greater extent. Nevertheless, 21 cm radio observations offer us the opportunity to delve into the universe up to a redshift of around 150, where the first structures of the universe and stars are expected to be created (for details see, e.g., [154]). The upcoming/next-generation radio telescopes, such as the Square Kilometre Array (SKA) [155], the next-generation VLA (ngVLA) [156], and LOFAR2.0 (https://www.lofar.eu/wp-content/uploads/2023/04/LOFAR2_0_White_Paper_v2023.1.pdf, accessed on 30 May 2025), are expected to reshape SN radio astronomy by providing further insights into these explosions.
Funding
This research received no external funding.
Data Availability Statement
All the data used in this article are published; therefore, they can be acquired from the articles cited here.
Acknowledgments
The author thanks the anonymous referees for their helpful comments.
Conflicts of Interest
The author declares no conflicts of interest.
Abbreviations
The following abbreviations are used in this manuscript:
| SN | Supernova |
| SLSN | Superluminous Supernova |
| GRB | Gamma-Ray Burst |
| RT | Rayleigh–Taylor |
| CSM | Circumstellar medium |
| WD | White dwarf |
| SD | Single degenerate |
| DD | Double degenerate |
| SED | Spectral energy distribution |
| VLBI | Very-Large-Baseline Interferometry |
| VLBA | Very-Long-Baseline Array |
| VLA | Very Large Array |
| VLASS | Very Large Array Sky Survey |
| VAST | Variable and Slow Transients |
| ASKAP | Australian Square Kilometre Array Pathfinder |
| ALMA | Atacama Large Millimeter/submillimeter Array |
| uGMRT | upgraded Giant Meterwave Radio telescope |
| LOFAR | LOw-Frequency ARray |
| ATCA | Australia Telescope Compact Array |
| SKA | Square Kilometre Array |
References
- Smith, N.; Arnett, W.D. Preparing for an Explosion: Hydrodynamic Instabilities and Turbulence in Presupernovae. Astrophys. J. 2014, 785, 82. [Google Scholar] [CrossRef]
- Smith, N. Mass Loss: Its Effect on the Evolution and Fate of High-Mass Stars. Annu. Rev. Astron. Astrophys. 2014, 52, 487–528. [Google Scholar] [CrossRef]
- Hoyle, F.; Fowler, W.A. Nucleosynthesis in Supernovae. Astrophys. J. 1960, 132, 565. [Google Scholar] [CrossRef]
- Whelan, J.; Iben, I., Jr. Binaries and Supernovae of Type I. Astrophys. J. 1973, 186, 1007–1014. [Google Scholar] [CrossRef]
- Iben, I., Jr.; Tutukov, A.V. Supernovae of type I as end products of the evolution of binaries with components of moderate initial mass. Astrophys. J. Suppl. Ser. 1984, 54, 335–372. [Google Scholar] [CrossRef]
- Webbink, R.F. Double white dwarfs as progenitors of R Coronae Borealis stars and type I supernovae. Astrophys. J. 1984, 277, 355–360. [Google Scholar] [CrossRef]
- Kool, E.C.; Johansson, J.; Sollerman, J.; Moldón, J.; Moriya, T.J.; Mattila, S.; Schulze, S.; Chomiuk, L.; Pérez-Torres, M.; Harris, C.; et al. A radio-detected type Ia supernova with helium-rich circum-stellar material. Nature 2023, 617, 477–482. [Google Scholar] [CrossRef]
- Bietenholz, M.F.; Bartel, N.; Argo, M.; Dua, R.; Ryder, S.; Soderberg, A. The Radio Luminosity-risetime Function of Core-collapse Supernovae. Astrophys. J. 2021, 908, 75. [Google Scholar] [CrossRef]
- Weiler, K.W.; Panagia, N.; Montes, M.J.; Sramek, R.A. Radio Emission from Supernovae and Gamma-Ray Bursters. Annu. Rev. Astron. Astrophys. 2002, 40, 387–438. [Google Scholar] [CrossRef]
- Chomiuk, L.; Soderberg, A.M.; Chevalier, R.A.; Bruzewski, S.; Foley, R.J.; Parrent, J.; Strader, J.; Badenes, C.; Fransson, C.; Kamble, A.; et al. A Deep Search for Prompt Radio Emission from Thermonuclear Supernovae with the Very Large Array. Astrophys. J. 2016, 821, 119. [Google Scholar] [CrossRef]
- Kulkarni, S.R.; Frail, D.A.; Wieringa, M.H.; Ekers, R.D.; Sadler, E.M.; Wark, R.M.; Higdon, J.L.; Phinney, E.S.; Bloom, J.S. Radio emission from the unusual supernova 1998bw and its association with the γ-ray burst of 25 April 1998. Nature 1998, 395, 663–669. [Google Scholar] [CrossRef]
- Turtle, A.J.; Campbell-Wilson, D.; Bunton, J.D.; Jauncey, D.L.; Kesteven, M.J.; Manchester, R.N.; Norris, R.P.; Storey, M.C.; Reynolds, J.E. A prompt radio burst from supernova 1987A in the Large Magellanic Cloud. Nature 1987, 327, 38–40. [Google Scholar] [CrossRef]
- Margutti, R.; Kamble, A.; Milisavljevic, D.; Zapartas, E.; de Mink, S.E.; Drout, M.; Chornock, R.; Risaliti, G.; Zauderer, B.A.; Bietenholz, M.; et al. Ejection of the Massive Hydrogen-rich Envelope Timed with the Collapse of the Stripped SN 2014C. Astrophys. J. 2017, 835, 140. [Google Scholar] [CrossRef]
- Bietenholz, M.F.; Kamble, A.; Margutti, R.; Milisavljevic, D.; Soderberg, A. SN 2014C: VLBI images of a supernova interacting with a circumstellar shell. Mon. Not. R. Astron. Soc. 2018, 475, 1756–1764. [Google Scholar] [CrossRef]
- Weiler, K.W.; Williams, C.L.; Panagia, N.; Stockdale, C.J.; Kelley, M.T.; Sramek, R.A.; Van Dyk, S.D.; Marcaide, J.M. Long-Term Radio Monitoring of SN 1993J. Astrophys. J. 2007, 671, 1959. [Google Scholar] [CrossRef]
- Kundu, E.; Lundqvist, P.; Sorokina, E.; Pérez-Torres, M.A.; Blinnikov, S.; O’Connor, E.; Ergon, M.; Chandra, P.; Das, B. Evolution of the Progenitors of SNe 1993J and 2011dh Revealed through Late-time Radio and X-Ray Studies. Astrophys. J. 2019, 875, 17. [Google Scholar] [CrossRef]
- Thompson, A.R.; Clark, B.G.; Wade, C.M.; Napier, P.J. The Very Large Array. Astrophys. J. Suppl. Ser. 1980, 44, 151. [Google Scholar] [CrossRef]
- Napier, P.J.; Ekers, R.D. The Very Large Array: Design and performance of a modern synthesis radio telescope. Proc. IEEE 1983, 71, 1295. [Google Scholar] [CrossRef]
- Perley, R.A.; Chandler, C.J.; Butler, B.J.; Wrobel, J.M. The Expanded Very Large Array: A New Telescope for New Science. Astrophys. J. Lett. 2011, 739, L1. [Google Scholar] [CrossRef]
- Murphy, T.; Kaplan, D.L.; Stewart, A.J.; O’Brien, A.; Lenc, E.; Pintaldi, S.; Pritchard, J.; Dobie, D.; Fox, A.; Leung, J.K.; et al. The ASKAP Variables and Slow Transients (VAST) Pilot Survey. Publ. Astron. Soc. Aust. 2021, 38, e054. [Google Scholar] [CrossRef]
- Hotan, A.W.; Bunton, J.D.; Chippendale, A.P.; Whiting, M.; Tuthill, J.; Moss, V.A.; McConnell, D.; Amy, S.W.; Huynh, M.T.; Allison, J.R.; et al. Australian square kilometre array pathfinder: I. system description. Publ. Astron. Soc. Aust. 2021, 38, e009. [Google Scholar] [CrossRef]
- Weiler, K.W.; Panagia, N.; Sramek, R.A.; Van Dyk, S.D.; Stockdale, C.J.; Williams, C.L. Radio emission from supernovae. Mem. Della Soc. Astron. Ital. 2010, 81, 374. [Google Scholar]
- Chevalier, R.A. The hydrodynamics of type II supernovae. Astrophys. J. 1976, 207, 872–887. [Google Scholar] [CrossRef]
- Lundqvist, P.; Fransson, C. Circumstellar absorption of UV and radio emission from supernovae. Astron. Astrophys. 1988, 192, 221–233. [Google Scholar]
- Blondin, J.M.; Ellison, D.C. Rayleigh-Taylor Instabilities in Young Supernova Remnants Undergoing Efficient Particle Acceleration. Astrophys. J. 2001, 560, 244–253. [Google Scholar] [CrossRef]
- Chevalier, R.A. The radio and X-ray emission from type II supernovae. Astrophys. J. 1982, 259, 302–310. [Google Scholar] [CrossRef]
- Kundu, E. Radio Emission from Supernovae. Ph.D. Thesis, Stockholm University, Stockholm, Sweden, 2019. [Google Scholar]
- Bykov, A.M.; Brandenburg, A.; Malkov, M.A.; Osipov, S.M. Microphysics of Cosmic Ray Driven Plasma Instabilities. Space Sci. Rev. 2013, 178, 201–232. [Google Scholar] [CrossRef]
- Caprioli, D.; Spitkovsky, A. Simulations of Ion Acceleration at Non–relativistic Shocks. I. Acceleration Efficiency. Astrophys. J. 2014, 783, 91. [Google Scholar] [CrossRef]
- Caprioli, D.; Spitkovsky, A. Simulations of Ion Acceleration at Non–relativistic Shocks. II. Magnetic Field Amplification. Astrophys. J. 2014, 794, 46. [Google Scholar] [CrossRef]
- Rybicki, G.B.; Lightman, A.P. Radiative Processes in Astrophysics; Wiley-Interscience: New York, NY, USA, 1979. [Google Scholar]
- Nugis, T.; Lamers, H.J.G.L.M. Mass-loss rates of Wolf-Rayet stars as a function of stellar parameters. Astron. Astrophys. 2000, 360, 227. [Google Scholar]
- van Loon, J.T.; Cioni, M.R.L.; Zijlstra, A.A.; Loup, C. An empirical formula for the mass-loss rates of dust-enshrouded red supergiants and oxygen-rich Asymptotic Giant Branch stars. Astron. Astrophys. 2005, 438, 273. [Google Scholar] [CrossRef]
- Mokiem, M.R.; de Koter, A.; Evans, C.J.; Puls, J.; Smartt, S.J.; Crowther, P.A.; Herrero, A.; Langer, N.; Lennon, D.J.; Najarro, F.; et al. The VLT-FLAMES survey of massive stars: Wind properties and evolution of hot massive stars in the Large Magellanic Cloud. Astron. Astrophys. 2007, 465, 1003–1019. [Google Scholar] [CrossRef]
- Cappa, C.; Goss, W.M.; van der Hucht, K.A. A Very Large Array 3.6 Centimeter Continuum Survey of Galactic Wolf-Rayet Stars. Astron. J. 2004, 127, 2885. [Google Scholar] [CrossRef][Green Version]
- Crowther, P.A. Physical Properties of Wolf-Rayet Stars. Ann. Rev. Astron. Astrophys. 2007, 45, 177. [Google Scholar] [CrossRef]
- Matzner, C.D.; McKee, C.F. The Expulsion of Stellar Envelopes in Core-Collapse Supernovae. Astrophys. J. 1999, 510, 379. [Google Scholar] [CrossRef]
- Kundu, E.; Lundqvist, P.; P’erez-Torres, M.A.; Herrero-Illana, R.; Alberdi, A. Constraining Magnetic Field Amplification in SN Shocks Using Radio Observations of SNe 2011fe and 2014J. Astrophys. J. 2017, 842, 17. [Google Scholar] [CrossRef]
- Chevalier, R.A. Self-similar solutions for the interaction of stellar ejecta with an external medium. Astrophys. J. 1982, 258, 790. [Google Scholar] [CrossRef]
- Bell, A.R. The acceleration of cosmic rays in shock fronts—I. Mon. Not. R. Astron. Soc. 1978, 182, 147–156. [Google Scholar] [CrossRef]
- Ellison, D.C.; Reynolds, S.P. Electron Acceleration in a Nonlinear Shock Model with Applications to Supernova Remnants. Astrophys. J. 1991, 382, 242. [Google Scholar] [CrossRef]
- Chevalier, R.A.; Fransson, C. Circumstellar Emission from Type Ib and Ic Supernovae. Astrophys. J. 2006, 651, 381–391. [Google Scholar] [CrossRef]
- Chevalier, R.A. Synchrotron Self-Absorption in Radio Supernovae. Astrophys. J. 1998, 499, 810. [Google Scholar] [CrossRef]
- Fransson, C.; Lundqvist, P.; Chevalier, R.A. Circumstellar Interaction in SN 1993J. Astrophys. J. 1996, 461, 993. [Google Scholar] [CrossRef]
- Björnsson, C.-I.; Lundqvist, P. Heating from Free-Free Absorption and the Mass-loss Rate of the Progenitor Stars to Supernovae. Astrophys. J. 2014, 787, 143. [Google Scholar] [CrossRef]
- Tucker, W. Radiation Processes in Astrophysics; MIT Press: Cambridge, MA, USA, 1975. [Google Scholar]
- Smartt, S.J. Progenitors of Core-Collapse Supernovae. Annu. Rev. Astron. Astrophys. 2009, 47, 63–106. [Google Scholar] [CrossRef]
- Ruiz-Carmona, R.; Sfaradi, I.; Horesh, A. Type IIP supernova SN2016X in radio frequencies. Astron. Astrophys. 2022, 666, A82. [Google Scholar] [CrossRef]
- Mauerhan, J.C.; Smith, N.; Filippenko, A.V.; Blanchard, K.B.; Blanchard, P.K.; Casper, C.F.E.; Cenko, S.B.; Clubb, K.I.; Cohen, D.P.; Fuller, K.L.; et al. The unprecedented 2012 outburst of SN 2009ip: A luminous blue variable star becomes a true supernova. Mon. Not. R. Astron. Soc. 2013, 430, 1801. [Google Scholar] [CrossRef]
- Prieto, J.L.; Brimacombe, J.; Drake, A.J.; Howerton, S. The 2012 Rise of the Remarkable Type IIn SN 2009ip. Astrophys. J. Lett. 2013, 763, L27. [Google Scholar] [CrossRef]
- Margutti, R.; Milisavljevic, D.; Soderberg, A.M.; Chornock, R.; Zauderer, B.A.; Murase, K.; Guidorzi, C.; Sanders, N.E.; Kuin, P.; Fransson, C.; et al. A Panchromatic View of the Restless SN 2009ip Reveals the Explosive Ejection of a Massive Star Envelope. Astrophys. J. 2014, 780, 21. [Google Scholar] [CrossRef]
- Smith, N.; Andrews, J.E.; Filippenko, A.V.; Fox, O.D.; Mauerhan, J.C.; Van Dyk, S.D. SN 2009ip after a decade: The luminous blue variable progenitor is now gone. Mon. Not. R. Astron. Soc. 2022, 515, 71–81. [Google Scholar] [CrossRef]
- Pooley, D.; Lewin, W.H.G.; Fox, D.W.; Miller, J.M.; Lacey, C.K.; Van Dyk, S.D.; Weiler, K.W.; Sramek, R.A.; Filippenko, A.V.; Leonard, D.C.; et al. X-Ray, Optical, and Radio Observations of the Type II Supernovae 1999em and 1998S. Astrophys. J. 2002, 572, 932. [Google Scholar] [CrossRef]
- Smith, I.A.; Ryder, S.D.; Böttcher, M.; Tingay, S.J.; Liang, E.P.; Pakull, M.; Stacy, A. Multiwavelength Monitoring of the Unusual Ultraluminous Supernova SN 1978K in NGC 1313 and the Search for an Associated Gamma-Ray Burst. Astrophys. J. 2007, 669, 1130. [Google Scholar] [CrossRef]
- Stritzinger, M.; Taddia, F.; Fransson, C.; Fox, O.D.; Morrell, N.; Phillips, M.M.; Sollerman, J.; Anderson, J.P.; Boldt, L.; Brown, P.J.; et al. Multi-wavelength Observations of the Enduring Type IIn Supernovae 2005ip and 2006jd. Astrophys. J. 2012, 756, 173. [Google Scholar] [CrossRef]
- Chandra, P.; Stockdale, C.J.; Chevalier, R.A.; Van Dyk, S.D.; Ray, A.; Kelley, M.T.; Weiler, K.W.; Panagia, N.; Sramek, R.A. Eleven Years of Radio Monitoring of the type IIn Supernova SN 1995N. Astrophys. J. 2009, 690, 1839. [Google Scholar] [CrossRef]
- Chandra, P.; Chevalier, R.A.; Chugai, N.; Fransson, C.; Irwin, C.M.; Soderberg, A.M.; Chakraborti, S.; Immler, S. Radio and X-Ray Observations of SN 2006jd: Another Strongly Interacting Type IIn Supernova. Astrophys. J. 2012, 755, 110. [Google Scholar] [CrossRef]
- Pooley, D.; Immler, S.; Filippenko, A.V. Chandra Observation of SN 2005kd: Very Luminous and Hard X-ray Emission. Astron. Telegr. 2007, 1023, 1. [Google Scholar]
- Chandra, P.; Soderberg, A. Radio detection of SN 2005kd. Astron. Telegr. 2007, 1182, 1. [Google Scholar]
- Zampieri, L.; Mucciarelli, P.; Pastorello, A.; Turatto, M.; Cappellaro, E.; Benetti, S. Simultaneous XMM-Newton and ESO VLT observations of supernova 1995N: Probing the wind-ejecta interaction. Mon. Not. R. Astron. Soc. 2005, 364, 1419. [Google Scholar] [CrossRef][Green Version]
- Houck, J.C.; Bregman, J.N.; Chevalier, R.A.; Tomisaka, K. Recent X-Ray Observations of SN 1986J with ASCA and ROSAT. Astrophys. J. 1998, 493, 431. [Google Scholar] [CrossRef]
- Chevalier, R.A. Circumstellar interaction and a pulsar nebula in the supernova 1986j. Nature 1987, 329, 611. [Google Scholar] [CrossRef]
- van Dyk, S.D.; Weiler, K.W.; Sramek, R.A.; Panagia, N. SN 1988Z: The Most Distant Radio Supernova. Astrophys. J. Lett. 1993, 419, L69. [Google Scholar] [CrossRef]
- Fabian, A.C.; Terlevich, R. X-ray detection of Supernova 1988Z with the ROSAT High Resolution Imager. Mon. Not. R. Astron. Soc. 1996, 280, L5. [Google Scholar] [CrossRef][Green Version]
- Palliyaguru, N.T.; Corsi, A.; Frail, D.A.; Vinkó, J.; Wheeler, J.C.; Gal-Yam, A.; Cenko, S.B.; Kulkarni, S.R.; Kasliwal, M.M. The Double-peaked Radio Light Curve of Supernova PTF11qcj. Astrophys. J. 2019, 872, 201. [Google Scholar] [CrossRef]
- Palliyaguru, N.T.; Corsi, A.; Pérez-Torres, M.; Varenius, E.; Van Eerten, H. VLBI Observations of Supernova PTF11qcj: Direct Constraints on the Size of the Radio Ejecta. Astrophys. J. 2021, 910, 16. [Google Scholar] [CrossRef]
- Milisavljevic, D.; Margutti, R.; Kamble, A.; Patnaude, D.J.; Raymond, J.C.; Eldridge, J.J.; Fong, W.; Bietenholz, M.; Challis, P.; Chornock, R.; et al. Metamorphosis of SN 2014C: Delayed Interaction between a Hydrogen Poor Core-collapse Supernova and a Nearby Circumstellar Shell. Astrophys. J. 2015, 815, 120. [Google Scholar] [CrossRef]
- Bietenholz, M.F.; Bartel, N.; Kamble, A.; Margutti, R.; Matthews, D.J.; Milisavljevic, D. SN 2014C: VLBI image shows a shell structure and decelerated expansion. Mon. Not. R. Astron. Soc. 2021, 502, 1694. [Google Scholar] [CrossRef]
- Soderberg, A.M.; Kulkarni, S.R.; Berger, E.; Chevalier, R.A.; Frail, D.A.; Fox, D.B.; Walker, R.C. The Radio and X-Ray-Luminous Type Ibc Supernova 2003L. Astrophys. J. 2005, 621, 908–920. [Google Scholar] [CrossRef]
- Smith, N.; Li, W.; Filippenko, A.V.; Chornock, R. Observed fractions of core-collapse supernova types and initial masses of their single and binary progenitor stars. Mon. Not. R. Astron. Soc. 2011, 412, 1522. [Google Scholar] [CrossRef]
- Schaller, G.; Schaerer, D.; Meynet, G.; Maeder, A. New Grids of Stellar Models from 0.8-SOLAR-MASS to 120-SOLAR-MASSES at Z = 0.020 and Z = 0.001. Advis. Assist. Serv. 1992, 96, 269. [Google Scholar]
- Vink, J.S.; de Koter, A. On the metallicity dependence of Wolf-Rayet winds. Advis. Assist. Serv. 2005, 442, 587. [Google Scholar] [CrossRef]
- Smartt, S.J. Observational Constraints on the Progenitors of Core-Collapse Supernovae: The Case for Missing High-Mass Stars. Publ. Astron. Soc. Aust. 2015, 32, e016. [Google Scholar] [CrossRef]
- MacFadyen, A.I.; Woosley, S.E.; Heger, A. Supernovae, Jets, and Collapsars. Astrophys. J. 2001, 550, 410. [Google Scholar] [CrossRef]
- Podsiadlowski, P.; Mazzali, P.A.; Nomoto, K.; Lazzati, D.; Cappellaro, E. The Rates of Hypernovae and Gamma-Ray Bursts: Implications for Their Progenitors. Astrophys. J. 2004, 607, L17. [Google Scholar] [CrossRef]
- Soderberg, A.M.; Nakar, E.; Berger, E.; Kulkarni, S.R. Late-Time Radio Observations of 68 Type Ibc Supernovae: Strong Constraints on Off-Axis Gamma-Ray Bursts. Astrophys. J. 2006, 638, 930. [Google Scholar] [CrossRef]
- Berger, E.; Kulkarni, S.R.; Chevalier, R.A. The Radio Evolution of the Ordinary Type Ic Supernova SN 2002ap. Astrophys. J. 2002, 577, L5. [Google Scholar] [CrossRef]
- Berger, E.; Kulkarni, S.R.; Frail, D.A.; Soderberg, A.M. A Radio Survey of Type Ib and Ic Supernovae: Searching for Engine-driven Supernovae. Astrophys. J. 2003, 599, 408. [Google Scholar] [CrossRef]
- Soderberg, A.M.; Chevalier, R.A.; Kulkarni, S.R.; Frail, D.A. The Radio and X-Ray Luminous SN 2003bg and the Circumstellar Density Variations around Radio Supernovae. Astrophys. J. 2006, 651, 1005. [Google Scholar] [CrossRef]
- Soderberg, A.M.; Kulkarni, S.R.; Nakar, E.; Berger, E.; Cameron, P.B.; Fox, D.B.; Frail, D.; Gal-Yam, A.; Sari, R.; Cenko, S.B.; et al. Relativistic ejecta from X-ray flash XRF 060218 and the rate of cosmic explosions. Nature 2006, 442, 1014. [Google Scholar] [CrossRef]
- Soderberg, A.M.; Berger, E.; Page, K.L.; Schady, P.; Parrent, J.; Pooley, D.; Wang, X.-Y.; Ofek, E.O.; Cucchiara, A.; Rau, A.; et al. An extremely luminous X-ray outburst at the birth of a supernova. Nature 2008, 453, 469. [Google Scholar] [CrossRef] [PubMed]
- Soderberg, A.M.; Brunthaler, A.; Nakar, E.; Chevalier, R.A.; Bietenholz, M.F. Radio and X-ray Observations of the Type Ic SN 2007gr Reveal an Ordinary, Non-relativistic Explosion. Astrophys. J. 2010, 725, 922. [Google Scholar] [CrossRef]
- Soderberg, A.M.; Chakraborti, S.; Pignata, G.; Chevalier, R.A.; Chandra, P.; Ray, A.; Wieringa, M.H.; Copete, A.; Chaplin, V.; Connaughton, V.; et al. A relativistic type Ibc supernova without a detected γ-ray burst. Nature 2010, 463, 513. [Google Scholar] [CrossRef] [PubMed]
- Wellons, S.; Soderberg, A.M.; Chevalier, R.A. Radio Observations Reveal Unusual Circumstellar Environments for Some Type Ibc Supernova Progenitors. Astrophys. J. 2012, 752, 17. [Google Scholar] [CrossRef]
- Chomiuk, L.; Chornock, R.; Soderberg, A.M.; Berger, E.; Chevalier, R.A.; Foley, R.J.; Huber, M.E.; Narayan, G.; Rest, A.; Gezari, S.; et al. Pan-STARRS1 Discovery of Two Ultraluminous Supernovae at z ≈ 0.9. Astrophys. J. 2011, 743, 114. [Google Scholar] [CrossRef]
- Quimby, R.M.; Kulkarni, S.R.; Kasliwal, M.M.; Gal-Yam, A.; Arcavi, I.; Sullivan, M.; Nugent, P.; Thomas, R.; Howell, D.A.; Nakar, E.; et al. Hydrogen-poor superluminous stellar explosions. Nature 2011, 474, 487. [Google Scholar] [CrossRef]
- Gal-Yam, A. Luminous Supernovae. Science 2012, 337, 927. [Google Scholar] [CrossRef]
- Moriya, T.J.; Sorokina, E.I.; Chevalier, R.A. Superluminous Supernovae. Space Sci. Rev. 2018, 214, 59. [Google Scholar] [CrossRef]
- Margutti, R.; Bright, J.S.; Matthews, D.J.; Coppejans, D.L.; Alexander, K.D.; Berger, E.; Bietenholz, M.; Chornock, R.; DeMarchi, L.; Drout, M.R.; et al. Luminous Radio Emission from the Superluminous Supernova 2017ens at 3.3 yr after Explosion. Astrophys. J. Lett. 2023, 954, L45. [Google Scholar] [CrossRef]
- Maeda, K.; Chandra, P.; Matsuoka, T.; Ryder, S.; Moriya, T.J.; Kuncarayakti, H.; Lee, S.; Kundu, E.; Patnaude, D. The Final Months of Massive Star Evolution from the Circumstellar Environment around SN Ic 2020oi. Astrophys. J. 2021, 918, 32–34. [Google Scholar] [CrossRef]
- Bartel, N.; Bietenholz, M.F.; Rupen, M.P.; Beasley, A.J.; Graham, D.A.; Altunin, V.I.; Venturi, T.; Umana, G.; Cannon, W.H.; Conway, J.E. The Changing Morphology and Increasing Deceleration of Supernova 1993J in M81. Science 2000, 287, 112. [Google Scholar] [CrossRef] [PubMed]
- Bartel, N.; Bietenholz, M.F.; Rupen, M.P.; Beasley, A.J.; Graham, D.A.; Altunin, V.I.; Venturi, T.; Umana, G.; Cannon, W.H.; Conway, J.E.; et al. SN 1993J VLBI. II. Related Changes of the Deceleration, Flux Density Decay, and Spectrum. Astrophys. J. 2002, 581, 1. [Google Scholar] [CrossRef]
- Bietenholz, M.F.; Bartel, N.; Rupen, M.P. SN 1993J VLBI. III. The Evolution of the Radio Shell. Astrophys. J. 2003, 597, 374–398. [Google Scholar] [CrossRef]
- Chandra, P.; Ray, A.; Bhatnagar, S. The Late-Time Radio Emission from SN 1993J at Meter Wavelengths. Astrophys. J. 2004, 612, 974. [Google Scholar]
- Martí-Vidal, I.; Marcaide, J.M.; Alberdi, A.; Guirado, J.C.; Pérez-Torres, M.A.; Ros, E. Radio emission of SN1993J: The complete picture II. Simultaneous fit of expansion and radio light curves. Astron. Astrophys. 2011, 526, A143. [Google Scholar] [CrossRef][Green Version]
- Cohen, J.G.; Darling, J.; Porter, A. The Nonvariability of the Progenitor of Supernova 1993J in M81. Astron. J. 1995, 110, 308. [Google Scholar] [CrossRef][Green Version]
- Crockett, R.M.; Eldridge, J.J.; Smartt, S.J.; Pastorello, A.; Gal-Yam, A.; Fox, D.B.; Leonard, D.C.; Kasliwal, M.M.; Mattila, S.; Maund, J.R.; et al. The type IIb SN 2008ax: The nature of the progenitor. Mon. Not. R. Astron. Soc. 2008, 391, L5. [Google Scholar] [CrossRef]
- Van Dyk, S.D.; Li, W.; Cenko, S.B.; Kasliwal, M.M.; Horesh, A.; Ofek, E.O.; Kraus, A.L.; Silverman, J.M.; Arcavi, I.; Filippenko, A.V.; et al. The Progenitor of Supernova 2011dh/PTF11eon in Messier 51. Astrophys. J. 2011, 741, L28. [Google Scholar] [CrossRef]
- Van Dyk, S.D.; Zheng, W.; Fox, O.D.; Cenko, S.B.; Clubb, K.I.; Filippenko, A.V.; Foley, R.J.; Miller, A.A.; Smith, N.; Kelly, P.L.; et al. The Type IIb Supernova 2013df and its Cool Supergiant Progenitor. Astrophys. J. 2014, 147, 37. [Google Scholar] [CrossRef]
- Ryder, S.D.; Van Dyk, S.D.; Fox, O.D.; Zapartas, E.; de Mink, S.E.; Smith, N.; Brunsden, E.; Azalee Bostroem, K.; Filippenko, A.V.; Shivvers, I.; et al. Ultraviolet Detection of the Binary Companion to the Type IIb SN 2001ig. Astrophys. J. 2018, 856, 83. [Google Scholar] [CrossRef]
- Sfaradi, I.; Horesh, A.; Fender, R.; Rhodes, L.; Bright, J.; Williams-Baldwin, D.; Green, D.A. The Observed Phase Space of Mass-loss History from Massive Stars Based on Radio Observations of a Large Supernova Sample. Astrophys. J. 2025, 979, 189. [Google Scholar] [CrossRef]
- Bostroem, K.A.; Valenti, S.; Sand, D.J.; Andrews, J.E.; Van Dyk, S.D.; Galbany, L.; Pooley, D.; Amaro, R.C.; Smith, N.; Yang, S.; et al. Discovery and Rapid Follow-up Observations of the Unusual Type II SN 2018ivc in NGC 1068. Astrophys. J. 2020, 895, 31. [Google Scholar] [CrossRef]
- Maeda, K.; Chandra, P.; Moriya, T.J.; Reguitti, A.; Ryder, S.; Matsuoka, T.; Michiyama, T.; Pignata, G.; Hiramatsu, D.; Bostroem, K.A.; et al. A Multiwavelength View of the Rapidly Evolving SN 2018ivc: An Analog of SN IIb 1993J but Powered Primarily by Circumstellar Interaction. Astrophys. J. 2023, 942, 17. [Google Scholar] [CrossRef]
- Matsuoka, T.; Maeda, K.; Kimura, S.S.; Tanaka, M. Systematic investigation into radio supernovae with Markov Chain Monte Carlo analysis: Implications for massive stars’ mass loss and shock acceleration physics. arXiv 2025, arXiv:2505.06609. [Google Scholar] [CrossRef]
- Drout, M.R.; Chornock, R.; Soderberg, A.M.; Sanders, N.E.; McKinnon, R.; Rest, A.; Foley, R.J.; Milisavljevic, D.; Margutti, R.; Berger, E.; et al. Rapidly Evolving and Luminous Transients from Pan-STARRS1. Astrophys. J. 2014, 794, 23. [Google Scholar] [CrossRef]
- Pursiainen, M.; Childress, M.; Smith, M.; Prajs, S.; Sullivan, M.; Davis, T.M.; Foley, R.J.; Asorey, J.; Calcino, J.; Carollo, D.; et al. Rapidly evolving transients in the Dark Energy Survey. Mon. Not. R. Astron. Soc. 2018, 481, 894. [Google Scholar] [CrossRef]
- Rivera Sandoval, L.E.; Maccarone, T.J.; Corsi, A.; Brown, P.J.; Pooley, D.; Wheeler, J.C. X-ray Swift observations of SN 2018cow. Mon. Not. R. Astron. Soc. 2018, 480, L146. [Google Scholar] [CrossRef]
- Margutti, R.; Metzger, B.D.; Chornock, R.; Vurm, I.; Roth, N.; Grefenstette, B.W.; Savchenko, V.; Cartier, R.; Steiner, J.F.; Terreran, G.; et al. An Embedded X-Ray Source Shines through the Aspherical AT 2018cow: Revealing the Inner Workings of the Most Luminous Fast-evolving Optical Transients. Astrophys. J. 2019, 872, 18. [Google Scholar] [CrossRef]
- Ho, A.Y.Q.; Phinney, E.S.; Ravi, V.; Kulkarni, S.R.; Petitpas, G.; Emonts, B.; Bhalerao, V.; Blundell, R.; Cenko, S.B.; Dobie, D.; et al. AT2018cow: A Luminous Millimeter Transient. Astrophys. J. 2019, 871, 73. [Google Scholar] [CrossRef]
- Prentice, S.J.; Maguire, K.; Smartt, S.J.; Magee, M.R.; Schady, P.; Sim, S.; Chen, T.-W.; Clark, P.; Colin, C.; Fulton, M.; et al. The Cow: Discovery of a Luminous, Hot, and Rapidly Evolving Transient. Astrophys. J. Lett. 2018, 865, L3. [Google Scholar] [CrossRef]
- Perley, D.A.; Mazzali, P.A.; Yan, L.; Cenko, S.B.; Gezari, S.; Taggart, K.; Blagorodnova, N.; Fremling, C.; Mockler, B.; Singh, A.; et al. The fast, luminous ultraviolet transient AT2018cow: Extreme supernova, or disruption of a star by an intermediate-mass black hole? Mon. Not. R. Astron. Soc. 2019, 484, 1031. [Google Scholar] [CrossRef]
- Ho, A.Y.Q.; Perley, D.A.; Gal-Yam, A.; Gal-Yam, A.; Lunnan, R.; Sollerman, J.; Schulze, S.; Das, K.K.; Dobie, D.; Yao, Y.; et al. A Search for Extragalactic Fast Blue Optical Transients in ZTF and the Rate of AT2018cow-like Transients. Astrophys. J. 2023, 949, 120. [Google Scholar] [CrossRef]
- Coppejans, D.L.; Margutti, R.; Terreran, G.; Nayana, A.J.; Coughlin, E.R.; Laskar, T.; Alexander, K.D.; Bietenholz, M.; Caprioli, D.; Chandra, P.; et al. A Mildly Relativistic Outflow from the Energetic, Fast-rising Blue Optical Transient CSS161010 in a Dwarf Galaxy. Astrophys. J. Lett. 2020, 895, L23. [Google Scholar] [CrossRef]
- Bietenholz, M.F.; Margutti, R.; Coppejans, D.; Alexander, K.D.; Argo, M.; Bartel, N.; Eftekhari, T.; Milisavljevic, D.; Terreran, G.; Berger, E. AT 2018cow VLBI: No long-lived relativistic outflow. Mon. Not. R. Astron. Soc. 2020, 491, 4735. [Google Scholar] [CrossRef]
- Nayana, A.J.; Chandra, P. uGMRT Observations of a Fast and Blue Optical Transient—AT 2018cow. Astrophys. J. Lett. 2021, 912, L9. [Google Scholar]
- Ho, A.Y.Q.; Perley, D.A.; Yao, Y.; Svinkin, D.; de Ugarte Postigo, A.; Perley, R.A.; Kann, D.A.; Burns, E.; Andreoni, I.; Bellm, E.C.; et al. Cosmological Fast Optical Transients with the Zwicky Transient Facility: A Search for Dirty Fireballs. Astrophys. J. 2022, 938, 85. [Google Scholar] [CrossRef]
- Ho, A.Y.Q.; Goldstein, D.A.; Schulze, S.; Khatami, D.K.; Perley, D.A.; Ergon, M.; Gal-Yam, A.; Corsi, A.; Andreoni, I.; Barbarino, C.; et al. Evidence for Late-stage Eruptive Mass Loss in the Progenitor to SN2018gep, a Broad-lined Ic Supernova: Pre-explosion Emission and a Rapidly Rising Luminous Transient. Astrophys. J. 2019, 887, 169. [Google Scholar] [CrossRef]
- Goobar, A.; Johansson, J.; Amanullah, R.; Cao, Y.; Perley, D.A.; Kasliwal, M.M.; Ferretti, R.; Nugent, P.E.; Harris, C.; Gal-Yam, A.; et al. The Rise of SN 2014J in the Nearby Galaxy M82. Astrophys. J. 2014, 784, L12. [Google Scholar] [CrossRef]
- Pérez-Torres, M.A.; Lundqvist, P.; Beswick, R.J.; Björnsson, C.-I.; Muxlow, T.W.B.; Paragi, Z.; Ryder, S.; Alberdi, A.; Fransson, C.; Marcaide, J.M.; et al. Constraints on the Progenitor System and the Environs of SN 2014J from Deep Radio Observations. Astrophys. J. 2014, 792, 38. [Google Scholar] [CrossRef]
- Lundqvist, P.; Kundu, E.; Pérez-Torres, M.A.; Ryder, S.D.; Björnsson, C.-I.; Moldon, J.; Argo, M.K.; Beswick, R.J.; Alberdi, A.; Kool, E.C. The Deepest Radio Observations of Nearby SNe Ia: Constraining Progenitor Types and Optimizing Future Surveys. Astrophys. J. 2020, 890, 159. [Google Scholar] [CrossRef]
- Harris, C.E.; Sarbadhicary, S.K.; Chomiuk, L.; Piro, A.L.; Sand, D.J.; Valenti, S. Radio Observations of Six Young Type Ia Supernovae. Astrophys. J. 2023, 952, 24. [Google Scholar] [CrossRef]
- Morozova, V.; Piro, A.L.; Renzo, M.; Ott, C.D.; Clausen, D.; Couch, S.M.; Ellis, J.; Roberts, L.F. Light Curves of Core-collapse Supernovae with Substantial Mass Loss Using the New Open-source SuperNova Explosion Code (SNEC). Astrophys. J. 2015, 814, 63. [Google Scholar] [CrossRef]
- Piro, A.L.; Morozova, V.S. Exploring the Potential Diversity of Early Type Ia Supernova Light Curves. Astrophys. J. 2016, 826, 96. [Google Scholar] [CrossRef]
- Panagia, N.; Van Dyk, S.D.; Weiler, K.W.; Sramek, R.A.; Stockdale, C.J.; Murata, K.P. A Search for Radio Emission from Type Ia Supernovae. Astrophys. J. 2006, 646, 369. [Google Scholar] [CrossRef]
- Horesh, A.; Kulkarni, S.R.; Fox, D.B.; Carpenter, J.; Kasliwal, M.M.; Ofek, E.O.; Quimby, R.; Gal-Yam, A.; Cenko, S.B.; de Bruyn, A.G.; et al. Early Radio and X-Ray Observations of the Youngest nearby Type Ia Supernova PTF 11kly (SN 2011fe). Astrophys. J. 2012, 746, 21. [Google Scholar] [CrossRef]
- Chomiuk, L.; Soderberg, A.M.; Moe, M.; Chevalier, R.A.; Rupen, M.P.; Badenes, C.; Margutti, R.; Fransson, C.; Fong, W.-f.; Dittmann, J.A. EVLA Observations Constrain the Environment and Progenitor System of Type Ia Supernova 2011fe. Astrophys. J. 2012, 750, 164. [Google Scholar] [CrossRef]
- Margutti, R.; Soderberg, A.M.; Chomiuk, L.; Chevalier, R.; Hurley, K.; Milisavljevic, D.; Foley, R.J.; Hughes, J.P.; Slane, P.; Fransson, C.; et al. Inverse Compton X-Ray Emission from Supernovae with Compact Progenitors: Application to SN2011fe. Astrophys. J. 2012, 751, 134. [Google Scholar] [CrossRef][Green Version]
- Silverman, J.M.; Nugent, P.E.; Gal-Yam, A.; Sullivan, M.; Howell, D.A.; Filippenko, A.V.; Arcavi, I.; Ben-Ami, S.; Bloom, J.S.; Cenko, S.B.; et al. Type Ia Supernovae Strongly Interacting with Their Circumstellar Medium. Astrophys. J. Suppl. Ser. 2013, 207, 3. [Google Scholar] [CrossRef]
- Wood-Vasey, W.M.; Sokoloski, J.L. Novae as a Mechanism for Producing Cavities around the Progenitors of SN 2002ic and Other Type Ia Supernovae. Astrophys. J. Lett. 2006, 645, L53. [Google Scholar] [CrossRef]
- Patat, F.; Chugai, N.N.; Podsiadlowski, P.; Mason, E.; Melo, C.; Pasquini, L. Connecting RS Ophiuchi to [some] type Ia supernovae. Astron. Astrophys. 2011, 530, A63. [Google Scholar] [CrossRef]
- Moore, K.; Bildsten, L. Circumstellar Shell Formation in Symbiotic Recurrent Novae. Astrophys. J. 2012, 761, 182. [Google Scholar] [CrossRef]
- Harris, C.E.; Nugent, P.E.; Kasen, D.N. Against the Wind: Radio Light Curves of Type Ia Supernovae Interacting with Low-density Circumstellar Shells. Astrophys. J. 2016, 823, 100. [Google Scholar] [CrossRef]
- Filipović, M.D.; Smeaton, Z.J.; Kothes, R.; Mantovanini, S.; Kostić, P.; Leahy, D.; Ahmad, A.; Anderson, G.; Araya, M.; Ball, B.D.; et al. Teleios (G305.4–2.2)—The mystery of a perfectly shaped new galactic supernova remnant. Publ. Astron. Soc. Aust. 2025, 42, e104. [Google Scholar] [CrossRef]
- Bochenek, C.D.; Ravi, V.; Belov, K.V.; Hallinan, G.; Kocz, J.; Kulkarni, S.R.; McKenna, D.L. A fast radio burst associated with a Galactic magnetar. Nature 2020, 587, 59. [Google Scholar] [CrossRef] [PubMed]
- CHIME/FRB Collaboration. A bright millisecond-duration radio burst from a Galactic magnetar. Nature 2020, 587, 54–58. [Google Scholar] [CrossRef]
- Kundu, E.; Ferrario, L. The impact of the environment of white dwarf mergers on fast radio bursts. Mon. Not. R. Astron. Soc. 2020, 492, 3753–3762. [Google Scholar] [CrossRef]
- Kundu, E. Is FRB 191001 embedded in a supernova remnant? Mon. Not. R. Astron. Soc. 2022, 512, L1–L5. [Google Scholar] [CrossRef]
- Chatterjee, S.; Law, C.J.; Wharton, R.S.; Burke-Spolaor, S.; Hessels, J.W.T.; Bower, G.C.; Cordes, J.M.; Tendulkar, S.P.; Bassa, C.G.; Demorest, P.; et al. A direct localization of a fast radio burst and its host. Nature 2017, 541, 58–61. [Google Scholar] [CrossRef]
- Ravi, V.; Law, C.J.; Li, D.; Aggarwal, K.; Bhardwaj, M.; Burke-Spolaor, S.; Connor, L.; Lazio, T.J.W.; Simard, D.; Somalwar, J.; et al. The host galaxy and persistent radio counterpart of FRB 20201124A. Mon. Not. R. Astron. Soc. 2022, 513, 982–990. [Google Scholar] [CrossRef]
- Cassanelli, T.; Leung, C.; Sanghavi, P.; Mena-Parra, J.; Cary, S.; Mckinven, R.; Bhardwaj, M.; Masui, K.W.; Michilli, D.; Bandura, K.; et al. A fast radio burst localized at detection to an edge-on galaxy using very-long-baseline interferometry. Nat. Astron. 2024, 8, 1429–1442. [Google Scholar] [CrossRef]
- Hewitt, D.M.; Bhandari, S.; Marcote, B.; Hessels, J.W.T.; Nimmo, K.; Kirsten, F.; Bach, U.; Bezrukovs, V.; Bhardwaj, M.; Blaauw, R.; et al. Milliarcsecond localization of the hyperactive repeating FRB 20220912A. Mon. Not. R. Astron. Soc. 2024, 529, 1814–1826. [Google Scholar] [CrossRef]
- Dubner, G.; Giacani, E. Radio emission from supernova remnants. Astron. Astrophys. Rev. 2015, 23, 3. [Google Scholar] [CrossRef]
- Lacy, M.; Baum, S.A.; Chandler, C.J.; Chatterjee, S.; Clarke, T.E.; Deustua, S.; English, J.; Farnes, J.; Gaensler, B.M.; Gugliucci, N.; et al. The Karl G. Jansky Very Large Array Sky Survey (VLASS). Science Case and Survey Design. Publ. Astron. Soc. Pac. 2020, 132, 035001. [Google Scholar] [CrossRef]
- Stroh, M.C.; Terreran, G.; Coppejans, D.L.; Bright, J.S.; Margutti, R.; Bietenholz, M.F.; De Colle, F.; DeMarchi, L.; Duran, R.B.; Milisavljevic, D.; et al. Luminous Late-time Radio Emission from Supernovae Detected by the Karl G. Jansky Very Large Array Sky Survey (VLASS). Astrophys. J. Lett. 2021, 923, L24. [Google Scholar] [CrossRef]
- Rose, K.; Horesh, A.; Murphy, T.; Kaplan, D.L.; Sfaradi, I.; Ryder, S.D.; Aloisi, R.J.; Dobie, D.; Driessen, L.; Fender, R.; et al. Late-time supernovae radio re-brightening in the VAST pilot survey. Mon. Not. R. Astron. Soc. 2024, 534, 3853–3868. [Google Scholar] [CrossRef]
- van Haarlem, M.P.; Wise, M.W.; Gunst, A.W.; Heald, G.; McKean, J.P.; Hessels, J.W.T.; de Bruyn, A.G.; Nijboer, R.; Swinbank, J.; Fallows, R.; et al. LOFAR: The LOw-Frequency ARray. Astron. Astrophys. 2013, 556, A2. [Google Scholar] [CrossRef]
- Swarup, G. Giant metrewave radio telescope (GMRT). IAU Colloquium 131: Radio Interferometry. Theory, Techniques, and Applications. Astron. Soc. Pac. Conf. Ser. 1991, 19, 376–380. [Google Scholar]
- Ananthakrishnan, S. The Giant Metrewave Radio Telescope. J. Astrophys. Astron. 1995, 16, 427–435. [Google Scholar]
- Jonas, J.; MeerKAT Team. The MeerKAT Radio Telescope. In Proceedings of the MeerKAT Science: On the Pathway to the SKA, Stellenbosch, South Africa, 25–27 May 2016; p. 1. [Google Scholar]
- Robertson, P. An Australian Icon—Planning and Construction of the Parkes Telescope. arXiv 2012, arXiv:1210.0987. [Google Scholar]
- Jewell, P.R.; Prestage, R.M. The Green Bank Telescope. Ground-Based Telesc. 2004, 5489, 312–323. [Google Scholar]
- Ricci, R.; Sadler, E.M.; Ekers, R.D.; Staveley-Smith, L.; Wilson, W.E.; Kesteven, M.J.; Subrahmanyan, R.; Walker, M.A.; Jackson, C.A.; De Zotti, G.; et al. First results from the Australia Telescope Compact Array 18-GHz pilot survey. Mon. Not. R. Astron. Soc. 2004, 354, 305. [Google Scholar] [CrossRef]
- Wootten, A.; Thompson, A.R. The Atacama Large Millimeter/Submillimeter Array. IEEE Proc. 2009, 97, 1463–1471. [Google Scholar] [CrossRef]
- Pritchard, J.R.; Loeb, A. 21 cm cosmology in the 21st century. Rep. Prog. Phys. 2012, 75, 086901. [Google Scholar] [CrossRef]
- Dewdney, P.E.; Hall, P.J.; Schilizzi, R.T.; Lazio, T.J.L.W. The Square Kilometre Array. IEEE Proc. 2009, 97, 1482–1496. [Google Scholar] [CrossRef]
- Di Francesco, J.; Chalmers, D.; Denman, N.; Fissel, L.; Friesen, R.; Gaensler, B.; Hlavacek-Larrondo, J.; Kirk, H.; Matthews, B.; O’Dea, C.; et al. The Next Generation Very Large Array. In Canadian Long Range Plan for Astronomy and Astrophysics White Papers; Zenodo: Geneva, Switzerland, 2019; Volume 2020, p. 32. [Google Scholar]


Disclaimer/Publisher’s Note: The statements, opinions and data contained in all publications are solely those of the individual author(s) and contributor(s) and not of MDPI and/or the editor(s). MDPI and/or the editor(s) disclaim responsibility for any injury to people or property resulting from any ideas, methods, instructions or products referred to in the content. |
© 2025 by the author. Licensee MDPI, Basel, Switzerland. This article is an open access article distributed under the terms and conditions of the Creative Commons Attribution (CC BY) license.