Abstract
The potential application of Xylocarpus granatum, a mangrove species, as traditional medicine has been widely linked to its high secondary metabolite and antioxidant contents. However, few studies have been reported to identify and classify active metabolites responsible for such excellent biological activities. Therefore, the aim of this work was to determine the antioxidant activity, identify the metabolite profiles, and predict the metabolites acting as antioxidants in X. granatum extract using a gas chromatography–mass spectrometry (GC-MS)-based metabolomics approach. The seeds, stems, fruit peel, pulp, leaves, and twigs of X. granatum were macerated with ethanol. Each extract was analyzed with GC-MS, and the data were processed using mass spectrometry data-independent analysis (MS-DIAL) software to identify the metabolites. The IC50 value of plant parts of X. granatum ranged from 7.73 to 295 ppm. A total of 153 metabolites were identified and confirmed in the X. granatum extracts. Among the identified metabolites, epicatechin and epigallocatechin were the two most abundant in the stem extracts and are expected to have the greatest potential as antioxidants. Principal component analysis (PCA) succeeded in grouping all parts of the plant into three groups based on the composition of the metabolites: group 1 (stems, fruit peel, and twigs), group 2 (seeds and pulp), and group 3 (leaves).
1. Introduction
Mangrove is a type of plant that grows in coastal areas and is spread across Indonesia. Extracts and raw materials from mangrove have been widely utilized by coastal people for traditional medicines [1]. One such mangrove species widely used as material for traditional medicine is X. granatum. This species is a sea mangrove from the Meliaceae family with a majority of plants spread across Southeast Asia and along the Indian Ocean. In Indonesia, this plant can be found in the Kalimantan and Sulawesi regions [2]. Coastal people still use parts of X. granatum plants as traditional medicine, owing to their wide range of biological activities.
Parts of X. granatum such as leaves, stems, twigs, and fruit have been reported to contain several secondary metabolites such as alkaloids, flavonoids, monoterpenes, triterpenoids, tetratriterpenoids, limonoids, proanthocyanidins, and phenolic acids [3,4]. These compounds have the potential to exert anticancer, antihyperglycemic, antidyslipidemic, antidepressant, and neuroprotective activities [5,6,7]. Additionally, the extracts of the seeds, stems, fruit peel, and leaves of X. granatum can be used as antioxidants and antidiabetics, owing to their polyphenol contents [2,8,9]. The antioxidant activities of X. granatum extracts make this species a potential source of one of raw materials for cosmetic skin lightening, which work by inhibiting tyrosinase activity [10]. The biological activities of X. granatum, e.g., antioxidant activity, are greatly influenced by its contents of active compounds, which is a crucial factor affecting the quality of X. granatum as an antioxidant [2].
One method to identify the contents of active compounds in X. granatum extracts is by analyzing the metabolite profiles. Metabolite profiling is one method associated with metabolomic approaches that can be used to comprehensively identify primary or secondary metabolites in plants, both qualitatively and quantitatively, and is generally associated with specific metabolite pathways [11,12]. Metabolite profiling facilitates the efficient activity determination and use of active compounds utilization and can be used as a plant quality control process [13].
Comprehensive metabolite profile identification from a complex sample requires a high-resolution analysis method, such as liquid chromatography—mass spectrometry (LC-MS), gas chromatography—mass spectrometry (GC-MS), liquid chromatography—mass spectrometry—mass spectrometry (LC-MS/MS), or capillary electrophoresis—mass spectrometry (CE-MS) [14]. GC-MS analysis is often used for metabolite profiling, owing to its high sensitivity and high resolution, in addition to providing good reproducibility. Another advantage of the GC-MS technique is that it is easy to use and relatively inexpensive in terms of operational cost [15].
In this study, the metabolites in several parts of X. granatum plants, i.e., leaves, stems, twigs, fruit peel, pulp, and seeds, were identified using GC-MS. The resulting data were processed with the assistance of MS-DIAL version 4.20 software to identify metabolites; additionally, the compounds acting as antioxidants were predicted based on a comparison of the obtained profile to that of known antioxidant compounds reported in the literature. The result of GC-MS data processing include information on m/z values, retention time, retention index, area, and the peak intensity of the identified metabolites. The result of data normalization, which performed with MS-DIAL, was evaluated by PCA (principal component analysis) with SIMCA version 13 software (Umetrics, Umea, Sweden). PCA was used to discriminate every part of X. granatum based on similarities in metabolite content.
2. Materials and Methods
2.1. Samples and Instruments
The plant sample used in this study was X. granatum (leaves, stems, twigs, fruit peel, pulp, and seeds) from Togean Islands, Central Sulawesi. All parts of the plant were dried in an oven at 40 °C and ground before extraction.
The following instruments and software were used: GC-MS QP2010 Ultra (Shimadzu, Kyoto, Japan), MS-DIAL version 4.24 software, SIMCA version 13 software (Umetrics, Umea, Sweden), Abf Converter, AMDIS, MORPHEUS, and ChemSketch. The following chemicals were used: N-methyl-N-(trimethylsilyl) trifluoroacetamide (MSTFA), pyridine, alkane mixture (C10-C31), ribitol (internal standard), methanol, chloroform, Milli-Q water, methoxyamine HCl, 2,2-diphenyl-1-picrylhydrazyl (DPPH), and 2-(N-morpholino)ethanesulfonic acid (MES) buffer.
2.2. Extraction
The extraction method used was maceration with ethanol. Samples from each plant part (1 g) were soaked in 5 mL ethanol for 24 h, then filtered. The filtrate was concentrated using a rotary evaporator. This extract was used for antioxidant activity tests.
2.3. Antioxidant Activity
The antioxidant activity of every plant part of X. granatum was determined by DPPH method with referent to the method performed by Batubara et al. (2010) [10]. Each extract was diluted in ethanol to final concentrations of 1.67, 3.33, 6.67, 10.00, 13.33, 16.67, 33.33, 66.67, 100.00, 133.33, and 166.67 μg/mL. The sample aliquot, 100 μL 2-(N-morpholino)ethanesulfonic acid (MES) buffer (pH 7.4), and 100 μL DPPH solution (11.8 mg DPPH in 100 mL ethanol) were added to each well of a 96-well plate. The mixtures were incubated for 30 min; then, the absorbances were read at 514 nm. Vitamin C was used as positive controlm and ethanol was used as the blank. Inhibition activity was calculated using the following formula:
where Asample is the sample absorbance, Acontrol is the vitamin C absorbance as the control, and Ablank is the ethanol absorbance as the blank. The concentration of each sample and a positive control were tested in triplicate.
Inhibition (%) = [1 − (Asample − Acontrol)/(Ablank − Acontrol)] × 100%
2.4. Sample Preparation for GC-MS Analysis
Firstr, 1 mL methanol:chloroform:water (5:2:2) and 100 μg/mL ribitol as an internal standard were added to 10 mg of ground herbal material of every part of X. granatum (stems, leaves, pulp, fruit peel, twigs, and seeds). The mixture was homogenized by vortexing and incubated in a shaker for 30 min, then centrifuged at 12,298× g at 4 °C for 3 min. The supernatant (600 μL) was transferred into a new tube and mixed with 300 μL Milli-Q water, then recentrifuged under the same conditions described above. Subsequently, 400 μL (sample) and 200 μL (QC sample) of the supernatant were transferred into separate new tubes and dried under vacuum using a centrifugal concentrator at room temperature for 2 h, then dried with a freeze dryer overnight (12 h) before derivatization. The QC (quality control) sample was a mixture of all samples. After drying, derivatization was performed by adding 100 μL methoxyamine HCl in pyridine (20 mg/mL), followed by incubation at 30 °C for 90 min, the addition of 50 μL MSTFA, and reincubation at 37 °C for 30 min in order to induce sylilation before being injected into the GC-MS. Sample derivatization was performed to improve the volatility of the compound for GC-MS analysis.
2.5. GC-MS Analysis
The GC-MS analysis performed in this study is a standard procedure used to analyze natural products and was conducted at Fukusaki Lab, Osaka University, Japan [16]. GC-MS QP2010 Ultra (Shimadzu, Japan) with ab InertCap 5 MS/NP column was used, with an injection temperature at 230 °C and an injection volume of 1 μL in split mode (25:1 v/v). The carrier gas (He) flow was 3.0 mL/minute, with a linear speed of 39 cm/s. The column temperature was held at 80 °C for 2 min, then increased at a rate of 15 °C/min to 330 °C and held for 6 min. The temperature of the transfer line and the ion source were 250 and 200 °C, respectively. The ions were generated by electron ionization (EI) at 1 kV, and the spectrum was recorded in the mass range of 85−500 m/z.
Then, 1 μL pyridine was injected into the GC-MS to check the background, and 1 μL of an alkane compound mixture was used to obtain the n-alkane retention time, which was further used for retention index calculation. Afterwards, pyridine was injected to clean the remaining n-alkane compounds, and 1 μL of the sample blank was injected to check for any contamination. Then, the samples or extracts from every part of X. granatum were analyzed. Every sixth sample injection was followed by a QC sample, a sample blank, and pyridine injections in order to check for any contamination and clean the column. For every plant part of X. granatum, injection was performed in quintuplicate, with 2 blank injections and 10 QC sample injections.
2.6. Data Analysis with MS-DIAL
The resulting data from GC-MS analysis were obtained as .QGD files. Peak conformation, peak filtering, and annotation were processed using MS-DIAL ver. 4.20 (Riken, Kanagawa, Japan). The output data from GC-MS were converted into CDF files, which were subsequently converted into Abf files with Abf Converter, then imported to MS-DIAL software. Data processing steps and compound identification in MS-DIAL included inputting data as a new project, setting some parameters before analysis (data collection, peak detection, deconvolution, identification, alignment, and filtering), and metabolite identification.
Compound identification at the peak was performed by comparing the conformity of the retention time (RT), retention index (RI), and mass spectrum values from the results of analysis with those of known metabolites in the available library from AllPublic-KovatsRI-VS2. MS-DIAL software identified the metabolites according to the predetermined parameters of analysis. The resulting accuracy of compound identification was confirmed by examining the total score of each compound in the compound search.
After identification was completed, data normalization was performed before the data were used in PCA analysis. Data normalization was performed by determining the ID number of a compound used as an internal standard (ribitol); then, the ID number of the standard compound was input in the ID column of the identified compound.
2.7. Data Analysis
All determinations were conducted in triplicate, and the data are reported as average values ± standard deviation (SD).
PCA analysis was achieved using SIMCA version 13 software (Umetrics, Umea, Sweden). The data were exported from MS-DIAL as .txt files, which were then converted into Microsoft Excel files. The Microsoft Excel data were then transposed. PCA classification was expected to be able to group every plant part of X. granatum extract based on the metabolite content.
3. Results
3.1. X. granatum Antioxidant Activity
In this study, the antioxidant activity of every part of X. granatum was determined using the DPPH method. As a free radical scavenging method, DPPH, has been widely used to evaluate the antioxidant activity of plant extracts, owing to its rapidity, sensitivity, simplicity, and reproducibility. The results of antioxidant activity are reported as IC50, indicating the number of antioxidants needed to lower 50% of the initial concentration of DPPH. Higher IC50 values indicate lower antioxidant activity.
The IC50 values of every part of X. granatum are presented in Table 1. The antioxidant activities of each part of X. granatum vary, with IC50 values ranging from 7.73 to 295 ppm. In this study, vitamin C was used as a standard, with an IC50 value of 4.18 ppm. Among all plant parts, the stem extract showed the highest antioxidant potential, with an IC50 value of 7.73 ppm (Table 1).

Table 1.
Antioxidant activity of X. granatum ethanol extract.
3.2. X. granatum Metabolite Profiling Using GC-MS
The results of profiling were obtained after confirming the metabolites and performing data curation. One metabolite identified in MS-DIAL was confirmed by conforming the retention index value and the mass spectrum of the compound identified with a known compound found in the AllPublic-KovatsRI-VS2 library. Data curation involves reducing the data on the compounds with the same retention time values and the same compounds with different retention time values. The compound with the highest total score value (750 to 1000) was selected for profiling. The total score shows indicates the similarity of the identified compound relative to a compound in the database.
Metabolite identification from every part of X. granatum resulted in 153 identified compounds (Table 2). Every part of X. granatum is primarily composed of simple sugar (monosaccharides), as reflected by the relative area. The sugar compounds contained in X. granatum are sucrose (12.02%), glucose (7.59%), fructose (7.58%), and epicatechin (2.00%), with a chromatogram pattern as shown in Figure 1.
Table 2.
Metabolites in the extract of X. granatum.
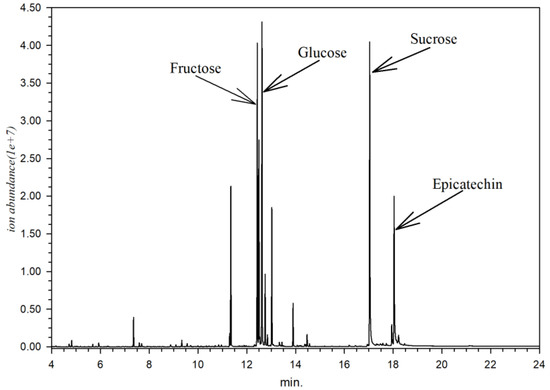
Figure 1.
Chromatogram of X. granatum stem extract according to GC-MS analysis.
3.3. Prediction of Active Antioxidant Compounds in X. granatum
A total of 15 compounds with potential as antioxidants were identified in the various parts of X. granatum, as depicted in the form of a heat map in Figure 2. The heat map is intended to visualize the peak area percentage in a simpler way using the intensity of colors. In Figure 2, the intensity of red color indicates high compound content, whereas the intensity of green color shows indicates low compound content.
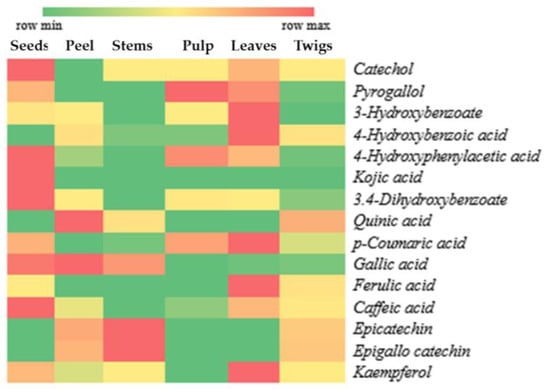
Figure 2.
Distribution of antioxidant compounds in plant parts of X. granatum.
According to the results of antioxidant activity testing of X. granatum plant parts using the DPPH method, the ethanol extract of X. granatum stems has a very high potential compared to the other parts of the plant, as reflected by the lowest IC50 value (Table 1). This result indicates that the antioxidant compounds dominantly found in the stems have higher antioxidant activity compared to those found in the other parts of the plant. Figure 2 shows that the dominant compounds in the stems are epicatechin and epigallocatechin. Besides the stems, these two compounds can be found in the fruit peel and twigs, making the antioxidant activity in the fruit peel and twigs higher than that in the seeds, pulp, and leaves (Table 1).
3.4. Discrimination of X. granatum Plant Parts with PCA Based on Metabolite Composition
Discrimination is a process used to differentiate one sample from another by identifying similarities between samples. Samples with many similarities are grouped together; in other words, samples with many differences are separated into differerent groups [17]. The PCA technique is a method of analysis of double variables with the intention of simplifying the observed variables by reducing the dimensions to facilitate the visualization of data grouping and evaluation of similarities among the groups [18]. The application of PCA to the chromatogram enables a reduction in large-sized GC-MS data into several primary components (PCs) so that a two-dimension score plot can show severability among samples. The score plots of the first two components (PC1 and PC2) are usually used in the analysis because these PCs contain the most data variation.
The result of PCA analysis is considered acceptable if a small number of primary components can describe a large number of total variations. The result of PCA analysis was visualized as a score plot depicting the grouping of each plant part of X. granatum based on the metabolite composition contained in each plant part. Every point in the score plot represents a single sample, and samples with similarities are categorized in the same group [19]. Figure 3 shows the obtained score plot, which explains 91% of total variation (PC1 = 51%, PC = 40%). Samples with the same labels are grouped in adjacent positions. However, some samples did not provide a satisfactory grouping representation, so those data were considered outliers, such as teed 1, seed 5, and twig 3. Therefore, outlier reduction was performed in order to visualize a clearer and better data grouping.
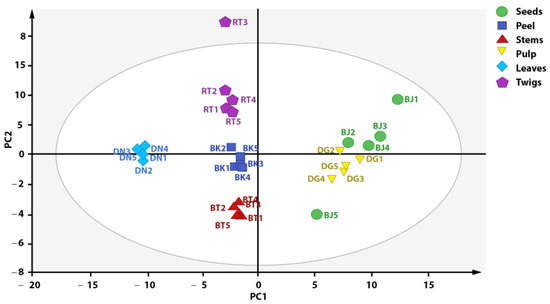
Figure 3.
Score plot of PCA analysis before outlier reduction.
Outlier reduction resulted in the grouping presented in Figure 4, with an increase in the PC1 value of 1%. Figure 4 shows a plot score that can explain 92% of total variation (PC1 = 52%, PC = 40%). The result of score plot after outlier reduction shows that the metabolite profile of each X. granatum plant part can be differentiated into three groups based on metabolite composition, i.e., group 1 (stems, twigs, and fruit peel), group 2 (pulp and seeds), and group 3 (leaves). According to the PCA score plot (Figure 4), the metabolite characteristics of the fruit peel, stem, and twig parts of X. granatum are similar, as reflected by the antioxidant activities, with similar IC50 values: 9.02, 7.73, and 9.83 ppm, respectively (see, Table 2). The samples of the pulp and the seeds parts belong to one group, whereas the leaves are separated from the groups containing the other plant parts, showing that there are metabolite composition differences in the leaves. This is also supported by the antioxidant properties of the leaf extract, which has the highest IC50 value (295.08 ppm), showing that it has the lowest antioxidant activity. The association between the results of grouping and the antioxidant activity shows that the compounds with antioxidant activity play significant roles in the grouping of X. granatum plant parts.
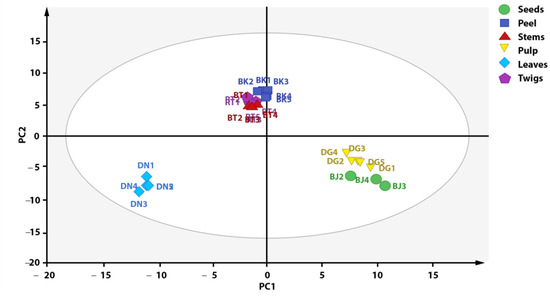
Figure 4.
Distribution of antioxidant compounds in plant parts of X. granatum.
4. Discussion
Metabolite profiling is a technique of analysis used to determine the metabolite profile or the chromatogram pattern of chemical components of an extract with pharmacological activities or chemical components characterizing a plant with the objective of controling the quality [12]. Metabolite profiling and antioxidant compound prediction of X. granatum extracts consisted of four stages, i.e., information gathering through GC-MS data analysis using MSDIAL and antioxidant compound prediction through a literature study, data reduction and compilation to convert the spectrum into data that can be processed statistically, PCA multivariate analysis, and review and interpretation of the results of chemometric processes.
An antioxidant is an electron-donor compound that can lower the free radical level and help to reduce or prevent the impact of oxidative stress because of free radicals [20,21]. Common natural antioxidant compounds include vitamin C, vitamin E, carotenoids, phenolic compounds, and polyphenols, which can be grouped as flavonoids, cinnamate acid derivatives, coumarins, tocopherol, and polyfunctional organic acids, respectively [22]. Our literature review of several studies on the properties of antioxidant compounds, as well as the characteristics and applications thereof, indicated that natural metabolite compounds that are usually found in plants commonly include compounds in the group of polyphenols with active groups of hydroxy (-OH) and double-bonded carbons (-C=C-) and function as scavengers and inhibitors of free radicals reactions. Polyphenol secondary metabolites, such flavonoids, polyenes, and compounds containing many -OH groups, can react with free radicals as reducing agents, free radical scavengers, metal-chelating agents, and oxygen-singlet-forming suppressors [23,24,25].
According to our literature review of the properties and the general structures of antioxidant compounds, several compounds contained in X. granatum extracts have potential as antioxidants. These compounds mostly belong to the phenolics and polyphenols groups, including catechol [26], pyrogallol [24], 3-hydroxybenzoate, 4-hydroxybenzoic acid, 4-hydroxyphenylacetic acid, 3,4-dihydroxybenzoate [27], kojic acid [28], quinic acid [29], p-coumaric acid, gallic acid, ferulic acid, caffeic acid [30], epicatechin, epigallocatechin, and kaempferol [23].
Simple phenolic compounds such as catechol and pyrogallol are antioxidant compounds with the ability to lower the number of reactive oxygen species (ROS). Pyrogallol is a compound used widely to inhibit oxidation reactions in biodiesel [25]. On the other hand, a catechol-containing polyphenol, epicatechin, is a strong in vitro antioxidant compound, owing to its ability to rapidly lower the level of ROS, bind metallic ions, form inert complexes, and arrest the chain reaction of radical compounds [31].
Another phenolic compound identified as an antioxidant is phenolic acid. Phenolic acid is a strong antioxidant and exhibits antibacterial, antivirus, anticarcinogenic, and anti-inflammatory activities, as well as vasodilatory activity. Phenolic acid may further function as an anticancer agent and prevent heart diseases. Phenolic acid identified in X. granatum can be devided into two groups: benzoic acid derivatives and cinnamic acid derivatives. In this study, the identified compounds of benzoic acid derivatives were 3-hydroxybenzoate, 4-hydroxybenzoic acid, 4-hydroxyphenylacetic acid, and 3,4-dihydroxybenzoate, whereas the identified compounds of cinnamic acid derivatives were ferulic acid, gallic acid, p-coumaric acid, and caffeic acid. These compounds were reported to function as effective active antioxidants in radical scavenging of 2-azino-bis(3-ethylbenzthiazoline-6-sulfonic acid) (ABTS), 1,1-diphenyl-2-picryl-hydrazyl (DPPH), and superoxide anions, as well as metal chelation activity in iron ions [27,30,32]. Antioxidant activities of these phenolic acid compounds are influenced by the number of hydroxyl groups (OH-) in the phenyl ring. The length of conjugated double bonds, types of substituents, and the form of the molecules also contribute to the antioxidant activity [20].
In addition to the compounds in the phenolic group, other compounds were identified acting as antioxidants, such as quinic acid and kojic acid. Quinic acid is a carboxylic acid with many hydroxy groups (-OH), with potential as an antioxidant by inhibiting oral pathogens [29]. Kojic acid, on the other hand, is widely used in cosmetic products, especially as a skin-lightening agent [28,33].
5. Conclusions
The plant parts of X. granatum exhibit varying antioxidant activities. Metabolite profiling in X. granatum extracts using GC-MS succeeded in identifying 153 compounds. The compounds expected to have important roles in antioxidant activities are those compounds from the flavonol group, i.e., epicatechin and epigallocatechin, which are dominantly found in the stem of X. granatum. Multivariate analysis using PCA succeeded in grouping the plant parts of X. granatum into 3 groups based on metabolite composition: group 1 (stems, twigs, and fruit peel), group 2 (seeds and pulp), and group 3 (leaves). The grouping results of X. granatum plant parts using PCA can be associated with the antioxidant activities.
Author Contributions
Conceptualization, R.H., S.P.P., I.B.; methodology, R.H., C.A.P., M.K., M.R., S.P.P. and I.B.; software, R.H., C.A.P., M.R. and A.H.K.; validation, R.H., M.K., M.R. and S.P.P.; formal analysis, R.H. and C.A.P.; investigation, R.H. and I.B.; data curation, R.H. and C.A.P.; writing—original draft preparation, R.H., A.H.K. and I.B.; writing—review and editing, R.H., M.R., S.P.P., I.B. and M.K.; visualization, R.H.; project administration, I.B.; funding acquisition, I.B. All authors have read and agreed to the published version of the manuscript.
Funding
Directorate General of Strengten and Development Research Ministry of Research, Technology, and Higher Education, Republic of Indonesia No 3/E1/KP.PTNBH/2019.
Institutional Review Board Statement
Not applicable.
Informed Consent Statement
Not applicable.
Data Availability Statement
The data presented in this study are available in the main article.
Conflicts of Interest
The authors declare no conflict of interest.
References
- Purnobasuki, H. Potensi mangrove sebagai tanaman obat. J. Ilm. Ilmu-Ilmu Hayati 2004, 9, 125–126. [Google Scholar] [CrossRef]
- Zamani, N.P.; Ghazali, M.; Batubara, I. The study of tyrosinase and antioxidant activity of Xylocarpus granatum Koenig seed kernel extract toward evidence based indigenous knowledge from Togean Archipelago, Indonesia. J. Mar. Sci: Res. Dev. 2015, 5, 1–5. [Google Scholar] [CrossRef]
- Das, S.K.; Samantaray, D.; Sahoo, S.K.; Pradhan, S.K.; Samanta, L.; Thatoi, H. Bioactivity guided isolation of antidiabetic and antioxidant compound from Xylocarpus granatum J. Koenig bark. 3 Biotech 2019, 9, 198. [Google Scholar] [CrossRef] [PubMed]
- Dey, D.; Quispe, C.; Hossain, R.; Jain, D.; Ahmed Khan, R.; Janmeda, P.; Islam, M.T.; Ansar Rasul Suleria, H.; Martorell, M.; Daştan, S.D.; et al. Ethnomedicinal use, phytochemistry, and pharmacology of Xylocarpus granatum J. Koenig. Evid. Based Complement Altern. Med. 2021, 2021, 8922196. [Google Scholar] [CrossRef]
- Gao, Q.; Gao, Y.; Song, H.; Li, J.; Wu, Y.; Shi, X.; Shi, H.; Ma, Y. Cipadesin A, a bioactive ingredient of Xylocarpus granatum, produces antidepressant-like effects in adult mice. Neurosci. Lett. 2016, 633, 33–39. [Google Scholar] [CrossRef]
- Pejin, B.; Glumac, M. New cytotoxic natural products from the mangrove biome: Covering the period 2007-2015. J. Nat. Prod. Res. 2018, 33, 1624–1628. [Google Scholar] [CrossRef]
- Zhou, Z.F.; Kurtán, T.; Mándi, A.; Gu, Y.C.; Yao, L.G.; Xin, G.R.; Li, X.W.; Guo, Y.W. Novel and neuroprotective tetranortriterpenoids from Chinese mangrove Xylocarpus granatum Koenig. Sci. Rep. 2016, 6, 33908. [Google Scholar] [CrossRef]
- Das, S.K.; Samanta, L.; Thatoi, H. In vitro antidiabetic and antioxidant potentials of leaf and stem bark extracts of a mangrove plant, Xylocarpus granatum. J. Herbs Spices Med. Plants 2016, 22, 105–117. [Google Scholar] [CrossRef]
- Liao, M.; Pedpradab, P.; Wun, J. Thaixylograins A-H: Eight new limonoids from the thai mangrove, Xylocarpus granatum. Phytochem. Lett. 2017, 19, 126–131. [Google Scholar] [CrossRef]
- Batubara, I.; Darusman, L.K.; Mitsunaga, T.; Rahminiwati, M.; Djauhari, E. Potency of Indonesian medicinal plants as tyrosinase inhibitor and antioxidant agent. J. Bio. Sci. 2010, 10, 138–144. [Google Scholar] [CrossRef]
- Celano, R.; Docimo, T.; Piccinelli, A.L.; Rizzo, S.; Campone, L.; Di Sanzo, R.; Carabetta, S.; Rastrelli, L.; Russo, M. Specialized metabolite profiling of different Glycyrrhiza glabra organs by untargeted UHPLC-HRMS. Ind. Crop. Prod. 2021, 170, 113688. [Google Scholar] [CrossRef]
- Feng, X.; Zhang, W.; Wu, W.; Bai, R.; Kuang, S.; Shi, B.; Li, D. Chemical composition and diversity of the essential oils of Juniperus rigida along the elevations in Helan and Changbai Mountains and correlation with the soil characteristics. Ind. Crop. Prod. 2021, 159, 113032. [Google Scholar] [CrossRef]
- Dadwal, V.; Joshi, R.; Gupta, M. A comparative metabolomic investigation in fruit sections of Citrus medica L. and Citrus maxima L. detecting potential bioactive metabolites using UHPLC-QTOF-IMS. Food Res. Int. 2022, 157, 111486. [Google Scholar] [CrossRef] [PubMed]
- Kang, M.J.; Suh, J.H. Metabolomics as a tool to evaluate nut quality and safety. Trends Food Sci. Technol. 2022, 129, 528–543. [Google Scholar] [CrossRef]
- Lebanov, L.; Ghiasvand, A.; Paull, B. Data handling and data analysis in metabolomic studies of essential oils using GC-MS. J. Chromatogr. A 2021, 1640, 461896. [Google Scholar] [CrossRef]
- Putri, S.P.; Fukusaki, E. Mass Spectrometry-Based Metabolomics: A Practical Guide; CRC Press: Boca Raton, FL, USA, 2014. [Google Scholar]
- Niu, X.; Mi, S.; Jin, Q.; Sang, Y.; Wang, X. Characterization and discrimination of two varieties of eggplants using multi-element and metabolomics profiles coupled with chemometrics analysis. Food Res. Int. 2022, 162, 111976. [Google Scholar] [CrossRef]
- Bro, L.; Smilde, A.K. Principal component analysis. Anal. Methods 2014, 6, 2812–2831. [Google Scholar] [CrossRef]
- Feizi, N.; Hashemi-Nasab, F.S.; Golpelichi, F.; Saburouh, N.; Parastar, H. Recent trends in application of chemometric methods for GC-MS and GC×GC-MS-based metabolomic studies. TrAC Trends Anal. Chem. 2021, 138, 116239. [Google Scholar] [CrossRef]
- Zduńska, K.; Dana, A.; Kolodziejczak, A. Antioxidant properties of ferulic acid and its possible application. J. Skin Pharm. Physiol. 2018, 31, 332–336. [Google Scholar] [CrossRef]
- Singh, D.P.; Verma, S.; Prabha, R. Investigation on antioxidant potential of phenolic acid and flavonoid: The common phytochemical ingredients in plant. J. Plant Biochem. Physiol. 2018, 6, 219. [Google Scholar] [CrossRef]
- Rahmawati, S.I.; Izzati, F.N.; Hapsari, Y.; Septiana, E.; Rachman, F.; Bustanussalam; Simanjuntak, P. Endophytic microbes and antioxidant activities of secondary metabolites from mangroves Avicennia marina and Xylocarpus granatum. IOP Conf. Ser. Earth Env. Sci. 2019, 278, 012065. [Google Scholar] [CrossRef]
- Caban, M.; Lewandowska, U. Polyphenols and the potential mechanisms of their therapeutic benefits against inflammatory bowel diseases. J. Funct. Foods 2022, 95, 105181. [Google Scholar] [CrossRef]
- Procházková, D.; Boušová, I.; Wilhelmová, N. Antioxidant and prooxidant properties of flavonoids. Fitoterapia 2011, 82, 513–523. [Google Scholar] [CrossRef] [PubMed]
- Yan, Z.; Zhong, Y.; Duan, Y.; Chen, Q.; Li, F. Antioxidant mechanism of tea polyphenols and its impact on health benefits. Anim. Nutr. 2020, 6, 115–123. [Google Scholar] [CrossRef] [PubMed]
- Li, H.; Lin, L.; Feng, Y.; Zhao, M.; Li, X.; Zhu, Q.; Xiao, Z. Enrichment of antioxidants from soy sauce using macroporous resin and identification of 4-ethylguaiacol, catechol, daidzein, and 4-ethylphenol as key small molecule antioxidants in soy sauce. Food Chem. 2018, 240, 885–892. [Google Scholar] [CrossRef] [PubMed]
- Hang, D.T.N.; Hoa, N.T.; Bich, H.N.; Mechler, A.; Vo, Q.V. The hydroperoxyl radical scavenging activity of natural hydroxybenzoic acids in oil and aqueous environments: Insights into the mechanism and kinetics. Phytochemistry 2022, 201, 113281. [Google Scholar] [CrossRef]
- Saeedi, M.; Eslamifar, M.; Khezri, K. Kojic acid application in cosmetic and pharmaceutical preparations. J. Biomed Pharmacother 2019, 110, 582–593. [Google Scholar] [CrossRef]
- Nicolì, F.; Negro, C.; Vergine, M.; Aprile, A.; Nutricati, E.; Sabella, E.; Miceli, A.; Luvisi, A.; De Bellis, L. Evaluation of phytochemical and antioxidant properties of 15 Italian Olea europaea L. cultivar leaves. Molecules 2019, 24, 1998. [Google Scholar] [CrossRef]
- Adeyemi, O.S.; Atolani, O.; Banerjee, P.; Arolasafe, G.; Preissner, R.; Etukudoh, P.; Ibraheem, O. Computational and experimental validation of antioxidant properties of synthesized biactive ferulic acid derivatives. Int. J. Food Prop. 2018, 21, 101. [Google Scholar] [CrossRef]
- Prakash, M.; Basavaraj, B.V.; Chidambara Murthy, K.N. Biological functions of epicatechin: Plant cell to human cell health. J. Funct. Foods 2019, 52, 14–24. [Google Scholar] [CrossRef]
- Spagnol, C.M.; de Assis, R.P.; Brunetti, I.L.; Isaac, V.L.B.; Salgado, H.R.N.; Corrêa, M.A. In vitro methods to determine the antioxidant activity of caffeic acid. Spectrochim. Acta Part A Mol. Biomol. Spectrosc. 2019, 219, 358–366. [Google Scholar] [CrossRef] [PubMed]
- Phasha, V.; Senabe, J.; Ndzotoyi, P.; Okole, B.; Fouche, G.; Chuturgoon, A. Review on the use of kojic acid—A skin-lightening ingredient. Cosmetics 2022, 9, 64. [Google Scholar] [CrossRef]


Disclaimer/Publisher’s Note: The statements, opinions and data contained in all publications are solely those of the individual author(s) and contributor(s) and not of MDPI and/or the editor(s). MDPI and/or the editor(s) disclaim responsibility for any injury to people or property resulting from any ideas, methods, instructions or products referred to in the content. |
© 2023 by the authors. Licensee MDPI, Basel, Switzerland. This article is an open access article distributed under the terms and conditions of the Creative Commons Attribution (CC BY) license (https://creativecommons.org/licenses/by/4.0/).