Abstract
The 5G radio networks have introduced major changes in terms of service requirements and bandwidth allocation compared to cellular networks to date and hence, they have made the fundamental radio planning problem even more complex. In this work, the focus is on providing a generic analysis for this problem with the help of a proper multi-objective optimization algorithm that considers the main constraints of coverage, capacity and cost for high-capacity scenarios that range from dense to ultra-dense mmWave 5G standalone small-cell network deployments. The results produced based on the above analysis demonstrate that the denser the small-cell deployment, the higher the area throughput, and that a sectored microcell configuration can double the throughput for ultra-dense networks compared to dense networks. Furthermore, dense 5G networks can actually have cell radii below 400 m and down to 120 m for the ultra-dense sectored network that also reached spectral efficiency 9.5 bps/Hz/Km2 with no MIMO or beamforming.
1. Introduction
Radio planning is an essential task for wireless networks that mainly refers to calculating the number, location and configuration of the radio network nodes. In the early days, since no prior network infrastructure existed, this task considered only the estimation of the number of base stations (BSs) and their locations, i.e., the BS location problem [1,2,3,4]. In addition, for early cellular networks, radio network planning was split into two separate tasks: coverage and capacity. Nevertheless, as it was shown in several publications (e.g., [5,6,7]), capacity and coverage planning are not un-correlated. On the contrary, they are inter-related in 3G, 4G and now 5G wireless networks and hence, they must be treated together.
The 5G networks introduce really different elements from the previous generations, mainly due to virtualization and service-based architecture. Among other things, they are designed for considerably higher data rates, very large numbers of connected Internet of Things (IoT) devices and low latency while providing adaptive means for network scalability and flexibility. The number of the 5G radio frequency bands is targeted to be higher than in previous generations of cellular networks, more specifically multiple mmWave bands [8]. Also, massive Multiple Input Multiple Output (MIMO) and hybrid beamforming are core techniques to achieve the targeted high data rates and the large number of devices [9].
Typically the cell deployment architectures can be classified into standalone and overlay architectures. In the context of 5G, the first refers to a network deployment that consists of mere mmWave small cells, while the latter refers to the deployment of mmWave small cells on top of the existing macro-relay networks in the form of hierarchical or mixed cell structures. In the overlay architecture, the existing (pre5G) macrocell layer is mainly for coverage as well as mobility and signaling problems originating from the mmWave small-cell layer, which exists for capacity boosts. The much wider bandwidth as well as the beamforming/MIMO capabilities, together with the reduced access-link distances, give the mmWave small cells the capability to substantially increase the system capacity. It has to be mentioned here that another advantage of the overlay network architecture is the separation of control and message transmissions. All the control signaling is supported via the existing macrocells and high data rate transmissions go through the mmWave small-cell network.
5G radio planning is now of utmost importance since not only does it require cost-optimized deployments capable of handling a variety of demand constraints, but also since it then affects the optimal placement of the core network elements, e.g., for achieving low latency values.
In order to tackle these issues, this article presents a generic analysis that allows for evolutionary radio network planning towards 5G mmWave standalone small-cell architectures. Due to the complex nature of the problem, a multi-objective optimization algorithm is appropriately modified in order to provide solutions in the context of the multiple constraints and specifics of a 5G mmWave network with particular emphasis in the 28 GHz band. The three main constraints of coverage, capacity and cost are studied for a range of cases that reflect scenarios from dense to ultra-dense network deployments in order to achieve high capacity.
The optimization algorithm used in this paper is the evolution of the algorithm previously used for the analysis of Long-Term Evolution (LTE) systems [7]. In this study, the analysis is focused on network dimensioning for the mmWave band at 28 GHz. Hence, the propagation module is modified accordingly and a path loss model based on results of field trials at the 28 GHz band is applied. For this analysis only microcells are considered with tri-sector directional antennas, as well as omnidirectional antenna patterns. Moreover, the system module is upgraded to encompass 5G rate calculations, while the core analysis is focused on the impact of high-density microcell deployments on the spectral efficiency and throughput efficiency of these systems.
The remainder of the paper is organized as follows: Section 2 starts with the formulation of the radio network planning optimization problem and then explains the developed simulation methodology in terms of the employed propagation model, the necessary 5G system characteristics and the planning optimization method. Section 3 presents the results for different 5G standalone small-cell network deployments, namely dense, very dense and ultra-dense. Finally, concluding remarks are provided in Section 4.
2. Problem Formulation and Simulation Methodology
For the study of dense networks at high frequencies, two types of serving radio network nodes were considered in the planning process of our analysis: omnidirectional and tri-sectored microcells. When sectorized scenarios were considered, at each site three gNBs were co-located (reuse pattern 1 × 3 × 1). During the planning process, all three sectors or only a subset of them could be activated, according to the required signal strength in an area and/or the need to limit the overall interference of the system. Although the algorithm was developed to also examine tri-sectored macrocells with relay nodes, they were not considered here since the focus was to analyze the capacity capabilities of ultra-dense standalone small-cell architectures. Note that each cell can also have MIMO capabilities.
Control Nodes (CNs) were used in our study in order to represent throughput requirements as well as coverage constraints. Specifically, K CNs were distributed in the area under study and each CN was associated with a rate requirement, i.e., . Introduced by system link budget calculations, the received power at each CN should always exceed a minimum power threshold.
Furthermore, the optimization process was employed on discrete locations rather than on continuous x-y space, an approach already applied and tested for previous generation network deployments [2,5,6]. This way the complexity of the NP-hard problem of continuous space calculations was avoided [10], but also, this was closer to the actual planning process employed by network operators where existing sites are most certainly reused in any future network layout.
The outline of the radio network planning process is shown in Figure 1. A more detailed description is provided in the next sections.
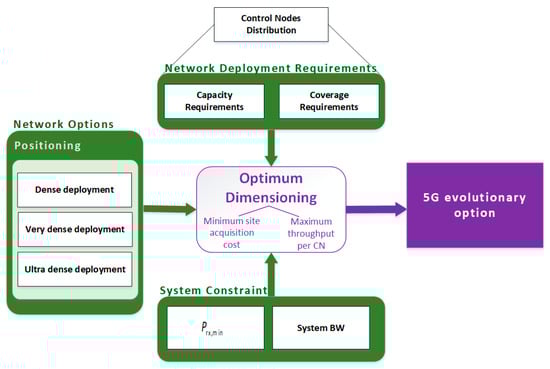
Figure 1.
Radio network planning outline.
2.1. Scenario: Network Deployment Requirements
Herein, our planning process was employed in a rectangular area with dimensions 1 Km × 1 Km. Due to the area characteristics, the requirements/constraints of the planning process were defined against a set of 25 equi-spaced CNs (separation distance of 200 m). This grouping of CNs represented the high-capacity requirements in a small area, i.e., a demanding network planning operational scenario that requires a dense network deployment.
Since the trade-off between performance and network density was our main concern, a clear preexisting network layout was considered and new transmitting sites were explored, i.e., microcells with various density deployments were examined. Scenarios with 30 (5 × 6 grid), 100 (10 × 10 grid) and 400 (20 × 20 grid) candidate microcells uniformly distributed in the area were studied in the analysis below in order to investigate the capabilities of a dense network. However, it should be pointed out that the locations of the candidate network sites were an external parameter to our platform, thus could be defined by any interested stakeholder.
2.2. The Planning Method
The planning analysis consisted of three pillars:
- Propagation analysis
- System analysis
- Planning optimization
2.2.1. Propagation Analysis
Various studies have been conducted in projects like METIS, MiWEBA, ITU-R M, mmMAGIC etc. in order to deploy channel models in higher frequency bands, such as millimeter waves, to support 5G use cases [8,11,12,13]. The path loss model that was adopted here was the Alpha-Beta-Gama (ABG) empirical path loss model:
The model has three parameters to describe mean path loss over frequency and distance, which derive from the statistical process of measurements. In our analysis, at urban environments at 28 GHz, these parameters took the following values [13]:
The propagation losses of this model vs. distance for f = 28 GHz are depicted in Figure 2 along with the losses of the WINNER model for microcells at the 2 GHz band of LTE [14].
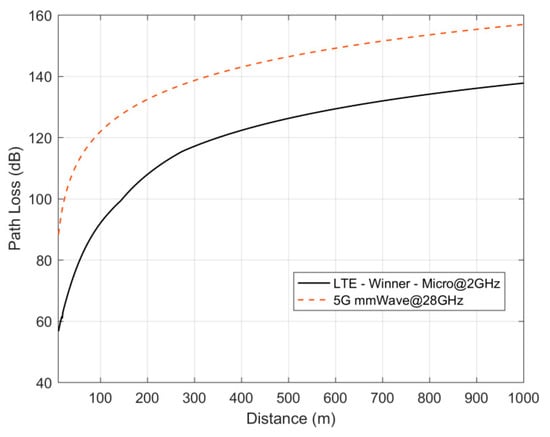
Figure 2.
Path loss vs. distance at 28 GHz and 2 GHz bands.
Table 1 summarizes typical values used in the performed simulations for generic mmWave operational scenarios.

Table 1.
Simulation parameters.
We considered the downlink of a 5G network since it is usually the bottleneck for such a system. The Signal to Interference plus Noise Ratio (SINR) at the kth CN is:
where b is the serving gNB for the kth CN, and are the transmitted power and maximum antenna gain for the bth gNB, respectively, while is the normalized antenna gain of the bth gNB towards the kth CN and is the channel gain between them. Similarly, for the interference calculation, is the normalized antenna gain of the ith interfering gNB towards the served CN. Lastly, PN is the noise power at the receiver. The micro gNBs employ either omnidirectional antennas () or directional 120° sector antennas [15] with A0 = 18 dBi (see Table 1) and , where . It has to be noted here that the Effective Isotropic Radiated Power (EIRP) of the transmitting BS antennas remains the same with sector and omnidirectional antennas, i.e., 60 dBm.
2.2.2. 5G System Module
The rate requirements set at each CN are to be met by 5G system options [16,17,18], hence, a generic 5G rate calculation module was used in order to associate SINR calculations at each CN with the maximum throughput offered by the system. As previously mentioned, the system module that was originally designed upon the LTE-A system’s specifications [7] is now extended to consider 5G system options in FR2 bands, i.e., n257 in the mmWave range around the 28 GHz. The system module considers a wideband channel of 100 MHz with subcarrier spacing of 60 KHz, a combination that leads to 132 resource blocks [19]. The carrier aggregation technique was also considered with 16 New Radio (NR) carriers [20], the maximum allowable by the 5G NR Radio Access Technology (RAT). The total bandwidth increased to 1.6 GHz, while the total number of available RBs was 2112 (16 NR carriers × 132 RBs per carrier). The module used the measured SINR at the CN side to estimate the required number of RBs to offer the capacity requirement.
Figure 3 provides an insight on the rate offered from a 5G system as configured herein, when compared to a typical LTE-A system with 20 MHz of bandwidth and five component carriers leading to 100 MHz of aggregated bandwidth. Both systems were considered without MIMO spatial-multiplexing schemes since an eight-layer transmission can be supported by both.
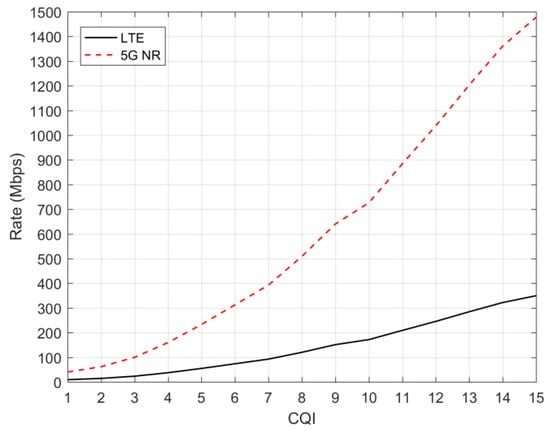
Figure 3.
Rate calculations for an LTE-A system with 20 MHz bandwidth and five aggregated component carriers compared to the 5G NR system employed in this work.
2.2.3. The Planning Optimization Algorithm
Our goal herein was to propose a network layout of optimally located microcells that keep the deployment cost to a minimum while at the same time specific coverage and capacity criteria are met. Since in this analysis we only considered microcells, the deployment cost of each node was the same, C, and hence, the total cost of a network deployment was directly proportional to the number of nodes deployed.
Equations (4)–(7) are formulating this optimization problem.
Subject to:
where is the set of candidate microsites that are under examination, is the cost of the b microsite (herein, ), K is the fixed set of CNs defined in Section 2.1, is the received power of the k CN, is the set gNBs associated with the sites (as previously mentioned, when sectors are considered, each site comprises three gNBs), is the set of CNs currently served by gNB, is the maximum allowed resource blocks of a gNB, is the rate offered by the system to the k CN and finally is the capacity requirement. Note that the different candidate solutions that were examined () were derived in the context of the Genetic Algorithm (GA) methodology as it is described in the following.
The solution to the optimization problem defined earlier was the set of microsites that entails the minimum total cost [7] of network deployment while at the same time meets the constraints set by Equations (5)–(7). Herein, the optimization problem was tackled with a multi-objective evolutionary algorithm [10] and specifically with the NSGA-II (Non-sorting Dominated Genetic Algorithm-II). For this, the problem was analyzed and translated into a three-dimensional fitness function, . Each dimension corresponded to an objective that needed to be minimized. Equations (8)–(10) define the fitness function to be minimized.
The first objective, , corresponds to the weighted network cost, the second, , is the total number of CNs that do not meet their requirements, either capacity or coverage, while is the excess RBs needed at a network level.
The NSGA-II algorithm imitates evolutionary mechanisms and employs biological operations found in nature for generating optimal solutions. It starts with a random selection of an initial population (sets of microsites) and by iteratively using operators such as selection, evaluation and crossover or mutation evolves into optimal solutions. When NSGA-II reaches an optimal pareto front, i.e., it cannot be further improved (average pareto spread and distance criteria were used [6]), then a series of solutions corresponding to that pareto front is derived.
3. Radio Network Planning Results
Uniformly distributed CNs in the service area represented the area coverage and capacity criterion. An initial throughput requirement was allocated at each CN, which gradually increased. At relatively low capacity requirements, microcells with omnidirectional antenna patterns were uniformly placed by the optimization algorithm, as seen in Figure 4a, in order for each microcell to serve all neighbor CNs (shown in Figure 4a with black stars). The SINR distribution (Figure 4b) also followed this regular pattern. Note that although the received power fell sharply with distance due to the relatively high frequency, the SINR did not fall as rapidly due to the equivalent reduction of the interference from other cells.
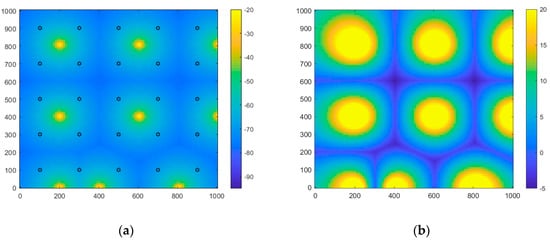
Figure 4.
(a) Received power (dBm) and (b) SINR distribution in the service area for a dense omnidirectional micro gNB deployment.
Microcells with omnidirectional patterns were then replaced by tri-sectored microcells, with each sector being a separate gNB in order to offer increased spatially selective throughput. Note that the EIRP of the transmitting BS antennas remained the same for sector and omnidirectional antennas (60 dBm), while a sector could be switched off, if it was not needed, in order to keep interference levels low. Hence, in the results depicted in Figure 5, there was a microcell with only one operating sector, and another microcell with two transmitting sectors. The rest of the microcells were placed as far apart as possible in order for all three sectors to be transmitting and covering a wider area.
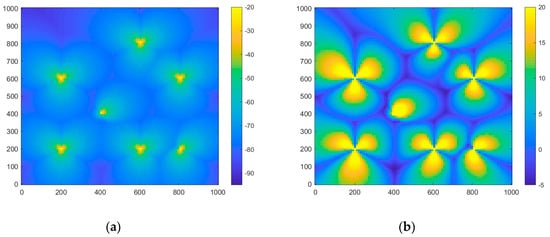
Figure 5.
(a) Received power (dBm) and (b) SINR distribution in the service area for a dense tri-sector micro gNB deployment.
As the throughput requirements increased, denser grids of microcells were deployed. As can be seen in Figure 6a, for high-capacity requirements with the ultra-dense networks, only microcells close to the CNs were transmitting, with only one sector pointing directly towards the corresponding CN. As a consequence, in Figure 6b, the positions not close to a sector antenna pointing directly towards them had very low SINR due to increased interference from the dense transmitting antenna grid. However, due to the optimization algorithm, the antenna position was such that there was no CN in a position of low SINR. With such optimal placement, the maximum throughput for the 25 CNs in the area reached as high as almost 16 Gbps/Km2.
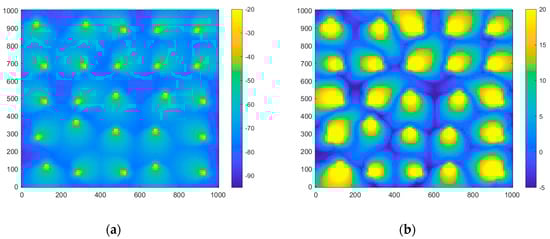
Figure 6.
(a) Received power (dBm) and (b) SINR distribution in the service area for an ultra-dense tri-sector micro gNB deployment.
Overall, comparing the performance of the various network configurations that resulted from the optimization algorithm, it was evident that the denser the microcell deployment, the higher the area throughput (see Figure 7). Moreover, with tri-sector microcells, the throughput almost doubled at the ultra-dense networks with respect to that of dense networks, either with omnidirectional or sector antennas. At these scenarios, as seen in Figure 6, most of the times each microcell had only one sector antenna operating and hence, the advantage with respect to the omnidirectional deployment was due to interference reduction to adjacent cells.
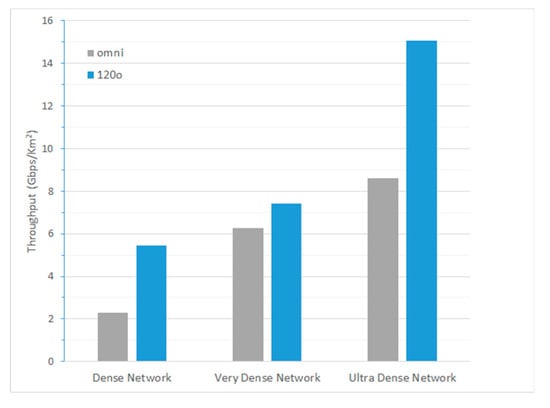
Figure 7.
Throughput per Km2 for different network densities with omnidirectional and tri-sector micro gNBs.
Figure 8 provides an insight into how dense 5G networks with standalone small-cell architectures can actually get. Even for the omnidirectional reference scenario, the cell radius did not get higher than 400 m, while for the ultra-dense network the cell radius further decreased down to 120 m. The spectral efficiency achieved now was 9.5 bps/Hz/Km2, approximately three times lower than the 5G target of 30 bps/Hz, although no MIMO/beamforming was considered in our generic analysis. If this is also considered, then it becomes obvious that the spectral efficiency goal will be easily exceeded.
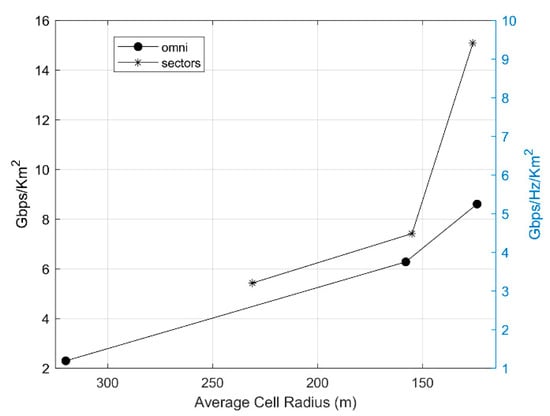
Figure 8.
Throughput (and spectral efficiency per Km2) associated with the cell radius for the omnidirectional and sectorized scenarios and the dense/very-dense/ultra-dense scenarios (from left to right).
4. Conclusions
The ever-increasing demand for new wireless services, together with the evolution of cellular networks, has led to the 5G era. The new network generation introduces major changes and, as a consequence, significant challenges in terms of radio planning. This work focused on providing a generic analysis for this problem, emphasizing the need for dense standalone small-cell networks in the mmWave band of 28 GHz, in order to achieve the capacity goals of 5G. The complex nature of the problem led us to employ a properly modified multi-objective optimization algorithm in order to provide solutions in the context of the multiple constraints and specifics of a 5G mmWave network. The three main constraints of coverage, capacity and cost were studied for a range of cases that reflected scenarios from dense to ultra-dense network deployments in order to achieve high capacity.
The produced results showed that the denser the microcell deployment, the higher the area throughput and also that sectored microcells double the throughput for ultra-dense networks compared to dense networks since better interference control is achieved through the operation of one, instead of two or three, sector antennas. In terms of how dense 5G networks with standalone small-cell architectures can actually get, the analysis showed cell radii below 400 m that reached 120 m for the ultra-dense sectored network. Finally, the spectral efficiency reached 9.5 bps/Hz/Km2 with no MIMO/beamforming, which leads to the conclusion that the 5G spectral efficiency goal can be easily exceeded if these techniques are also exploited.
Author Contributions
Conceptualization, G.E.A., D.A.Z., G.V.T., P.K.G. and D.I.K.; methodology, G.E.A., D.A.Z. and P.F.; validation, G.E.A., P.F. and D.A.Z.; formal analysis, P.F.; investigation, G.E.A., D.A.Z. and G.V.T.; writing—original draft preparation, G.E.A, D.A.Z. and G.V.T.; writing—review and editing, G.E.A, D.A.Z., G.V.T., P.F., P.K.G. and D.I.K. All authors have read and agreed to the published version of the manuscript.
Funding
This research received no external funding.
Conflicts of Interest
The authors declare no conflict of interest.
References
- Hurley, S. Planning effective cellular mobile radio networks. IEEE Trans. Veh. Technol. 2002, 51, 243–253. [Google Scholar] [CrossRef]
- Molina, A.; Athanasiadou, G.; Nix, A. The automatic location of base-stations for optimised cellular coverage: A new combinatorial approach. Proceedings of the Vehicular Technology Conference. In 1999 IEEE 49th; IEEE: Houston, TX, USA, 1999; pp. 606–610. [Google Scholar]
- Amaldi, E.; Capone, A.; Malucelli, F. Radio planning and coverage optimization of 3G cellular networks. Wirel. Netw. 2007, 14, 435–447. [Google Scholar] [CrossRef]
- Lakshminarasimman, N.; Baskar, S.; Alphones, A.; Willjuice Iruthayarajan, M. Evolutionary multiobjective optimization of cellular base station locations using modified NSGA-II. Wirel. Netw. 2011, 17, 597–609. [Google Scholar] [CrossRef]
- Athanasiadou, G.E.; Zarbouti, D.; Tsoulos, G.V. Automatic location of base-stations for optimum coverage and capacity planning of LTE systems. In The 8th European Conference on Antennas and Propagation (EuCAP 2014); IEEE: Houston, TX, USA, 2014; pp. 2077–2081. [Google Scholar]
- Valavanis, I.K.; Athanasiadou, G.E.; Zarbouti, D.A.; Tsoulos, G.V. Multi-Objective Optimization for Base-Station Location in Mixed-Cell LTE Networks. In Proceedings of the 10th European Conference on Antennas and Propagation (EuCAP), Davos, Switzerland, 10–15 April 2016. [Google Scholar]
- Athanasiadou, G.; Tsoulos, G.; Zarbouti, D.; Valavanis, I. Optimizing Radio Network Planning Evolution Towards Microcellular Systems. Wirel. Pers. Commun. 2019, 106, 521–534. [Google Scholar] [CrossRef]
- Rappaport, T.S.; Xing, Y.; MacCartney, G.R.; Molisch, A.F.; Mellios, E.; Zhang, J. Overview of Millimeter Wave Communications for Fifth-Generation (5G) Wireless Networks—With a Focus on Propagation Models. IEEE Trans. Antennas Propag. 2017, 65, 6213–6230. [Google Scholar] [CrossRef]
- Tsoulos, G.V. Smart antennas for mobile communication systems: Benefits and challenges. Electron. Commun. Eng. J. 1999, 11, 84–94. [Google Scholar] [CrossRef]
- Deb, K.; Pratap, A.; Agarwal, S.; Meyarivan, T. A fast and elitist multiobjective genetic algorithm: NSGA-II. IEEE Trans. Evol. Comput. 2002, 6, 182–197. [Google Scholar] [CrossRef]
- 3GPP TR 38.900 v14.2.0, LTE; 5G; Study on Channel Model for Frequency Spectrum Above 6 GHz; ETSI: 650 Route des Lucioles, F-06921 Sophia Antipolis CEDEX, France, 2017.
- Piersanti, S.; Annoni, L.; Cassioli, D. Millimeter waves channel measurements and path loss models. In Proceedings of the 2012 IEEE International Conference on Communications (ICC), Ottawa, ON, Canada, 10–15 June 2012; pp. 4552–4556. [Google Scholar]
- Sun, S.; Rappaport, T.S.; Rangan, S.; Thomas, T.A.; Ghosh, A.; Kovacs, I.Z.; Rodriguez, I.; Koymen, O.; Partyka, A.; Jarvelainen, J. Propagation Path Loss Models for 5G Urban Micro- and Macro-Cellular Scenarios. In Proceedings of the IEEE 83rd Vehicular Technology Conference–Spring, Nanjing, China, 7 May 2016. [Google Scholar]
- Pekka, K.; Juha, M.; Hentilä, L. WINNER II - D1.1.2 - Channel Models. IST-4-027756 WINNER II. 2007. Available online: http://www.ero.dk/6799B797-53CC-417E-B6FA-059A8E6AF350?frames=no& (accessed on 1 February 2020).
- 3GPP TR 36.814; Technical Specification Group Radio Access Network; Evolved Universal Terrestrial Radio Access (E-UTRA);Further Advancements for E-UTRA Physical Layer Aspects (Release 9); 3GPP: 650 Route des Lucioles, Sophia Antipolis Valbonne, France, 2010.
- Salem, A.A.; El-Rabaie, S.; Shokair, M. A Proposed Efficient Hybrid Precoding Algorithm for Millimeter Wave Massive MIMO 5G Networks. Wirel. Pers. Commun. 2020, 1–16. [Google Scholar] [CrossRef]
- Sharma, V.; You, I.; Leu, F.; Atiquzzaman, M. Secure and efficient protocol for fast handover in 5G mobile Xhaul networks. J. Netw. Comput. Appl. 2018, 102, 38–57. [Google Scholar] [CrossRef]
- Liu, L.; Zhou, Y.; Vasilakos, A.V.; Tian, L.; Shi, J. Time-domain ICIC and optimized designs for 5G and beyond: A survey. Sci. China Inf. Sci. 2019, 62, 1–28. [Google Scholar] [CrossRef] [PubMed]
- 3GPP TS 38.104, “5G; NR; Base Station (BS) Radio Transmission and Reception”; ETSI: 650 Route des Lucioles, F-06921 Sophia Antipolis CEDEX, France, 2019.
- 3GPP TR 21.915, “Digital cellular telecommunications system (Phase 2+) (GSM); Universal Mobile Telecommunications System (UMTS); LTE; 5G; Release description; Release 15; ETSI: 650 Route des Lucioles, F-06921 Sophia Antipolis CEDEX, France, 2019.


© 2020 by the authors. Licensee MDPI, Basel, Switzerland. This article is an open access article distributed under the terms and conditions of the Creative Commons Attribution (CC BY) license (http://creativecommons.org/licenses/by/4.0/).