Abstract
A novel method for measuring the electrical resistance in wood is presented. It is based on applying an Alternating Current (AC) to two electrodes rammed into the wood. The method reduces the transient time for value stabilization. In case of Direct Current (DC) resistance measurement methods, typically used in wood measurement, an initial transient exists, invalidating the measured value during an initial transient period. This measurement method uses an electronic circuit based on a relaxation oscillator where the wood automatically sets the oscillation frequency depending on its electrical resistance. Compared to other AC methods, this circuit greatly simplifies the measurement process, not requiring any previous analysis for wood AC frequency estimation. Experimental results for four different wood species showed that, in all cases, the transient response of the measured wood resistance is improved when compared to the DC resistance method, reducing the stabilization time from 10–12 min in DC measurements to almost zero for the novel measurement method. The deviation between the initial wood resistance measurement and the stable value resulted in a range between 0.2% and 5% with the proposed method, while a range between 6% and 10% was obtained when using the DC method. Moreover, the proposed circuit is able to detect changes in wood resistance produced by small variations in temperature and environmental relative humidity during continuous long term measurements. For repeatability analysis, it was verified that similar ambient conditions of temperature and relative humidity (variations lower than 1 °C and 1%, respectively) in different moments provided variations lower than 1.5%. The method can also be applied to other fiber materials affectd by polarization effects when an electrical current is applied into them.
1. Introduction
Moisture Content (MC) in wood affects its physical and mechanical properties [1,2,3,4]. Additionally, a high MC value above the fiber saturation point (roughly 30% MC) maintained over time increases the risk of infestation and decay of wooden substrate by wood-destroying fungi [5]. This is of special interest in case of wood used as a building material (roofs, walls, floors, beams, etc.) or furniture for outdoor applications. Hence, an accurate moisture monitoring is essential to forecast and prevent wood decay due to high MC levels.
The MC in wood is typically measured using direct or indirect methods [6]. Direct methods are destructive and based on the wood water content extraction or kiln drying at 103 ± 2 °C [6,7]. Obviously, these methods are not applicable in case of wood already fixed in a building, timber or furniture. Indirect methods are based on the measurement of a physical property of wood heavily dependent on its moisture content [3], such as the electrical resistance for the so-called resistive methods [8,9,10,11], dielectric constant for the capacitive [4,12] or microwave methods [13], sorption capacity methods [14] and others [3].
Concerning indirect measurement methods, the electrical resistance measurement is a common technique to estimate the MC in wood; it is relatively fast and non-destructive. Additionally, a direct relation between resistivity () and MC in wood exists, adequately adjusted depending on the type of wood and temperature [3,8,9]. Resistivity in a material is measured by its electrical resistance R. In case of wood, applying a voltage in two electrodes rammed into the wood creates an electric current path between the electrodes and thus, resistance can be measured. For a certain electrode position separated an L distance, the wood electrical resistance between the electrodes is , where A is the current area transversal section. Thus, resistance R depends on the geometry of the wood piece, the electrode position, the material of the electrodes [13,15,16], the insertion depth of the electrodes, the wood species and its associated density, heartwood and sapwood [17], wood temperature and its MC [3]. Most of these parameters affecting the measured value can be controlled or adjusted by using standard measurement protocols as the EN 13183-2:2002 European Norm [18] for sawn timber or EN 16682:2018 [19] describing the limits and conditions by which the resistive measurement method can be applied to wood and conservation of cultural heritage. Thus, under laboratory conditions and using high precision instruments, the electrical resistance in wood can be accurately measured. However, in practical scenarios, measurement is typically made in the field under non-controlled environment conditions using commercial instruments [20] leading to inaccurate values. As a summary, two main groups of factors affect the R measurement in wood: those associated to internal wood characteristics which need to be measured and those associated with the experimental measurement procedure [18,19], which can be set prior to the measurement.
Concerning resistive measurement methods, both direct current (DC) [8,9,10,11] or alternating current (AC) [21,22] can be applied to the electrodes in order to determine its equivalent resistance R. In the DC resistance measurement method, a polarization effect exists, which results in a transient response in the measured resistance [6,7,18]. To minimize this polarization effect, References [21] and [22] propose to alternate the polarity of the voltage applied to the electrodes, that is, the application of an alternating current (AC). Their procedure is as follows: first, a positive polarization voltage is applied and, after a certain time, which varies depending on the wood species, the current is measured; second, repeat the same process with a negative polarization voltage. These two steps are repeated until equal and stable values are obtained, calculating the resistance by averaging the last seven values. The main drawback in this procedure lies in an adequate determination of the AC frequency required to reach stabilization, which must be estimated by a previous analysis specific to the type of wood.
Table 1 summarizes the review of the existing literature on resistance measuring methods and compares the results for AC and DC methods proposed in the literature.

Table 1.
State-of-the-art literature review on resistance measuring methods.
To solve this problem, this work proposes a novel AC method to measure the wood electrical resistance, where no previous analysis is needed to estimate the optimal AC frequency to be applied. Additionally, polarization effects in transient measurements are minimized.
This work is organized as follows: Section 2 describes the proposed method and the associated electronic circuit that automatically tunes the AC frequency applied to the wood. This section also verifies the circuit behavior. Section 3 details all different tests performed and types of wood analyzed in order to verify the measurement method. Section 4 shows the results of the wood electrical resistance during the initial transient (20 min) using the proposed method, compared with the traditional DC method. Measurements of wood electrical resistance after the initial transient are presented, showing that the proposed circuit can detect changes in wood resistance produced by small variations in temperature, along time. Repeatability results were also made: with the same ambient conditions the resistance value at different measurement moments for a certain wood sample provided a variation lower than 1.5%. Finally, Section 5 deals with conclusions.
2. Novel Measurement Method and Electronic Circuit
As stated above, due to polarization/depolarization effects in wood, an AC method is preferred to reduce the initial transient response when the wood electrical resistance is measured [21,22]. The main drawback of the AC method proposed in Reference [21] is the requirement of previous study on the material as specific AC frequency is needed to obtain a stable value for the wood electrical resistance. The novel AC method based on a relaxation oscillator proposed in this paper avoids previous analysis and reduces the initial transient in the resistance measurement when compared to a DC method. The relaxation oscillator is shown in Figure 1. Thus, depending on the wood electrical resistance (mainly dependent on MC and wood species), the wood automatically sets the oscillation frequency (f) of the applied alternating current.
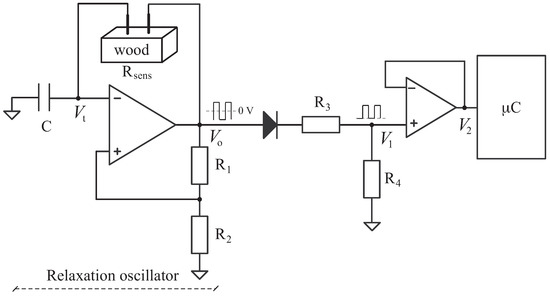
Figure 1.
Supporting electronic circuit for the proposed Alternating Current (AC) measurement method. The relaxation oscillator tunes frequency depending on wood properties, mainly, Moisture Content (MC) and species.
2.1. Measurement Circuit
The proposed relaxation oscillator (Figure 1) acts as a resistance-to-period converter, where the capacitor C is charged/discharged through voltage (square signal) varying between and when the threshold values and are reached in , respectively as shown in Equation (1).
Assuming that the saturation voltages in the operational amplifier are symmetrical, the oscillation period T in linearly depends on according to Equation (2). Thus, by measuring T we can obtain , that is, the wood resistance value.
The time period T is composed by the C capacitor charging time where and when the capacitor is discharged and . In this case, capacitor pF, providing oscillation frequencies up to 100 mHz. Using such low oscillation frequencies, the wood can be considered as a pure resistance according to its simplified model [15,16] where the parallel capacitor effect can be neglected.
2.2. Circuit Verification
Before having the circuit measuring the wood resistance value, it was verified using a calibrated resistance decade box (IET model VRS-100) as . As this circuit main goal is at high resistance values (i.e., low MC), only resistances in the range between 10 MΩ and 100 GΩ were considered. However, the measurement range can be modified by changing C value.
First, the experimental relation between the measured period T and the resistance values fixed by the resistance decade box was obtained. As shown in Figure 2, the points fit a polynomial as in Equation (3) with T expressed in seconds and a correlation coefficient near unity. No significant differences with temperature variations were found when ambient temperature ranged between 20 °C and 30 °C.
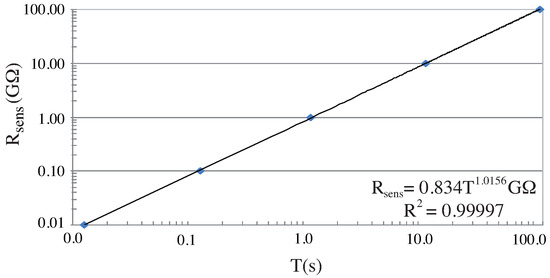
Figure 2.
Experimental relation between and T using the proposed AC method. As seen, the obtained period T is directly related to in the whole measurement range [10 MΩ, 10 GΩ] and can be linearly interpolated.
Second, stability tests in order to evaluate the accuracy of the measurements for severals hours were also conducted. In this case, two pattern resistance values of 1 GΩ and 10 GΩ in the calibrated resistance box were used. During 15 h, the T value was measured with one minute sampling period. During the experiment, temperature ranged from 24 °C to 29 °C and environmental relative humidity (RH) from to . Obtained results provided an oscillation period s for and s for . In both cases, the extended uncertainty was obtained with factor .
Third, a study of the capacitor charge and discharge times ( and ) using the resistance decade box was made. Figure 3a shows the output voltage for , where and are indicated. Theoretically, and must be equal; however, due to slight differences in real and values, and can be slightly different. Figure 3b shows measured values of and for during 200 min. As seen, and are not exactly equal, having an average difference of ms. In case of , a ms was obtained, which supports the theoretical equations, that is, the time required to reach or increases with and thus, also increases.
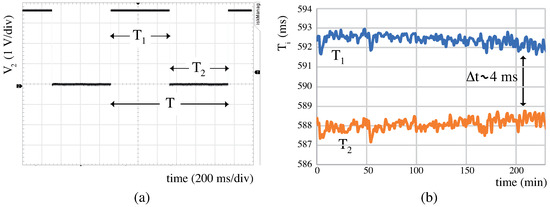
Figure 3.
Experimental results for calibrated : (a) Output voltage , (b) and during 200 min.
According to the obtained values, when using a piece of wood as with equivalent unknown resistance between 1 GΩ and 10 GΩ, the obtained T value will provide the value according to Equation (3), with a slight variation in between 4 ms and 40 ms.
3. Materials and Methods
Four different wood species were selected: European ash (Franxinus excelsior), Maritime pine (Pinus pinaster), Douglas-fir (Pseudotsuga menziesii) and Sweet chestnut (Castanea sativa). In all cases the wood was dry for a low MC, that is, a high resistance value. As no comparison between different species is intended to be performed in this paper, different block size for each species (Table 2) has been considered. Two iron nails with 0.7 mm diameter were used as electrodes. They were inserted 10 mm deep, with a separation of 20 mm in the center of the wood block, forming a longitudinal line aligned with the wood grain. For stabilization and homogeneity purposes, wood samples were stored during one year in the laboratory.
Table 2.
Geometrical dimensions of wood blocks of different species used for the experimental electrical resistance measurement test.
Two main tests were performed, from which three analyses were made: transient response minimization for measurement, charge/discharge period analysis and values in steady-state with small variations of environmental conditions (temperature and relative humidity).
- Transient response test: The value for all wood species was measured every 15 s during 20 min from the beginning of circuit functioning. 96 h before the measurements took place, laboratory temperature and relative humidity were kept approximately constant (temperature ranged from 24 °C to 26 °C and ambient humidity from 58% to 62% ). During measurement, a nearly constant temperature was maintained in the laboratory (±1 °C). These measures were performed both with the proposed method and with the traditional DC method. Figure 4 shows the used test-bench for the proposed method, where the analogue circuit described in Section 2 is connected to a microcontroller which is also connected to a computer via ZigBee (wireless communication protocol). For the DC method, an electrometer (Keithley K6517A, measuring resistance in the range , with a 0.5% precision), with V was used. In both cases, data were displayed and recorded in a computer using a custom developed application under LabVIEW software.
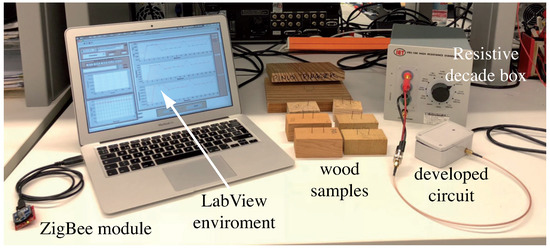 Figure 4. Testbench for wood resistance measurement using the proposed AC method.
 - Charge/discharge time analysis: For the above described experiment, the charge and discharge times and were measured and its associated time difference was calculated.
- Steady-state measurements: Using the proposed method, the wood resistance value was measured during 15 h, every 10 min. Ambient temperature and humidity were measured by means of an SHT75 sensor, with an accuracy of ±0.3 °C and RH.
4. Results and Discussion
In this section, transient and steady-state measures of the electrical resistance for the wood blocks described in Table 2 are presented. Additionally, the expected and values are compared to those experimentally obtained.
4.1. Transient Response Analysis
Figure 5 shows the results for each wood species, during 20 min, left column for the DC method and right column for the proposed AC method. In both cases, the blue line shows the measured resistance value and the orange line shows the variation of the coefficient in percentage, being the measured resistance value at the initial instant.
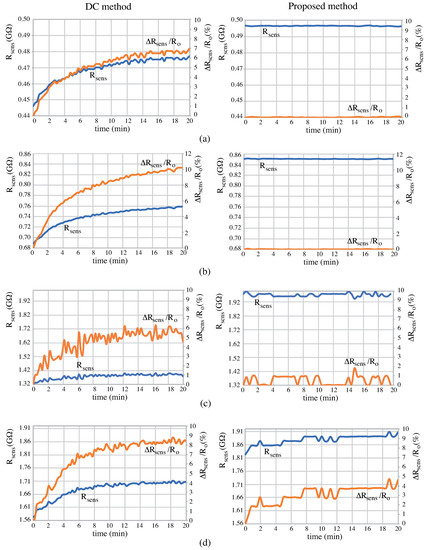
Figure 5.
Experimental results for transient measurement values by the proposed method (right column) and Direct Current (DC) method (left column) for: (a) Douglas-fir, (b) Sweet chestnut, (c) Maritime pine, (d) European ash.
For all analysed wood species, it is clearly seen that the measured value is very stable for the proposed method, while the DC measured value tends to increase with time. This is a polarization effect, which is cumulative in time as the electrical charges in the wood are not modified in the DC method. This effect is clearly visible in Douglas-fir (Figure 5a, variation in DC versus in the proposed method) and Sweet chestnut (Figure 5b, versus ), while minor variations were obtained for Maritime pine (Figure 5c, versus ) and European ash (Figure 5d, versus worst-case). As seen, while the wood species varies the result, the proposed method provides a more stable behavior in all cases.
These results clearly show that the proposed method is more accurate and stable than the traditional DC method. It is also shown that polarization effects take place in the wood when injecting an electrical current for a long time in the same direction (as in DC), modifying the internal physical and chemical properties and thus, the equivalent electrical resistance. However, an AC method modifies the current direction through the wood and compensates the internal polarization effects.
4.2. Charge/Discharge Time Analysis
As seen in Figure 6 and described in Section 2.2, value mainly depends on wood resistance. However, the measured in wood is higher than its equivalent electrical resistance using the decade box (Section 2.2): for 1 GΩ decade box, ms and for Sweet chestnut , ms which is significantly longer than the expected value of 4 ms. Thus, it is pointed that wood inherent characteristics affect the measured value, not being the equivalent electrical resistance the only relevant aspect to study [4,6,7]. The electrical resistance for the analysed species ranged from 0.50 GΩ to 2.02 GΩ, providing a theoretical range values of ms (Section 2.2) but the measured range was ms. These values are higher but they are coherent since Maritime pine and European ash (Figure 6c,d), with similar , have similar . This result shows that different MC values in wood lead to different and values, opening a future study for a deeper analysis to find the reason why due to wood internal structure, is higher in wood than in an electrical R for the same resistance value.
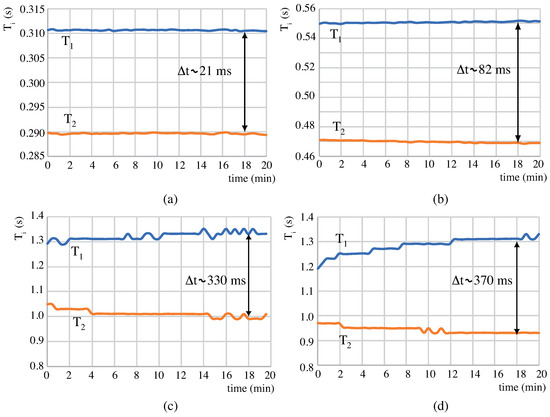
Figure 6.
Experimental results for charge/discharge times , and its associated for: (a) Douglas-fir, (b) Sweet chestnut, (c) Maritime pine, (d) European ash.
4.3. Steady-State Measurement Analysis
In this section, wood electrical resistance measurements after the initial transient are presented to show how the proposed circuit can detect resistance variations produced by small variations on environmental conditions (mainly temperature and relative humidity). This analysis does not pretend to perform a thermal or environmental humidity study but to show that the proposed circuit can detect the variations that these parameters instantaneously produce on the wood, varying its electrical resistance. Moreover, it is also verified that, under similar ambient conditions of temperature and relative humidity, the value of the wood electrical resistance measured at different time instants with hours of difference between them, practically does not change, showing a good behavior of the measurement method.
For this analysis, only the Maritime pine in two different pieces with the same geometrical dimensions (samples A and B, Table 2) and with different initial conditions were used. Sample A resistance was measured during three days in 15-h cycles with a 9 h rest cycle. In total, three 15-h cycles were performed during 3 consecutive days. Ambient temperature ranged between 24 °C and 26 °C and ambient humidity from 49% RH to 55% RH. Figure 7 shows the measured evolution with the ambient temperature (Figure 7b) and RH (Figure 7a). As it can be seen, the resistance value is almost the same at the beginning of each cycle (4.54 GΩ, 4.51 GΩ, 4.51 GΩ) and the value changes in time following the temperature and RH variations as described in the literature [3,4,8]. Even small changes in environmental conditions (either temperature and/or RH) can be detected by a modification in the value.
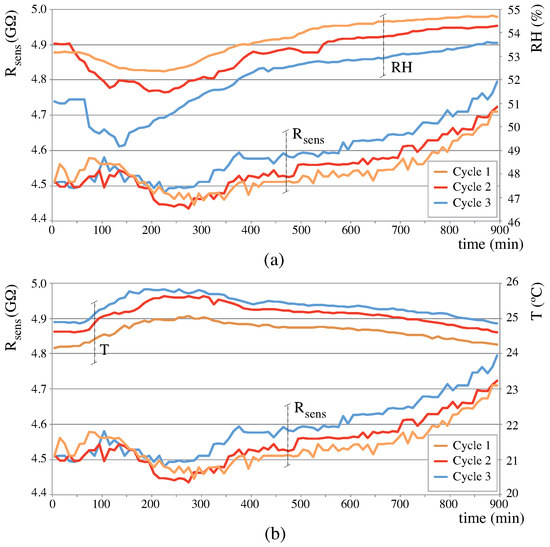
Figure 7.
Resistance value results for Maritime pine-sample A. Three 15-h acquisition cycles at 6 values per hour, with 9-h rest cycle between them. Top: Resistance vs. RH; bottom: Resistance vs. Temperature. Small changes in either temperature or RH are captured by the circuit, impacting on .
The of sample B for the Maritime pine, continuously measured each and every minute during 58 h, was obtained. One week later, a 62-h measurement was also performed. Figure 8 and Figure 9 show measured along with temperature and RH percentage variation for each experiment. In both cases, the value inversely follows the temperature changes, which is a normal behaviour in wood. For this reason, wood MC estimation from resistance value must consider the temperature [3,4,8]. When RH variation is not significant, it can be seen that follows temperature variations as described in the literature. However, when RH variation is more significant, the value is affected (see Figure 8, zones a, b, c).
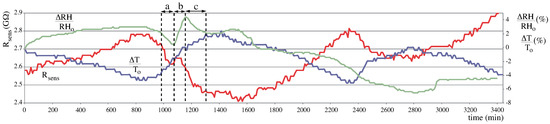
Figure 8.
Steady-state analysis #1. Sample B (Maritime pine) measurements during 58 h. Red: , blue: temperature variation percentage, green: ambient humidity variation percentage.
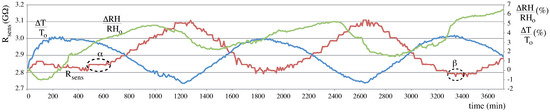
Figure 9.
Steady-state analysis #2. Sample B (Maritime pine) measurements during 62 h. Red: , blue: temperature variation percentage, green: ambient humidity variation percentage.
There are two specific time segments marked as and in Figure 9, with about two hours duration each. They are shown in detail in Figure 10. During these time segments, variation in resistance is almost zero and corresponds to a moment when temperature and RH are converging. Then, the rising temperature is compensated by the RH decrease, resulting in nearly constant value. As a result, we must consider that an increase in RH affects the MC in wood (at least on its surface) and reduces its electrical resistance, which is also consistent with literature.
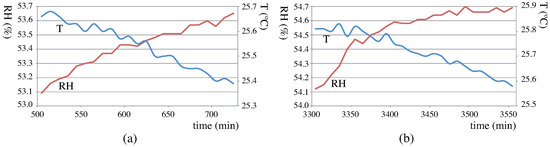
Figure 10.
Time segments (a) and (b) from Figure 9 where variation in resistance is almost zero.
As a final result, the measured was analysed at different moments during the acquisition time but at the same temperature, RH or . Table 3 shows groups of three time instants where at least one of the measured values is constant. As seen, it is clear that the is the same when the same ambient conditions are given, which supports the reliability and repeatability of the method. This result also shows that using the proposed method, the polarization effects in wood resistance measurement are minimized.
Table 3.
Temperature, relative humidity (RH) and wood resistance values for specific time instants in steady-state measurements. The same values for a measure are marked in bold.
5. Conclusions
An experimental study on a novel electrical AC method for resistance measurement was done, proving its ability to minimize the polarization effects present when traditional DC-resistance measurement methods are used. Experimental results proved that the deviation in the measured values is, from its initial value, lower than 5% with the proposed AC method, while the DC method shows a deviation near to 10%. It is important to note that, for certain wood species (Sweet chestnut and Douglas-fir, in this case), deviation goes below 0.2% using the proposed AC method, on the other hand 10% and 7% deviation is obtained using the DC method (Figure 5a,b).
Moreover, after the initial transient, experimental results show the excellent repeatability of the method in steady-state conditions, with the same resistance value for the same enviromental conditions (see Table 3) along time. This result clearly shows that polarization/depolarization effects do not affect the measured value using the proposed method, which was an important issue in case of DC measurement methods.
An important result obtained in the analysis concerns the difference in charging and discharging times ( and ), directly related to the wood conditions and species, that is, physical and chemical properties of the wood. Despite the total period is constant for a certain value, the charging and discharging time varies. This effect can be associated to the internal wood structure properties, which are able to charge faster than discharge or vice versa. A future study to analyse and settle the relation between , and associated wood species, its resistance and MC must be done.
It can be concluded that the proposed AC method effectively reduces the transient response in DC wood electrical resistance measurement. Currently, many of the resistance-based commercial MC instruments for wood use DC methods, leading to inaccuracies and instabilities, which could be imporved by using the AC proposed method. The proposed method is based on a simple, yet effective, relaxation oscillator which automatically tunes its frequency depending on the wood equivalent resistance, avoiding the previous study needed in other AC measurement methods [21]. This is a novel proposal not used before in the field of electrical resistance measurement in wood.
Author Contributions
Conceptualization, S.C.B.; Data curation, S.C.B., R.G.-G. and A.E.N.A.; Formal analysis, S.C.B., R.G.-G., A.E.N.A. and A.R.M.; Investigation, S.C.B., R.G.-G. and A.E.N.A.; Supervision, R.G.-G., A.E.N.A. and A.R.M.; Validation, S.C.B., R.G.-G. and A.R.M.; Writing and original draft, S.C.B., R.G.-G., A.E.N.A. and A.R.M.; Writing, review and editing, S.C.B., R.G.-G., A.E.N.A. and A.R.M.
Funding
This research received no external funding.
Conflicts of Interest
The authors declare no conflict of interest.
References
- Mvondo, R.R.N.; Meukam, P.; Jeong, J.; Meneses, D.D.S.; Nkeng, E.G. Influence of water content on the mechanical and chemical properties of tropical wood species. Results Phys. 2017, 7, 2096–2103. [Google Scholar] [CrossRef]
- Kirker, G.T.; Bishell, A.B.; Zelinka, S.L. Electrical properties of wood colonized by Gloeophyllum trabeum. Int. Biodeterior. Biodegrad. 2016, 114, 110–115. [Google Scholar] [CrossRef]
- Ross, R.J. Wood Handbook: Wood as An Engineering Material; U.S.D.A. Forest Service Research Paper FPL, 245; Forest Products Laboratory, United States Department of Agriculture, Forest Service: Madison, WI, USA, 2010.
- James, W.L. Dielectric Properties of Wood and Hardboard: Variation with Temperature, Frequency, Moisture Content, and Grain Orientation; General Technical Report FPL-GTR-190; Forest Products Laboratory, United States Department of Agriculture Forest Service: Madison, WI, USA, 1975.
- Schmidt, O. Wood and Tree Fungi. Biology, Damage, Protection, and Use; Springer: Berlin/Heidelberg, Germany, 2006. [Google Scholar]
- Dietsch, P.; Franke, S.; Franke, B.; Gamper, A.; Winter, S. Methods to determine wood moisture content and their applicability in monitoring concepts. J. Civil Struct. Health Monit. 2015, 5, 115–127. [Google Scholar] [CrossRef]
- EN13183-1:2002. Moisture Content of a Piece of Sawn Timber—Part 1: Determination by Oven Dry Method; European Committee for Standardization CEN: Brussels, Belgium, 2002. [Google Scholar]
- Stamm, A.J. The Electrical Resistance of Wood as a Measure of Its Moisture Content. Ind. Eng. Chem. 1927, 19, 1021–1025. [Google Scholar] [CrossRef]
- Brischke, C.; Lampen, S.C. Resistance based moisture content measurements on native, modified and preservative treated wood. Eur. J. Wood Wood Prod. 2014, 72, 289–292. [Google Scholar] [CrossRef]
- Casans, S.; Rosado-Munoz, A.; Iakymchuk, T. Novel Resistance Measurement Method: Analysis of Accuracy and Thermal Dependence with Applications in Fiber Materials. Sensors 2016, 16, 2129. [Google Scholar] [CrossRef] [PubMed]
- Casans, S.; Iakymchuk, T.; Rosado-Muñoz, A. High resistance measurement circuit for fiber materials: Application to moisture content estimation. Measurement 2018, 119, 167–174. [Google Scholar] [CrossRef]
- Moron, C.; Garcia-Fuentevilla, L.; Garcia, A.; Moron, A. Measurement of Moisture in Wood for Application in the Restoration of Old Buildings. Sensors 2016, 16, 697. [Google Scholar] [CrossRef] [PubMed]
- Johansson, J.; Hagman, O.; Fjellner, B.A. Predicting moisture content and density distribution of Scots pine by microwave scanning of sawn timber. J. Wood Sci. 2003, 49, 312–316. [Google Scholar] [CrossRef]
- Wang, J.; Mukhopadhyaya, P.; Morris, P.I. Sorption and capillary condensation in wood and the moisture content of red pine. J. Build. Phys. 2014, 37, 327–347. [Google Scholar] [CrossRef]
- Tamme, V.; Muiste, P.; Kask, R.; Padari, A.; Tamme, H. Experimental study of electrode effects of resistance type electrodes for monitoring wood drying process above fibre saturation point. For. Stud. 2012, 56, 42–55. [Google Scholar]
- Tamme, V.; Muiste, P.; Tamme, H. Experimental study of resistance type wood moisture sensors for monitoring wood drying process above fibre saturation point. For. Stud. 2013, 59, 28–44. [Google Scholar]
- Fernandez-Golfin, J.I.; Conde, M.; Conde, M.; Fernandez-Golfin, J.J.; Calvo, R.; Baonza, M.V.; de Palacios y Palacios, P. Curves for the estimation of the moisture content of ten hardwoods by means of electrical resistance measurements. For. Syst. 2012, 21, 121–127. [Google Scholar] [CrossRef]
- EN13183-2. Moisture Content of a Piece of Sawn Timber—Part 2: Estimation by Electrical Resistance Method; European Committee for Standardization CEN: Brussels, Belgium, 2002. [Google Scholar]
- EN16682. Conservation of Cultural Heritage—Methods of Measurement of Moisture Content or Water Content, in Materials Constituting Immovable Cultural Heritage; European Committee for Standardization CEN: Brussels, Belgium, 2017. [Google Scholar]
- Forsen, H.; Tarvainen, V. Accuracy and functionality of hand held wood moisture content meters. In VTT Publication; VTT Technical Research Centre of Finland: Espoo, Finland, 2000; pp. 79–17. [Google Scholar]
- Dai, G.; Ahmet, K. Long-term monitoring of timber moisture content below the fiber saturation point using wood resistance sensors. For. Prod. J. 2001, 51, 52–58. [Google Scholar]
- Gao, S.; Bao, Z.; Wang, L.; Yue, X. Comparison of voltammetry and digital bridge methods for electrical resistance measurements in wood. Comput. Electron. Agric. 2018, 145, 161–168. [Google Scholar] [CrossRef]
© 2019 by the authors. Licensee MDPI, Basel, Switzerland. This article is an open access article distributed under the terms and conditions of the Creative Commons Attribution (CC BY) license (http://creativecommons.org/licenses/by/4.0/).