Abstract
Mobile authentication is crucial for device security; however, conventional techniques such as PINs and swipe patterns are susceptible to social engineering attacks. This work explores the integration of touch stroke analysis and Explainable AI (xAI) to address these vulnerabilities. Unlike static methods that require intervention at specific intervals, continuous authentication offers dynamic security by utilizing distinct user touch dynamics. This study aggregates touch stroke data from 150 participants to create comprehensive user profiles, incorporating novel biometric features such as mid-stroke pressure and mid-stroke area. These profiles are analyzed using machine learning methods, where the Random Tree classifier achieved the highest accuracy of 97.07%. To enhance interpretability and user trust, xAI methods such as SHAP and LIME are employed to provide transparency into the models’ decision-making processes, demonstrating how integrating touch stroke dynamics with xAI produces a visible, trustworthy, and continuous authentication system.
1. Introduction
Traditional security techniques are gradually being replaced by dynamic, transparent, and user-centric continuous authentication technologies. Unlike static authentication methods which require user participation at specific times, continuous authentication employs human behavior as a persistent token. This approach reduces user burden by passively collecting sensory data and cross-referencing signals with known behavior, thereby closing the vulnerability window inherent to static methods [1].
Authentication remains a crucial component of network security, protecting against unauthorized access [2]. However, standard entry-point methods provide only partial assurance for mobile devices. Continuous authentication enhances this by combining motion-based biometrics with classifiers, a technique shown to achieve an Equal Error Rate (EER) as low as 4.66% [3]. By generating and continuously improving a user profile based on touch dynamics [4], machine learning algorithms can detect fraudulent behavior while accommodating regular shifts in user interaction.
A major barrier to the wider adoption of these systems is the “black-box” nature of many machine learning models, particularly in sectors requiring high transparency. The opacity of decision-making can erode user trust, as users may feel alienated by inexplicable access rejections. Consequently, there is a pressing need to incorporate Explainable AI (xAI) to demystify these operations. By revealing the layers of AI decision-making, xAI fosters transparency and accountability, ensuring users understand the security measures protecting their digital identities.
Studying xAI in the context of continuous authentication is increasingly critical as the demand for accountability in AI decision-making grows [5]. As continuous authentication systems mature, their integration into the broader ecosystem of user security becomes increasingly important. Previous surveys [6] underscore the vital significance of continuous authentication using behavioral biometrics from mobile sensors, highlighting the interconnectedness of user experience, privacy, and security.
Despite advances in touch characteristics, a lack of interpretability limits the adoption and refinement of these systems. Consequently, this paper proposes and evaluates a comprehensive xAI framework to bridge this gap, utilizing a One-Versus-Rest (OVR) technique for scalability and applying SHAP and LIME for global and local interpretability. This approach enables not only high accuracy but also auditable transparency, offering a user-friendly continuous authentication system that balances robust security with the clarity required by users and regulators.
2. Background and Motivation
The fundamental algorithms of many contemporary security frameworks, particularly those offering continuous authentication, are often opaque. While these systems offer dynamic security, the lack of transparency regarding crucial decision-making processes can significantly erode user trust. Even during authorized usage, users may feel alienated or face unfair access hurdles when confronted with inexplicable notifications or access rejections. Consequently, to ensure the system’s actions are transparent and justified, it is imperative to incorporate user profiles found on superior behavioral attributes [7].
However, a trade-off often exists between accuracy and interpretability. Complex models, such as Extreme Gradient Boosting (XGBoost), may offer higher accuracy but are harder to decipher compared to simpler models like Decision Trees. The need to demystify these operations has led to the integration of Explainable AI (xAI) into continuous authentication. The primary goal of xAI is to reveal the layers of AI decision-making, allowing the average human to understand procedures that might otherwise be misconstrued by an opaque system.
Relevant earlier research offers fundamental knowledge for applying xAI to biometric security. For instance, there are parallels between interpreting complex models in biometric authentication and applying explainable machine learning in credit risk management [8]. Techniques such as Anchors, utilized to increase transparency in credit scoring, serve as a precedent for improving understandability in authentication systems [9].
In the context of touch dynamics, the analysis benefits from models employing Local Interpretable Model-Agnostic Explanations (LIME) to produce human-readable explanations [10]. This study assesses effective methods for providing succinct explanations in touch stroke analysis by leveraging established strategies like LIME and SHAP (SHapley Additive exPlanations). These techniques are crucial in settings with limited local behavioral data, where authentication techniques may differ significantly from standard applications.
Previous touch stroke authentication systems [11,12,13,14,15,16] primarily relied on basic features, such as starting and stopping coordinates (StartX, StartY, StopX, StopY) and simple motion dynamics like trajectory length and average velocity. While these provided a straightforward analysis sufficient for early research, they lacked depth. Subsequent systems expanded on these basics through feature engineering, incorporating advanced motion metrics like pairwise velocity at specific intervals (e.g., PairwiseVelocity50) and temporal features such as stroke duration and inter-stroke time. A few studies also incorporated acceleration metrics to offer a more sophisticated view of speed changes.
However, the application of these advanced features has been inconsistent across systems. This study builds upon this foundation by introducing a comprehensive and sophisticated set of features designed to capture the nuances of user interaction:
- Deviation Metrics: Features such as maximum deviation and deviation percentage (e.g., Deviation50) are introduced to capture variations in stroke trajectories with higher precision.
- Pressure and Area Metrics: Uniquely, this system integrates features like mid-stroke pressure and mid-stroke area to analyze force and contact dynamics.
- Novel Motion Metrics: Notably, the system includes novel features absent in prior work, such as mid-stroke velocity and time-to-maximum velocity.
These advanced metrics provide crucial insights into individual touch patterns, making the system more robust and adaptable to diverse user behaviors compared to previous approaches.
This paper aims to transform digital security by innovatively integrating xAI with this advanced touch stroke analysis. The primary objective is to ascertain the viability of this integration, ensuring that transparency does not compromise the effectiveness or security of the authentication procedure.
The foundation of this integration is the premise that inclusive, transparent security is preferable to “mysterious” security. By placing the user at the center of the ecosystem, this system addresses two fundamental issues:
- Trust and Transparency: Informing users about the security measures protecting their online identities reassures them that their digital persona is secure.
- Actionable Feedback: The system provides an interface that communicates authentication status and security decisions in an easy-to-comprehend manner. Through understanding how their behavior impacts security evaluations, users can modify their interactions to decrease false positives and expedite the authentication procedure.
To achieve these objectives, a multidisciplinary strategy involving behavioral science, cybersecurity, AI, and UX design is essential. Additionally, this work contributes an extensive and thorough dataset, setting the stage for further investigations. This dataset allows researchers to test novel theories, analyze various aspects of user behavior, and create adaptive authentication systems that meet changing security requirements.
To differentiate this work from existing touch-dynamics studies, we introduce three specific contributions: (1) Novel Feature Integration: The inclusion of ‘MidStrokePressure’ and ‘MidStrokeArea’ alongside standard kinematic features to capture force-based behavioral nuances often overlooked in trajectory-only models. (2) Formalized xAI Pipeline: Unlike studies that apply xAI post hoc, we integrate SHAP and LIME directly into the validation loop to audit feature stability. (3) Hybrid Interaction Tasks: The dataset captures both passive (scrolling) and active (cognitive questionnaire) touch behaviors to ensure model robustness across varying cognitive loads.
3. Methodology
This research is strategically designed to pioneer advancements in digital security by integrating Explainable AI (xAI) with touch stroke analysis to establish a seamless continuous authentication system. The framework aims to continuously examine user interactions in real-time without intrusion. To achieve this, it is imperative to capture subtle patterns of user behavior, such as touch pressure, swipe speed, and gesture dynamics during the foundational stage.
As illustrated in Figure 1, the process initiates with the “Start” phase every time a user logs into the mobile application. The system immediately begins gathering raw touch stroke data, recording specific interaction metrics including speed, pressure, angle, and stroke duration.
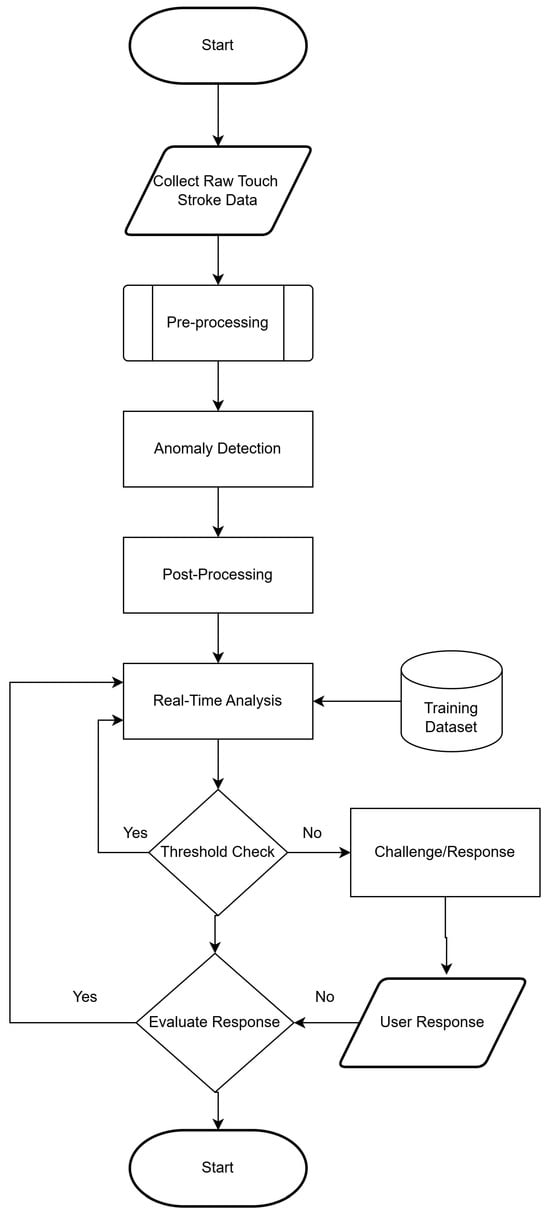
Figure 1.
Flowchart of Continuous Authentication System.
The design of this data collection framework is informed by recent advancements in the field. The necessity for flexible security solutions that account for the subtleties of mobile user behaviors has been highlighted in studies on behavioral biometrics in mobile banking [17]. Furthermore, utilizing diverse data points is supported by architectures that combine behavioral biometrics with spatial data to strengthen security [18]. In particular, deep learning techniques have shown significant promise in analyzing gesture-signature correlations for identity verification [19]. Practical applications using binary classification with neural networks on simpler features (e.g., click length, screen ID) have also demonstrated impressive performance with minimal disruption to user actions [20].
Following data collection, the system enters the pre-processing stage as depicted in Figure 2. This step is essential for sanitizing raw data to ensure consistency, eliminating noise, and formatting it for the machine learning models. The pre-processing pipeline consists of four key steps:
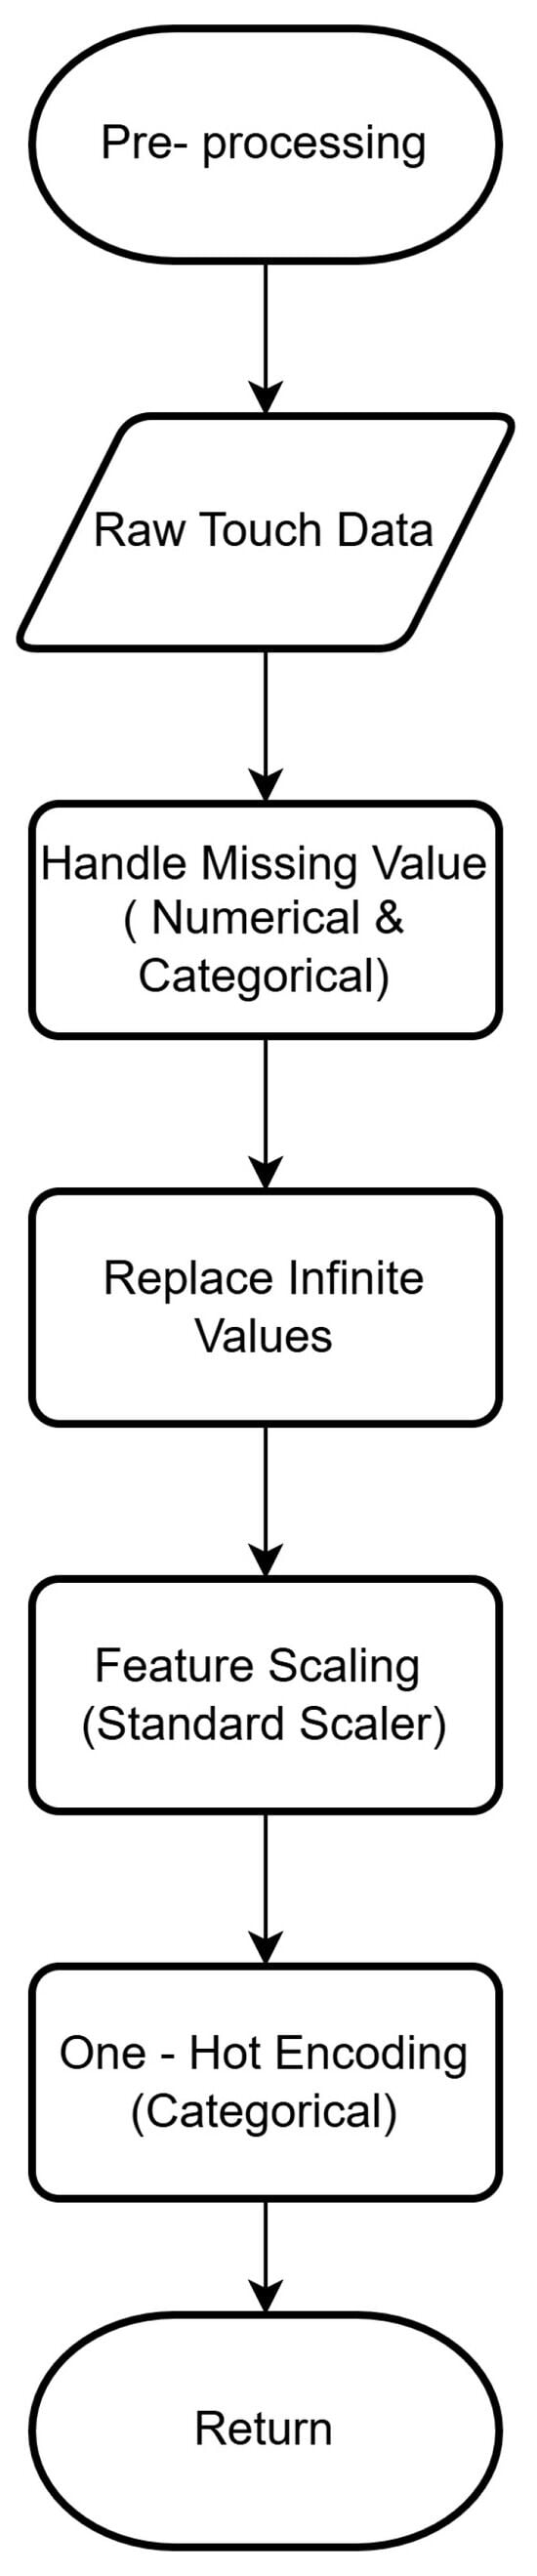
Figure 2.
Flowchart of Pre-Processing of Continuous Authentication System.
- Handling Missing Values: The system first identifies missing values in both numerical and categorical data. Imputation techniques are employed to fill these gaps based on other data points, preventing negative impacts on model performance.
- Sanitization: Infinite values, which can disrupt data processing, are detected and replaced with finite numbers to maintain dataset integrity.
- Feature Scaling: A standard scaler approach is applied to numerical features. This standardizes the data range to have a mean of zero and a standard deviation of one, which enhances the convergence and performance of the algorithms.
- One-Hot Encoding: Categorical variables are transformed using one-hot encoding. This creates binary columns for each category, effectively converting categorical attributes into a numerical format suitable for predictive modeling.
Once these steps are complete, the clean, well-structured data is passed to the core analysis phase.
The core analysis employs a One-Class Support Vector Machine (SVM) for anomaly detection. This model is trained to recognize the specific touch stroke patterns of the authenticated user. Unlike systems requiring a set of “impostor” data, this model interprets any notable departure from the authorized user’s pattern as a potential security breach.
In the post-processing stage, the system evaluates whether a flagged deviation is a genuine abnormality or a false alarm. The data is then checked against a dynamic threshold in real-time. If the user’s actions remain consistent with their profile, the monitoring process repeats seamlessly.
If an anomaly exceeds the acceptable threshold, the system triggers a Challenge/Response phase. As a security precaution, the user is prompted to re-authenticate, for instance, by re-entering their password.
- Successful Response: If the user provides valid credentials, the system validates the response, closes the challenge loop, and resumes real-time analysis, allowing the user to continue utilizing the application.
- Unsuccessful Response: If the response is unsatisfactory, the system redirects the user to the sign-in page.
Ultimately, if authentication attempts fail repeatedly, the session terminates (End Phase), locking out the user. This endpoint ensures system security by granting access only to authenticated users and rejecting interactions that cannot be reconciled with acceptable behavioral profiles.
3.1. Building the Application
A mobile app called “Newsapp” was developed to simulate a realistic mobile environment, ensuring that the touch data collected reflects natural user behavior. The application flow is divided into three primary phases: Session Initiation, Data Collection (Tasks), and Security Feedback.
The interaction begins with the login and registration interfaces, which serve as the entry point for the continuous authentication session. Figure 3 illustrates the standard login screen, while Figure 4 depicts the registration interface. Designed with a minimalist user experience (UX), the registration screen captures essential identifiers (i.e., studentid_name@email.com) to map behavioral data to specific user profiles. While these screens function as standard entry points, they effectively mark the start of the “trust session,” initializing the background monitoring service that tracks touch latencies and typing cadence during credential entry.

Figure 3.
Sign in Page.

Figure 4.
Registration Page.
Figure 5 illustrates the post-authentication, where the user is directed to the main menu. This hub presents four distinct data collection modules: ‘News’, ‘Questionnaire’, ‘News Landscape’, and ‘Touch Stroke Analysis’. Crucially, the authentication system does not pause at this menu; the user interactions including scroll speed, button tap pressure, and the idle time between selections are continuously monitored. This ensures that the transition between tasks is scrutinized, preventing “gap” attacks where an intruder might take control of an unlocked device.
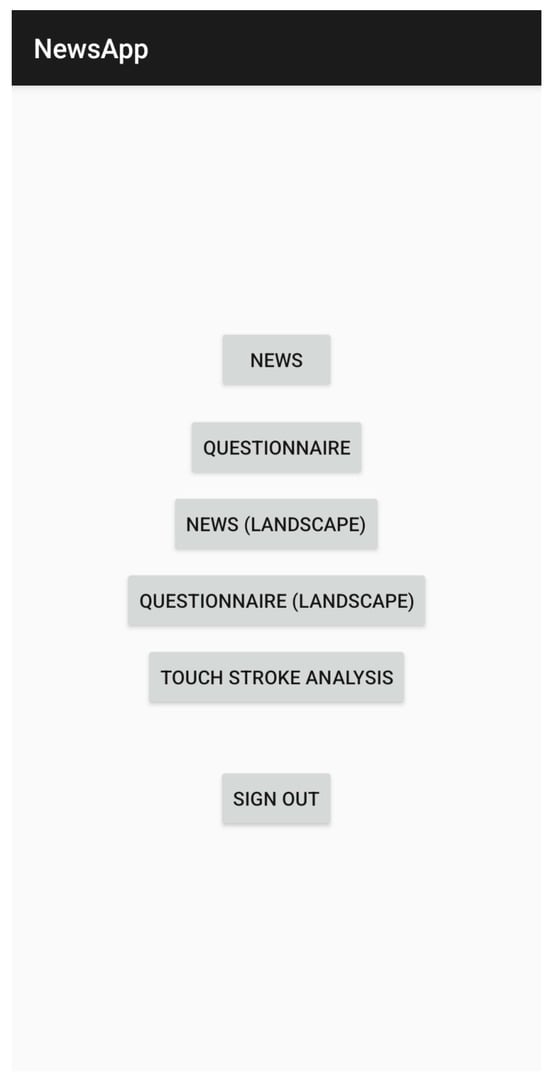
Figure 5.
Main Page.
The core of the dataset is generated through the News Reading modules. Figure 6 (Portrait) and Figure 7 (Landscape) display dynamic content sourced via NewsAPI (e.g., articles from Tom’s Guide and CNBC).

Figure 6.
News Portrait Page (Picture Source: Tom’s Guide).

Figure 7.
News Landscape Page (Picture Source: CNBC News).
- Behavioral Significance: These screens are pivotal as they represent “passive” interaction. As users consume content, the system discreetly captures complex motion data, including vertical scroll trajectories, fling velocities, and micro-movements used to maintain screen position.
- Orientation Variability: The inclusion of the Landscape mode (Figure 7) tests the system’s adaptability. Changing the device orientation alters the user’s grip and thumb reach zones, introducing necessary variance into the dataset to ensure the model is robust against posture changes.
Complementing the passive reading tasks, the Questionnaire modules (Figure 8 and Figure 9) engage the user in “active” cognitive tasks.

Figure 8.
Questionnaire Portrait Page.

Figure 9.
Questionnaire Landscape Page.
- Behavioral Significance: Unlike the repetitive scrolling in the news feed, answering questions requires decisive, precise taps. This module captures data on decision latency (time taken to select an answer) and spatial precision (touch accuracy on radio buttons).
- Data Richness: By forcing users to interact with specific screen regions to select answers, these screens prevent data bias that might occur if a user only ever interacts with the center of the screen during scrolling.
The system employs a dynamic trust threshold. On occasions where the real-time touch stroke patterns deviate significantly from the pre-established user profile, i.e., potentially indicating a change in user or high emotional stress, then the system triggers a security intervention. Figure 10 depicts the Challenge/Response screen. This mechanism ensures the integrity of the session by forcing a re-authentication (e.g., password entry), thereby “resetting” the trust score. This capability highlights the system’s proactive stance on security, prioritizing protection over seamlessness when anomalies are detected.
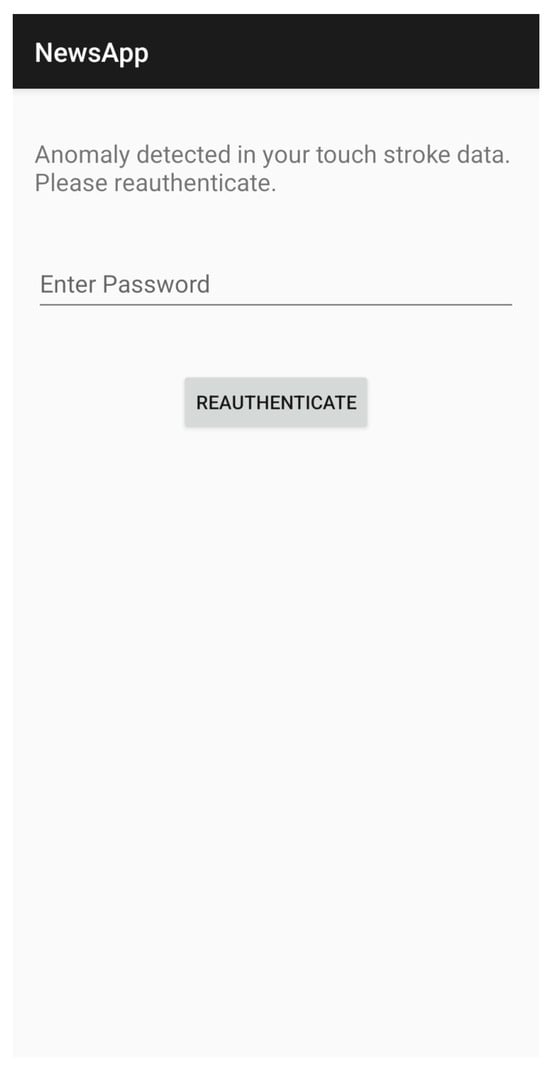
Figure 10.
Challenge/Response Page.
Finally, Figure 11 illustrates the “Touch Stroke Analysis” screen. This interface is critical for the Explainable AI (xAI) component of this research. Rather than simply rejecting a user, the system provides visual feedback regarding the investigation, displaying the ratio of “normal” to “anomalous” points detected.
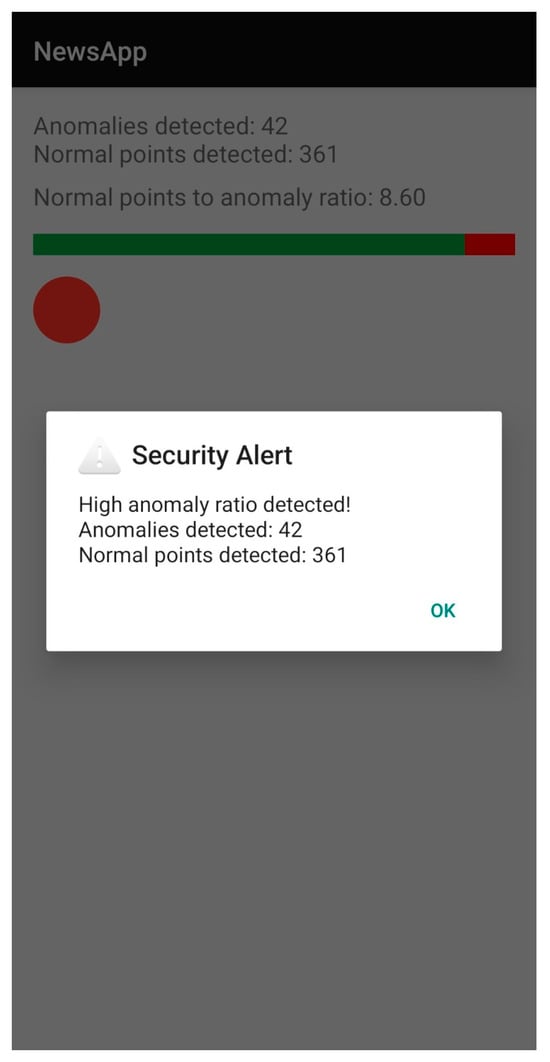
Figure 11.
Touch Stroke Analysis Page (Green Bar indicating Normal Points vs. Red Bar indicating Anomalies).
- User Trust: By revealing the “why” behind a security alert (e.g., a high anomaly ratio), this screen fosters trust. It transforms the authentication process from a black-box operation into a transparent interaction, helping users understand how their behavior influences their security status.
Collectively, these interfaces represent a holistic ecosystem for continuous authentication. The application seamlessly integrates behavioral biometrics into routine digital interactions, including the activities of reading, scrolling, and decision-making, thus, demonstrating that robust identity protection can coexist with a fluid user experience.
3.2. Collect Touch Data
This study was conducted in strict alignment with the ethical principles outlined in the Declaration of Helsinki to ensure the rights, dignity, and welfare of all participants. As the research focused exclusively on the collection of anonymized behavioral data (touch stroke patterns) devoid of personally identifiable information, formal approval from an ethics committee was not deemed necessary under the ethical guidelines of Multimedia University.
The dataset was constructed by collecting touch dynamics data from 150 participants, primarily comprising university students aged between 20 and 55. Participants volunteered to contribute data via Android smartphones, completing four distinct tasks within a custom-built application to ensure a diverse representation of touch interactions. To standardize the process and mitigate fatigue-related inconsistencies, data collection was performed in a single session per participant.
Prior to participation, individuals were provided with detailed information via an electronic consent form embedded in the mobile application. This form explicitly outlined the research purpose, the nature of the data collection, and its intended use. Participation was entirely voluntary, with informed consent obtained by requiring users to explicitly select “Agree” before any data collection commenced. To safeguard privacy, all collected data was immediately anonymized and stored without linkage to personal identifiers, ensuring the integrity and confidentiality of the research process.
To capture the nuances of user behavior, specific attributes were extracted from the raw touch data. Every touch event is assigned a ‘Type’ attribute, which categorizes the interaction stages: when a touch begins, when it is moving, and when it stops. This segmentation is essential for contextual analysis. To facilitate rapid algorithmic evaluations, the ‘Direction’ and ‘DirectionFlag’ features provide a binary simplification of the stroke trajectory, offering an additional descriptor of the movement path.
The spatial dimensions of touch events are captured through the characteristics ‘StartX’, ‘StartY’, ‘StopX’, ‘StopY’, ‘CurrentX’, ‘CurrentY’, ‘X’, and ‘Y’. These coordinates provide the fundamental mapping required to determine the start, stop, and dynamic progression of the touch stroke. Temporally, each event’s ‘Time’ stamp establishes a timeline, which is further decomposed into ‘InterFeatureTime’ and ‘InterStrokeTime’; these metrics provide critical information regarding the pulse and rhythm of user engagement.
The physical characteristics of the stroke are quantified by metrics including ‘StrokeDuration’, ‘EndToEndDistance’, ‘EndToEndDirection’, and variations measured at predetermined stroke lengths. These metrics encompass attributes ranging from execution time to directional intention and control. Furthermore, ‘PairwiseVelocity’ and ‘PairwiseAcceleration’ measured at stroke intervals record changes in momentum and speed, exposing distinct patterns in the user’s interaction style.
Aggregated measurements summarize the motion properties of the stroke. These include ‘MedianVelocity’, ‘AverageVelocity’, and ‘MedianAcceleration’, while directional input is synthesized by ‘AverageDirection’. The complexity and curvature of the touch path are quantified by ‘TrajectoryLength’ and ‘TrajectoryRatio’, while the ‘MRL’ (Mean Resultant Length) indicates the directional consistency throughout the stroke.
Finally, granular insights into user-specific traits are provided by ‘MidStrokePressure’, ‘MidStrokeArea’, and ‘MidStrokeOrientation’. Evaluated at the stroke’s midpoint, these features analyze touch pressure, contact area, and orientation represent the biometric traits that exhibit significant inter-user variability. All extracted features are tabulated in Table 1. Consistent with the study’s ethical framework, all users are anonymously labeled to observe behavioral consistency while ensuring that any information linking data to specific identities has been completely filtered and removed.

Table 1.
Touch Stroke Features Collected.
The final dataset consists of 48,000 qualified touch strokes collected from 150 participants. The distribution is balanced across four tasks: News Reading (Portrait), News Reading (Landscape), Questionnaire (Portrait), and Questionnaire (Landscape), yielding approximately 320 strokes per user. ‘Unqualified’ strokes, defined as those strictly violating screen boundary constraints or lasting < 10 ms, accounted for ~5% of raw input and were filtered prior to feature extraction. The dataset was partitioned into 80% (training/calibration) and 20% (testing/impostor simulation) for model evaluation.
3.3. Data Cleaning and Filtering
One of the most critical steps in processing touch stroke data for continuous authentication is data cleaning and filtering. This stage focuses on removing redundant, noisy, or irrelevant data that could otherwise impair the authentication model’s performance. By applying noise reduction techniques, raw touch stroke signals are smoothed, making the underlying behavioral patterns more distinct and easier for the algorithms to interpret.
Filtering also serves to correct data inaccuracies, such as mislabeled interactions or inaccurate timestamps. Furthermore, touch strokes that deviate significantly from typical user behavior, often the result of inadvertent touches, “ghost touches,” or device faults are identified and removed using outlier detection techniques. By ensuring that the dataset used to train the model accurately depicts real-world user behavior, the system enhances its ability to distinguish between legitimate users and potential intruders.
To accurately analyze stroke validity, it is essential to define the spatial boundaries of the interaction surface. The fundamental parameters of the touch stroke path analysis are governed by screen resolution. As summarized in Table 2, the touchscreen resolution of the mobile device is defined as 700 units wide (X-axis) and 1600 units high (Y-axis) when oriented in Portrait mode. Conversely, in Landscape orientation, these dimensions are reversed, resulting in an X-axis of 1600 units and a Y-axis of 700 units.
Table 2.
Portrait vs. Landscape.
These dimensions act as the hard constraints for validity; any coordinate data falling outside these bounds suggests a hardware error or a data processing anomaly.
In this work, “qualified” touch strokes are defined as significant finger movements that provide sufficient data for biometric analysis. Unlike distinct clicks or taps, a qualified touch stroke is a continuous vector characterized by a specific start position and a stop point, both of which must reside within the screen’s active dimensions.
To visualize and verify these behaviors, trajectory graphs plotting StartX, Start Y, StopX, StopY, CurrentX, and CurrentY were generated using Python 3.13.1 scripts utilizing the Matplotlib 3.10.8 and Pandas 2.3.3 libraries.
Figure 12, Figure 13, Figure 14 and Figure 15 depict the trajectories of qualified stroke paths. These graphical depictions highlight the subtle dynamics of genuine user interaction:
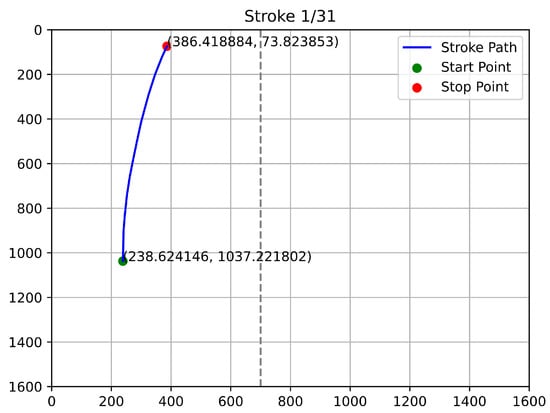
Figure 12.
First Example of Qualified Touch Stroke.
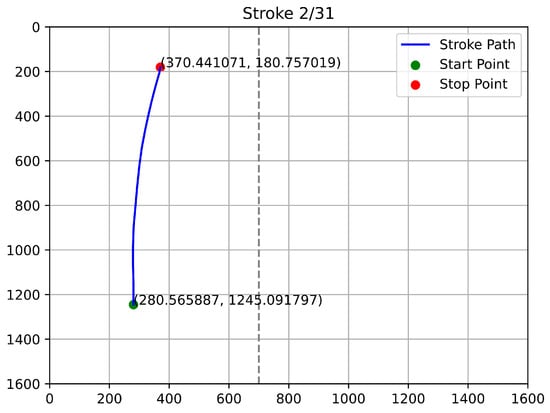
Figure 13.
Second Example of Qualified Touch Stroke.
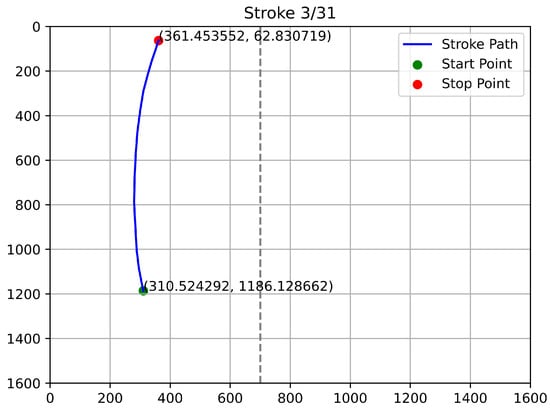
Figure 14.
Third Example of Qualified Touch Stroke.
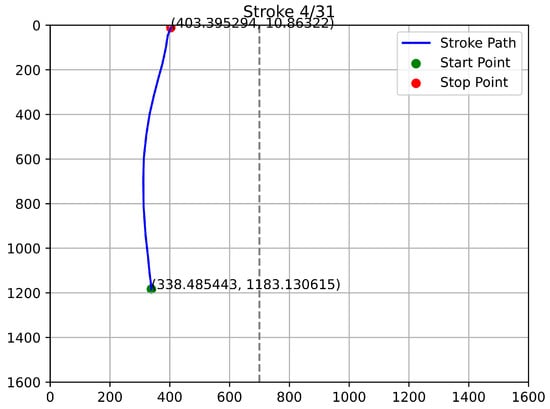
Figure 15.
Fourth Example of Qualified Touch Stroke.
- Continuity: The paths show a smooth, unbroken progression from start to finish.
- Curvature: The trajectories reflect natural biomechanical constraints (the arc of a thumb swipe), rather than robotic straight lines.
- Validity: The start and stop coordinates align with the expected user profile and remain strictly within the device’s resolution boundaries.
This fine-grained path analysis is crucial for creating a baseline of normal user interaction. By recording the exact trajectory and coordinate evolution, the system builds a thorough profile of touch dynamics, strengthening the authentication procedure against replay attacks or robotic inputs.
This study further analyzes “unqualified” touch strokes, defined as interactions that deviate from the established dynamic patterns observed in authenticated sessions. These strokes fail to comply with expected behavioral biometrics and are classified as anomalies or noise. Unqualified strokes typically exhibit atypical starting/stopping points, irregular trajectories, or insufficient duration (e.g., short taps or accidental edge clicks) to be considered a valid stroke.
Figure 16, Figure 17, Figure 18 and Figure 19 provide samples of such unqualified strokes. The analysis highlights several key indicators of invalidity:
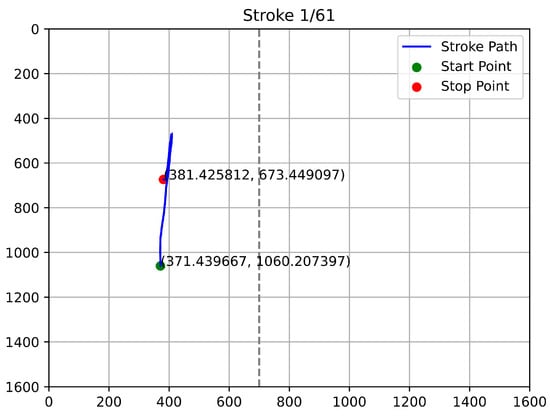
Figure 16.
First Example of Unqualified Touch Stroke.
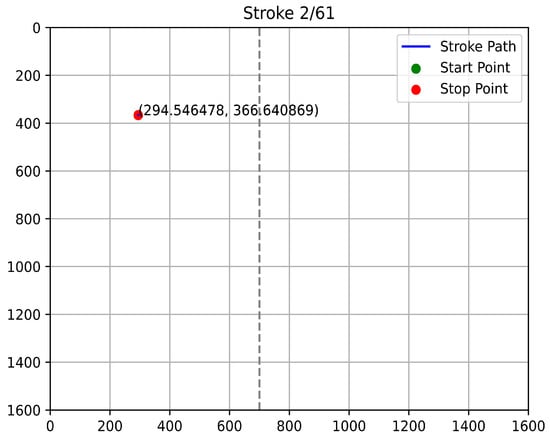
Figure 17.
Second Example of Unqualified Touch Stroke.
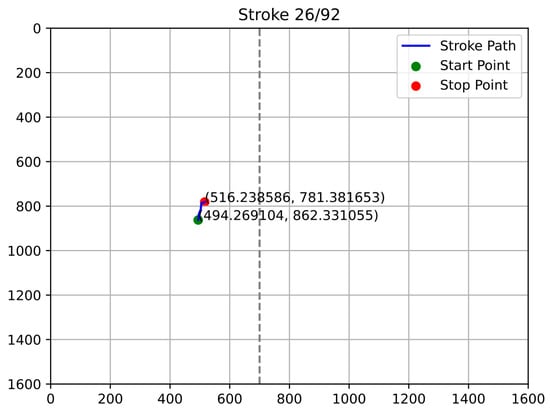
Figure 18.
Third Example of Unqualified Touch Stroke.
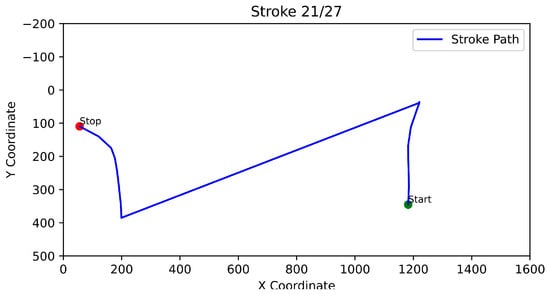
Figure 19.
Fourth Example of Unqualified Touch Stroke.
- Boundary Violations: Strokes that initiate or terminate outside the expected touchscreen boundaries (e.g., beyond the 700-unit width in portrait mode) signify a divergence from qualified behavior. In a legitimate use-case, stop points at unreachable coordinates suggest data corruption or device malfunction.
- Lack of Continuity: As seen in the figures, unqualified paths often fail to display the seamless evolution characteristic of a human swipe. These paths may appear as disjointed dots, erratic jumps, or cut-off lines rather than a fluid motion over the screen.
- Incoherence: The lack of logical trajectory coherence raises concerns regarding the authenticity of the input.
By strictly filtering these unqualified strokes, the system ensures that the authentication algorithms are trained only on high-quality behavioral data. This rigorous qualification standard is vital for developing sophisticated systems capable of accurately distinguishing between authorized users and unauthorized attempts, thereby enhancing the overall security posture of the mobile device.
To ensure the quality of the biometric data, rigorous filtering thresholds were applied based on the device resolution constraints. As defined in Table 2, any stroke containing coordinates where (in Portrait mode) was automatically classified as unqualified and removed. Furthermore, the feature engineering process included derived logic to capture user intent; for example, the ‘DirectionFlag’ was computed to provide a computationally efficient binary descriptor of the stroke’s general orientation, allowing the model to rapidly segregate vertical scrolling from horizontal swiping gestures before detailed kinematic analysis.
3.4. Aggregate Data and User Profiling
Building a robust and representative user profile requires more than isolated data points; it necessitates the systematic aggregation of user data. This process entails compiling touch stroke feature vectors from multiple sessions and diverse interaction contexts to construct a holistic behavioral baseline.
In the context of this study, aggregation involves synthesizing data from the various operational modules of the NewsApp, specifically, combining the passive scrolling dynamics of the News Reading tasks with the active decision-making latencies of the Questionnaire tasks. Furthermore, it integrates data across hardware orientations (Portrait and Landscape). This multi-source aggregation is critical for several reasons:
- Mitigating Behavioral Noise: Individual touch strokes can be noisy due to transient factors like finger moisture or minor distractions. By aggregating data, the system smooths out these anomalies, allowing the underlying “motor signature” of the user to emerge.
- Contextual Robustness: A user’s touch dynamics naturally fluctuate based on situational factors (e.g., time of day, fatigue levels, or physical posture). By incorporating these variances into a single dataset, the resulting profile becomes resilient to benign behavioral shifts, reducing the likelihood of false rejections (False Positive Rate).
- Statistical Significance: Aggregation allows the system to transition from analyzing raw, isolated strokes to evaluating statistically significant trends, such as the consistency of swipe pressure or the variance in inter-stroke timing.
Ultimately, this sophisticated understanding of touch dynamics enables the machine learning classifiers to define a precise boundary between the legitimate user and potential impostors. By analyzing the aggregate behavior rather than isolated incidents, the system ensures that the continuous authentication mechanism is both reliable and adaptable to the user’s natural behavioral evolution.
3.5. Feature Engineering and Transformation
Feature engineering is a critical phase in the machine learning pipeline, serving as the bridge between raw, unstructured sensor data and the predictive models used for verification. This process involves transforming raw touch signals into structured feature vectors that efficiently represent underlying user behavior patterns. By extracting statistical aspects, such as average pressure, speed, and duration alongside temporal and spatial patterns, we convert intricate touch interactions into a format interpretable by algorithms. Effective feature engineering dramatically raises authentication accuracy by boosting the model’s capacity to recognize minute, user-specific variations that raw coordinates alone cannot reveal.
As detailed in the dataset, the extracted features are categorized to capture the complexity of user interaction data. Table 3 provides a comprehensive list of these engineered variables.
Table 3.
Features Engineered.
The foundation of the feature set relies on spatial anchors: “StartX,” “StartY,” “StopX,” and “StopY”. These variables define the geometric boundaries of a stroke. From these coordinates, derived metrics such as “EndToEndDistance” are calculated to quantify the direct Euclidean distance traveled during a touch interaction. Complementing the spatial dimension are temporal features that capture the distinct cadence or “rhythm” of user interaction. Variables such as ‘InterFeatureTime’, ‘InterStrokeTime’, and ‘StrokeDuration’ quantify the timing intricacies, such as the latency between distinct actions or the speed of a specific gesture.
To capture the motor control characteristics of the user, the study leverages kinematic metrics. Features such as “PairwiseVelocity50,” “PairwiseVelocity80,” “MedianAcceleration,” and “PairwiseAcceleration” provide a granular view of how quickly a stroke is executed and how momentum shifts during the movement. Unlike simple average speed, measuring velocity at specific stroke percentiles (e.g., at 50% or 80% of the stroke) reveals the unique acceleration profile of a user’s finger, which is difficult for impostors to mimic. Variations in these values serve as critical indicators of a departure from typical behavior, raising immediate security alerts.
The dataset further explores the subtleties of stroke geometry. Characteristics like ‘MaxDeviation’ and ‘Deviation50’ evaluate the linearity of a swipe by quantifying how much the path deviates from a straight line between the start and stop points. These metrics reveal unique interaction patterns, such as the tendency to arc a swipe due to thumb length or handedness. To add depth, directional markers like ‘AverageDirection’ and various ‘EndToEndDirection’ flags classify strokes according to their orientation, helping to distinguish between vertical scrolls, horizontal swipes, and diagonal gestures.
Tangible elements of user interaction are captured through ‘MidStrokePressure’ and ‘MidStrokeArea’. These features, recorded at the stroke’s midpoint, offer insight into the physical force applied and the surface area of the finger in contact with the screen. These biometric traits are highly individualistic and remain relatively consistent for legitimate users while varying significantly for different individuals.
Finally, to place individual stroke events into a broader behavioral context, the study computes aggregate features. For key parameters like “StrokeDuration,” “InterStrokeTime,” and “TrajectoryLength,” the system calculates statistical moments including the mean, standard deviation, and extremities (min/max). This yields a thorough statistical summary that smooths out isolated noise and tracks user behavior trends over time. Establishing a continuous authentication system that is robust against minor behavioral fluctuations relies on this broad, aggregated perspective.
By combining these diverse engineering elements, including spatial, temporal, kinematic, and statistical, the proposed model is positioned to exploit the nuances of touch dynamics, ensuring a reliable, unobtrusive, and highly accurate authentication procedure.
3.6. Continuous Authentication Protocol
To address the requirement for a formal logical description, the continuous authentication process is defined as follows. Let represent the -th touch stroke vector. The system computes a Trust Score based on the classifier’s posterior probability .
The decision logic follows a sliding window approach to smooth transient noise:
where is the smoothing factor (set to 0.3). An anomaly is flagged if , where is the dynamic threshold derived from the user’s calibration phase (typically set at the 5th percentile of the training scores). If an anomaly persists for consecutive strokes, the ‘Challenge/Response’ mechanism is triggered.
4. Experimental Results
The machine learning pipeline for this study was constructed using the KNIME Analytics Platform [21,22,23], as illustrated in Figure 20. The design of this workflow draws upon several key methodological studies to ensure robustness. For instance, the strategy for handling incomplete datasets, specifically the interpolation of missing values, was adapted from techniques originally applied to environmental data processing. Although this study focuses on specific classifiers, the investigation of ensemble learning within KNIME provided critical insights into advanced analytical techniques and model stacking [24].
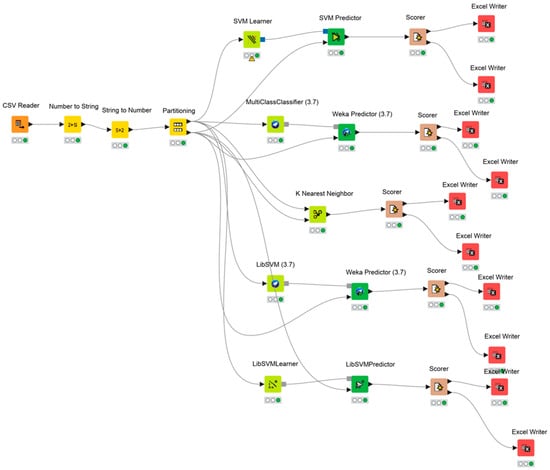
Figure 20.
KNIME Workflow.
The necessity of a rigorous, end-to-end machine learning pipeline, from data ingestion to prediction follows the structural precedents set by predictive modeling frameworks in healthcare. Finally, to guarantee data plausibility and system stability, validation methods were integrated into the continuous authentication system as recommended by established protocols for checking data integrity.
As emphasized in recent overviews of interpretability strategies for AI, understanding the dichotomy between “black-box” and “white-box” models is crucial when designing continuous authentication systems [25].
In this context, a “black-box” model typically processes data, such as intricate touch movements or keystrokes by using complex, non-linear algorithms while obscuring its internal decision-making mechanics. While often highly accurate, this opacity presents significant challenges when attempting to defend authentication decisions in delicate security settings. Conversely, a fully transparent “white box” approach enables administrators to observe and comprehend exactly how input data influences specific authentication decisions. Trust and accountability in security systems depend heavily on this kind of transparency, which renders every decision made by the model explicable and verifiable.
To identify the optimal classifier, a variety of machine learning algorithms were rigorously evaluated to determine which best fits the high-dimensional characteristics of touch stroke data and the real-time demands of authentication.
The dataset was partitioned using a standard protocol to ensure a fair evaluation:
- Training Set (80%): Used to teach the models the underlying patterns of legitimate user behavior.
- Testing Set (20%): Reserved for validating the models on unseen data.
Additionally, cross-validation was performed to minimize selection bias and provide a robust assessment of model performance. The evaluation prioritized models capable of handling complex data structures, such as Neural Networks, Support Vector Machines (SVMs), and Random Trees. The selection criteria extended beyond raw accuracy to include variables such as available computational resources, training time, and algorithmic complexity.
Table 4 presents the accuracy results for each learner evaluated within the KNIME workflow.
Table 4.
Model Accuracy for Different Learners Evaluated within KNIME Workflow.
4.1. Support Vector Machines (SVM) Learner
As detailed in Table 5, the Support Vector Machine (SVM) learning technique was implemented using the LibSVM framework to classify continuous authentication sessions based on touch stroke dynamics. The classifier was configured as a C-SVC type, a standard formulation for multi-class classification problems.
Table 5.
SVM Learner Node Parameter Settings.
To align with the dataset’s structure, the hyperparameter settings were carefully selected to establish a reliable baseline. A polynomial kernel was utilized with specific tuning parameters: a power of 1.0, bias of 1.0, and gamma of 1.0. Notably, setting the power to 1.0 effectively configures the model to assume a linear separability within the high-dimensional feature space. Additionally, an overlapping penalty (C) of 1.0 was applied to balance the trade-off between maximizing the margin and minimizing the classification error. These parameters were chosen based on standard practices in touch dynamics research and preliminary observations of the feature behavior.
The empirical evaluation of the SVM model yielded a classification accuracy of 78.9%. While this establishes a functional baseline, it confirms the model’s general efficacy in differentiating between user classes. A further reliability measure, Cohen’s kappa, was calculated at 0.7833. This value confirms that the model’s complexity is suitable for the data structure and highlights substantial agreement between the anticipated and actual classifications, exceeding what would be expected by random chance.
The model’s performance is further elucidated by the confusion matrix and derived classification metrics. The SVM demonstrated a strong ability to recognize legitimate touch strokes (Sensitivity) and reject inauthentic ones (Specificity) across the majority of classes. However, an analysis of the F-measure (which balances precision and recall) reveals a discrepancy in performance across different user profiles. This variation suggests that the classifier struggles with diverse class distributions, likely due to feature overlap or inherent class imbalances within the aggregated dataset.
Despite the historical success of SVMs in biometric tasks, the observed accuracy of 78.89% was lower than anticipated compared to ensemble methods like Random Forest. This underperformance suggests that the linear assumption (implied by the Power 1.0 kernel setting) may be insufficient for capturing the complex, non-linear relationships inherent in behavioral touch dynamics.
The results provide a solid foundation for using SVMs in touch-based authentication but highlight the necessity for a cautious, iterative approach to optimization. Future work offers several avenues for enhancement:
- Kernel Experimentation: Moving beyond linear assumptions by experimenting with non-linear kernels, such as the Radial Basis Function (RBF), could better capture the intricate boundaries of user behavior.
- Hyperparameter Tuning: Further exploration of the hyperparameter space, specifically varying the cost parameter (C) and fine-tuning kernel-specific parameters could improve the model’s discriminatory power.
- Feature Selection: Implementing rigorous feature selection techniques to remove redundant metrics could reduce noise and improve the separation margin.
The operational requirements of real-world deployment demand that these optimizations be validated against strict statistical criteria to ensure the model’s resilience in diverse usage scenarios.
4.2. Random Tree
To evaluate the effectiveness of ensemble-like decision logic in a multi-class continuous authentication system, a Random Tree classifier was implemented. This algorithm was selected for its proven efficiency in handling high-dimensional data and its ability to model complex, non-linear decision boundaries without extensive pre-processing.
The hyperparameters utilized in this study, as detailed in Table 6, were chosen to ensure a comprehensive exploration of the dataset’s structure. Specifically, the model was configured with a random width factor of 2.0 and an unlimited tree depth. The random width factor ensures that a diverse subset of features is considered at each split, introducing necessary randomness to decorrelate the trees, while the unlimited depth allows the model to learn highly specific patterns unique to individual users.
Table 6.
Random tree Node Parameter Settings.
The experimental results demonstrate exceptional classification performance. The Random Tree algorithm achieved a compelling accuracy of 97.08%. This high precision suggests that the model successfully captured the unique “motor signatures” of individual users. Furthermore, the Cohen’s kappa of 0.97 indicates a superior degree of agreement between the predicted outcomes and the actual data labels, significantly surpassing what would be expected by chance alone.
The reported metrics delineate a nuanced understanding of the classifier’s capabilities:
- Recall (Sensitivity): The classifier exhibits exemplary recall in most instances, ensuring that legitimate users are correctly identified. However, the data highlights specific instances where recall falls slightly short of the ideal level. These lapses warrant closer investigation, as they may stem from users with highly variable touch behaviors or insufficient training data for those specific classes.
- Precision: The high precision scores indicate a low rate of false alarms, which is critical for user experience.
- Specificity: Crucially, the specificity metric remains consistently high. This reinforces the model’s capacity to accurately reject non-authentic interactions (impostors), which is the primary security requirement for any authentication system.
Based on these results, the Random Tree classifier proves to be a powerful technique for touch stroke-based continuous authentication. The high accuracy validates the hypothesis that touch dynamics contain sufficient entropy to distinguish users uniquely. To align with standard authentication benchmarks, we evaluated the models using False Acceptance Rate (FAR) and False Rejection Rate (FRR). The Random Tree model demonstrated robust security with a specificity of over 99%, implying a minimal FAR critical for preventing impostor access. Regarding deployment feasibility, preliminary tests indicate the inference time for the Random Tree model on a standard mid-range mobile processor is negligible (<20 ms per stroke) with a memory footprint under 5 MB, confirming its suitability for real-time mobile integration.
However, the configuration of unlimited tree depth presents a potential risk of overfitting. While it maximizes performance on the testing set, it may reduce the model’s ability to generalize to new, unseen gestures or slightly different contexts (e.g., walking vs. sitting while navigating with the mobile device). To ensure practical dependability, the following steps were performed:
- Pruning and Regularization: Future iterations should explore systematic hyperparameter tuning, such as limiting tree depth or applying post-pruning techniques, to balance bias and variance.
- Adversarial Resilience: Future studies should focus on ensuring the classifier is resilient against hostile cases, such as “mimicry attacks” where an impostor attempts to replicate a target’s swipe patterns.
- Advanced Ensembles: While the single Random Tree performs well, comparing it against robust ensemble methods like Random Forests or Gradient Boosting (XGBoost) could yield further improvements in stability and generalizability across diverse user demographics.
4.3. -Nearest Neighbors (KNN)
The -Nearest Neighbors (-NN) classifier was selected for its simplicity and effectiveness in non-parametric classification tasks, making it a standard benchmark for high-dimensional datasets like touch stroke dynamics. As detailed in Table 7, the model was configured with the number of neighbors () set to 5. To improve discriminative ability, distance-based weighting was enabled, ensuring that closer neighbors influence the prediction more heavily than distant ones. These settings provided a balanced starting point for evaluation, aiming to mitigate the impact of noise on touch data.
Table 7.
-Nearest Neighbor Node Parameter Settings.
The model’s performance was rigorously examined to determine its viability for continuous authentication. As summarized in the results, the -NN method achieved a classification accuracy of 57.14% and a Cohen’s kappa of 0.56. While these results indicate a moderate degree of agreement well above chance levels, the performance is notably lower than the tree-based and SVM models previously discussed.
Upon closer inspection of the confusion matrix and detailed metrics:
- Recall (Sensitivity): The recall measure, which indicates how well the algorithm detects positive instances (legitimate users), exhibits significant inconsistency, ranging from low to high across different classes. This variability suggests that the model’s sensitivity is highly dependent on the distinctiveness of a specific user’s touch behavior.
- Precision: Precision similarly fluctuates, which impacts the composite F-measure. This indicates that for certain users, the model struggles to distinguish between their strokes and those of similar users in the dataset.
- Specificity: Crucially, the model demonstrates consistently high specificity (True Negative Rate) across most classes. In the context of high-security authentication, this is a valuable trait, as it implies the model is effective at rejecting impostors, even if it struggles to consistently recognize the owner.
The multiple instances of low recall are a cause for concern, as they translate to a high False Rejection Rate (FRR), which would disrupt the user experience by forcing frequent re-authentications. The underperformance of -NN in this context is likely attributed to the “curse of dimensionality”, where distance-based metrics become less effective as the number of feature dimensions increases.
However, the outcomes support the potential of -NN in behavioral biometrics if proper optimization is applied. Future research should address the observed discrepancies through the following strategies:
- Hyperparameter Tuning: Experimenting with different values of (e.g., for tighter clusters or for smoother decision boundaries) could enhance sensitivity.
- Distance Metrics: Testing alternative distance metrics, such as Manhattan or Cosine similarity, may yield better results than Euclidean distance, particularly for high-dimensional feature vectors.
- Class Imbalance Handling: Incorporating techniques such as synthetic oversampling (SMOTE) or weighted voting could address the discrepancies in recall and precision caused by class imbalances.
- Feature Selection: Reducing the feature space to the most discriminative variables would likely improve the performance of the distance-based algorithm.
By implementing these validation procedures and optimization strategies, future iterations of the -NN classifier could achieve the robustness required for real-world security applications.
4.4. LiBSVM Learner
The LibSVM implementation was selected for this study due to its robust framework and widespread adoption in classification tasks involving high-dimensional datasets. To evaluate its efficacy in continuous authentication, two distinct configurations were assessed to determine the impact of hyperparameter settings on touch stroke classification.
The first configuration utilized a standard C-SVC type with a linear kernel. The specific settings, including a Cost (C) of 1.0 and disabled probability estimates to prioritize decision speed, are detailed in Table 8.
Table 8.
LibSVM Node Parameter Settings, with Cost (C) of 1.0 and Disabled Probability.
With these settings, the model achieved an impressive accuracy of 89.94%. This high fidelity suggests that even a linear decision boundary is effective at separating user classes in the high-dimensional feature space of touch dynamics. The corresponding Cohen’s kappa coefficient of 0.8967 further corroborates the model’s adeptness, indicating strong agreement between predicted and true class labels well above chance levels.
The detailed classification metrics reveal that while specificity (True Negative Rate) remains consistently high across classes, there is notable variability in precision and recall. High specificity is a critical feature for authentication systems, as it minimizes false positives, thus preventing impostors from gaining access. However, the suboptimal recall in a small percentage of cases indicates that the model occasionally fails to identify legitimate users (false negatives). This variation points to unequal performance where distinct user patterns are identified more clearly than “generic” touch behaviors.
A secondary assessment was conducted using the LibSVM Learner node with a different parameter set, specifically utilizing the parameter (0.5) to control the number of support vectors and enabling probability estimates. These settings are summarized in Table 9.
Table 9.
LibSVM Node Parameter Settings Utilizing the parameter (0.5).
Under this configuration, the model reported a classification accuracy of 81.17% and a Cohen’s kappa of 0.8067. While still indicative of strong performance, the drop in accuracy compared to Configuration A highlights the sensitivity of SVMs to hyperparameter tuning, specifically, the trade-off introduced by the parameter and the computational overhead of probability estimation. Similarly to the first configuration, high true positive rates were observed for many classes, yet the F-measure values fluctuated, suggesting that the linear assumption may struggle with the increased constraints of this configuration.
The comparison of these two configurations provides valuable insights. While the linear kernel provided a strong starting point (achieving nearly 90% accuracy), the observed diversity in performance metrics, specifically the variability in recall which suggests that the linear assumption may not fully capture the complex, non-linear relationships within the dataset.
To bridge the gap between the SVM performance (~89%) and the Random Tree performance (~97%), future optimization should focus on the following areas:
- Kernel Experimentation: Moving beyond linear kernels to explore Radial Basis Function (RBF) or Polynomial kernels could allow the model to construct more flexible decision boundaries, potentially improving sensitivity for hard-to-classify users.
- Handling Class Imbalance: The variability in F-measures suggests class imbalance issues. Techniques such as cost-sensitive learning (assigning higher penalties to misclassifying minority classes) or weighted loss functions could stabilize performance across all user profiles.
By refining the model from a theoretical construct to a validated system through these optimization strategies, the LibSVM classifier can be tuned to deliver consistent, reliable outcomes essential for real-world deployment.
5. Discussions
5.1. Comparison with Literature
While traditional machine learning models such as SVM, -NN, and Random Tree are frequently employed in continuous authentication due to their computational efficiency and ease of implementation, their capacity to model intricate, non-linear relationships in high-dimensional data is often constrained. Touch stroke dynamics are inherently complex, exhibiting subtle non-linear variations that simple linear separators may fail to capture.
To overcome these limitations and investigate contemporary deep learning methodologies, a Multi-Layer Perceptron (MLP) neural network was integrated into the system. Neural networks were selected for this investigation due to their proven ability to generalize successfully on large datasets and their resilience when handling diverse feature sets. Unlike traditional models that rely strictly on manual feature engineering, neural networks can learn to approximate complex decision boundaries and feature interactions, making them highly effective for biometric tasks where decision limits are intricate.
While deep architectures like CNNs or Transformers excel in raw signal processing, this study utilizes a streamlined Multi-Layer Perceptron (MLP) optimized for the tabular nature of the engineered feature vectors. This design choice prioritizes computational efficiency for mobile deployment over architectural complexity. We acknowledge that future iterations could explore quantization techniques (e.g., TensorFlow Lite) to further reduce the model size for resource-constrained edge devices.
The MLP utilized in this study was meticulously designed to classify touch stroke dynamics data effectively. The architecture proceeds as follows:
- Input Layer: The network begins with an input layer that accepts the complete vector of extracted features from the dataset, ensuring that every spatial and temporal aspect of the touch dynamics is available to the model.
- Hidden Layers: The architecture includes two fully connected (dense) hidden layers. The first hidden layer consists of 128 neurons, while the second layer tapers to 64 neurons.
- Activation Function: Both hidden layers utilize the ReLU (Rectified Linear Unit) activation function. ReLU was chosen to introduce non-linearity to the network, enabling it to learn complex patterns while mitigating the vanishing gradient problem during training.
- Regularization: To prevent overfitting, a common challenge in neural networks trained on finite datasets, and dropout regularization is applied after each hidden layer with a rate of 50% (0.5). This forces the network to learn robust features by randomly dropping units during the training phase.
- Output Layer: The final layer employs a softmax activation function, which is ideal for multi-class classification. The number of neurons in this layer corresponds to the distinct user classes in the dataset, outputting a probability distribution for each user.
The training process is managed by the Adam optimizer, selected for its computational efficiency and adaptive learning rate capabilities. The initial learning rate is set to 0.001 to balance convergence speed with training stability. The network minimizes the categorical cross-entropy loss function, which is the standard objective function for multi-class classification problems. The performance of the MLP model is summarized in Table 10.
Table 10.
Performance Comparisons of MLP with Other Learners.
As shown in the table, the MLP achieved a high classification accuracy of 96.21%. This performance closely rivals the top-performing Random Tree algorithm (97.07%), confirming that neural networks are well-suited for modeling the non-linear relationships inherent in touch dynamics.
While there is a slight performance gap compared to the Random Tree, this could be attributed to the dataset size, as neural networks typically thrive on massive volumes of data, or potentially the need for further hyperparameter optimization. Nonetheless, this strong performance validates the MLP as a modern, effective, and robust model for behavioral biometrics [26].
These findings highlight the practical viability of integrating deep learning techniques into continuous authentication systems. The ability of the MLP to deliver high accuracy while handling complex feature interactions makes it particularly suitable for deployment in real-world applications where security is paramount. Future work will focus on optimizing the computational efficiency of these models to ensure seamless scalability on mobile devices with limited processing power.
5.2. xAI Interpretation
To improve the transparency of the continuous authentication system and address the “black-box” nature of algorithmic decision-making, we integrated two primary explainability tools: SHAP (SHapley Additive exPlanations) and LIME (Local Interpretable Model-agnostic Explanations). These methodologies facilitate the rigorous interpretation of the machine learning classifiers employed in this study, specifically Random Tree, SVM, -NN, and MLP, which allow stakeholders to comprehend the complex decision-making processes involved in touch stroke analysis.
The general purpose of combining SHAP and LIME is to provide a holistic view of the model’s behavior, bridging the gap between high-level feature importance and instance-level decision logic.
SHAP values quantify the marginal contribution of each feature to a model’s output based on cooperative game theory. In this research, SHAP provides a global understanding of the model’s behavior, identifying which touch dynamics features, such as StartX, MedianVelocity, or StrokeDuration that consistently possess the greatest impact on authentication outcomes.
Conversely, LIME focuses on local explanations by approximating the model’s decision boundary around individual instances. This is particularly valuable for real-time authentication feedback, as it can clarify specific decisions. For example, LIME can explain why a specific interaction triggered a rejection, helping to ensure that unexpected anomalies can be analyzed and understood.
We utilized the standard Python implementations of SHAP and LIME, which integrate seamlessly with the scikit-learn library, to conduct this comprehensive study. Explainability is particularly critical in continuous authentication, where user acceptance relies heavily on trust. By demystifying the intricate models underlying touch stroke dynamics, the system boosts user confidence in the security mechanisms protecting their identity.
However, a critical balance must be maintained. While transparency boosts trust, controlling the granularity of the explainability is essential for maintaining system security. Overly detailed explanations could reveal the precise decision boundaries of the model, potentially exposing sensitive aspects of the authentication logic. This “excessive transparency” could inadvertently aid adversaries in crafting adversarial attacks or mimicry attempts to bypass the system. To mitigate this risk, this framework advocates for controlled transparency measures, where the quantity of information revealed is modified based on the audience and use case. The SHAP analysis reveals that feature prioritization varies significantly depending on the algorithmic architecture, as detailed in Table 11, Table 12, Table 13 and Table 14.
Table 11.
SHAP Feature Importance for SVM (Note: SHAP values are standardized to a [0, 1] scale relative to the maximum feature contribution to allow for cross-model comparison.).
Table 12.
SHAP Feature Importance for -NN.
Table 13.
SHAP Feature Importance for Random Tree.
Table 14.
SHAP Feature Importance for MLP.
As shown in Table 11 and Table 12, the SVM and -NN models are heavily influenced by geometric consistency. Specifically, AspectRatio_std and AspectRatio_mean dominate the SHAP values for these models.
In contrast, the Random Tree model (Table 13) prioritizes trajectory pathing, with TrajectoryLength_mean and TrajectoryLength_max identified as the most impactful features.
The MLP neural network (Table 14) demonstrates a different focus, prioritizing dynamic motion features such as PairwiseVelocity50 and pressure metrics like MidStrokePressure.
This variation emphasizes the complexity of determining authentication results; no single feature is universally dominant. For instance, while TrajectoryLength features are paramount for Random Trees, AspectRatio-related features dominate the -NN analysis. This divergence highlights the importance of using diverse modeling approaches to capture different facets of user behavior.
The integration of LIME complements SHAP’s global insights by providing instance-specific clarity. LIMEs reveal how specific thresholds trigger decisions in real-time.
As summarized in Table 15, Table 16, Table 17 and Table 18, each model relies on distinct feature contributions for classification. Features like StrokeDuration_mean and InterStrokeTime_mean contribute positively to authentication, whereas trajectory deviations like TrajectoryLength_max negatively impact the SVM classification, as shown in Table 15.
Table 15.
LIME Local Explanation for SVM.
Table 16.
LIME Local Explanation for -NN.
Table 17.
LIME Local Explanation for Random Tree.
Table 18.
LIME Local Explanation for MLP.
Positive contributions for -NN (Table 16) are driven by Deviation80, StrokeDuration_mean, and AspectRatio_mean, while trajectory length features generally have a negative effect.
Conversely, Random Tree model (Table 17) assigns a significant positive role to TrajectoryLength_max and TrajectoryLength_std, while DiagonalLength_std negatively affects the score.
The neural network (Table 18) highlights InterStrokeTime_min and AspectRatio_std as positive contributors, whereas specific directional flags like EndToEndDirection_DOWN-RIGHT have a negative impact.
These results showcase the localized logic each model applies to differentiate between a legitimate user and an anomaly.
Although SHAP and LIME offer valuable insights, they are not without limitations. Specifically, for extremely complex decision boundaries (such as those in high-dimensional neural networks), these tools rely on approximations that may not fully capture the minutiae of the model’s behavior. To further improve interpretability, future research could investigate combining these model-agnostic tools with domain-specific visualization methods.
Furthermore, the conclusions drawn from this analysis can direct feature engineering initiatives, potentially enhancing authentication models’ efficiency by focusing data collection on the most impactful features.
By pinpointing key features influencing authentication decisions and providing real-time explanations, SHAP and LIME ensure that administrators can better troubleshoot issues and refine the system (Table 19). This approach not only strengthens the system’s reliability but also builds user confidence, addressing key stakeholder concerns and aligning with broader goals of transparency and trust in continuous authentication systems.
Table 19.
Summary of SHAP and LIME Analysis on Each Model.
To address the risks of ‘over-transparency,’ where revealing too much might aid attackers, the proposed interface employs a graded feedback mechanism. Users are presented with high-level summaries (e.g., ‘Verification failed due to irregular swipe speed’) rather than raw feature values. This actionable feedback allows legitimate users to correct their behavior without exposing precise decision boundaries to potential adversaries.
5.3. Analysis of the Precision-Interpretability Trade-Off
A fundamental challenge in behavioral biometrics is the trade-off between predictive accuracy and model interpretability. Typically, complex non-linear models like Random Trees and Neural Networks offer superior accuracy but operate as opaque “black boxes,” whereas simpler linear models (e.g., SVM) are more transparent but often fail to capture intricate behavioral nuances.
In this study, the Random Tree classifier achieved the highest accuracy of 97.07%, significantly outperforming the linear SVM (78.89%). However, without xAI, the reasoning behind this superiority would remain obscure. By applying SHAP and LIME, we successfully bridged this gap, allowing for a granular analysis of why specific models perform better.
The xAI analysis revealed that the high precision of the Random Tree model is driven by its focus on geometric trajectory features, specifically TrajectoryLength_mean and TrajectoryLength_max. In contrast, the Multi-Layer Perceptron (MLP), which achieved a comparable accuracy of 96.21%, relied on arguably more robust kinematic features such as PairwiseVelocity50 and MidStrokePressure.
This comparison highlights a critical insight: while the Random Tree is statistically more precise in this controlled dataset, its reliance on fixed path lengths may be less resilient to behavioral drift than the MLP’s focus on velocity and pressure. The integration of xAI transforms this from a “black-box” selection into an informed design choice, demonstrating that high-precision continuous authentication can be achieved without sacrificing the auditable transparency required for user trust.
5.4. Limitations of the Study
While the proposed framework demonstrates robust performance, this study acknowledges several limitations that should be addressed in future work:
- Demographic Generalizability: The dataset was constructed from 150 participants, primarily comprising university students aged between 20 and 55. This demographic skew may not fully represent the motor control characteristics of younger children or elderly users, whose touch dynamics may exhibit higher variability or different pressure profiles.
- Temporal Stability: Data collection was restricted to a single session per participant. Consequently, this study does not account for “behavioral drift”, which is the natural evolution of a user’s interaction style over days or weeks. Longitudinal data is required to verify if the high accuracy of the Random Tree model (97.07%) remains consistent over extended periods.
- Adversarial Scope: The current security evaluation focuses on distinguishing the legitimate user from random impostors (zero-effort attacks). The system has not yet been stress-tested against active “mimicry attacks,” where an adversary or a robotic arm attempts to replicate the specific velocity and trajectory patterns of a target user.
- Environmental Constraints: The behavioral data was collected within a custom NewsApp environment designed to simulate reading and questionnaire tasks. User behavior may differ in high-stress or high-frequency environments, such as gaming or rapid messaging applications, which were not covered in this experimental setup.
- Data diversity: The current dataset, comprising 150 participants (primarily students) collected in single sessions, serves as a foundational baseline. While this limits the analysis of longitudinal behavioral drift and age-related motor variance, it provides a controlled environment to validate the xAI framework’s efficacy. Future phases of this research will prioritize multi-session data collection across diverse age groups to address these heterogeneity gaps.
6. Conclusions
In conclusion, this research demonstrates that integrating touch stroke analysis with Explainable AI (xAI) significantly enhances the transparency of continuous authentication systems without compromising security. Experimental results indicated that the Random Tree classifier outperformed other models, achieving an accuracy of 97.07%, while the MLP model followed closely with 96.21%. Through SHAP analysis, we identified that features such as ‘TrajectoryLength’ and ‘AspectRatio’ are critical determinants of user identity. However, this study is limited by its sample population of university students and the collection of data within single sessions.
Future work will focus on longitudinal studies to assess behavioral drift and expanding the demographic diversity of the dataset to include wider age groups, such as the elderly, whose interaction patterns differ significantly from the student population [27]. Furthermore, rigorous testing against adversarial mimicry attacks will be conducted to guarantee the high-level privacy and security standards necessary for sensitive web-based applications [28]. By aligning our transparency goals with emerging standards in cyber defense health assessment [29] and advanced interaction analysis [30], this work establishes a foundational benchmark for future innovations. As the field advances toward complex generative and deep biometric frameworks, such as F2Key [31] and SmileAuth [32], establishing a transparent, explainable baseline for fundamental touch dynamics becomes increasingly critical. By aligning our transparency goals with these emerging high-performance standards, this work solidifies the role of explainable touch dynamics as a ubiquitous, efficient, and trustworthy first line of defense.
Author Contributions
S.Y.O. conceptualized the project, developed the main theoretical framework, and contributed significantly to the writing and structuring of the manuscript. M.N.M.N. implemented the technical details, performed the numerical calculations for the experiments, and co-wrote the initial draft. S.R. provided critical review and proofreading, while Y.H.P. contributed to the analysis and interpretation of the results. All authors have read and agreed to the published version of the manuscript.
Funding
This research was funded by a Matching Grant from Multimedia University and the University of Hertfordshire (Grant Number: MMUI/230078).
Data Availability Statement
The data that support the findings of this study are available from the corresponding author, S.Y.O., upon reasonable request.
Acknowledgments
During the preparation of this manuscript/study, the author(s) used Grammarly 14.1270.0 for the purposes of proofreading. The authors have reviewed and edited the output and take full responsibility for the content of this publication.
Conflicts of Interest
The authors declare no conflicts of interest.
Abbreviations
The following abbreviations are used in this manuscript:
| AI | Artificial Intelligence |
| API | Application Programming Interface |
| EER | Equal Error Rate |
| -NN | k-Nearest Neighbors |
| LIBSVM | Library for Support Vector Machines |
| LIME | Local Interpretable Model-agnostic Explanations |
| MLP | Multi-Layer Perceptron |
| OVO | One-Versus-One |
| OVR | One-Versus-Rest |
| OneClassSVM | One-Class Support Vector Machine |
| PIN | Personal Identification Number |
| SHAP | SHapley Additive exPlanations |
| SVM | Support Vector Machine |
| UX | User Experience |
| xAI | Explainable Artificial Intelligence |
| XGBoost | Extreme Gradient Boosting |
References
- Aaby, P.; Giuffrida, M.V.; Buchanan, W.J.; Tan, Z. Towards Continuous User Authentication Using Personalised Touch-Based Behaviour. In Proceedings of the 2020 IEEE International Conference on Dependable, Autonomic and Secure Computing (DASC/PiCom/CBDCom/CyberSciTech), Calgary, AB, Canada, 17–22 August 2020; pp. 41–48. [Google Scholar]
- Shrestha, S.; Lopez, M.A.; Baddeley, M.; Muhaidat, S.; Giacalone, J.-P. A Time-Bound Continuous Authentication Protocol for Mesh Networking. In Proceedings of the 2021 4th International Conference on Advanced Communication Technologies and Networking (CommNet), Rabat, Morocco, 3–5 December 2021; pp. 1–6. [Google Scholar]
- Li, Y.; Hu, H.; Zhou, G. Using Data Augmentation in Continuous Authentication on Smartphones. IEEE Internet Things J. 2019, 6, 628–640. [Google Scholar] [CrossRef]
- Kudo, M.; Takahashi, T.; Yamana, H. Touch-Based Continuous Mobile Device Authentication Using One-vs-One Classification Approach. In Proceedings of the 2024 IEEE International Conference on Big Data and Smart Computing (BigComp), Bangkok, Thailand, 18–21 February 2024; pp. 167–174. [Google Scholar]
- Maneerat, T. XAI Approach to Improved and Informed Detection of Burnt Scar. In Proceedings of the 2022 International Conference on Decision Aid Sciences and Applications (DASA), Chiangrai, Thailand, 23–25 March 2022; pp. 610–615. [Google Scholar]
- Abuhamad, M.; Abusnaina, A.; Nyang, D.; Mohaisen, D. Sensor-Based Continuous Authentication of Smartphones’ Users Using Behavioral Biometrics: A Contemporary Survey. IEEE Internet Things J. 2021, 8, 65–84. [Google Scholar] [CrossRef]
- Aaby, P.; Giuffrida, M.V.; Buchanan, W.J.; Tan, Z. An Omnidirectional Approach to Touch-Based Continuous Authentication. Comput. Secur. 2023, 128, 103146. [Google Scholar] [CrossRef]
- Walambe, R.; Kolhatkar, A.; Ojha, M.; Kademani, A.; Pandya, M.; Kathote, S. Integration of Explainable AI and Blockchain for Secure Storage of Human Readable Justifications for Credit Risk Assessment. In Advanced Computing, IACC 2020; Garg, D., Wong, K., Sarangapani, J., Gupta, S.K., Eds.; Communications in Computer and Information Science; Springer: Singapore, 2021; Volume 1368, pp. 67–77. [Google Scholar]
- Bussmann, N.; Giudici, P.; Marinelli, D.; Papenbrock, J. Explainable Machine Learning in Credit Risk Management. Comput. Econ. 2021, 57, 203–216. [Google Scholar] [CrossRef]
- Demajo, L.M.; Vella, V.; Dingli, A. Explainable AI for Interpretable Credit Scoring. In Computer Science & Information Technology (CS & IT), ACITY 2020; AIRCC Publishing Corporation: Chennai, India, 2020; pp. 191–198. [Google Scholar]
- Frank, M.; Biedert, R.; Ma, E.; Martinovic, I.; Song, D. Touchalytics: On the Applicability of Touchscreen Input as a Behavioral Biometric for Continuous Authentication. IEEE Trans. Inf. Forensics Secur. 2013, 8, 136–148. [Google Scholar] [CrossRef]
- Serwadda, A.; Phoha, V.V.; Wang, Z. Which Verifiers Work? A Benchmark Evaluation of Touch-Based Authentication Algorithms. In Proceedings of the 2013 IEEE Sixth International Conference on Biometrics: Theory, Applications and Systems (BTAS), Arlington, VA, USA, 29 September–2 October 2013; pp. 1–8. [Google Scholar]
- Syed, Z.; Helmick, J.; Banerjee, S.; Cukic, B. Touch Gesture-Based Authentication on Mobile Devices: The Effects of User Posture, Device Size, Configuration, and Inter-Session Variability. J. Syst. Softw. 2019, 149, 158–173. [Google Scholar] [CrossRef]
- Yang, Y.; Guo, B.; Wang, Z.; Li, M.; Yu, Z.; Zhou, X. BehaveSense: Continuous Authentication for Security-Sensitive Mobile Apps Using Behavioral Biometrics. Ad Hoc Netw. 2019, 84, 9–18. [Google Scholar] [CrossRef]
- Cheng, Y.; Ji, X.; Li, X.; Zhang, T.; Malebary, S.; Qu, X.; Xu, W. Identifying Child Users via Touchscreen Interactions. ACM Trans. Sens. Netw. 2020, 16, 35. [Google Scholar] [CrossRef]
- Ooi, S.Y.; Teoh, A.B.-J. Touch-Stroke Dynamics Authentication Using Temporal Regression Forest. IEEE Signal Process. Lett. 2019, 26, 1001–1005. [Google Scholar] [CrossRef]
- Barlas, Y.; Basar, O.E.; Akan, Y.; Isbilen, M.; Alptekin, G.I.; Incel, O.D. DAKOTA: Continuous Authentication with Behavioral Biometrics in a Mobile Banking Application. In Proceedings of the 2020 5th International Conference on Computer Science and Engineering (UBMK), Diyarbakir, Turkey, 9–11 September 2020; pp. 1–6. [Google Scholar]
- Estrela, P.M.A.B.; Albuquerque, R.O.; Amaral, D.M.; Giozza, W.F.; Nze, G.D.A.; de Mendonça, F.L.L. Biotouch: A Framework Based on Behavioral Biometrics and Location for Continuous Authentication on Mobile Banking Applications. In Proceedings of the 2020 15th Iberian Conference on Information Systems and Technologies (CISTI), Seville, Spain, 24–27 June 2020; pp. 1–6. [Google Scholar]
- Opoku-Mensah, E.; Bandoh, Y.S.; Li, J.; Ayekai, J.B.; Mawuli, B.C. Behavioral Biometrics for Human Identity Corroboration Based on Gesture-Signature with Deep Learning. In Proceedings of the 2020 17th International Computer Conference on Wavelet Active Media Technology and Information Processing (ICCWAMTIP), Chengdu, China, 18–20 December 2020; pp. 146–152. [Google Scholar]
- Bansal, P.; Ouda, A. Study on Integration of FastAPI and Machine Learning for Continuous Authentication of Behavioral Biometrics. In Proceedings of the 2022 International Symposium on Networks, Computers and Communications (ISNCC), Shenzhen, China, 19–22 July 2022; pp. 1–6. [Google Scholar]
- Omanovic, S.; Midzic, A.; Avdagic, Z.; Pozderac, D.; Toroman, A. Missing Values Interpolation in PurpleAir Sensor Data Based on a Correlation with Neighboring Locations Using KNIME Analytics Platform. In Proceedings of the 2023 46th MIPRO ICT and Electronics Convention (MIPRO), Opatija, Croatia, 22–26 May 2023; pp. 291–295. [Google Scholar]
- Çelik, H.; Çinar, A. An Application on Ensemble Learning Using KNIME. In Proceedings of the 2021 International Conference on Data Analytics for Business and Industry (ICDABI), Sakheer, Bahrain, 25–26 October 2021; pp. 400–403. [Google Scholar]
- Tsoni, R.; Kaldis, V.; Kapogianni, I.; Sakagianni, A.; Feretzakis, G.; Verykios, V.S. A Machine Learning Pipeline Using KNIME to Predict Hospital Admission in the MIMIC-IV Database. In Proceedings of the 2023 14th International Conference on Information, Intelligence, Systems & Applications (IISA), Volos, Greece, 10–12 July 2023; pp. 1–6. [Google Scholar]
- Muenzberg, A.; Sauer, J.; Hein, A.; Roesch, N. Checking the Plausibility of Nutrient Data in Food Datasets Using KNIME and Big Data. In Proceedings of the 2019 International Conference on Wireless and Mobile Computing, Networking and Communications (WiMob), Barcelona, Spain, 21–23 October 2019; pp. 1–4. [Google Scholar]
- Nasarian, R.; Alizadehsani, R.; Acharya, U.R.; Tsui, K.-L. Designing Interpretable ML System to Enhance Trust in Healthcare: A Systematic Review to Proposed Responsible Clinician-AI-Collaboration Framework. Inf. Fusion 2024, 108, 102412. [Google Scholar] [CrossRef]
- Ooi, S.Y.; Tan, S.C.; Cheah, W.P. Experimental Study of Elman Network in Temporal Classification. In Emerging Trends in Neuro Engineering and Neural Computation; Bhatti, A., Lee, K.H., Garmestani, H., Lim, C.P., Eds.; Springer: Singapore, 2017; pp. 245–254. ISBN 9789811039553. [Google Scholar]
- Seek, C.Y.; Ooi, S.Y.; Pang, Y.H.; Lew, S.L.; Heng, X.Y. Elderly and Smartphone Apps: Case Study with Lightweight MySejahtera. J. Inform. Web Eng. JIWE 2023, 2, 13–24. [Google Scholar] [CrossRef]
- Tay, Y.H.; Ooi, S.Y.; Pang, Y.H.; Gan, Y.H.; Lew, S.L. Ensuring Privacy and Security on Banking Websites in Malaysia: A Cookies Scanner Solution. J. Inform. Web Eng. JIWE 2023, 2, 153–167. [Google Scholar] [CrossRef]
- Hong, S.; Zeng, Y. A Health Assessment Framework of Lithium-Ion Batteries for Cyber Defense. Appl. Soft Comput. 2021, 101, 107067. [Google Scholar] [CrossRef]
- Liang, S.; Liu, W.; Li, Z.; Jiang, K.; Yang, S.; Lin, C.-W.; Zhong, X. AM40: Enhancing Action Recognition through Matting-Driven Interaction Analysis. Pattern Recognit. 2026, 172, 112393. [Google Scholar] [CrossRef]
- Duan, D.; Sun, Z.; Ni, T.; Li, S.; Jia, X.; Xu, W.; Li, T. F2 Key: Dynamically Converting Your Face into a Private Key Based on COTS Headphones for Reliable Voice Interaction. In Proceedings of the 22nd Annual International Conference on Mobile Systems, Applications and Services, Tokyo, Japan, 3 June 2024; ACM: New York, NY, USA; pp. 127–140. [Google Scholar]
- Jiang, H.; Cao, H.; Liu, D.; Xiong, J.; Cao, Z. SmileAuth: Using Dental Edge Biometrics for User Authentication on Smartphones. Proc. ACM Interact. Mob. Wearable Ubiquitous Technol. 2020, 4, 84. [Google Scholar] [CrossRef]
Disclaimer/Publisher’s Note: The statements, opinions and data contained in all publications are solely those of the individual author(s) and contributor(s) and not of MDPI and/or the editor(s). MDPI and/or the editor(s) disclaim responsibility for any injury to people or property resulting from any ideas, methods, instructions or products referred to in the content. |
© 2026 by the authors. Licensee MDPI, Basel, Switzerland. This article is an open access article distributed under the terms and conditions of the Creative Commons Attribution (CC BY) license.