Abstract
This study introduces a novel control device, the nonlinear air-spring absorber (ASA), aimed at improving the collapse resistance of transmission tower-line systems subjected to severe wind loads. Initially, a detailed finite element (FE) model is developed for a representative transmission tower-line system, grounded in an actual engineering project, and the wind load applied to the system is obtained. Then, the working principle and design method of the ASA are introduced, and the device is embedded into the FE model. The Inter-Segment Displacement Ratio (ISDR) is employed as a collapse indicator to systematically evaluate, via fragility analysis, the effectiveness of the ASA. The effectiveness of the ASA at improving the collapse resistance of the tower-line system under different wind attack angles is systematically studied through a fragility analysis. The results show that the device effectively suppresses the structural wind-induced vibration and significantly improves the system’s collapse resistance. In particular, the vibration suppression effect is most pronounced along the transmission line (90° wind attack angle), with the critical collapse wind speed increasing by up to 23%. This study provides a practical and feasible technical approach for addressing the problem of wind-induced collapse control.
1. Introduction
The transmission tower-line system is a significant component of power infrastructure and serves as a lifeline for regional energy security and socioeconomic activity. Owing to its highly nonlinear, strongly coupled dynamic behavior, this system may experience pronounced wind-induced vibrations under extreme wind loading. Such responses can readily initiate local damage and potentially trigger progressive collapse, thereby escalating into catastrophic grid disruptions. Accordingly, a rigorous assessment of the collapse performance of tower-line systems under wind is essential for mitigating major systemic risks.
The response analysis methods for structures under wind loading have become increasingly sophisticated, and scholars [1,2,3] have continuously deepened their research on tower–line systems under various operational conditions.
Vettoretto et al. [4] studied the inelastic performance of transmission towers under different wind attack angles and suggested constructing the bearing capacity surface of towers using capacity curves from various wind directions. Deng et al. [5], through experiments and simulations, investigated the effect of conductors on the wind-induced vibration of lattice towers, revealing the influence of inclined wind incidence angles and wind speed for dynamic responses of the tower. Phan et al. [6] analyzed the aerodynamic force coefficients of tower under yawed and tilted winds through wind tunnel tests. They found that the vertical aerodynamic force coefficient varies linearly with the tilt angle, increasing significantly at ±30°, and proposed a new equation to extend the assessment scope of existing international codes. Wang et al. [7] researched the performance of transmission towers with different heights under static and moving downbursts, revealing the variation patterns of speed response with distance and jet diameter, and pointed out that the downburst load on lower-height towers is greater than that from conventional towers. Zhang et al. [8] studied the aerodynamic coefficients in ultra-high-voltage alternating current transmission towers under yawed and tilted winds through wind tunnel tests and numerical simulation. They assessed problems of current codes underestimating the influence of yaw angle and proposed a new skew wind load factor formula to accurately account for the angle effect. Zhou et al. [9] measured the wind load coefficients of lattice tower bodies through wind tunnel experiments, indicating that standard recommended formulas significantly underestimate the actual loads, and proposed a new combined wind load factor formula to improve calculation accuracy.
Scholars have expanded the study of structural responses by considering various load combinations and member damage. They have extended static wind load analysis to include pulsating wind loads, using pushover analysis and incremental dynamic analysis (IDA) to investigate the collapse of transmission tower-line systems. Some researchers [10,11,12,13,14,15] have combined numerical simulations with experimental studies to identify the weak points of structures, thereby laying the foundation for future research on wind-induced collapse resistance in transmission lines.
Weng et al. [16] evaluated the performance of a transmission tower under fluctuating wind using finite element analysis and dynamic methods. They identified 45° as the most critical wind direction and effectively enhanced the wind resistance performance through multi-scale modeling and perforated plate reinforcement techniques. Kwon et al. [17] analyzed the structural performance degradation of a transmission tower in a coastal area due to corrosion. They proposed a fragility assessment process considering uncertainties in wind conditions and aerodynamic parameters and recommended using a limit-collapsed surface to comprehensively estimate the structural safety of towers. Battista et al. [18] developed a numerical model for stability assessment of transmission towers under strong wind. Based on a 3D FE model, they analyzed the dynamic response and collapse mechanism of the transmission tower and demonstrated that installing nonlinear pendulum-like dampers can effectively control the top horizontal displacement.
In contrast to the significant advancements in the study of transmission tower collapse resistance under seismic [19], ice accretion [20,21,22], and explosion [23] loads, research on collapse control under strong wind loads remains relatively underdeveloped. There is a lack of universally accepted effective control methods, as well as a deficiency in comparative assessments of the effectiveness of different control strategies. Therefore, this paper aims to investigate a control device based on a nonlinear air-spring absorber (ASA), with the goal of enhancing the collapse resistance of tower-line systems subjected to strong winds. Using a practical engineering scenario, the tower-line system’s FE model is developed. The wind-induced performance of tower-line systems without and with the ASA is subsequently investigated through fragility analysis. Therefore, this study focuses on a control device employing a nonlinear air-spring absorber (ASA) designed to improve the collapse resistance of transmission tower-line systems subjected to strong winds. Using a real-world engineering case, a finite element model of the tower-line system is developed. Subsequently, fragility analysis is performed to examine and compare the wind-induced responses of the system both with and without the ASA.
2. Finite Element Model Establishment and Wind Load Calculation
2.1. Establishment of the Tower-Line System FE Model
Based on a specific UHVAC transmission project, this study develops a finite element model of the tower-line system. The model comprises three steel-pipe transmission towers and four line spans, with lengths of 424 m, 1054 m, 1315 m, and 624 m, respectively. Each span is configured with six conductors and two ground wires.
In the three steel-pipe straight-line towers (G1, G2, G3), Towers G1 and G2 are of the same type, which has a total height of 204 m, a nominal height of 135 m, and a base width of 42.48 m. The G3 tower has a total height of 140 m, a nominal height of 71 m, and a base width of 27.02 m. The tower structures of the three towers, from the lowest horizontal crossarm upwards, are identical. The structural dimensions are detailed in Figure 1. The wires are arranged vertically and hung using the I-string configuration. The conductors are six-strand JLHA1/G4A-640/170-type extra-strong steel-core high-strength aluminum alloy stranded cables, while the ground wire is a single OPGW-300 type optical cable. Specific parameters are provided in Table 1.
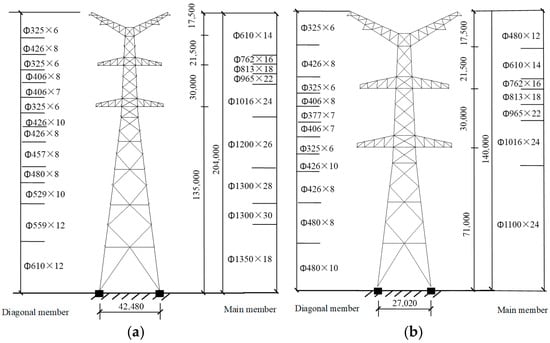
Figure 1.
Information on the towers (unit: mm): (a) design plan of G1 and G2 transmission towers; (b) design plan of G3 transmission towers.

Table 1.
Wire parameter information.
In terms of the reference [24], the model adopts a frame form, treating all member connections as rigid connections, allowing members to withstand axial force, shear, bending moment, and torque, to more accurately reflect the complex stress state of rigidly connected members in actual engineering. As shown in Figure 2, the finite element model of the transmission tower-line system was established using ABAQUS (version 2017) with BEAM elements simulating tower members and T3D2 elements simulating insulators and transmission lines. The tower members are primarily made of Q355 steel, with an elastic modulus of 206 GPa, a steel density of 7800 kg/m2, and a Poisson’s ratio of 0.3. The X-axis is defined as the direction perpendicular to the tower line, the Y-axis as the direction parallel to the tower line, and the Z-axis as the vertical direction.
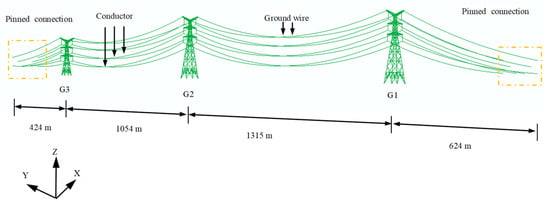
Figure 2.
FE model of the tower-conductor system.
Considering practical engineering conditions, the tower legs in the FE model are modeled with fixed boundary conditions. The two ends of the conductors are modeled with pinned conditions. The mass effects of additional components, such as bolts and connecting steel plates, are taken into account by introducing lumped masses at the corresponding nodes in the model. Moreover, to more realistically capture the collapse evolution of the tower, Tian-Ma-Qu nonlinear material constitutive model [25] is adopted.
2.2. Wind Load Calculation
The dynamic wind load time histories acting on the system were simulated in accordance with the IEC standard [26]. This simulation was implemented on the MATLAB R2018b platform, employing the linear filtering technique to generate the required wind velocity fields. Wind loading on the transmission tower can be determined using the following expression:
In the equations, Fx and Fy denote the wind load components acting on the transmission tower in the X and Y horizontal directions, respectively; is the air density, taken as 1.225 kg/m3; and θ is the wind attack angle. According to the code [26], a wind attack angle of 0° is defined as the direction perpendicular to the tower-line, while 90° corresponds to the direction along the tower-line. V represents the wind speed at a height of 10 m; A1 and A2 are the projected windward areas of the transmission tower in the transverse and longitudinal directions, respectively; Cxt1 and Cxt2 are the drag coefficients perpendicular to the tower body in the transverse and longitudinal directions, respectively; and G is the wind load combination factor of the structure.
The wind load acting on the transmission lines can be expressed as follows:
In the equation, denotes the basic wind pressure; is the drag coefficient of the transmission line, which is typically taken as 1.00; is the wind load combination factor for the transmission line, depending on the installation height and terrain category; is the span coefficient of the transmission line; d is the diameter of the transmission line; L is the horizontal span length of the transmission line; and Ω is the angle between the wind direction and the transmission line.
In the simulation of wind loads on the transmission tower, Towers G1 and G2 are considered to have ten segments, while Tower G3 is considered to have eight. The windward area for each segment is calculated accordingly. The representative wind speed for each simulation region is determined based on the wind speed at the midpoint of the corresponding segment, as illustrated in Figure 3.

Figure 3.
Schematic of tower body wind load simulation segmentation (unit: m): (a) Towers G1 and G2; (b) Tower G3.
The basic wind parameters are defined with a reference speed of 20 m/s at a 10 m height and a ground roughness corresponding to Terrain Category B. The fluctuating wind component is modeled using the Kaimal wind speed power spectral density (PSD). With a time step of 0.1 s, a 300 s wind load time history is subsequently generated for the tower-line system. Taking the fifth segment of tangent Tower G1 in the along-line direction as a representative case, Figure 4 compares the simulated wind-load spectrum with the target spectrum. The two spectra exhibit consistent overall trends, indicating that the proposed wind-load simulation approach is sufficiently reliable for subsequent analyses.
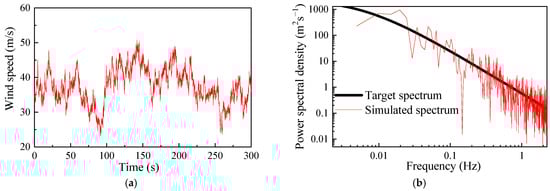
Figure 4.
Comparison of the simulated wind-load spectrum with the target spectrum: (a) time history of pulsating wind speed; (b) comparison results.
3. Theoretical Design and Simulation of ASA
3.1. System Construction and Working Principle of ASA
For high-rise transmission tower structures, nonlinear air springs can maintain the system frequency at a low level under weak and strong wind loads, and their self-weight is small, which has little impact on the overall stress state and dynamic characteristics of the transmission tower. Owing to the nonlinear stiffness characteristics of the air springs, the ASA exhibits a non-constant natural frequency. This feature enables the device to capture vibrational energy associated with the high mode of the primary structure through an instantaneous resonance mechanism, thereby broadening the effective vibration attenuation bandwidth of the system. Based on the basic requirements of tuned mass dampers (TMDs) for the symmetry of structural system stiffness, this paper uses a symmetrical combination of air springs as the stiffness element of the ASA vibration reduction system, providing symmetrical nonlinear stiffness and restoring force. Figure 5 exhibits the working form of a symmetrical combination air spring.
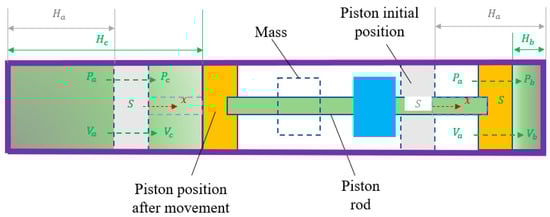
Figure 5.
Schematic diagram of working mode of symmetric combined air spring.
As illustrated in Figure 5, when the piston is in the stationary state, the gas pressures inside and outside the cylinder are identical. When the piston moves to the left or right under external loading, the gas pressure inside the cylinder changes accordingly, generating a reaction force that constitutes the restoring force of the air spring.
It is assumed that, at the equilibrium state, the effective piston area is S, the initial air volume and pressure inside the cylinder are Va and Pa, respectively, and the cylinder depth is Ha. After the piston moves rightward by a displacement x, the gas volume and pressure in the right chamber become Vb and Pb, respectively, with the corresponding cylinder depth changing to Hb, while the gas volume and pressure in the left chamber become Vc and Pc, respectively, with the corresponding cylinder depth changing to Hc. Based on the ideal gas law, the following relationship can be obtained:
Under the compressed state of the air spring, the gas volume in the cylinder satisfies the following:
The recentering force F of the air spring is given as follows:
By combining the above equations, the relationship between the restoring force F and the piston displacement x can be obtained. Differentiating this relationship with respect to x yields the equivalent stiffness of the combined air spring:
The proposed ASA is illustrated in Figure 6. The device mainly consists of a protective casing, a mass block, viscous damping units, nonlinear air springs, and connecting rods. The viscous damping units are responsible for providing effective energy dissipation, while the nonlinear air springs supply the required stiffness of the device. These two components are symmetrically arranged within the casing and connected to the mass block through the connecting rods, thereby forming an integrated vibration control system.
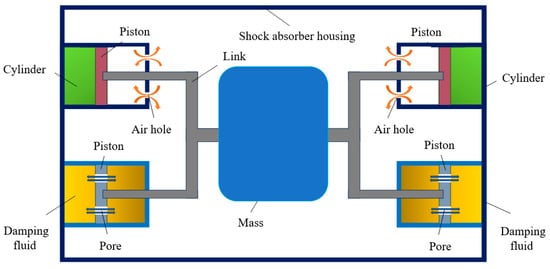
Figure 6.
Schematic diagram of the ASA device.
To reduce frictional effects during operation, universal rolling balls are installed at the contact interfaces between the mass block and the casing; in the numerical analysis, these interfaces are assumed to be smooth and frictionless. The inherent nonlinear stiffness of the air springs results in a velocity-dependent natural frequency for the ASA. This adaptive characteristic facilitates a broader operational bandwidth, allowing the device to transiently resonate with and capture vibrational energy from higher modes of the primary structure.
3.2. Parameter Design Method for the ASA
The parameter design procedure of the ASA can be divided into two stages: determination of initial parameters and optimization of key parameters. First, under relatively small external excitation amplitudes, the ASA can be approximately regarded as an equivalent linear tuned mass damper (TMD). Based on this assumption, the conventional quantitative design approach for TMDs is adopted to determine the initial tuning stiffness and damping parameters of the device. Specifically, the optimal frequency ratio is determined according to the fixed-point theory proposed by Hartog [27], while the optimal damping ratio is calculated using the empirical formula recommended in the literature, as expressed below:
In the equations, μ is the modal mass ratio and β represents the structural damping ratio, which is typically taken as 0.02.
Previous studies [28] have shown that the vibration mitigation effectiveness of a TMD increases with μ; however, when the mass ratio exceeds a certain optimal range, a turning point appears in this relationship, beyond which the vibration reduction efficiency begins to deteriorate. Meanwhile, the cost of a TMD is closely related to μ, with higher values of μ leading to increased construction and installation costs. The engineering constraints here primarily consider the impact on the dynamic characteristics of the original structure and the load-bearing capacity of the tower head. While an excessive additional mass may improve vibration reduction performance, it would significantly alter the natural frequency of the structure and impose additional demands on the design of the tower head joints. Based on engineering experience with transmission towers of similar height, a mass of approximately 8.8 tons corresponding to μ = 0.02 is an empirical value that falls within the load-bearing capacity of the existing tower head structure while still providing significant control effectiveness. Considering both the vibration control performance of the TMD and practical engineering constraints such as economy and installation space, the value of μ is preliminarily selected as 0.02 in this study.
Once and are determined, the stiffness coefficient k and damping coefficient c of the tuned mass damper can be obtained from the following equations, respectively:
In the equations, m is the block’s mass block, and is the circular frequency of the controlled vibration mode of the primary body.
During the key-parameter optimization stage, the damping coefficient c calculated above is adopted as the damping parameter of the ASA. When the mass block displacement x = 0, the initial tuning stiffness of the air spring, k(0), is taken as the tuning stiffness k of the equivalent TMD. Subsequently, the piston radius r of the air spring is designed according to practical engineering considerations, and on this basis, the initial gas volume V0 of the air spring is optimized through parametric analysis.
The design procedure of the proposed ASA is expressed as follows:
- (1)
- Based on the dynamic response of the structure, determine the frequency and damp of the structure, and select the mass ratio μ;
- (2)
- Through the initial quantitative calculations, determine the critical parameters of the ASA system, including the mass of the mass block m, optimal frequency ratio , optimal damping ratio , stiffness coefficient k, damping coefficient c, polytropic exponent n, piston radius r, and initial stiffness k(0);
- (3)
- Further optimize the working length of the air spring L, the initial gas volume V0, and the initial gas pressure P0.
Following the design procedure, the ASA parameters suitable for the transmission tower-line system are obtained and summarized in Table 2. The corresponding stiffness curve and restoring force curve are presented in Figure 7.
Table 2.
Design parameters of the ASA.

Figure 7.
Curve of mechanical property of symmetric combined gas spring: (a) stiffness curve; (b) recovery force curve.
Moreover, considerations for practical constructability have been integrated into the design. The additional mass of approximately 8.8 tons is within the permissible load range of standard tower heads. The compact dimensions of the protective casing (see Figure 6) ensure minimal spatial requirements, allowing installation without significant modification to the tower’s upper panel. Furthermore, the device layout preserves access for routine inspection and maintenance operations, ensuring compatibility with long-term tower servicing needs.
3.3. Finite Element Model of the ASA
The ASA is modeled in ABAQUS using spring elements and is subsequently embedded into the FE model of the tower-line system established in Section 2.1. Considering both the structural characteristics of the towers investigated in this study and practical installation constraints in engineering applications, the ASAs are installed at the panel corresponding to the main structural members at the top of tower. The ASA is installed at the upper panel of the tower head primarily because this location corresponds to the region of largest structural response under wind excitation. Dynamically, placing the absorber near the antinode of the fundamental mode maximizes inertial coupling and energy transfer, enhancing its control effectiveness per unit mass. Structurally, the upper segment experiences the most critical inter-story drifts, allowing the ASA to directly mitigate deformations that govern collapse initiation. Practically, the tower head offers relatively more space and easier access for installation without interfering with primary load-carrying members. Thus, this placement balances dynamic performance, structural relevance, and engineering feasibility. Figure 8 shows the FE model of the tower-line system equipped with ASAs, with the vibration control direction oriented along the line direction.
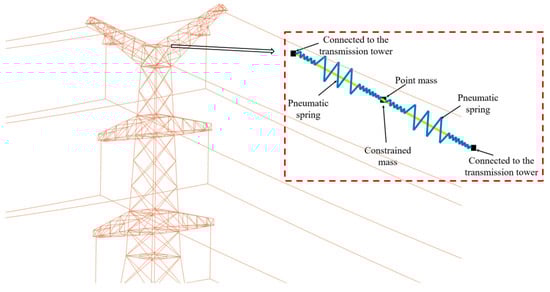
Figure 8.
Finite element model of the tower-line system with attached ASAs.
4. Wind-Induced Collapse Performance of Tower-Line System
During the operation of the ASA, its motion exhibits a phase lag relative to that of the primary tower. In other words, the vibration of the primary tower excites the response of the ASA, while the reaction force generated by the ASA, in turn, suppresses the structural vibration. Through continuous energy exchange between the two systems, the vibrational energy of the primary tower is gradually shifted to the ASA, thereby achieving vibration mitigation.
To evaluate the improvement in the wind-induced collapse resistance of the tower-line system provided by the ASA, this section first classifies the performance states of the tower-line system through pushover analysis. With this classification, fragility analyses are subsequently conducted for both the original tower-line system model (M1) and the one equipped with the ASA (M2).
4.1. Quantification of Critical States
For transmission tower-line systems, four damage states are commonly defined [29]: essentially intact (DS1), slight damage (DS2), moderate damage (DS3), and severe damage/collapse (DS4). Correspondingly, three limit states (LS)—namely LS1, LS2, and LS3—are specified, and in this section these limit states are identified through pushover analyses. In this pushover procedure, lateral loads following a prescribed distribution pattern are applied to the structure to gradually increase the internal force demand. The structural response consequently evolves from the elastic range into the inelastic regime and ultimately reaches failure, thereby enabling characterization of the global evolution of the load-resisting mechanism.
Compared with Tower G3, Tower G2 exhibits a greater height and flexibility. In addition, Tower G2 is located at the intermediate position of the system and is more significantly influenced by the conductors on both sides, rendering it more vulnerable than Tower G1. Therefore, the wind-induced response of Tower G2 is selected as the primary focus of analysis in this section. Common lateral load patterns adopted in pushover analysis include the inverted-triangular, parabolic, and SRSS-based distributions. Given that transmission towers are slender structures, the segmental mass is generally defined as uniformly distributed along the height. Accordingly, an inverted-triangular lateral load pattern is employed on the tower-line model. The load is increased incrementally until structural collapse, and the segmental shear forces and displacements are obtained throughout the loading process. Pushover analyses are conducted on the established FE model under four loading directions (0°, 30°, 45°, and 90°), as schematically illustrated in Figure 9.
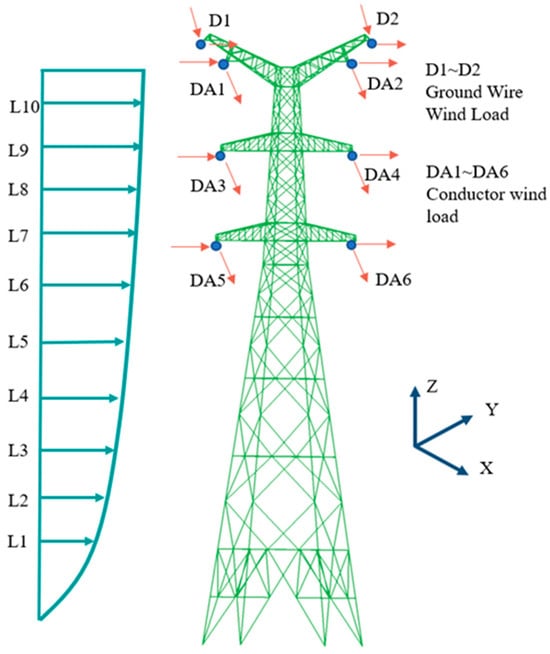
Figure 9.
Schematic diagram of static pushover analysis for transmission tower.
Compared with conventional buildings, towers exhibit a much larger height-to-width ratio and need floor slab systems to provide inter-story restraint. As a result, significant rotational deformation may develop within individual segments. Therefore, the conventional inter-story drift ratio commonly used for building structures is not directly applicable to transmission towers. In this paper, the inter-story drift ratio is accordingly modified, and the ISDR is adopted as the damage code for tower structures. Its fundamental advantage lies in its modification of the traditional inter-story drift ratio, which effectively removes the influence of significant rigid-body rotation in the segments of tall lattice tower bodies. This provides a more accurate reflection of the shear and bending deformation of the member system itself, forming the physical basis for its suitability in transmission tower structures. The segmentation of the tower is illustrated in Figure 3, and a visual definition of the ISDR is presented in Figure 10. The ISDR is calculated as follows:
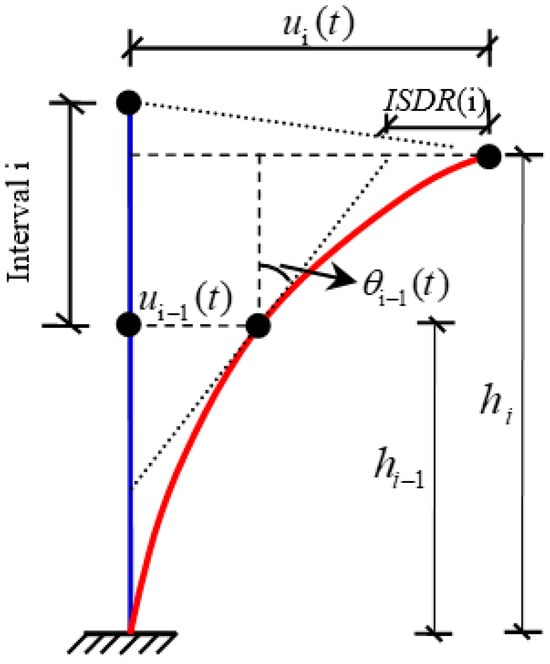
Figure 10.
Inter-segment displacement angle.
In the equation, i is the index of each segment; ISDR(i) represents the maximum rotational deformation of the ith segment; t is time; ui(t) and ui−1(t) are the horizontal displacement time histories at the top and bottom of the ith segment, respectively; hi and hi−1 are the vertical elevations of the top and bottom of the ith segment, respectively; and θi−1(t) represents the torsional displacement time histories at the top and bottom of the ith segment.
In terms of the pushover analyses, a correlation linking the tower base shear and the maximum ISDR is derived, as shown in Figure 11a–d. The pushover curves follow broadly similar trends across different wind directions, and a distinct inflection point can be identified on each curve. According to the equivalence criterion [30], this inflection point is regarded as the collapse limit state, denoted as LS3. The threshold values for LS1 and LS2 are taken as 50% and 75% of LS3, respectively [31].
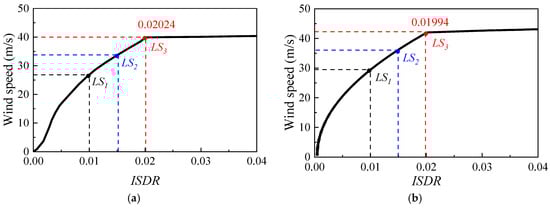
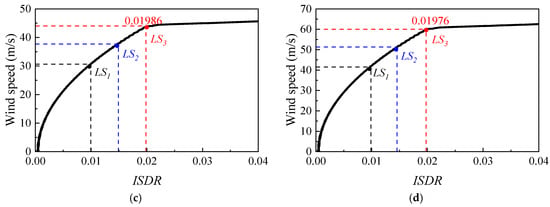
Figure 11.
ISDR–wind speed curve under different wind attack angles: (a) 0°; (b) 30°; (c) 45°; (d) 90°.
Specifically, the ISDR values corresponding to the inflection points under different wind attack angles of 0°, 30°, 45°, and 90° are 0.02024, 0.01994, 0.01986, and 0.01976, respectively, indicating that the wind direction influences the load distribution and deformation characteristics of the transmission tower. Consequently, in the subsequent fragility analysis of the tower-line system, distinct limit states are defined for different wind directions scenarios.
4.2. Effectiveness of ASA in Enhancing the Collapse Resistance
Structural fragility is adopted to describe the relationship between the degree of structural damage and the intensity of external loading, and is commonly defined as the probability that a structure reaches or exceeds a specified performance level under different load intensities. To quantify the influence of the ASA on the collapse resistance of the tower-line system, this section employs the incremental dynamic analysis (IDA) method. Fragility analyses are conducted on both the original model (M1) and the ASA-equipped model (M2).
According to fragility theory, the collapse fragility of a structure under different wind load intensities can be assumed as the conditional probability that the structural demand induced by wind loading exceeds or equals the corresponding performance limit state, given a specified wind intensity measure (IM). The mathematical expression of this definition is given as follows:
In the equation, PR denotes the conditional probability of structural collapse under a specified wind intensity measure (IM); EDP represents the engineering demand parameter of the structure; and DSi is the ith damage state of the structure.
The wind speed V is selected as the intensity measure (IM), while the ISDR is adopted as the EDP. Considering that wind load is proportional to the square of wind speed, it is assumed that the structural demand parameter EDP exhibits a log-quadratic relationship with the wind intensity measure IM, which can be expressed as follows:
In the equation, a, b, and c are the regression coefficients, which can be obtained through regression of the structural EDP under wind loading.
The conditional probability that the structure reaches the damage state DSi at a given intensity measure (IM) can be expressed as follows:
In the equations, denotes the standard normal cumulative distribution function and represents the logarithmic standard deviation of the EDP.
In pursuit of a balance between analytical accuracy and computational cost, the incremental dynamic analysis (IDA) was configured with 80 basic wind speed values (spanning 20 to 70 m/s) and four distinct wind attack angles (0°, 30°, 45°, and 90°). Consequently, a total of 640 nonlinear dynamic time-history analyses were performed. The maximum inter-story drift ratio (ISDR) along the two orthogonal directions (X and Y) was adopted as the engineering demand parameter (EDP) in each case.
Figure 12 presents the regression results for Model M1 under the four wind attack angles. As shown in Figure 12b, the data are highly dispersed. This scatter primarily stems from the randomness of the fluctuating wind load and the sensitivity of the structural response path after entering the nonlinear state. Especially under certain wind directions, the structure may be more sensitive to the turbulent components of the wind, resulting in significant variations in the maximum ISDR even at similar wind speeds. Our fragility model (log-quadratic relationship) and the calculated β-value already account for this uncertainty, and therefore the resulting failure probabilities are reasonable. Compared with Figure 12a, the data points in Figure 12c,d exhibit an overall downward shift, indicating that, under the same wind speed, the ISDR of the transmission tower is larger when subjected to 0° than that under the other wind directions.
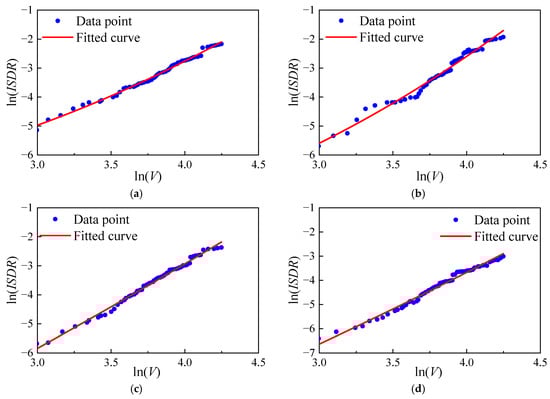
Figure 12.
Regression analysis of M1 under different wind attack angles: (a) 0°; (b) 30°; (c) 45°; (d) 90°.
Figure 13 presents the regression analysis results of Model M2 under four wind attack angles. Its variation pattern is generally consistent with that of M1, i.e., under the same wind speed conditions, the structural ISDR at 0° is larger than those at other attack angles. Further comparison between Figure 12 and Figure 13 shows that the scatter points in Figure 13 shift downward as a whole, indicating that under the same wind direction and wind speed conditions, Model M2 with additional ASA exhibits a smaller ISDR response compared to M1. By performing regression fitting on the data from each working condition, the parameters of the corresponding quadratic curves were obtained. The calculation results are listed in Table 3, and the structural vulnerability functions under different limit states were established based on Equation (19).
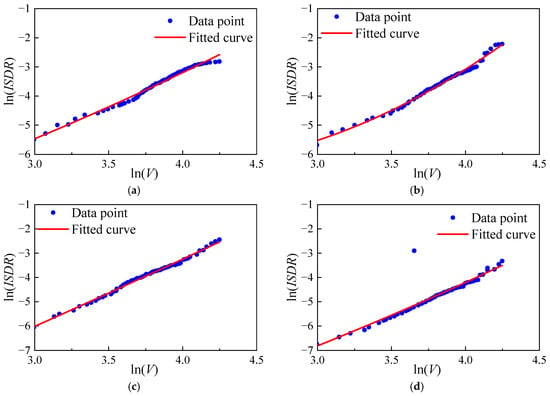
Figure 13.
Regression analysis of M2 under different wind attack angles: (a) 0°; (b) 30°; (c) 45°; (d) 90°.
Table 3.
Fitting results.
Figure 14 presents a comparison of the vulnerability curves between Models M1 and M2 under four wind attack angles. Here, M1 is represented by solid lines and M2 by dashed lines, and different colors correspond to different limit states. The vulnerability curves of M2 are generally shifted to the right compared to those of M1, indicating that the transmission tower-line system equipped with ASA has a lower probability of transitioning from the elastic to the plastic stage under the same wind speed, as well as a lower probability of progressing from plasticity to collapse or experiencing significant deflection. At 0°, the collapse critical wind speed for M1 is 32.6 m/s, while for M2 it increases to 35.1 m/s, representing an optimization effect of 7.7% provided by the ASA. At 30°, the collapse critical wind speed is 34.6 m/s for M1 and 37.5 m/s for M2, with an optimization effect of 8.4%. At 45°, the values are 38.1 m/s for M1 and 43.4 m/s for M2, yielding a 13.9% improvement. At 90°, the collapse critical wind speed significantly increases from 48.3 m/s for M1 to 59.4 m/s for M2, corresponding to a notable optimization effect of 23.0%.
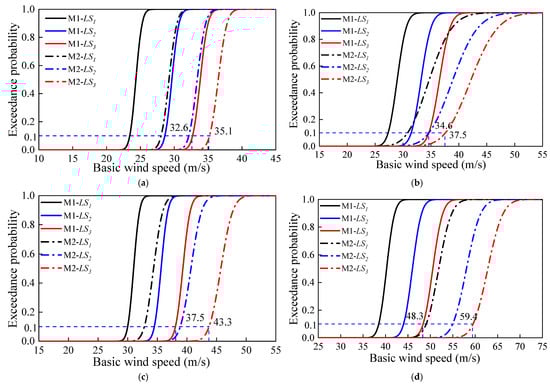
Figure 14.
Fragility curves of M1 and M2 under different limit states: (a) 0° M1 and M2; (b) 30° M1 and M2; (c) 45° M1 and M2; (d) 90° M1 and M2.
The analysis results indicate that after installing the ASA along the tower-line direction, the anti-collapse capacity of the tower-line system is enhanced under different wind directions. The most pronounced improvement is observed at 90°, while the enhancement is relatively limited at 0°. This discrepancy is related to the vibration mitigation orientation of the ASA. Since the primary damping direction of the ASA aligns with the tower-line direction, it exhibits the strongest suppression capability against wind-induced vibrations caused by the wind attack. During the damping process, the ASA engages in energetic interaction with the main structure, exerting a coupled influence on the system’s overall dynamic behavior. This interaction not only alters the primary response but also induces a degree of vibration reduction in the direction perpendicular to the tower-line axis, contributing to the enhanced anti-collapse performance of the system under 0° wind attack.
Under 30° and 45°, the wind load can be decomposed into components perpendicular to and along the tower-line direction. As mentioned, the response suppression effect is stronger along the tower-line direction than across it. Consequently, the improvement in wind-induced collapse resistance at 45° lies between those observed at 90° and 30°. Overall, installing the ASA along the tower-line direction can significantly enhance the wind collapse resistance of the transmission tower-line system. However, the degree of improvement is considerably influenced by the wind direction, with an enhancement of up to 23% achieved along the tower-line direction, compared to only 7.7% in the perpendicular direction.
5. Discussion
The nonlinear air-spring absorber (ASA) presented in this work offers a promising approach for augmenting the wind-induced collapse resistance of transmission tower-line systems. The control effectiveness of this device was systematically evaluated through refined finite element modeling, wind load simulation, and fragility analysis. Although the results indicate that the ASA can significantly improve the system’s anti-collapse capacity, particularly with the most pronounced effect along the tower-line direction, several issues warrant further discussion:
- The vibration reduction effect of the ASA exhibits significant direction dependency. At 90° (along the tower-line direction), the increase in collapse critical wind speed reached 23.0%, whereas it was only 7.7% at 0° (perpendicular to the tower-line direction). This discrepancy primarily stems from the alignment between the ASA’s installation orientation and its primary damping direction. This suggests that the probabilistic distribution of wind direction and the structure’s dominant vibration modes should be fully considered during the design and installation of the ASA.
- It should be emphasized that the reported improvement percentages in collapse critical wind speed—7.7% at 0°, 8.4% at 30°, 13.9% at 45°, and 23.0% at 90°—are derived from a specific case study based on a particular UHVAC transmission tower-line system with defined structural and loading parameters. Although these values illustrate a clear trend regarding the directional effectiveness of the ASA, they should not be interpreted as universal benchmarks applicable to all tower types, line configurations, or environmental settings. Furthermore, the effectiveness of the ASA may be influenced by terrain variability and ground roughness—factors that were modeled under Terrain Category B in the present study. Variations in topography and surface roughness can alter wind flow patterns, turbulence characteristics, and thus the dynamic structural response, potentially modifying the actual improvement achievable in projects situated in different geographical or exposure settings. Future research should incorporate a wider range of terrain types and site-specific wind models to further validate and generalize the performance of the ASA in diverse practical applications. While this study primarily evaluates the ASA’s effectiveness in mitigating collapse under extreme wind loads, the device’s adaptive nonlinear stiffness and broad operational bandwidth suggest its potential utility in managing other dynamic excitations, such as gust-induced vibrations or combined wind-ice scenarios. This prospect opens an interesting direction for future research on multi-hazard resilience of transmission tower-line systems.
- In the fragility analysis, the modified inter-story drift ratio (ISDR) was adopted as the collapse limit-state indicator. This metric can effectively characterize the inter-story deformation and global instability of tall lattice structures like transmission towers. However, the collapse of tower-line systems often involves multiple failure modes, such as member buckling and joint failure. Relying solely on ISDR may not fully capture the system’s damage evolution mechanism. Subsequent studies could incorporate multi-parameter damage indicators (e.g., stress, strain) to establish a more comprehensive collapse evaluation framework.
- As a novel damping device, the engineering applicability, cost effectiveness, and durability of the ASA require further validation in real-world environments. Particularly under long-term wind-induced vibrations, corrosive conditions, and extreme climates, the performance degradation mechanism of the ASA and its impact on the long-term structural safety deserve in-depth investigation. Future work could integrate structural health monitoring techniques to conduct long-term performance tracking and assessment of ASA implemented in operational transmission towers.
- The wind load model adopted in this study is based on the Kaimal spectrum, with a duration of 300 s and discretized loading applied segment-wise along the tower as the baseline scenario. It should be noted that this model entails certain uncertainties: the Kaimal spectrum may not fully capture the turbulence characteristics of extreme wind events; the 300 s duration may not account for fatigue effects associated with long-duration storms; and the segmented discretization simplifies the actual spatial continuity of wind pressure distribution. These factors could influence the shape and dispersion of the fragility curves. However, since the same wind model was consistently applied across all analyses, the comparative conclusions regarding the ASA versus the uncontrolled system remain robust. Future research will further assess the impact of these uncertainties on the quantitative evaluation of the control effectiveness by comparing different spectral models, durations, and loading methods.
- The nonlinear air-spring absorber (ASA) proposed in this study exhibits effective stiffness that varies nonlinearly with the displacement of the mass block, a behavior originating from the compressibility of the gas inside the air spring. This nonlinear hardening characteristic enables a unique adaptive energy transfer mechanism under strong wind conditions, particularly when the structure approaches its collapse limit state. As the structural displacement increases, the instantaneous equivalent stiffness of the ASA rises accordingly, allowing its natural frequency to dynamically “track” changes in the structural vibration characteristics. Consequently, even under extreme conditions where structural nonlinearity intensifies and conventional linear dampers may experience detuning, the ASA maintains effective dynamic coupling and continuously captures and dissipates energy from the primary structure. This mechanism not only delays the failure process of key structural components but also significantly enhances the robustness of the control system under limit states. Future research will further quantify the detailed influence of stiffness nonlinearity on energy transfer efficiency to guide the optimal design of the device.
- This study validates the effectiveness of ASA in a specific engineering model, laying a theoretical foundation for its engineering application. For practical deployment, three aspects require further investigation: first, the scalability and adaptive design of the device, i.e., how to standardize the design methodology of ASA and adapt it to transmission towers of different heights, types, and those located in complex terrains; second, construction constraints in existing towers, which necessitate a focused assessment of the impact of installing ASA on existing tower heads on the stress distribution and joint details of the original structure, as well as the development of convenient installation and maintenance procedures; and third, the synergistic mechanisms between ASA and other reinforcement strategies, such as exploring the feasibility of combining ASA with local strengthening of tower members or forming hybrid control systems with dampers based on different principles (e.g., viscous dampers), aiming to achieve an optimal balance between cost and effectiveness in multi-hazard defense. Future research will conduct in-depth design and comprehensive evaluations in these aspects, incorporating specific engineering cases.
In summary, the ASA device proposed in this study provides an effective approach for mitigating wind-induced collapse in transmission tower-line systems. However, there remains room for improvement in its design methodology, evaluation framework, and practical application. Through interdisciplinary collaboration and industry–academia partnerships, it is promising to further promote the adoption and application of this technology in real-world engineering.
6. Conclusions
To address the issue of collapse resistance control for transmission tower-line systems under strong wind loads, this paper proposes a nonlinear air-spring absorber (ASA) and systematically investigates its effectiveness in enhancing the system’s wind-induced collapse resistance. A refined finite element model of a tower-line system based on an actual engineering project was established. The working mechanism and design method of the proposed ASA were introduced. Subsequently, a fragility analysis was conducted on system models with and without the additional ASA, leading to the following main conclusions:
- (1)
- The wind direction significantly affects the system’s vulnerability to wind-induced collapse. Under identical wind speeds, the structural demand, quantified by ISDR, is generally higher for winds perpendicular to the line (0°) compared to oblique or parallel directions.
- (2)
- Across different wind attack angles, the collapse critical wind speed of the transmission tower-line system equipped with the ASA (M2) is higher than that of the original structure (M1), demonstrating that this device can significantly improve the system’s wind-induced collapse resistance.
- (3)
- Probability-based fragility analysis clearly quantifies the improvement in structural collapse resistance provided by the ASA. As the ASA is primarily installed along the tower-line direction, its vibration damping effect is most significant under 90° (along the tower-line direction), resulting in a 23.0% increase in the collapse critical wind speed. Even under 0° (perpendicular to the tower-line direction), the collapse resistance is improved by 7.7%, indicating that its control effectiveness is both directional and significant.
In summary, beyond quantifying the specific improvement in collapse wind speed (up to 23.0% along the line direction), a key contribution of this work is the demonstration that a nonlinear, adaptive device such as the ASA can be systematically integrated into a performance-based fragility assessment framework. This provides a practical and analytically robust strategy for mitigating wind-induced collapse in transmission tower-line systems, advancing the toolbox for resilience-oriented design and retrofit.
Author Contributions
C.-Y.Z.: Data curation, Formal analysis, Writing—original draft, and Software. Y.-C.J.: Formal analysis, Investigation, and Software. X.C.: Investigation, Data curation. G.-D.S.: Formal analysis, Data curation. J.-N.L.: Formal analysis, Software. L.X.: Investigation, Data curation. S.-Y.Z.: Methodology, Writing—review and editing, Investigation, and Validation. C.-S.M.: Writing—original draft, Software, and Formal analysis. L.T.: Conceptualization, Writing—review and editing. All authors have read and agreed to the published version of the manuscript.
Funding
This research received no external funding.
Data Availability Statement
The raw data supporting the conclusions of this article will be made available by the authors on request.
Conflicts of Interest
Authors Chongyang Zhang, Yuanchao Jia and Guodong Shao were employed by the company Powerchina Sepco1 Electric Power Construction Co., Ltd., Jinan, China. Authors Xu Cui, Junnan Liu and Liang Xiong were employed by the company Powerchina International Group Limited, Beijing, China. The remaining authors declare that the research was conducted in the absence of any commercial or financial relationships that could be construed as a potential conflict of interest.
Abbreviations
The following abbreviations are used in this manuscript:
| IDA | Incremental dynamic analysis |
| ISDR | Inter-Segment Displacement Ratio |
| IM | Intensity measure |
| EDP | Engineering demand parameter |
| IEC | International Electrotechnical Commission |
| LS | Limit state |
| PSD | Power spectral density |
| TMD | Tuned mass damper |
| ASA | Air-spring absorber |
| DS | Damage state |
References
- Li, J.; Zhang, C.; Fu, X. Wind-induced response analysis of the transmission tower-line system considering the joint effect. Int. J. Struct. Stab. Dyn. 2024, 24, 2450252. [Google Scholar] [CrossRef]
- Rong, K.; Tian, L.; Luo, J.; Wang, L. Study on wind-induced fatigue performance of large-span transmission tower-line system considering the combined distribution probability of wind direction and speed. Eng. Fail. Anal. 2024, 156, 107785. [Google Scholar] [CrossRef]
- Fu, X.; Li, H. Uncertainty analysis of the strength capacity and failure path for a transmission tower under a wind load. J. Wind. Eng. Ind. Aerodyn. 2018, 173, 147–155. [Google Scholar] [CrossRef]
- Vettoretto, G.; Li, Z.; Affolter, C. Evaluation of the ultimate collapse load of a high-voltage transmission tower under excessive wind loads. Buildings 2023, 13, 513. [Google Scholar] [CrossRef]
- Deng, H.; Xu, H.; Duan, C.; Jin, X.; Wang, Z. Experimental and numerical study on the responses of a transmission tower to skew incident winds. J. Wind. Eng. Ind. Aerodyn. 2016, 157, 171–188. [Google Scholar] [CrossRef]
- Phan, C.; Lee, S.; Kwon, S. Wind loads acting on transmission tower under combined yawed and tilted wind. J. Struct. Eng. 2025, 151, 04025184. [Google Scholar] [CrossRef]
- Wang, Z.; Yang, F.; Wang, Y.; Fang, Z. Study on wind loads of different height transmission towers under downbursts with different parameters. Buildings 2022, 12, 193. [Google Scholar] [CrossRef]
- Zhang, D.; Song, X.; Deng, H.; Hu, X.; Ma, X. Experimental and numerical study on the aerodynamic characteristics of steel tubular transmission tower bodies under skew winds. J. Wind. Eng. Ind. Aerodyn. 2021, 214, 104678. [Google Scholar] [CrossRef]
- Zhou, Q.; Zhao, L.; Chen, Z. Investigation on combined wind load factors of lattice transmission tower body under the action of skewed wind. KSCE J. Civ. Eng. 2021, 25, 2097–2104. [Google Scholar] [CrossRef]
- Li, J.; Gao, F.; Wang, L.; Ren, Y.; Liu, C.; Yang, A.; Yan, Z.; Jiang, T.; Li, C. Collapse mechanism of transmission tower subjected to strong wind load and dynamic response of tower-line system. Energies 2022, 15, 3925. [Google Scholar] [CrossRef]
- Wang, J.; Li, H.; Fu, X.; Dong, Z.; Sun, Z. Wind fragility assessment and sensitivity analysis for a transmission tower-line system. J. Wind. Eng. Ind. Aerodyn. 2022, 231, 105233. [Google Scholar] [CrossRef]
- Zhang, J.; Xie, Q. Failure analysis of transmission tower subjected to strong wind load. J. Constr. Steel. Res. 2019, 160, 271–279. [Google Scholar] [CrossRef]
- Li, J.; Wang, T.; Dong, Y.; Frangopol, D.; Li, Z. Fatigue reliability assessment of vortex-induced vibration for long flexible cylinders based on HOM-IMEM. Eng. Struct. 2026, 348, 121802. [Google Scholar] [CrossRef]
- Tian, L.; Zhang, X.; Fu, X. Fragility analysis of a long-span transmission tower-line system under wind loads. Adv. Struct. Eng. 2020, 23, 2110–2120. [Google Scholar] [CrossRef]
- Fu, X.; Li, H.; Li, G.; Dong, Z. Fragility analysis of a transmission tower under combined wind and rain loads. J. Wind. Eng. Ind. Aerodyn. 2020, 199, 104098. [Google Scholar] [CrossRef]
- Weng, L.; Yi, J.; Chen, F.; Shu, Z. Fragility assessment and reinforcement strategies for transmission towers under extreme wind loads. Appl. Sci. 2025, 15, 8493. [Google Scholar] [CrossRef]
- Kwon, K.; Choi, Y.; Choi, Y.; Han, W.; Kim, J.; Kong, J. Extended limit-collapsed surfaces using fragility analysis of high voltage transmission towers located in coastal areas under wind load. Adv. Struct. Eng. 2024, 27, 2116–2132. [Google Scholar] [CrossRef]
- Battista, R.; Rodrigues, R.; Pfeil, M. Dynamic behavior and stability of transmission line towers under wind forces. J. Wind. Eng. Ind. Aerodyn. 2003, 91, 1051–1067. [Google Scholar] [CrossRef]
- Wang, S.; Feng, K.; Bai, W.; Xu, Q.; Zhang, H. Analysis and research on dynamic response characteristics and influencing factors of transmission tower under earthquake action. Phys. Chem. Earth. 2025, 141, 104193. [Google Scholar] [CrossRef]
- Zhu, J.; Cao, X.; Zhang, Y. The relation between structural stress and cladding ice thickness of transmission tower on the condition of vibrate. Adv. Mater. Res. 2011, 1494, 1971–1974. [Google Scholar] [CrossRef]
- Wang, T.; Wang, Z.; Lu, D.; Tan, Y.; Li, Z. Galloping-induced global reliability assessment for ice-covered three-phase bundled conductors considering both mechanical and electrical functional failure modes. Reliab. Eng. Syst. Saf. 2025, 262, 111240. [Google Scholar] [CrossRef]
- Wang, T.; Dong, Y.; Wang, L.; Lu, D.; Hu, S.; Tan, Y.; Li, Z. Global reliability assessment of coupled transmission tower-insulator-line systems considering soil-structure interaction subjected to multi-hazard of wind and ice. J. Constr. Steel Res. 2024, 223, 109004. [Google Scholar] [CrossRef]
- Zheng, H.; Fan, J.; Long, H. Analysis of the seismic collapse of a high-rise power transmission tower structure. J. Constr. Steel. Res. 2017, 134, 180–193. [Google Scholar] [CrossRef]
- Liu, J.; Tian, L.; Ma, R.; Zhang, B.; Xin, A. Performance assessment and collapse prediction of a latticed tension-type transmission tower. Struct. Eng. Mech. 2021, 80, 15–26. [Google Scholar]
- Liu, J.; Tian, L.; Ma, R.; Qu, B. Development of a hysteretic model for steel members under cyclic axial loading. J. Build. Eng. 2022, 46, 103798. [Google Scholar] [CrossRef]
- International Electrotechnical Commission. Design Criteria of Overhead Transmission Lines: CEl/lEC 60826; International Electrotechnical Commission: Geneva, Switzerland, 2003. [Google Scholar]
- Den Hartog, J.P. Mechanical Vibrations; Courier Corporation: North Chelmsford, MA, USA, 1985. [Google Scholar]
- Marano, G.; Greco, R.; Trentadue, F.; Chiaia, B. Constrained reliability-based optimization of linear tuned mass dampers for seismic control. Int. J. Solids Struct. 2007, 44, 7370–7388. [Google Scholar] [CrossRef]
- Yu, D.; Li, Z.; Han, F.; Wang, Z. Performance-based wind resistance reliability analysis of UHV transmission towers. J. Disaster Prev. Mitig. Eng. 2013, 33, 657–662. (In Chinese) [Google Scholar]
- Dolsek, M. Incremental dynamic analysis with consideration of modeling uncertainties. Earthq. Eng. Struct. Dyn. 2009, 38, 805–825. [Google Scholar] [CrossRef]
- Bi, W.; Tian, L.; Li, C.; Ma, Z.; Pan, H. Wind-induced failure analysis of a transmission tower-line system with long-term measured data and orientation effect. Reliab. Eng. Syst. Saf. 2023, 229, 108875. [Google Scholar] [CrossRef]
Disclaimer/Publisher’s Note: The statements, opinions and data contained in all publications are solely those of the individual author(s) and contributor(s) and not of MDPI and/or the editor(s). MDPI and/or the editor(s) disclaim responsibility for any injury to people or property resulting from any ideas, methods, instructions or products referred to in the content. |
© 2026 by the authors. Licensee MDPI, Basel, Switzerland. This article is an open access article distributed under the terms and conditions of the Creative Commons Attribution (CC BY) license.