Abstract
High penetration and output volatility of island wind and photovoltaics (PV) pose challenges to energy consumption and supply–demand balance, and cost-effective energy storage configuration. A coupled dispatch model for a wind–PV–storage system is proposed, which treats multiple canal units as virtual ‘loads’ that switch between generation and pumping under constraints of power balance and available water head model. Considering the variable reservoir–irrigation feature, a multi-objective model framework is developed to minimize both economic cost and storage capacity required. An augmented Lagrangian–Nash product enhanced NSGA-II (AL-NP-NSGA-II) algorithm enforces constraints of irrigation shortfall and overflow via an augmented Lagrangian term and allocates fair benefits across canal units through a Nash product reward. Moreover, updates of Lagrange multipliers and reward weights maintain power balance and accelerate convergence. Finally, a case simulation (3.7 MW wind, 7.1 MW PV, and 24 h rural load) is performed, where 440.98 kWh storage eliminates shortfall/overflow and yields 1.5172 × 10⁴ CNY. Monte Carlo uncertainty analysis (±10% perturbations in load, wind, and PV) shows that increasing storage to 680 kWh can stabilize reliability above 98% and raise economic benefit to 1.5195 × 10⁴ CNY. The dispatch framework delivers coordination of irrigation and power balance in island microgrids, providing a systematic configuration solution.
1. Introduction
With the growing integration of distributed wind and photovoltaics (PV) into agricultural networks, the safe utilization of regional power has been threatened. It is necessary to optimize storage capacity configuration and economic dispatch. Then, coupled optimization of agricultural irrigation systems and renewable-energy microgrids have been attract significant attention.
Recent studies have focused on integrated irrigation-storage-renewable systems through novel modeling and optimization approaches. A multi-objective water-allocation model was developed that balances economic benefit, distribution fairness, and GHG emissions under uncertain supply [1]. Followed by which, an imprecise two-stage stochastic programming framework was used to optimize return- risk trade-off, and enhance robustness to extreme runoff variations [2]. An NN-RZWQM2 coupling model was used to improve root-zone soil moisture prediction, reducing stress risk and enhancing scheduling efficiency [3]. Including supply-and-demand-driven gate scheduling schemes based on river hydraulics simulations markedly optimized gate operations and accelerated water delivery [4].
To address renewable intermittency, a day-ahead stochastic model was introduced on wind smoothing coupling pumped hydro storage (PHS) with irrigation under consideration of power curtailment (EPC) and not-served (EPNS) indices [5]. Redefinition of PHS state of charge (SOC) constraints and integration of Copula-based joint distributions with CECG-VIKOR decision making achieved an 18% operational margin increase and 8% cost reduction [6]. An interval programming model for precipitation and crop-water uncertainty yielded 8–15% water savings in the Chinese Jinghui Canal region [7]. Assessment of 30,295 Australian farm dams for micro-PHS feasibility was verified, with unit storage costs 30% lower than Li-ion batteries [8]. A two-point estimation method in a day-ahead wind-PHS-irrigation dispatch framework significantly boosted economic and robustness metrics [9]. Hierarchical optimization and predictive control in a rural PV-PHS microgrid could cut electricity costs by over 3% [10]. Cost-effectiveness of remote irrigation systems was realized by integrating PV with mechanical storage via HOMER and MCDM optimization [11].
At the community scale, cost-optimal configuration analyses for island power systems revealed trade-offs between renewable penetration and storage requirements [12]. Shared storage and time-of-use pricing within a cooperative game framework enhanced equity and community-level energy optimization [13]. Reviews of off-grid hybrid sizing methods outlined prevailing approaches and future challenges [14]. Uwineza et al. proposed demand-side load shifting strategies based on TOU tariffs and swarm intelligence, reducing peak-valley differences by approximately 18% [15]. Monte Carlo-HOMER assessments quantified island microgrid economics and reliability [16]. Comparative studies of Particle Swarm Optimization and Differential Evolution heuristics provided insights for hybrid system optimization [17]. Experimental PV-PHS farmhouse systems demonstrated leveraging irrigation infrastructure for storage [18]. Reviews of PHS-BESS operations highlighted real-time hybrid storage challenges [19]. A bilevel canal scheduling model under hierarchical institutions demonstrated efficiency gains in the Chinese Hetao irrigation region [20].
More recently, dual-module coupled rolling optimization has been explored for hydro–wind–PV–battery complementary systems while considering battery capacity degradation [21], AI-based day-ahead electricity arbitrage has been studied for second-life battery stations [22], and steady-state convex bi-directional converter models have been proposed to enable high-efficiency economic dispatch of hybrid AC/DC microgrids [23].
Although substantial progress has been made on coupled irrigation-renewable-storage modeling and optimization, many works still simplify the interaction between capacity configuration and operational dispatch by treating them sequentially or only loosely coupled, so the obtained trade-offs may not be fully consistent with the same set of operational constraints. Moreover, water balance feasibility and cross-canal benefit-allocation stability are often handled implicitly or via ad hoc penalties, which may weaken reproducibility and reduce the interpretability of the resulting Pareto solutions.
To fill the above gaps, this paper develops an integrated ‘outer multi-objective evolution-inner MILP scheduling’ framework for wind–PV–storage–irrigation co-optimization. The key innovations are:
Innovation 1: A tightly coupled bi-level solving paradigm, where each candidate sizing/allocation vector generated by the outer AL-NP-NSGA-II is evaluated through an inner MILP scheduler to produce constraint-consistent optimal trajectories and objective values for Pareto evolution.
Innovation 2: A feasibility- and stability-enhanced evolutionary mechanism that combines augmented Lagrangian steering for under-/over-supply violations with a Nash product incentive for more balanced irrigation-benefit allocation, improving solution robustness and interpretability under the same scenario settings.
2. System Modeling
2.1. System Description
A wind–photovoltaic–storage system model that incorporates a variable reservoir–irrigation load is well suited to plateau and semi-arid regions. Taking the Keluke–Tuosu Lake basin in Qinghai Province of China as an example, as shown in Figure 1. Region PV power plants and wind farms supply electricity for pumped-storage, high-level reservoirs are flexibly dispatched to meet seasonal irrigation demands, and Keluke and Tuosu Lakes serve as continuous water sources for surrounding farmlands. Under the multi-energy complementary scheme, limited water resources are used with high efficiency, ensuring irrigation security while enhancing overall system performance.
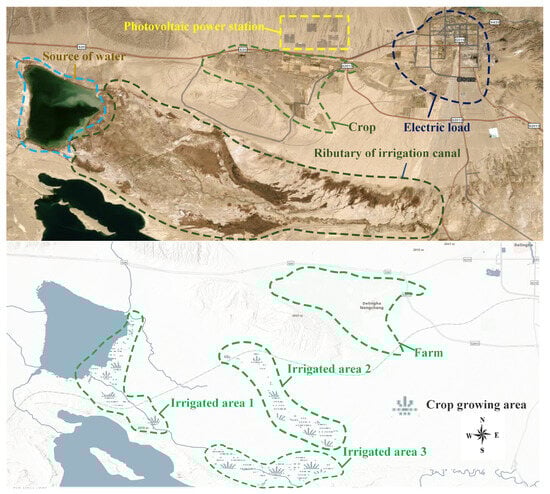
Figure 1.
Aerial schematic of the Keluke Lake region.
Figure 2 plots the dynamic annual water-requirement profiles of key crops in Qinghai Province using NREL public resource data for the Qinghai site in 2019: (a) wheat; (b) sorghum; (c) potato; and (d) soybean. The profiles clearly illustrate the spatiotemporal fluctuation patterns of crop water demand across different growth stages.
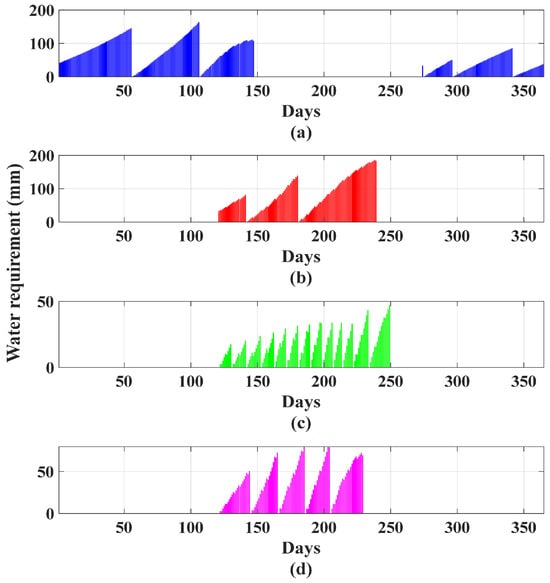
Figure 2.
Annual water demand characteristics of key crops in Qinghai province.
2.2. Power Interface Architecture
The system comprises five main components: wind power system, PV system, energy storage system, energy management center, and canal storage–irrigation system. The overall architecture is illustrated in Figure 3.
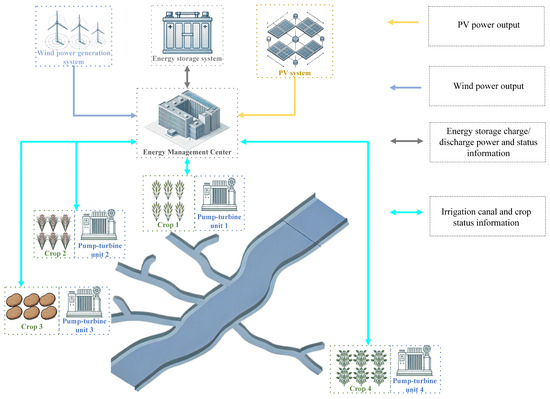
Figure 3.
Architecture of the wind–photovoltaic–storage system.
The wind and PV systems supply renewable electricity, and the storage units balance supply and demand. The canal storage–irrigation system consists of a canal pump–turbine unit and irrigation infrastructure. The pump–turbine unit is composed of variable-speed turbines, pumps, and an upper storage reservoir. During operation, the pumps use surplus electricity to lift downstream runoff or lake water into the upper reservoir; when the electrical load exceeds renewable output, stored water is released from the upper reservoir through a valve-controlled turbine to generate power, which is then delivered to the fields via the irrigation network. The energy management center coordinates storage throughput and canal pumping/turbining in real time to simultaneously meet agricultural irrigation demands and microgrid power balance requirements, achieving integrated water–energy optimization.
2.3. Pump–Turbine Unit Model
In the model, each canal unit is represented as a coupled pumping module and a hydropower generation module, i.e., two independent components coordinated for water–energy co-management, similar to the configuration reported in [10]. During surplus-power periods, the pumping module lifts water to the upper reservoir to absorb excess electricity. During high-demand periods, the stored water is released for irrigation, and the generation module converts the hydraulic energy into electricity to support the local load.
The upper-reservoir geometry and hydraulic head are defined in (1)–(3): (1) computes the storage volume from an elevation-dependent cross-section, (2) specifies the corresponding radius–elevation mapping, and (3) defines the effective head for the pump–turbine calculations.
where is the water volume in the upper reservoir. denotes the i-th pump–turbine unit, and t denotes time. is the water surface elevation in the upper reservoir, is the hydraulic head for power generation, is the fixed elevation difference in the upper reservoir, and is its bottom radius.
Irrigation canal power generation models are as follows: Formulas (4)–(8) characterize the generating (releasing) operation of the canal unit. Formula (4) evaluates the electric output following the adopted canal-based PHS representation [8], while the discharge relationship in (5) is taken from [4], and the corresponding released water volume is computed in (6). Formulas (7) and (8) introduce binary operating states and enforce the mutual-exclusion requirement between pumping and generation.
where is the discharge-generation power of the i-th pump–turbine unit at time t, ρ is the density of water (1000 kg/m3), is the gravitational acceleration (9.81 m/s2), is the hydraulic generation efficiency during discharge, is the discharge flow rate (m3/s), is the discharge cross-sectional region, and is the sampling interval. is a binary variable: if the unit is pumping (energy storage) during period t. is a binary variable: if the unit is generating (turbine).
The relationship model between pumping load and water volume of the irrigation canal is as follows: Formulas (9)–(13) describe the pumping operation and the associated state evolution. (9) computes pumping power consumption under the same canal-based PHS representation [8]; based on the dispatch interval, the pumped water volume is obtained in (10) following [4]. Formula (11) updates the reservoir water balance, and (12) and (13) define and update the pumped-hydro energy state used for subsequent scheduling.
where is the pumping power, μ is the pumping efficiency, is the pump discharge flow rate, is the volume of water pumped, is the water volume in the upper reservoir, is the maximum energy storage capacity, is the upper limit of hydraulic head, is the maximum allowable volume of the upper reservoir, and is the stored energy level.
2.4. Battery Energy Storage Model
SOC is defined as the ratio of stored energy to the battery’s rated capacity, which is modeled at time t as
where is the battery’s charging efficiency, is the battery’s discharging efficiency, is the battery’s charging power, is the battery’s discharging power, and is the battery’s rated capacity, = 24.
3. Optimization Model
3.1. Objective Functions
A multi-objective scheduling model is formulated that optimizes the operation of canal pump–turbine units and batteries to minimize operation and maintenance costs and storage requirements and maximize crop yields. The objectives are defined in (15), and the total cost is decomposed into standard components in (16)–(21).
In (15), is the economic objective, is the capacity objective, is the maintenance cost of the energy storage battery, is that of the canal pump–turbine units, is that of the wind and PV generation system, and is the agricultural revenue from the irrigated region.
In (16)–(21), is the per-unit throughput cost of the battery, is the energy output (kWh), is the operation and maintenance cost coefficient for the pump–turbine units, is the total number of pump–turbine units, is the unit operation and maintenance cost of the wind power system, is that of the PV system, is the wind power output at time t (kW), is the PV power output (kW), is the load demand (kW), is the actual irrigated region served by the i-th pump–turbine unit, is the actual irrigation water volume (m3), is the crop water-requirement depth (mm), and is the economic return per unit irrigated region.
3.2. Constraints
- (1)
- Power Balance Constraint:
This constraint enforces power balance at each time step.
- (2)
- Battery Energy Storage Constraints: Battery operational feasibility is imposed through the standard MILP constraint set in (23)–(28), with related BESS/bi-directional converter modeling treatments available in [23]. Specifically, (23) links the power rating to the energy capacity, (24) enforces SOC bounds, (25) and (26) prevent simultaneous charging and discharging, and (27) and (28) limit charge/discharge power via binary operating states.
4. Solution Method
A two-level optimization framework addresses irrigation depth–storage capacity trade-offs and discrete pump start/stop and storage scheduling decisions. The outer level applies AL-NP-NSGA-II to search for irrigation depth and storage capacity, balancing cost minimization, water supply accuracy, and channel fairness. The inner level employs a MILP–CPLEX model for precise pump station on/off and battery charge/discharge scheduling, yielding an integrated optimal configuration and operation.
4.1. Problem Decomposition
In the inner model, after obtaining the irrigation depth and storage capacity, the YALMIP interface in MATLAB (2022b) is used to call the CPLEX solver to solve discrete decisions such as pump station start/stop and energy storage scheduling, forming a feasible scheduling plan. A secondary scheduling is performed based on the water quantity complementarity mechanism, and the system’s economic cost is calculated.
4.2. Complementary Allocation Mechanism
After obtaining each canal’s discharge volume via the inner-level mixed-integer linear programming and comparing it with the nominal water requirement , a two-stage inter-canal complementary allocation mechanism is formulated to mitigate simultaneous surplus and shortage across canals, where (29)–(32) quantify demand/supply and surplus/shortfall and (33)–(38) implement the two-stage redistribution to obtain the final delivered water volumes.
Firstly, definitions of oversupply and undersupply
where is the nominal irrigation region (ha), is the water requirement, is the surplus water supply, is the deficit water supply.
Secondly, priority borrowing from adjacent canals: for each deficit canal i, water is first borrowed from its immediate neighbors .
where is the volume of water allocated from canal j to canal i in the first stage, is the surplus water supply of the j-th pump–turbine unit, and they are updated as follows:
Thirdly, system-wide reallocation: If deficits remain, water is secondarily borrowed from all non-adjacent canals by the same procedure.
where is the volume of water allocated from canal j to canal i in the second stage.
Adjusted supply volume: The total water borrowed from canal j to canal i after adjustment is given by
Final supply volume for canal i
where is the total water borrowed from all other canals to canal i, and is the total water lent from canal i to all other canals.
This mechanism first draws water from the nearest surplus canals and then performs a secondary allocation across the entire network, thereby improving conveyance efficiency, maximizing demand satisfaction, and ensuring overall water balance and resource utilization.
4.3. Nash Product-Based Incentive
The Nash product-based incentive is incorporated to promote fair benefit allocation across canals in (39)–(43). In this study, the canals are treated as heterogeneous stakeholders (different farms/crops with different benefit coefficients) that compete for limited water resources. Therefore, fairness is critical to avoid the optimization allocating most water to high-return canals while causing persistent under-irrigation and potential crop losses in low-return canals.
First, (39) defines the aggregate irrigation benefit from the canal-level benefits, which provides the basis for subsequent weight assignment. To avoid weight degeneration when some canal benefits are close to zero, (40) introduces a lower-bounded initial weight . The initial weights are then normalized in (41) to obtain the final weighting factors . Based on these normalized weights, (42) constructs the weighted Nash product (geometric-mean) incentive, and (43) scales and integrates it into the objective function as a reward term for the AL-NP-NSGA-II framework. At first, let denote the irrigation benefit of the i-th canal, which is as follows:
Furthermore, to prevent weight imbalance when some benefits are zero, assign each canal an initial weight :
where is a small positive constant, normalize the initial weights as follows:
Thirdly, compute the weighted geometric mean of benefits
Finally, multiplying by the reward-intensity coefficient yields the Nash reward:
4.4. Augmented Lagrangian Formulation
To enforce water balance feasibility, an augmented Lagrangian penalty is embedded into the objective to jointly handle shortfall and overflow. The shortfall and overflow violations are quantified by (44) and (45), and the combined penalty term with linear multipliers and a quadratic coefficient is constructed in (46). After each generation, the multipliers are updated according to the maximum observed violations via (47) and (48), thereby strengthening penalties for large deviations and guiding the population toward the feasible domain.
The detailed procedure is as follows:
Firstly, let the actual total water supplied to all canals be , and the total target irrigation volume be . Define the overflow threshold coefficient is 1.2. The shortfall volume and overflow volume are as follows:
Secondly, formulation of the augmented Lagrangian penalty term
where is the Lagrange multiplier for shortfall, is the Lagrange multiplier for overflow, and is the quadratic-penalty coefficient.
After each generation, the multipliers are dynamically updated based on the maximum deviation in that generation’s population:
where denotes the maximum shortfall observed in the current generation and denotes the maximum overflow observed.
4.5. Objective Function of AL-NP-NSGA-II Algorithm
Formula (49) defines the unified AL-NP objective by combining the economic cost with the Nash product incentive and the augmented Lagrangian penalty for irrigation-constraint violations.
where and quantify the shortfall and overflow (exceeding 120% of demand) deviations, respectively. The Lagrange multipliers , together with the quadratic penalty coefficient impose combined linear and quadratic penalties on these deviations to rigorously enforce the water balance constraint. The Nash reward term then computes a weighted geometric mean of each canal’s irrigation benefit and multiplies it by the strength factor , thereby lowering the minimization objective to promote equitable benefit distribution among canals. The second objective remains the storage capacity itself.
4.6. AL-NP-NSGA-II Algorithm
With the AL-NP-NSGA-II algorithm at its core and an inner MILP-based dispatch sub-model, the overall execution process is shown in Figure 4.
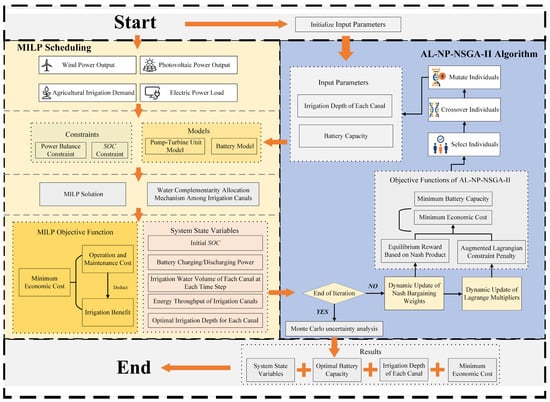
Figure 4.
Wind–photovoltaic–storage system integrated scheduling framework.
Figure 4 illustrates the proposed integrated outer multi-objective evolution–inner MILP scheduling framework, where each block plays a specific role and passes explicit inputs/outputs to the next block.
Scenario and parameter input: The framework imports wind–PV forecasts, load profiles, irrigation demands, and key parameters, forming the scenario data and constants used by both layers.
Outer-layer initialization (AL-NP-NSGA-II): The outer algorithm initializes the population and generates candidate decision vectors (e.g., sizing/allocation variables) for evaluation.
Inner-layer MILP scheduling: Each candidate is solved by the MILP scheduler under core constraints (SOC dynamics, charge/discharge exclusivity, canal pump–turbine exclusivity, reservoir dynamics, and power balance), producing an optimal dispatch trajectory.
Water complementarity and irrigation revenue evaluation: Based on the dispatch results, inter-canal water redistribution is evaluated, and the corresponding irrigation benefit/revenue is calculated.
Bi-objective construction with constraint steering: The outer layer builds the two objectives (economic performance and storage capacity), adds augmented Lagrangian penalties for under-/over-supply violations, and applies a non-equilibrium Nash mechanism to promote balanced benefits and stable solutions.
Evolution operators and population update: Non-dominated sorting and crowding-distance preservation guide selection, crossover, and mutation; multipliers and penalty coefficients are updated dynamically, and the next generation is formed.
Termination and Pareto set output: The process stops at the termination criterion and outputs the Pareto set capturing economy–capacity trade-offs.
Monte Carlo robustness assessment: Representative Pareto solutions are tested via Monte Carlo forecast perturbations to quantify reliability and economic variability, supporting robust sizing-and-scheduling conclusions.
4.7. Uncertainty Analysis
The selected optimal solution performs well under perfectly accurate forecasts, but real prediction errors of about ±10% are common. A Monte Carlo simulation applies ±10% perturbations simultaneously to wind speed, solar irradiance, and load, while incrementally increasing the shared storage capacity to assess its effect on power-supply reliability. The storage capacity that ensures at least 98% reliability while maintaining economic efficiency is then chosen as optimal.
5. Case Simulation and Analysis
5.1. Case Description
In December 2024, a 600 MW pumped-storage power station was commissioned in Delingha, Qinghai, featuring daily regulation as well as peak-shaving and valley-filling storage capabilities. Building on this project, the study integrates local wind, PV, and water resources to construct a microgrid including battery storage and four irrigation canal units.
5.2. Resource Parameters and Data
The data employed include load curves, wind and PV generation data, and system operational parameters. The load curve is obtained from the hourly load data of a typical day provided by the Energy Management System (EMS) of a rural community in Delingha, with a 1 h time step over 24 periods. Wind and PV generation data are based on measured operation records of the community’s wind turbines and PV modules, with installed capacities of approximately 3.7 MW and 7.1 MW, respectively. The irrigation system comprises four canal units serving regions of 60, 40, 70, and 30 ha; the minimum irrigation depth thresholds are 40, 50, 70, and 20 mm, respectively, with corresponding benefit coefficients of 110, 50, 80, and 100 CNY/ha. The AL-NP-NSGA-II algorithm is configured with a population size of 50 and a maximum of 100 iterations. The key parameters are summarized in Table 1.

Table 1.
Microgrid-related parameters.
A series of key parameters related to equipment operation (the battery charging/discharging efficiencies and ) adopt commonly used values as suggested in [8]; the irrigation-benefit coefficients () are estimated based on local crop yields and the associated economic returns; the initial augmented Lagrangian penalty coefficient μAL is selected according to the sensitivity analysis.
5.3. Results and Analysis
Figure 5 illustrates the typical daily load peaks and valleys, which cause demand not served and wind–PV curtailment. Figure 6 provides a macro view: when wind and PV output are insufficient, the pump–turbine units discharge water to generate power and fill the gap; when output is excessive, they switch to pumping to absorb the surplus energy. Figure 7 presents a micro breakdown of each canal unit’s power (positive values for generation, negative for pumping), overlaid with battery charge/discharge and load deviation curves, highlighting the variable-load capability—discharging in deficit periods and sharing pumping duties with the battery for rapid rebalancing in surplus periods. Together, these macro- and micro-level views confirm that integrated scheduling of pump–turbine units and battery can simultaneously satisfy power balance and irrigation demands under highly fluctuating renewable energy conditions.
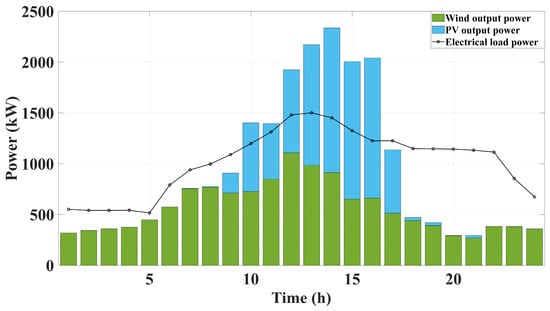
Figure 5.
The 24 h variations in wind, PV, and load.
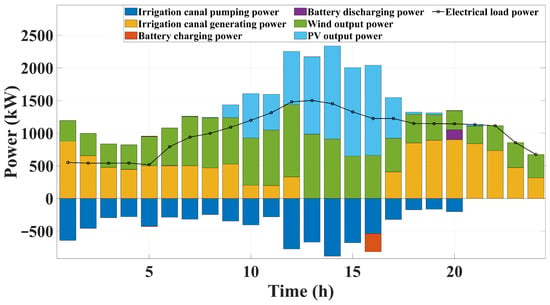
Figure 6.
Microgrid power balance.
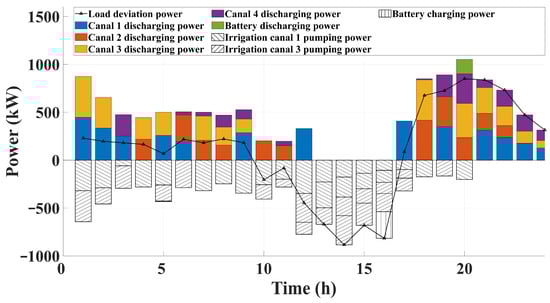
Figure 7.
Load deviation balancing under coordinated canal and battery scheduling.
Figure 8 Irrigation-depth profiles and inter-canal water transfers during dispatch: (a) Canal 1—on-site irrigation flow and water transferred from Canal 1 to Canal 3; (b) Canal 2—on-site irrigation flow and water transferred from Canal 2 to Canal 3; (c) Canal 3—on-site irrigation flow and supporting inflows from Canals 1, 2, and 4; (d) Canal 4—on-site irrigation flow and water transferred from Canal 4 to Canal 3. The results in Table 2 indicate that, during the dispatch process, the high-yield canals (Canals 1, 2, and 4) judiciously allocate part of their surplus irrigation water to support the lower-yield Canal 3 without causing any under-irrigation, thereby enabling an efficient complementary allocation of water resources.
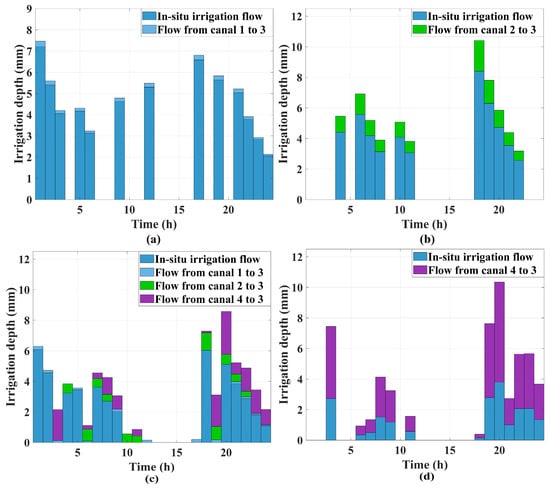
Figure 8.
Irrigation water scheduling.
Table 2.
Optimal individual irrigation scheduling results.
Specifically, within the multi-objective optimization framework of the AL-NP-NSGA-II algorithm—coupling mixed-integer linear programming with a canal water-complementarity strategy, the algorithm automatically determines and assigns the optimal irrigation depths, thereby reserving additional surplus water for the high-yield canals and enhancing the overall irrigation benefit. Furthermore, the dynamic exchange of live water among canals not only refines the irrigation schedule but also promotes aquatic ecosystem health and water-quality equilibrium.
5.4. Optimization Results
To validate effectiveness of the AL-NP-NSGA-II algorithm, which is compared with NSGA-II (the classic nondominated sorting genetic algorithm), NP-NSGA-II (NSGA-II augmented with a Nash product reward), and AL-NSGA-II (NSGA-II augmented with an augmented Lagrangian penalty). Under identical dispatch scenarios and parameter settings, each algorithm’s cost-optimization performance is assessed on the Pareto front to evaluate levels of constraint satisfaction.
As shown in Figure 9, during convergence, AL-NP-NSGA-II undergoes four stages: Phase 1 (initial high volatility) sees random population initialization causing simultaneous shortfall and overflow, and violent cost oscillations. Phase 2 (local equilibrium) dynamically updates augmented Lagrangian multipliers and Nash rewards to rapidly reduce overflow and shortage while fine-tuning canal depths and storage capacity along the Pareto front; in particular, the overflow is monitored against a prescribed hard limit, defined as 1.1 times the (12,000 m3), as indicated by the ‘overflow limit’ line in Figure 9. Phase 3 (leap optimization) around generations 40–50 witnesses the Pareto-optimal population abruptly jumping to a higher-performance region—overflow temporarily breaches its limit, triggering a cost inflection—signifying escape from local optima. Phase 4 (stable convergence) features shortages, overflows, and costs fluctuating within a narrow band, with any overflow around generation 80 swiftly corrected, while the Nash reward further enforces equitable canal returns, ultimately yielding a robust Pareto set balancing cost minimization, water balance accuracy, and fairness.
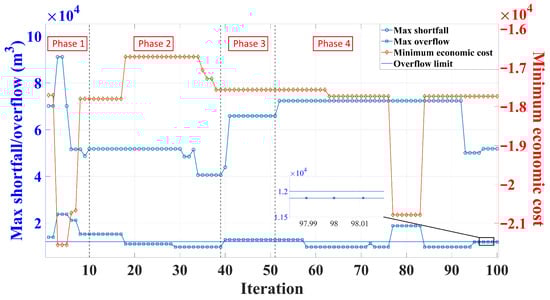
Figure 9.
Convergence trend of the AL-NP-NSGA-II algorithm.
As shown in Figure 10 and Figure 11, NSGA-II initially drives the economic cost down to about −2.0 × 10⁴ CNY but then stagnates, exhibiting the largest shortfall and overflow deviations. NP-NSGA-II, with its Nash product reward, further reduces cost to −2.22 × 10⁴ CNY, effectively pushing the Pareto front downward, but lacking hard constraints, its maximum surplus remains around 2.4 × 10⁴ m3, making surplus control difficult. AL-NSGA-II uses an augmented Lagrangian to enforce water balance constraints precisely, achieving a minimum cost of −1.76 × 10⁴ CNY and significantly reducing supply deviations, although with a slow response to violations and still instability. In contrast, AL-NP-NSGA-II combines both strengths, which quickly lowers cost to −1.78 × 10⁴ CNY before the 20th generation, and upon the first surplus event, promptly restores deficits and surpluses within their thresholds, maintaining low deviations throughout, thus achieving the best trade-off between cost minimization and water constraint satisfaction.
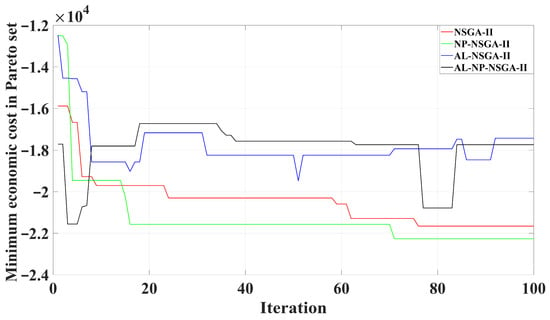
Figure 10.
Comparison of Optimal Economic Cost Convergence.
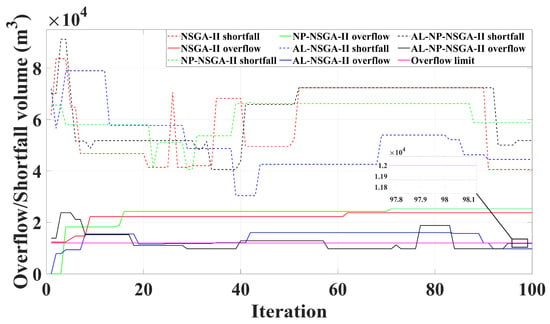
Figure 11.
Comparison of water constraint satisfaction.
As shown in Table 3, the four algorithms are compared in terms of constraint satisfaction, economic return, and battery capacity under the same scenario. NSGA-II and NP-NSGA-II, lacking hard constraints, both exhibit overflow, whereas AL-NSGA-II and AL-NP-NSGA-II eliminate both shortfall and overflow, demonstrating the advantage of the augmented Lagrangian approach. NP-NSGA-II achieves the highest return (1.6763 × 10⁴ CNY) but requires the largest battery capacity (504.36 kWh); AL-NSGA-II, at the cost of the smallest deviation (234.61 m3) and lowest storage (438.82 kWh), yields the lowest return (1.2065 × 10⁴ CNY); and AL-NP-NSGA-II, while strictly enforcing constraints, attains a balanced trade-off with a return of 1.5172 × 10⁴ CNY and 440.98 kWh storage, achieving the best overall performance.
Table 3.
Comparison of the best performances of four algorithms.
As shown in Table 4, increasing improves constraint satisfaction: the feasible ratio (i.e., the percentage of non-shortfall solutions in the final population) rises from 50.24% (1 × 10⁴) to 91.52% (1 × 10⁷). However, this feasibility gain comes with a clear trade-off in economic performance—the mean economic benefit decreases monotonically from 16,364.34 to 12,234.93, indicating that overly large penalties tend to over-prioritize feasibility and reduce the algorithm’s ability to explore high-benefit solutions. Meanwhile, = 1 × 10⁴ still allows overflow violations (‘Yes’), suggesting insufficient constraint enforcement. Overall, = 1 × 10⁵ provides the most balanced behavior: it eliminates overflow-threshold violations (‘No’) while maintaining a relatively high feasible ratio (78.72%) and preserving better economic benefit than larger penalties, making it a practical and stable default setting for subsequent experiments.
Table 4.
Sensitivity of the augmented Lagrangian penalty coefficient.
It can be derived from a Monte Carlo uncertainty analysis in which 100 stochastic scenarios are generated by applying ±10% perturbations to load, wind, and solar outputs, as shown in Figure 12, which illustrates how system reliability and average economic cost evolve with different energy storage capacities. The data show that as storage capacity increases from 440 kWh to 650 kWh, reliability climbs rapidly from 25% to over 80%, and then stabilizes above 98% at 680 kWh; meanwhile, average economic cost decreases continuously. In this study, a reliability level of 98% is regarded as an acceptable tolerance threshold under uncertainty. However, achieving full (100%) reliability requires boosting storage capacity to at least 760 kWh—which, although it guarantees absolute reliability, entails a substantial increase in capacity investment and markedly raises cost burdens. Thus, a storage capacity of approximately 680 kWh represents the optimal trade-off between high reliability and economic cost and is recommended as the system’s optimal configuration.
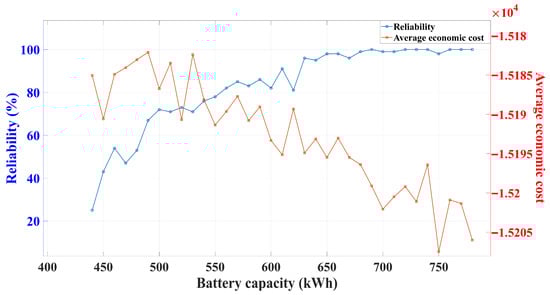
Figure 12.
Impact of battery capacity on system reliability and average economic cost.
6. Case Analysis and Discussion
A ‘wind–photovoltaic–storage–irrigation’ integrated dispatch model was developed because high renewable penetration and strong output volatility in off-grid islanded microgrids not only challenge local consumption and supply–demand balance, but also impose stringent requirements on battery sizing and economic performance. Based on comparative experiments, the proposed framework shows clear effectiveness in jointly improving feasibility, stability, and cost performance. In particular, an augmented Lagrangian–Nash Product enhanced NSGA-II algorithm (AL-NP-NSGA-II) was proposed: the augmented Lagrangian component enforces key constraints more precisely, while the Nash product incentive encourages more balanced benefit allocation among canals. Under all constraints, the algorithm achieves rapid convergence and minimum operating cost. The results further indicate that the system can maintain a stable reliability above 98%, while improving economic returns from 1.5172 × 10⁴ CNY to 1.5195 × 10⁴ CNY, thereby providing practical guidance for storage-capacity configuration and selection. Notably, the proposed innovation points have been applied in two invention patents and have entered real-world trial deployment (CN119695888A; CN118713152A).
7. Conclusions and Future Work
The proposed integrated dispatch strategy successfully unifies agricultural irrigation operation and grid-level peak-shaving, satisfying both water and power demands within a single optimization framework. The results demonstrate strong robustness and cost-effectiveness, suggesting that the method provides a systematic and deployable solution for off-grid island applications.
The proposed integrated dispatch strategy successfully unifies agricultural irrigation operation and grid-level peak-shaving, satisfying both water and power demands within a single optimization framework. Quantitatively, the proposed AL-NP-NSGA-II achieves a favorable trade-off by attaining an economic benefit of 1.517 × 10⁴ CNY with only 440.98 kWh of battery capacity, while eliminating the overflow violations observed in baseline algorithms. Under Monte Carlo uncertainty analysis with 100 stochastic scenarios (±10% perturbations applied to load, wind, and PV outputs), system reliability rises above 98% at approximately 680 kWh, whereas reaching 100% reliability requires about 760 kWh, indicating a clear cost–reliability trade-off. The results demonstrate strong robustness and cost-effectiveness, suggesting that the method provides a systematic and deployable solution for off-grid island applications.
Future research will focus on integrating real-time forecasting with online adaptive optimization to enable closed-loop dispatch. Meanwhile, we will explore algorithm lightweighting and the incorporation of additional objectives (e.g., carbon emissions and equipment lifespan) to further improve applicability in practical systems.
8. Patents
The innovation points have been applied for two invention patents and have been entered into the actual trial (CN119695888A; CN118713152A).
Author Contributions
J.-h.Z.; methodology, J.-h.Z. and Y.H.; software, J.-h.Z. and Y.H.; validation, J.Z. (Jun Zhang), K.L., and J.Z. (Jiwei Zhu); formal analysis, K.L.; investigation, Y.H.; resources, X.Z.; data curation, Y.H., J.Z. (Jun Zhang), and Y.G.; writing—original draft preparation, J.-h.Z. and Y.H.; writing—review and editing, J.G. and X.Z.; visualization, X.Z.; supervision, X.Z.; project administration, J.G.; funding acquisition, J.G. All authors have read and agreed to the published version of the manuscript.
Funding
This research was funded by the Innovative Research Group Project of the National Natural Science Foundation of China (Innovative Research Group Project), grant numbers 52377117 and 52377104.
Data Availability Statement
Data are available from the corresponding author upon reasonable request.
Conflicts of Interest
No conflict of interest exists in the submission of this manuscript, and the manuscript is approved by all the authors for publication. I would like to declare on behalf of my co-authors that the work described is original research that has not been published previously, and not under consideration for publication elsewhere, in whole or in part. All the authors listed have approved the manuscript that is enclosed.
References
- Li, M.; Xu, Y.; Fu, Q.; Singh, V.P.; Liu, D.; Li, T. Efficient irrigation water allocation and its impact on agricultural sustainability and water scarcity under uncertainty. J. Hydrol. 2020, 586, 124888. [Google Scholar] [CrossRef]
- Li, M.; Fu, Q.; Singh, V.P.; Liu, D.; Gong, X. Risk-based agricultural water allocation under multiple uncertainties. Agric. Water Manag. 2020, 233, 106105. [Google Scholar] [CrossRef]
- Gu, Z.; Zhu, T.; Jiao, X.; Xu, J.; Qi, Z. Neural network soil moisture model for irrigation scheduling. Comput. Electron. Agric. 2021, 180, 105801. [Google Scholar] [CrossRef]
- Fan, Y.; Chen, H.; Gao, Z.; Fan, Y.; Chang, X.; Yang, M.; Fang, B. Water distribution and scheduling model of an irrigation canal system. Comput. Electron. Agric. 2023, 209, 107866. [Google Scholar] [CrossRef]
- Zhang, M.Y.; Chen, J.J.; Yang, Z.J.; Peng, K.; Zhao, Y.L.; Zhang, X.H. Stochastic day-ahead scheduling of irrigation system integrated agricultural microgrid with pumped storage and uncertain wind power. Energy 2021, 237, 121638. [Google Scholar] [CrossRef]
- Wu, Y.; Chen, R.; Lin, Z.; Chen, Y.; Chen, Z.; Chen, X.; Yuan, J. Day-ahead scheduling model for agricultural microgrid with pumped-storage hydro plants considering irrigation uncertainty. J. Energy Storage 2024, 95, 112468. [Google Scholar] [CrossRef]
- Gong, X.; Zhang, H.; Ren, C.; Sun, D.; Yang, J. Optimization allocation of irrigation water resources based on crop water requirement under considering effective precipitation and uncertainty. Agric. Water Manag. 2020, 239, 106264. [Google Scholar] [CrossRef]
- Gilmore, N.; Britz, T.; Maartensson, E.; Orbegoso-Jordan, C.; Schroder, S.; Malerba, M. Continental-scale assessment of micro-pumped hydro energy storage using agricultural reservoirs. Appl. Energy 2023, 349, 121715. [Google Scholar] [CrossRef]
- Ghasemi, A. Coordination of pumped-storage unit and irrigation system with intermittent wind generation for intelligent energy management of an agricultural microgrid. Energy 2018, 142, 1–13. [Google Scholar] [CrossRef]
- Mousavi, N.; Kothapalli, G.; Habibi, D.; Das, C.K.; Baniasadi, A. A novel photovoltaic-pumped hydro storage microgrid applicable to rural areas. Appl. Energy 2020, 262, 114284. [Google Scholar] [CrossRef]
- Yousef, B.A.A.; Amjad, R.; Alajmi, N.A.; Rezk, H. Feasibility of integrated photovoltaic and mechanical storage systems for irrigation purposes in remote areas: Optimization, energy management, and multicriteria decision-making. Case Stud. Therm. Eng. 2022, 38, 102363. [Google Scholar] [CrossRef]
- Gioutsos, D.M.; Blok, K.; van Velzen, L.; Moorman, S. Cost-optimal electricity systems with increasing renewable energy penetration for islands across the globe. Appl. Energy 2018, 226, 437–449. [Google Scholar] [CrossRef]
- Iweh, C.D.; Akupan, E.R. Control and optimization of a hybrid solar PV-Hydro power system for off-grid applications using particle swarm optimization (PSO) and differential evolution (DE). Energy Rep. 2023, 10, 4253–4270. [Google Scholar] [CrossRef]
- He, Y.; Guo, S.; Dong, P.; Zhang, Y.; Huang, J.; Zhou, J. A state-of-the-art review and bibliometric analysis on the sizing optimization of off-grid hybrid renewable energy systems. Renew. Sustain. Energy Rev. 2023, 183, 113476. [Google Scholar] [CrossRef]
- Uwineza, L.; Kim, H.G.; Kim, C.K. Feasibility study of integrating the renewable energy system in Popova Island using the Monte Carlo model and HOMER. Energy Strategy Rev. 2021, 33, 100607. [Google Scholar] [CrossRef]
- Javed, M.S.; Ma, T.; Jurasz, J.; Canales, F.A.; Lin, S.; Ahmed, S.; Zhang, Y. Economic analysis and optimization of a renewable energy based power supply system with different energy storages for a remote island. Renew. Energy 2021, 164, 1376–1394. [Google Scholar] [CrossRef]
- Javed, M.S.; Ma, T.; Jurasz, J.; Ahmed, S.; Mikulik, J. Performance comparison of heuristic algorithms for optimization of hybrid off-grid renewable energy systems. Energy 2020, 210, 118599. [Google Scholar] [CrossRef]
- Mousavi, N.; Kothapalli, G.; Habibi, D.; Das, C.K.; Baniasadi, A. Modelling, design, and experimental validation of a grid-connected farmhouse comprising a photovoltaic and a pumped hydro storage system. Energy Convers. Manag. 2020, 210, 112675. [Google Scholar] [CrossRef]
- Mahfoud, R.J.; Alkayem, N.F.; Zhang, Y.; Zheng, Y.; Sun, Y.; Alhelou, H.H. Optimal operation of pumped hydro storage-based energy systems: A compendium of current challenges and future perspectives. Renew. Sustain. Energy Rev. 2023, 178, 113267. [Google Scholar] [CrossRef]
- Zhou, S.; Hu, T.; Zhu, R.; Wu, F.; Wang, X. A bilevel modeling approach for optimizing irrigation canal scheduling under a hierarchical institutional arrangement. Agric. Water Manag. 2023, 284, 108322. [Google Scholar] [CrossRef]
- Ding, X.; Mao, C.; Guo, P.; Xiong, J.; Xu, Z.; Sun, W.; Harrison, G.P. Dual-module coupled rolling optimization for hydro-wind-PV-battery complementary system: Considering battery capacity degradation. J. Energy Storage 2025, 134, 118104. [Google Scholar] [CrossRef]
- Kırat, O.; Çiçek, A.; Yerlikaya, T. A New Artificial Intelligence-Based System for Optimal Electricity Arbitrage of a Second-Life Battery Station in Day-Ahead Markets. Appl. Sci. 2024, 14, 10032. [Google Scholar] [CrossRef]
- Liang, Z.; Chung, C.Y.; Zhang, W.; Wang, Q.; Lin, W.; Wang, C. Enabling high-efficiency economic dispatch of hybrid AC/DC networked microgrids: Steady-state convex bi-directional converter models. IEEE Trans. Smart Grid 2025, 16, 45–61. [Google Scholar] [CrossRef]
Disclaimer/Publisher’s Note: The statements, opinions and data contained in all publications are solely those of the individual author(s) and contributor(s) and not of MDPI and/or the editor(s). MDPI and/or the editor(s) disclaim responsibility for any injury to people or property resulting from any ideas, methods, instructions or products referred to in the content. |
© 2026 by the authors. Licensee MDPI, Basel, Switzerland. This article is an open access article distributed under the terms and conditions of the Creative Commons Attribution (CC BY) license.