Abstract
This paper presents an analytically derived optimal control strategy for wound-rotor synchronous machines (WRSM) based on minimising the Joule losses in both the stator and rotor windings. The presented control strategy is analysed in terms of analytical derivation, machine current ratios, working regions and constraints. It is experimentally verified on a salient-pole wound-rotor synchronous machine with strongly non-linear equivalent circuit parameters. The verification was performed in two stages: first, considering constant equivalent circuit parameters while assessing strong non-linear behaviour of the machine leading to significant discrepancies in the resulting machine torque. In the second stage, after determination of non-linear machine parameters using measured flux maps, identical control methodology is analysed in terms of variations in ratios between machine currents. Using pre-calculated current ratios the same control methodology is extended for machines with strongly non-linear equivalent circuit parameters and verified in a real environment. The measurement confirms expected machine behaviour in all available control regions achievable by used synchronous motor as well as limits between these control regions. The results of the verification in a real environment show a discrepancy of approximately 5% in measured machine torque in comparison to expected value confirming the validity of the analytically derived approach and introduced modifications for machines with non-linear equivalent circuit parameters.
1. Introduction
Wound-rotor synchronous machines (WRSMs) are traditionally used in power generation as generators in large power plants, but in recent decades they have also become a subject of interest in the automotive industry [1,2,3] resulting in an increasing number of their applications [4,5,6], whereas in most applications the salient pole rotor topology is preferred due to the presence of reluctance torque, which can be advantageously used for torque production in light-load regimes. Their advantages in terms of machine control outweigh their disadvantages, which are mostly related to a more complicated mechanical design in comparison to other electrical machines. On the other hand, the WRSMs offer easier and more effective field-weakening possibilities at high speeds in comparison to permanent magnet synchronous machines (PMSM) while having higher torque at high speeds in comparison to induction machines (IM). The possibility of controlling the field-winding current also results in higher machine efficiency in low loads compared to permanent magnet synchronous machines. [7] On the other hand, while comparing to other machine types, the control of a WRSM involves a combination of three currents—direct (d-) and quadrature (q-) axes currents id and iq, as known from IMs and PMSMs, supplemented by the field-winding current If.
The current state of the art offers various different approaches to optimize wound-rotor synchronous machine control, whereas the main target is achieving possibly the most efficient machine control by combinations of machine currents id, iq and If. The combinations of these currents may be obtained using various techniques, starting with measurement and selection of the most efficient current combinations similar to [8] up to the usage of computationally very demanding optimization tools as in [9].
One of the often-used tools is the use of finite element method (FEM) software, either for the generation of machine flux maps and determination of maximal torque [10] or for the calculation of several loss components like iron core losses [11]. The finite element software then also offers the possibility of usage of more sophisticated optimization tools as in [12]. However, all the aforementioned approaches share a common drawback: they require precise knowledge of the machine topology to construct an accurate finite element model, making the optimization process computationally expensive. The result of these control techniques is then a lookup table including relations between torque requests and minimal possible current values.
The time necessary for the setup of the lookup table may be partially reduced by analytical calculation of machine losses [13,14,15]. The losses may be pre-calculated offline or as a part of the machine control loop by using Ferrari’s method [16] or using a separate control module as in [17]. However, these techniques lack a completely analytically derived machine control model.
A wound-rotor synchronous machine control method presented in [18] is based on the maximum torque per ampere criterion used in case of permanent magnet machines, as published in [19]. The method presented in [18] uses MTPA-calculated currents as a reaction to variable machine excitation, and as a result, it minimises losses on the stator side only. An improvement in efficiency is further achieved by using the Kalman filter and gradient descent method for torque maximization, which is introduced in [20].
A partially analytical approach is presented in [21] using optimization with the Lagrange approach and additional multiplier. The optimization is focused on loss minimization, whereas the machine non-linearity is further considered using measured machine data; nevertheless, a complete analytically derived control model is in this case still missing. A purely analytical solution is presented in [22]; while the conclusions of the calculations relate to the WRSM optimal control region, no verification of results is presented, and no proposal of solution of machine non-linearity problem is proposed.
A different approach to machine control is then formed by feedforward control strategies which offer unification of machine control as presented in [23] and in [24], eventually supported by neural network optimization [25] for real-time implementation. These techniques offer an interesting way of machine control and solution of machine non-linearity problems, but they lack a deeper insight into machine function, as they are oriented more on machine control based on estimated data than its analysis.
This paper further describes an analytically derived method for wound-rotor synchronous machine control based on the minimization of armature and field-winding losses, which is generally usable for any wound-rotor synchronous machine. The method itself is based on consideration of constant equivalent circuit parameters, but using measured machine parameters and their current dependencies it may be easily modified to any machine with non-linear equivalent circuit parameters without the necessity of time-demanding analyses and optimization processes, as demonstrated in the article later.
In contrast to the aforementioned techniques, the proposed control strategy is predicated on a purely analytical determination of the relationships between machine currents. This approach offers deeper insight into the underlying machine physics compared to methods reliant on empirical observation (e.g., measurements) or numerical simulations (e.g., finite element analyses). Its analytical foundation renders it inherently suitable for real-time implementation. Consequently, when compared with established control techniques, the presented strategy represents a compact, robust, and computationally efficient alternative, as it allows direct calculation of required currents from torque request without utilizing additional advanced algorithms or calculation techniques necessary for usage of other control strategies presented in [8,9,10,11,12,13,14,15,16,17,18,19,20,21] and [23,24,25].
However, as demonstrated in [22], the practical applicability of a purely linear analytical model can be constrained by magnetic saturation effects. Specifically, in this paper, a similar fundamental base as in [22] is used, whereas a different solution of the field-weakening operation is introduced. Because of usage of a similar theoretical base, the resulting relations result in a very similar form while pinpointing differences with [22] in several results and assessing the non-linearity problem leading to the necessity of modification of one of the obtained results. Since [22] does not offer any solution to the non-linearity problem, this limitation is thoroughly addressed herein by incorporating non-linear machine parameters identified using measured flux maps [26], as detailed subsequently in this paper with all necessary conclusions.
The presented control strategy is further verified on a wound-rotor synchronous machine with salient pole rotor topology. As the previous overview shows, this topology is currently preferred in the automotive industry [1,2,3,4,5,6], hence usage of this type of machine forms a suitable test bench for demonstration of usability of this control strategy in automotive applications—it features a non-negligible reluctance torque component, demonstrates expected non-linear behaviour resulting from rotor pole shoes saturation and also possible saliency reversal resulting from saturation effects in high current regions.
2. Wound-Rotor Synchronous Machine Control Regions
From a mathematical perspective, during operation, the machine is constrained by the relationship defining its torque as depending on machine currents:
where m is the number of machine phases
- p is the number of its pole-pairs
- Ld, Lq are machine inductances in the d and q axes
- id, iq are currents in d and q axes
and ψf is the field-winding flux linkage defined as
where g is the field current transformation factor
- Lf’ is the field-winding inductance referred to the stator
And If is the field-winding current.
Consequently, these currents form a right triangle either in the form of voltages (in complex form; phasors are denoted by overlines)
or in the form of flux linkages
where v is the machine terminal voltage
- Ra is machine armature resistance
- ψa is machine armature flux linkage
- ei is machine back electromotive force
and ω1 is the power supply angular frequency.
These currents generate I2R (or Joule) losses, which need to be minimised:
where Rf is machine field-winding resistance.
The limiting factors are then maximal machine voltage given by machine rated voltage vr and maximal stator current imax and maximal field-winding current Ifmax.
2.1. Maximum Torque per Joule Loss Control Region
To achieve optimal control of the wound-rotor synchronous machine, a proportional variable defining the ratio of torque to Joule losses may be defined. While neglecting mechanical and iron core losses, it is defined by
The optimal control point then forms the maximum of function t(id, iq, If), whereas the existence and location may be proved by calculation of the machine torque map (see Figure 1a), Joule loss map in the id-iq plane (Figure 1b) and drawing their ratio (Figure 1c). While considering constant machine equivalent circuit parameters there is one maximum and one minimum of t(id, iq, If), both of them symmetrically located around iq = 0 A axis and each moving along a line starting in the origin of the coordinate system together with the increase in the excitation current. Hence, based on this observation a certain ratio between both currents exists, which provides information about optimal values of both currents.
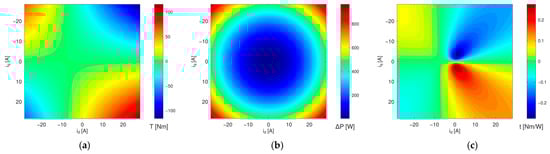
Figure 1.
(a) Machine torque map, (b) Joule loss map and (c) their ratio as defined by function t(id, iq, If).
The extrema of function t(id, iq, If) may be located via setting the partial derivatives with respect to each current to zero, i.e., the target is the solution of following equation system:
which allows the determination of the optimal combination of direct axis current id, quadrature axis current iq and field-winding current If for required machine torque.
While looking for the extrema of function t(id, iq, If) in id-If plane, it is necessary to find the solution for Equations (7) and (9), whereas the results of each partial derivatives result
and
The conditions of (7) and (9) are met, when the numerators of the results are equal to zero, i.e., the target is to find the solution of quadratic equations
and
whereas in case of (12) the variable of the equation is (in order with (7)), the direct axis current id and in case of (13) the variable is field winding current If, according to (9). The solutions of these equations are:
It is apparent that the combinations of resistances and inductances gather in both equations, thus it is advantageous to introduce substitutions as resistances factor:
and inductances factor:
which simplify further writing of derived equations. In Equations (14) and (15), both positive and negative signs can be used in the context of direct and field winding currents, whereas for the purpose of minimisation of Joule losses, these currents must support each other during the machine duty; i.e., both currents need to have positive values to create superposing magnetic fields. Thus, for further progress only the positive sign is considered for consequent calculations.
Now it is possible to substitute resistances and inductances factors into (14) and (15) and move separate currents (If in (14) and id in (15)) to the left side of the equation. After multiplication of (15) by inductances factor kL, the relations (14) and (15) are modified to:
In (18) and (19) the left sides of both equations are identical, therefore the right sides also must be, thus they may be compared in a single equation:
Now we can derive the quadrature axis current from (20) as
Using substitution by iq2 to (18) and after the solution of the resulting quadratic equation we obtain two solutions for ratio of direct and field axis currents. The first,
violates previously stated requirement of identical signs for both currents, whereas the second solution directly gives the optimal excitation factor:
Using (23) it is possible to substitute by field winding current If back to (21) and to obtain the optimal currents component factor:
The last remaining ratio is the ratio between the field winding current and the quadrature axis current, the optimal electromagnetic torque factor, which results directly from (23) and (24) as:
As a result, the optimal control of a WRSM is achieved when the ratios of machine currents meet the requirements given by (23) to (25), i.e., according to machine load the machine phasor diagram scales from no-load up to maximal load achievable by optimal control. Similar conclusions were simultaneously presented in [22] with slight differences in sign in comparison to (25), and (24), which in [22] is missing. The limits of the optimal control region are then given by maximal field current Ifmax, rated stator magnetic flux linkage ψar or rated voltage of the machine vr, while the current trajectory in (id, iq, If) space projects as a straight line for constant machine parameters. In the case of the machine phasor diagram view, the voltage/flux linkage triangle scales with required machine power while keeping the ratios between its edges, i.e., the machine power factor and torque angle remain during optimal duty of the machine constant.
Since the abovementioned control approach keeps possibly the lowest sum of all currents and therefore also total Joule losses, it will be further referred to as the maximum torque per joule loss (MTPJ) control, especially for distinction from the maximum torque per ampere (MTPA) control and its relevant working region.
2.2. Maximum Torque per Ampere Control Region
As mentioned above, the MTPJ control region is limited in lower speeds by the value of the field-winding current. Above this limit the machine keeps static excitation, i.e., it behaves in a similar way as a permanent magnet synchronous machine. In this control region, the traditional MTPA control strategy [19] is applied to minimise stator winding losses, as the rotor already operates at its maximal losses.
2.3. Adaptive Field-Weakening Control Region
At higher speeds, where the maximum torque achievable by the MTPJ control strategy is limited by machine rated voltage vr, the field-winding current is adaptively decreased to cover the whole speed span of the machine. In this region the maximum field-winding current according to the MTPJ results
while the maximum field-winding current in the field-weakening region given by machine properties is
or by real maximal field-winding current defined by the machine manufacturer, IfMax.
Between these two field-winding current values it is advantageous to linearly scale the machine excitation to obtain the required torque. The limiting torque values are in this case the maximal torque achievable by optimal control via MTPJ
where the value iqMaxOpt is derived from
For the purpose of determination of maximal achievable torque in the field-weakening region it is advantageous to use the voltage-oriented torque equation for synchronous machines
which can be modified to a form using magnetic flux linkages
The value of maximal available torque is then proportional to the torque angle, which maximal value may be derived by setting the partial derivative of torque with respect to the torque angle to zero, i.e., solving the relation
After modification, Equation (32) reduces to a quadratic equation
whose roots give the cosine of the maximal torque angle in field-weakening region
To simplify the expression, an additional field-weakening factor can be introduced
and while considering target interval of the solution (cos β ∈ <−1; 1>), the maximal achievable torque angle is
and related maximal torque
Knowing the limits of the field-weakening region in terms of torque and field-winding current, the field-winding current may be in field-weakening operation adaptively increased according to
After determination of the field winding current, the field winding magnetic flux linkage can be calculated and the direct and quadrature currents are derived from field-weakening relations presented, e.g., in [27]. Such a field-weakening strategy with a consecutive increase in field-winding current then ensures the lowest possible increase in winding losses while achieving maximal possible torque on the limit of the adaptive field-weakening (aFW) region.
2.4. Wound-Rotor Synchronous Machine Optimal Control Regions
A schematic drawing of available control regions is shown in Figure 2. In comparison to other machine types, the optimal control region defined by MTPJ is present over the whole speed span of the machine, i.e., it can be optimally controlled at any speed, at least with low torque.
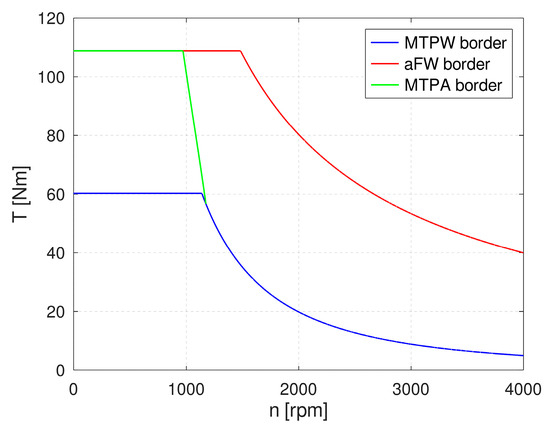
Figure 2.
Schematic drawing of WRSM control regions.
The MTPA control region forms an addition over the MTPJ control region in case its field current is limited more strictly than the stator current. In case the stator current is limited by a more strict limitation than the field-winding current, the MTPA control region does not have to be present.
The last control region is formed by the adaptive field-weakening control region. In this region the machine has reached its rated voltage, and this limitation is reflected by adaptive scaling of the field-winding current according to (38) and other current components resulting from the traditional field-weakening calculation.
2.5. Transitions Between WRSM Control Regions
Basically, during the duty of the wound-rotor synchronous machine three types of transition may be observed—transition between MTPJ control region and MTPA control region, transition between MTPJ and aFW control region and finally the transition between MTPA and aFW control region. The borderlines between control regions where these transitions appear to coincide with current constraints are defined by either machine properties or optimal control by the MTPJ strategy.
The transition from the MTPJ to the MTPA and vice versa corresponds with limitation of the field winding current as defined by machine properties. Below the borderline between the MTPJ and MTPA, the field winding current may be freely modified according to the requirements of relations (23) to (25). In this region the field winding current (as well as direct and quadrature axis currents) is linearly scaled according to the required torque up to the maximal allowed value. After reaching the borderline, the field winding current has reached its maximal value and it cannot be further increased, i.e., the machine excitation is then fixed and the MTPA control strategy is used.
In higher speeds, the MTPJ control regions neighbours with the aFW control region. In this case the limiting factor is the maximal optimal field winding current, IfMaxOpt, as defined by (26). Until reaching this current value the field winding current is scaled according to MTPJ relations (23) to (25). In higher torque values the field winding current is linearly scaled so the maximal field winding current IfMaxFW, which is given by machine properties, corresponds with maximal field-weakening torque TMaxFW, as defined by relations (35) to (37). In the aFW region the slope of the field winding rise function changes from the slope defined by MTPJ control factors to the slope included in (38) as further denoted as kf in (40).
In contrast to both previous cases, the transition between MTPA and aFW control regions cannot be defined as a continuous function defining the borderline by a unique condition from both sides of the borderline. The cause of this fact is given by different behaviour of the MTPA and the aFW control regions in higher torque values. While the MTPA already considers a fixed field current on one side of the borderline, the aFW control strategy still allows variation in the field winding current on the other side. From the implementation point of view this would lead to a possibility that in a certain speed range the machine would go through all three control regions with increasing torque—starting with MTPJ until reaching maximal field current, then to MTPA and after reaching its borderline the field current should be steeply decreased while transiting to the aFW. To improve the stability of the machine control this effect should be avoided, therefore the MTPA to aFW borderline is considered as a line at a constant speed corresponding with the MTPJ characteristic breakpoint.
2.6. Overall Behaviour of the Wound-Rotor Synchronous Machine Under Optimal Control
The behaviour of all currents and the total machine efficiency map generated using currents calculated according to the abovementioned approach is shown in Figure 3. As seen from the figures, the field-winding current value is kept minimal in low torques over the whole speed range of the machine, ensuring minimal required direct axis current, which leads to minimal iron core losses. The field-winding current at high speeds increases only with an increase in required torque, which also leads to a higher requirement of direct axis current used for stator side field-weakening. In comparison to permanent magnet synchronous machines, the efficiency of the machine remains very high up to the machine maximal speed. The transitions between control regions show a smooth appearance, i.e., no steep changes in any current are present in the whole working range. In case of the field winding current, a well observable area where the aFW neighbours to the MTPA control region is located. In this area the field winding current can be decreased from its maximal value, which is used in the MTPA region.
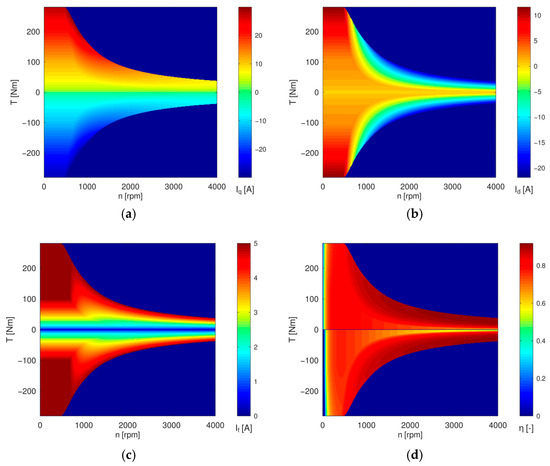
Figure 3.
Calculated (a) quadrature axis current, (b) direct axis current, (c) field winding current and (d) efficiency maps based on proposed control strategies.
3. Experimental Verification
The experimental verification of the above presented control method was conducted on a test bench comprising the tested wound-rotor synchronous machine EM Brno SVY 132M-4 coupled through a BURSTER 8661-5200 torque sensor [28] to a SIEMENS 1LE1001-1DB43 induction machine acting as a load. The rated parameters of used wound-rotor synchronous machine are presented in Table 1.

Table 1.
Nameplate values of machine EM Brno SVY 132M-4.
The experimental verification was performed in two consecutive stages:
- Verification of the machine control using measured constant equivalent circuit parameters.
- Verification of the machine control using non-linear equivalent circuit parameters derived from measured WRSM flux maps
In the case of both measurements, a custom-built converter connected to a PC via MLC interface was used for the WRSM control and measurement. The input data for the converter were pre-calculated machine currents id, iq and If, while the current, voltage and torque response of measured machine were observed using converter voltage and current sensors and a torque sensor, respectively. A schematic layout of the whole test bench (Figure 4) is shown in Figure 5.
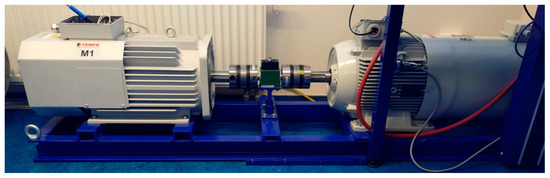
Figure 4.
Test bench used for measurement: wound-rotor synchronous machine EM Brno SVY 132M-4 (left), torque sensor BURSTER 8661-5200 (middle) and induction machine SIEMENS 1LE1001-1DB43 (right).
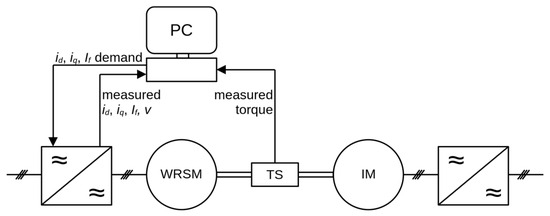
Figure 5.
Schematic layout of used test bench (WRSM = tested machine, TS = torque sensor, IM = induction machine).
4. Control Properties While Considering Linear Parameters
The equivalent circuit parameters of the tested machine were determined using standard tests for synchronous machines as defined in the international standard [29] in order to obtain control factors as defined in Section 2. The measured equivalent circuit parameters are shown in Table 2.
Table 2.
Measured equivalent circuit parameters of machine EM Brno SVY 132M-4.
The verification of usability of constant equivalent circuit parameters was tested at a constant speed of 300 rpm, whereas using measured equivalent circuit parameters the current requests for control of the machine were calculated using GNU/Octave [30] and the resulting torque was observed. The WRSM acted as a motor while the induction machine was kept in speed mode to act as load and to maintain a constant speed for the whole machinery. The results of the measurement comparing expected and measured torque values in the MTPJ region are shown in Figure 6.
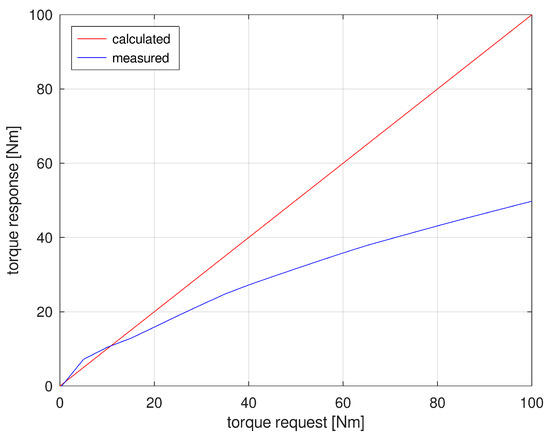
Figure 6.
Comparison of control torque demand (red line) and torque response (blue line)in case of considering constant equivalent circuit parameters.
As indicated by the measurement results, the real torque of the machine is significantly lower than its expected value. This torque difference is caused by machine saturation, which leads to variations in machine equivalent circuit parameters preventing the direct application of Equation (1), especially in high current values, where cross-saturation and non-linear effects distort the torque production. As a result, the MTPJ factors vary, i.e., used machine currents were not able to achieve the requested torque as machine parameters changed with its load.
5. Control Properties While Considering Non-Linear Parameters
As ascertained by measurement in Section 4, in a real environment, the wound-rotor synchronous machine forms a strongly non-linear system, in which all parameters depend on all machine currents, id, iq and If. This non-linear behaviour is given by the machine physical properties and its geometry—saturation of the steel around the whole magnetic circuit of the machine as well as local saturation in pole tips, teeth, etc., which manifests as non-linear behaviour of all control factors derived in (17) and (23) to (25).
5.1. Wound-Rotor Synchronous Machine Flux Maps
To obtain non-linear dependencies of measured machine equivalent circuit parameters the machine flux maps were measured according to methodology presented in [26]. Since the flux maps represent measurements in different machine working states from low to high saturation while using current values in a wide range, they represent saturation effects propagating into machine behaviour. The equivalent circuit parameters derived from measured flux maps then include cross-saturation and distortion of equivalent circuits parameters allowing the usage of Equation (1) in the whole machine working range.
The flux maps were measured parametrically for field-winding current If from 2 A to 5 A in 1 A steps, for direct axis current id from −30 A to 10 A in 2.5 A steps and for quadrature axis current iq in the range from −35 to 35 A in 2.5 A steps. The resulting flux maps in both machine axes, field-winding flux linkage and machine torque maps are shown in Figure 7. When considering the density of measured flux maps, the resolution of measured flux maps was chosen to be relatively coarse in order to verify the validity of the proposed control strategy even with a relatively limited dataset which can be obtained during a fast measurement during converter commissioning. This approach introduces a certain control error, but on the other hand it also demonstrated the behaviour of the control in a real environment, where a quick drive setup is required.
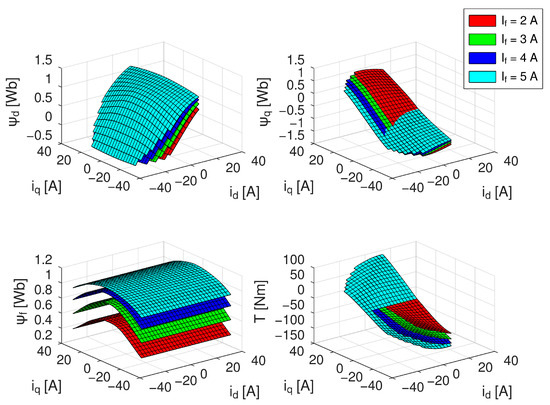
Figure 7.
Measured flux maps in direct axis (left top) and quadrature axis (right top), from field-winding (left bottom) and measured total torque (right bottom) for various field-winding currents.
5.2. Wound-Rotor Synchronous Machine Equivalent Circuit Parameters
By using measured machine flux maps, the machine inductances were derived, allowing the following calculations to choose each parameter for each combination of currents id, iq and If. The calculated machine inductances are shown in Figure 8, whereas in the right bottom of the figure a comparison of direct and quadrature inductances for field-winding current If = 5 A is shown.
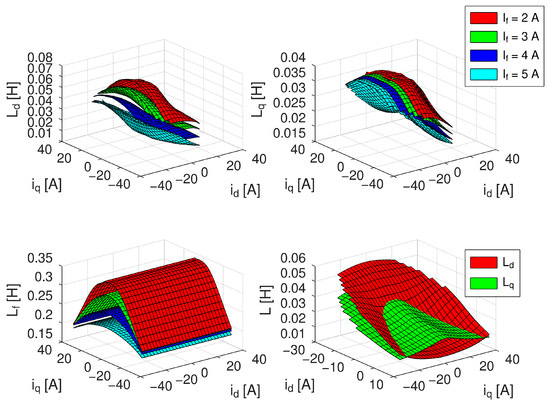
Figure 8.
Machine inductances derived from measured flux maps, direct axis inductance (left top), quadrature axis inductance (right top), field-winding inductance (left bottom) for various field-winding currents and comparison of direct and quadrature axes inductance for field-winding current 5 A (right bottom).
From the comparison of direct and quadrature inductances in Figure 8 an additional property of the machine becomes apparent: in a relatively large region of low stator currents and high field-winding current the machine reverses its saliency—instead of the commonly considered relation Ld > Lq accepted for wound-rotor synchronous machines, the value of quadrature axis inductance is higher than the value of direct axis inductance, i.e., Ld < Lq. This region corresponds to regions where the rotor magnetic flux superposes with stator magnetic flux. In this state the magnetic circuit of the whole machine is strongly saturated, which decreases especially the direct axis inductance, which reflects saturation of both stator and rotor components.
The quadrature axis inductance is less affected, as its properties are given mainly by properties of the air gap and the inter-pole region, which forms a magnetically linear environment. The decrease in the quadrature axis inductance is therefore given by saturation of the stator and rotor pole shoes only.
5.3. Maximum Torque per Joule Loss Control Factors
The WRSM control factors calculated from the obtained equivalent circuit parameters are shown in Figure 9. The optimal control factors are strongly non-linear, as well as the machine inductances. In comparison to the presumption of constant values, the values of optimal control factors vary within orders, even from positive to negative values. The main cause of this behaviour is the variability of machine inductances in inductance factor kL, which varies almost symmetrically around zero. On the other hand, the only MTPJ factor, which can be considered as an approximately constant number, is the optimal electromagnetic torque factor kT, whose value changes in the order of several percent even for variable field winding current magnitudes. A similar torque discrepancy would be then expected, if this factor would be considered as a single constant number.
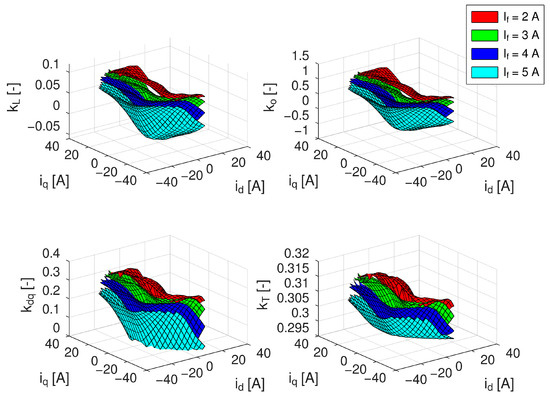
Figure 9.
Calculated factors for MTPJ control region inductance factor (left top), optimal excitation factor (right top), optimal current components factor (left bottom) and optimal electromagnetic torque factor (right bottom) for various field-winding currents.
An important mathematical effect is observed in the calculation of the optimal current components factor—due to the presence of square exponent and square root, this factor loses information about its correct sign. Therefore, the formulation of the kdq factor according to (24) must be modified to
to correctly consider its sign and to have the function of the kqd factor continuous in its whole range. The graphical interpretation of the optimal current components factor according to (39) is shown in Figure 10.
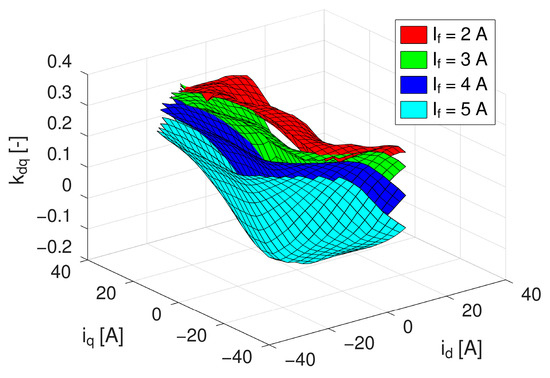
Figure 10.
Optimal current components factor for various field-winding currents considering its correct sign.
5.4. Adaptive Field-Weakening Control Factors
Due to the machine saliency variation pointed out in Figure 9, the field-weakening factor kFW exhibits the behaviour of a discontinuous function around the line, where the difference of (Ld–Lq) changes its sign, as results from (35). Although this behaviour may lead to inconsistent results, the dependencies of maximal torque angle and maximal torque are continuous functions. The graphical interpretations of these variables, calculated for machine rated speed and limited field-winding current to If = 5 A, supplemented by the graphical interpretation of the slope function of field-winding current
in adaptive field-weakening region are shown in Figure 11.
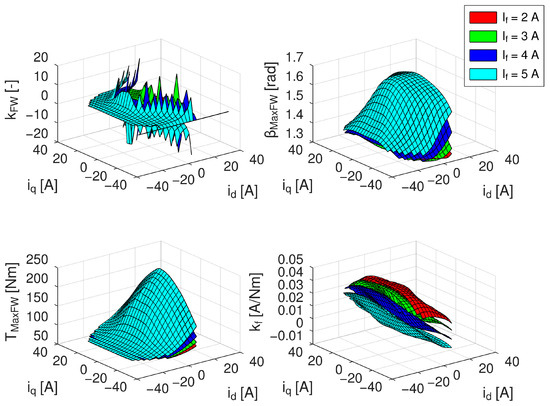
Figure 11.
Field-weakening factor (left top), maximal achievable torque angle (right top), maximal achievable torque for limited field-winding current (left bottom) and slope of field-winding current in the adaptive field-weakening region (right bottom).
6. Experimental Verification of Optimal Wound-Rotor Synchronous Machine Control Strategy
Using calculated equivalent circuit parameters and optimal control factors, the current trajectories for verification of the control strategy were calculated in GNU/Octave using interpolation of obtained equivalent circuit parameters and iterative calculation of the target working point. The experimental verification of the control strategies was performed along the following torque-speed dependencies:
- constant speed of 300 rpm, pure MTPJ region
- constant speed of 1000 rpm, transiting from MTPJ to MTPA region
- constant speed of 1500 rpm, transiting of MTPJ to aFW region
- speed range 0 to 1800 rpm, upper limit of MTPJ region
- speed range 0 to 1800 rpm, upper limit of MTPA and aFW regions
The input data for the measurement were current trajectories pre-calculated using non-linear machine parameters determined in Section 5. The load machine was set in constant speed mode for measurements 1 to 3, so the torque response is based on current values only and allows verification of the torque-current relationship. In the cases of measurements 4 and 5, the current trajectories were supplemented by speed information, so both machines were rotating synchronously at identical speed while passing the speed ramp. The measured curves represent unfiltered full-range data obtained during a single measuring run.
6.1. Maximum Torque per Joule Loss Control Region
The region of pure MTPJ control corresponds with the applicability of control factors defined in Section 2.1. In the case of constant equivalent circuit parameters, all optimal control factors should be constants, and the expected current trajectory in the MTPJ region would be then a straight line. Considering real equivalent circuit variations the current trajectory in (id, iq, If) space forms a curve with constantly increasing currents iq and If, whereas the direct axis current id keeps a low-value transiting between positive and negative values. The calculated current trajectory for measurement in the MTPJ control region is shown in Figure 12. The measurement was performed at 300 rpm while considering limitation of the field winding current to If = 5 A. Since the MTPJ region is limited by field winding current value, the machine is not able to reach its rated torque of 70 Nm and reaches maximal torque under optimal operational conditions, which is in this case 53 Nm only.
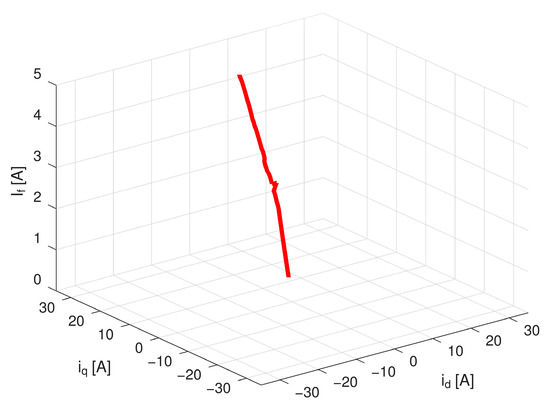
Figure 12.
Current trajectory in (id, iq, If) space for MTPJ control strategy.
The comparison of current demands, expected and measured torque are shown in Figure 13. According to measurement results the torque of the machine follows the predicted line with approximately 5% error, which needs to be further compensated for either by more precise measurement of equivalent circuit parameters or using a feedback loop, which was not used during the measurement. The direct axis current component peak at approximately t = 20 s is a result of error in numerical approximation of the equivalent circuit parameters while calculating id. This error may be further compensated for by a more detailed flux maps measurement.
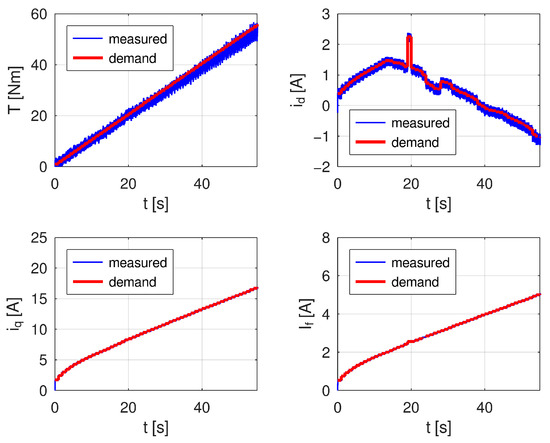
Figure 13.
Comparison of current demands and measured currents and resulting torque as expected and measured.
6.2. The Transition from Maximum Torque per Joule Loss to Maximum Torque per Ampere
The transition from MTPJ to MTPA control region was measured at a speed of 1000 rpm. The calculation of the MTPJ trajectory was performed using the previously described approach while after reaching field-winding current If = 5 A; the current trajectory was calculated using a solution of quartic equations of the MTPA control strategy. From the current trajectory point of view, therefore, the current follows the trajectory according to Figure 12 until reaching maximal field-winding current, while other points are located at the level of If = 5 A in the (id, iq) plane, and the current follows the MTPA current curve until reaching maximal machine current, which was limited to imax = 30 A. The whole trajectory is shown in Figure 14.
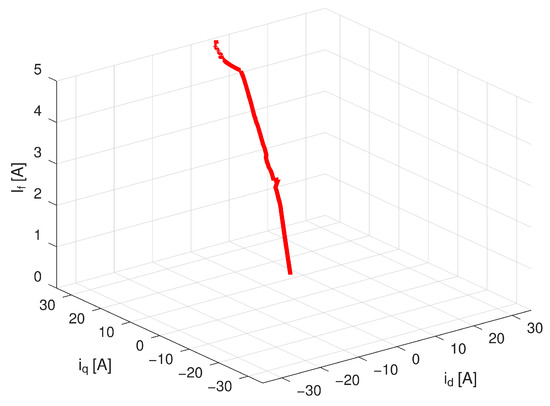
Figure 14.
Current trajectory in (id, iq, If) space for MTPJ control strategy transiting to MTPA.
The comparison of expected and measured data is shown in Figure 15. The measurement shows a similar discrepancy of approximately 5% as in the previous case, but also proves smooth transition from the MTPJ control region to the MTPA, which may be observed at approximately 55 s. At this time point the current curves (except field-winding curve stopping at If = 5 A) act as continuous functions, as the machine torque does.
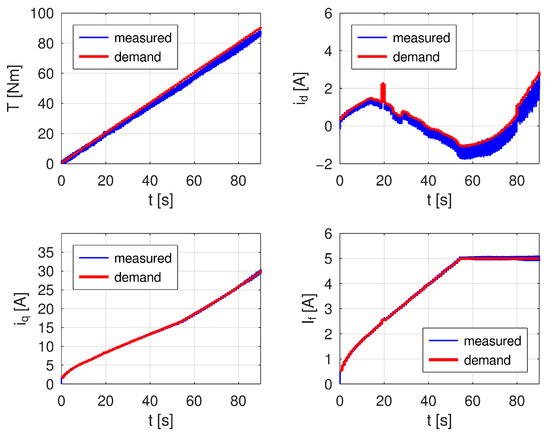
Figure 15.
Comparison of current demands and measured currents and resulting torque as expected and measured.
6.3. The Transition from Maximum Torque per Joule Loss to Adaptive Field-Weakening Control Region
The verification of the transition from the MTPJ control region to the aFW control region was measured at the rated speed of the machine (n = 1500 rpm), where the aFW region forms more than 50 per cent of the whole control range of the machine. The trajectory was calculated according to the relations presented in Section 2.1, followed by relations according to Section 2.3 starting from the point where the rated voltage of the machine is reached. In this case, the field current utilises its whole control range, i.e., it uses the range from 0 to 5 A in a full range of currents id and iq. The control limitations are in this case rated voltage vr = 325 V (phase voltage amplitude) and maximal current imax = 30 A. The current trajectory is shown in Figure 16.
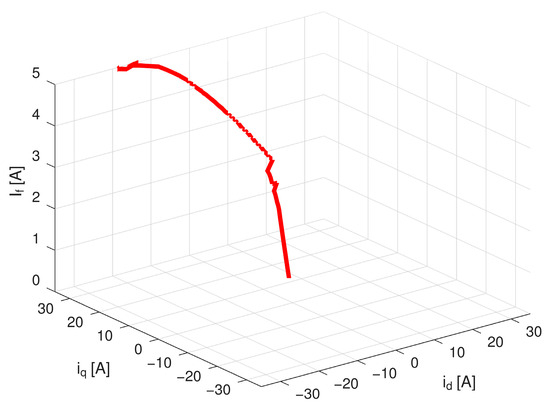
Figure 16.
Current trajectory in (id, iq, If) space for MTPJ control strategy transiting to adaptive field-weakening.
The measured data (see Figure 17) show similar precision of approximately 5% in torque as in previous cases. The transition between MTPJ and aFW may be observable at the time of approximately 25 s, whereas both stator currents show smooth behaviour, while in the case of the field-winding current, there is a mild step, which results from the transition between control strategies. This step corresponds with the field-winding current approximately If = 3 A, and above this current the field-winding current increases linearly according to (38). Although this step change is observable in the field current curve, the total torque of the machine is not affected, and it increases linearly during the whole measurement.
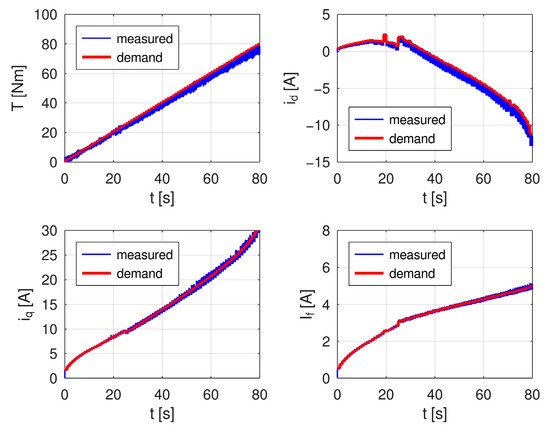
Figure 17.
Comparison of current demands and measured currents and resulting torque as expected and measured.
6.4. Wound-Rotor Synchronous Machine Optimal Control Constraints
To verify the limits of control regions, the voltage/current constrained torque-speed curves were measured for each region. In both cases pre-calculated current trajectories supplemented with speed information were used as input data for controlling the converter and machine, while currents, voltage and torque were measured. During the measurement the machine was accelerated to its maximal speed and decelerated back to standstill, so each value was measured twice—once during speedup, once during slowdown.
The values of currents on the upper limit of the MTPJ control region in the speed range of 0 to 1800 rpm were calculated considering voltage limitations to obtain the maximal torque-speed curve of the MTPJ control strategy. The measured time curves are shown in Figure 18, whereas the projections of measured data as depending on machine speed are shown in Figure 19.
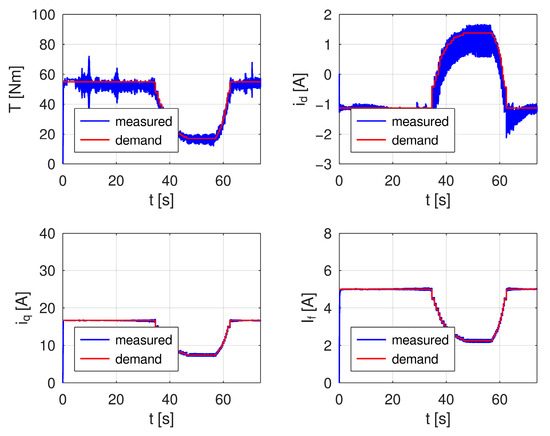
Figure 18.
Time dependencies of torque and current demands compared with measured data on the upper limit of the MTPJ control region.
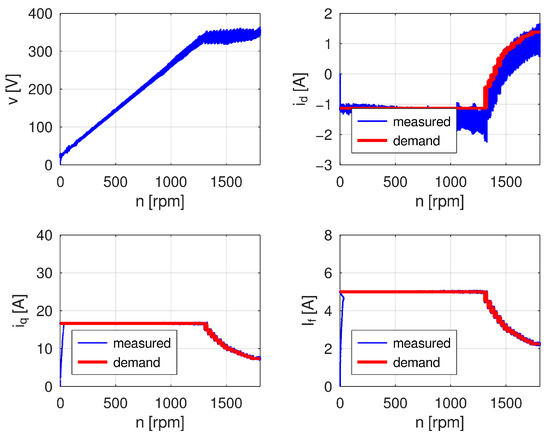
Figure 19.
Measured terminal voltage (left top) and comparison of current demands and measured currents on the upper limit of the MTPJ control region.
As mentioned in Section 2.4, the MTPJ control region covers the full speed range of the machine, whereas the rated voltage is, in case of this machine, reached at speed approximately 1300 rpm. Above this speed, the MTPJ control region is limited by the voltage and the maximal optimal field-winding current value decreases non-linearly. During the measurement, this moment is well observable by a decrease in machine torque between time 36 s and 62 s. In this time range the machine speeds up from 1300 rpm to its maximum speed and slows down back to 1300 rpm.
The maximal achievable torque by the machine covers the upper limits of the MTPA and the aFW regions, therefore these regions were measured consecutively. The maximal torque of the machine is in this case limited by all three constraints: maximal voltage limited by the rated machine voltage vr = 325 V, maximal current imax = 30 A and maximal field-winding current If = 5 A. The measured data are shown in Figure 20 and Figure 21.
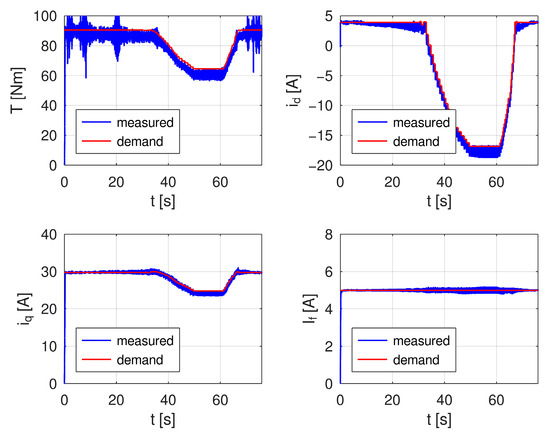
Figure 20.
Time dependencies of torque and current demands compared with measured data on the upper limit of the MTPA and adaptive field-weakening control regions.
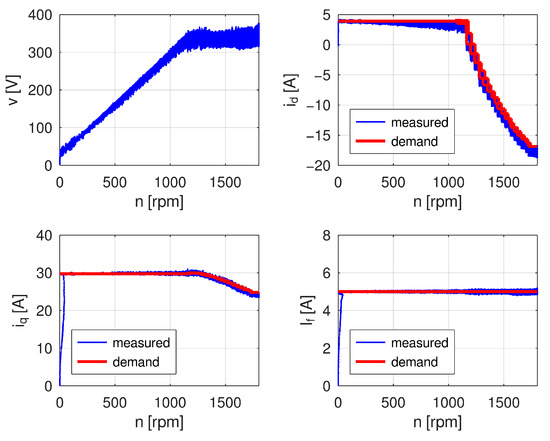
Figure 21.
Measured terminal voltage (left top) and comparison of current demands and measured currents on the MTPA and adaptive field-weakening control regions.
While tracing the maximum available machine torque, the rated terminal voltage of the machine is reached at approximately 1100 rpm; from this point the field-weakening process decreases the value of the direct axis current from original value of +5 A to its minimal value of −17 A while limiting the quadrature axis current to keep within the limits of the maximal allowed machine current of 30 A.
The machine duty in the field-weakening region is also well observable in machine torque values, which are lowered between measurement time of 32 s and 66 s. During the whole measurement, the field-winding current remains constantly at If = 5 A, providing maximal machine back electromotive force for achieving maximal available machine torque. As seen from both measurements the maximal measured voltage corresponds with machine rated voltage.
From both measurements, the achieved machine torque was projected in torque-speed curves summarizing the results of both measurements; the results are shown in Figure 22. In both cases the measured torque is approximately 5% lower than the torque expected by the calculations, whereas the predicted control region limits correspond to measured data.
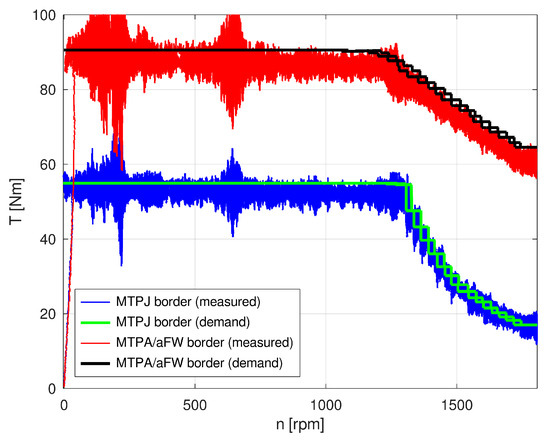
Figure 22.
Measured maximal torque-speed curves for maximal torque while using optimal control and absolute maximal machine torque.
The measured torque values show two large resonant regions at low speed and approximately 650 rpm. The resonances at low speeds are excited by slotting of both measured machines, whereas the resonance at 650 rpm corresponds with the mechanical resonance of the whole test bench. The projections of demanded values are doubled at high speeds since the measurement was performed in both directions—from standstill to maximum speed and back to standstill.
7. Discussion
As mentioned before, the presented measurements used for verification of the proposed control strategy exhibit approximately 5% error in measured control regions and their limits. These errors may have different causes arising from the derivation methodology itself, source data and measurement methodology and equipment:
- The derivation of the presented relation considers neither iron core losses nor mechanical losses. Since the iron core losses increase with approximately 1.5th power of magnetic flux density and second power of power supply frequency (i.e., machine speed), they affect measured data especially in regions of high saturations and high speeds. The mechanical losses increase with third power of the machine speed, hence their effect would be most observable in high-speed regions.
- The source data (measured flux maps) are relatively sparse to precisely describe saturation of the machine magnetic circuit. From this point of view a higher flux maps density would lead to more precise results.
- In the case of the used machine, the highest used frequency was 60 Hz only, hence the AC loss effects could have been neglected during the measurement. Since all tests were performed during a relatively short time, the thermal effect on machine resistances was negligible as well.
- The measurement methodology utilises an open-loop architecture—pre-calculated data are used as inputs and system response is measured without any feedback. A closed-loop architecture compensating for torque error by modification of input currents would then be able to compensate for the effect of loss components, which could not be considered during the derivation of control equations.
- The key measurement devices used for the measurement were BURSTER 8661-5200 torque sensor with precision ±0.1% of full-scale (200 Nm) and current transducers LA 55-P [31] with a maximal declared measurement error of ±0.90 %. The measurement error of both measuring elements is significantly below the observed discrepancy, hence the detected error exceeds the precision of the measuring equipment.
For the purpose of analysis of measured errors, the measured data were filtered using a 10,000 samples long sliding window to eliminate the torque sensor noise (corresponding with 1 s of the measurement). The filtered data were then compared to requested torque values. The absolute and relative errors in measured torque for each tested procedure are drawn in Figure 23, Figure 24, Figure 25, Figure 26 and Figure 27.
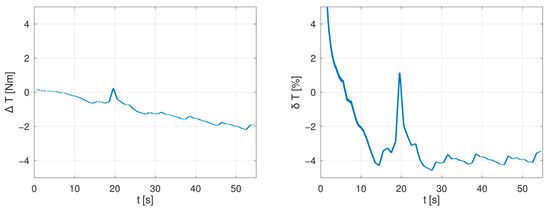
Figure 23.
Absolute (left) and relative (right) error in measured torque in MTPJ control region at 300 rpm.
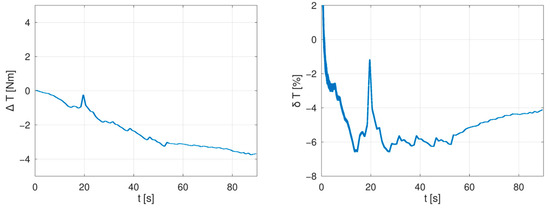
Figure 24.
Absolute (left) and relative (right) error in measured torque for transition from MTPJ control region to MTPA region at 1000 rpm.
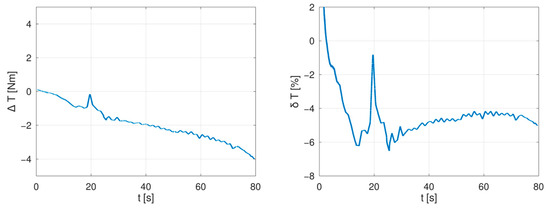
Figure 25.
Absolute (left) and relative (right) error in measured torque for transition from MTPJ control region to adaptive field-weakening region at 1500 rpm.
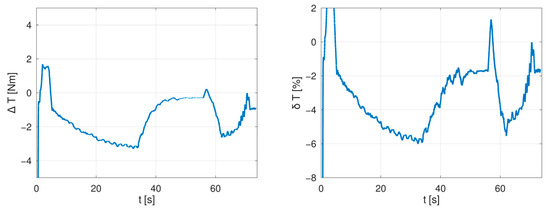
Figure 26.
Absolute (left) and relative (right) error in measured torque on the upper limit of the MTPJ control region.
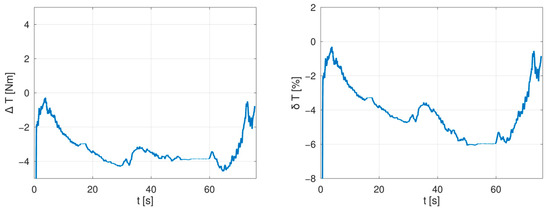
Figure 27.
Absolute (left) and relative (right) error in measured torque on the upper limit of the MTPA and adaptive field-weakening control regions.
In measurements presented in Figure 23, Figure 24 and Figure 25 the most significant sources of errors are measurement noises in low torques, which form an overshoot of relative measurement errors at the beginning of measurement runs. Similar measurement errors, but with lower magnitude, are located in Figure 26 and Figure 27 and they correspond with test bench vibrations during machines run-up. A further well-observable peak in both relative and absolute measurement errors is located at a time approximately t = 20 s in Figure 23, Figure 24 and Figure 25—this peak relates to an error in determination of the direct axis current in the MTPJ control area (also observable in Figure 13, Figure 15 and Figure 17). A summary of mean errors and standard deviations is shown in Table 3.
Table 3.
Mean errors and standard deviations measured during verification of proposed control strategy.
The measured errors show a similar discrepancy in all measured regimes, therefore it is not possible to clearly state the cause of the control uncertainty—the rise in the measured error is not generally proportional to the speed nor to the saturation of the machine, therefore these types of losses neglected in the derivation do not form the main cause of the measured errors. On the other hand, there are error variations in the MTPJ control region which pinpoint the precision of the used flux maps; see Figure 23 and Figure 24, measurement time 30 to 50 s.
Both measured absolute and relative errors also confirm a smooth transition between measured control regions—transitions are not observable in terms of any steep increase in measurement errors, hence they smoothly follow previous machine behaviour. Similarly, there is no observable steep change in detected torque errors resulting from variations in machine control parameters, especially from the aforementioned change in signum of the inductances factor kL.
8. Conclusions
In this paper, a comprehensive analysis of optimal control strategy for wound-rotor synchronous machines was presented, analysed and verified by measurement. The control strategy was initially developed for machines with constant equivalent circuit parameters, but using measured flux maps it is possible to extend the fundamental theory also for non-linear systems and to apply it for machines with strongly non-linear equivalent circuit parameters, as presented further in this article.
In comparison to other machine types, the optimal control of wound-rotor synchronous machines comprises three distinct control regions:
- A region of maximum torque per Joule loss control, which covers the full machine speed span with lower torque, where all three currents are scaled to keep the Joule losses at a minimal level.
- In the region of lower speeds and high torques when the field-winding current reaches its maximal value, the machine exhibits static excitation and behaves like a permanent magnet synchronous machine; i.e., in this control region, the MTPA known from PMSMs is used.
- In a region of higher speeds and torques it is possible to use adaptive field-weakening, i.e., proportional increase in machine field-winding current, to reach the highest possible torque while keeping the field-winding losses low and low value of direct axis current.
The experimental verification of the control strategy in all control regions, which used pre-calculated current combinations without any further current/torque feedback, shows approximately 5% inaccuracy in total measured torque, which may be further improved by various techniques—the addition of torque feedback, improvement of the machine model by considering mechanical losses or more complex usage of machine flux maps. The flux maps as used in this paper represent magnetic properties of the machine at a single frequency and temperature, but both of them are variable during machine duty and they introduce further non-linearities, which can affect machine behaviour at different working states. In this case all used control factors would become also temperature and frequency dependent. However, such a process would become time demanding and it would increase the computational demands of proposed control methodology.
The proposed control strategy constitutes a comprehensive system applicable to any wound-rotor synchronous machine without necessity of deeper machine modelling by using, e.g., finite element method or using computationally demanding techniques as often referred in the literature, which can also be used for machines with strongly non-linear equivalent circuit parameters. Since the proposed control methodology was successfully tested on a salient pole wound-rotor synchronous machine, which alters its saliency due to saturation effects, it proved its usability for wound-rotor synchronous machines with any general relation between direct and quadrature axis inductances—Ld > Lq, Ld = Lq and Ld < Lq. Hence, it is usable for both cylindrical and salient pole machines with any type of winding arrangement.
In comparison to other proposed control strategies, the presented method utilizes only measurement of machine flux maps, which can be included in the drive commissioning, followed by purely analytical calculations to determine equivalent circuit parameters and control factors. This allows for considering the machine as a black-box while avoiding usage of a finite element method as in [10,11,12] or feedforward strategies as in [23,24,25]. These properties of the control strategy are highly advantageous compared to others, as they make it easy to implement and are robust in operation.
Author Contributions
Conceptualization, methodology, formal analysis, writing—original draft preparation, visualization, supervision and project administration K.H.; software and writing—review and editing A.G.; validation, investigation, resources and data curation A.G. and O.S. All authors have read and agreed to the published version of the manuscript.
Funding
This research was funded by the Technological Agency of the Czech Republic, project TN02000028, Centre for Advanced Machines and Manufacturing Technology.
Data Availability Statement
The original data presented in the study are openly available in CESNET OwnCloud at https://owncloud.cesnet.cz/index.php/s/iMJCoXPuWBNyNgD, 9 December 2025.
Conflicts of Interest
The authors declare no conflicts of interest.
References
- Hussain, A.; Baig, Z.; Toor, W.; Ali, U.; Idrees, M.; Shloul, T.; Ghadi, Y.; Alkahtani, H. Wound Rotor Synchronous Motor as Promising Solution for Traction Applications. Electronics 2022, 11, 4116. [Google Scholar] [CrossRef]
- Widmer, J.D.; Martin, R.; Kimiabeigi, M. Electric Vehicle Traction Motors without Rare Earth Magnets. Sustain. Mater. Technol. 2015, 3, 7–13. [Google Scholar] [CrossRef]
- Jenkins, J. A Closer Look at Brushed AC Motors in EVs. Charged EVs. Available online: https://chargedevs.com/features/a-closer-look-at-brushed-ac-motors-in-evs/ (accessed on 18 November 2025).
- The Renault ZOE Motor: Energy Efficiency and Power! Renault Group. Available online: https://www.renaultgroup.com/en/magazine/energy-and-motorization/the-renault-zoe-motor-energy-efficiency-and-power/ (accessed on 18 November 2025).
- Zf Makes Magnet-Free Electric Motor Uniquely Compact and Competitive. ZF Press Center. Available online: https://press.zf.com/press/en/releases/release_60480.html (accessed on 18 November 2025).
- Valeo and MAHLE Expand Their Product Range of Magnet Free Electric Motors to Upper Segment Applications Through a Joint Development of iBEE (Inner Brushless Electrical Excitation). Valeo. Available online: https://www.valeo.com/en/valeo-and-mahle-expand-their-product-range-of-magnet-free-electric-motors-to-upper-segment-applications-through-a-joint-development-of-ibee-inner-brushless-electrical-excitation/ (accessed on 18 November 2025).
- Alani, M.; Oner, Y.; Tameemi, A. Electrical Machines in Automotive: Evaluation of Current Technologies and Future Requirements. Electr. Eng. 2023, 105, 477–491. [Google Scholar] [CrossRef]
- Wang, R.; Pekarek, S.; Bash, M. Alternative Excitation Strategies for a Wound Rotor Synchronous Machine Drive. In Proceedings of the 2012 IEEE Energy Conversion Congress and Exposition (ECCE), Raleigh, NC, USA, 15–20 September 2012; IEEE: New York, NY, USA, 2012; pp. 2300–2307. [Google Scholar] [CrossRef]
- Pinhal, D.B.; Gerling, D. Performance Map Calculation of a Salient-Pole Synchronous Motor with Hairpin Winding. In Proceedings of the 2019 IEEE 28th International Symposium on Industrial Electronics (ISIE), Vancouver, BC, Canada, 12–14 June 2019; IEEE: Vancouver, BC, Canada, 2019; pp. 359–365. [Google Scholar] [CrossRef]
- Chu, W.Q.; Zhu, Z.Q.; Zhang, J.; Liu, X.; Stone, D.A.; Foster, M.P. Investigation on Operational Envelops and Efficiency Maps of Electrically Excited Machines for Electrical Vehicle Applications. IEEE Trans. Magn. 2015, 51, 8103510. [Google Scholar] [CrossRef]
- Friedrich, G. Experimental Comparison between Wound Rotor and Permanent Magnet Synchronous Machine for Integrated Starter Generator Applications. In Proceedings of the 2010 IEEE Energy Conversion Congress and Exposition, Atlanta, GA, USA, 12–16 September 2010; IEEE: Atlanta, GA, USA, 2010; pp. 1731–1736. [Google Scholar] [CrossRef]
- Seol, H.-S.; Jeong, J.-M.; Lee, J.; Jin, C.-S. Current Control of WRSM Considering Magnetic Saturation Phenomenon. IEEE Trans. Magn. 2016, 52, 8204104. [Google Scholar] [CrossRef]
- Nguyen, Q.K.; Schuster, J.; Roth-Stielow, J. Energy Optimal Control of an Electrically Excited Synchronous Motor Used as Traction Drive. In Proceedings of the 2015 9th International Conference on Power Electronics and ECCE Asia (ICPE-ECCE Asia), Seoul, Republic of Korea, 1–5 June 2015; IEEE: Seoul, Republic of Korea, 2015; pp. 2789–2795. [Google Scholar] [CrossRef]
- Märgner, M.; Hackmann, W. Control Challenges of an Externally Excited Synchronous Machine in an Automotive Traction Drive Application. In Proceedings of the 2010 Emobility—Electrical Power Train, Leipzig, Germany, 8–9 November 2010; IEEE: New York, NY, USA, 2010; pp. 1–6. [Google Scholar] [CrossRef]
- Carpiuc, S.-C.; Lazar, M. Efficient State Reference Generation for Torque Control in Externally Excited Synchronous Machines. In Proceedings of the 2012 16th International Conference on System Theory, Control and Computing (ICSTCC), Sinaia, Romania, 12–14 October 2012; IEEE: New York, NY, USA, 2012; pp. 1–7. [Google Scholar]
- Kim, Y.; Nam, K. Copper-Loss-Minimizing Field Current Control Scheme for Wound Synchronous Machines. IEEE Trans. Power Electron. 2017, 32, 1335–1345. [Google Scholar] [CrossRef]
- Girardin, A.; Friedrich, G. Optimal Control for a Wound Rotor Synchronous Starter Generator. In Proceedings of the Conference Record of the 2006 IEEE Industry Applications Conference Forty-First IAS Annual Meeting, Tampa, FL, USA, 8–12 October 2006; IEEE: New York, NY, USA, 2006; Volume 25, pp. 14–19. [Google Scholar] [CrossRef]
- Uzel, D.; Peroutka, Z. Optimal Vector Control for Wound Rotor Salient Pole Synchronous Motors over Full Speed Range. In Proceedings of the 2015 17th European Conference on Power Electronics and Applications (EPE’15 ECCE-Europe), Geneva, Switzerland, 8–10 September 2015; IEEE: Geneva, Switzerland, 2015; pp. 1–7. [Google Scholar] [CrossRef]
- Preindl, M.; Bolognani, S. Model Predictive Direct Torque Control With Finite Control Set for PMSM Drive Systems, Part 1: Maximum Torque Per Ampere Operation. IEEE Trans. Ind. Inf. 2013, 9, 1912–1921. [Google Scholar] [CrossRef]
- Uzel, D.; Šmídl, V.; Peroutka, Z. Gradient Descent Maximum Torque Control up to the Base Speed of Wound Rotor Synchronous Motors. In Proceedings of the 2016 17th International Conference on Mechatronics—Mechatronika (ME), Prague, Czech Republic, 7–9 December 2016; IEEE: New York, NY, USA, 2016; pp. 1–6. [Google Scholar]
- Haala, O.; Wagner, B.; Hofmann, M.; Marz, M. Optimal Current Control Of Externally Excited Synchronous Machines In Automotive Traction Drive Applications. Int. J. Electr. Comput. Energetic Electron. Commun. Eng. 2013, 7, 1133–1139. [Google Scholar] [CrossRef]
- Capitanio, A.; Nuzzo, S.; Sala, G.; Barater, D.; Franceschini, G. Analysis of Externally Excited Synchronous Motors Operation Under Joule Losses Minimization Control. In Proceedings of the 2024 International Conference on Electrical Machines (ICEM), Torino, Italy, 1–4 September 2024; IEEE: Torino, Italy, 2024; pp. 1–7. [Google Scholar] [CrossRef]
- Eldeeb, H.; Hackl, C.M.; Horlbeck, L.; Kullick, J. A Unified Theory for Optimal Feedforward Torque Control of Anisotropic Synchronous Machines. Int. J. Control. 2018, 91, 2273–2302. [Google Scholar] [CrossRef]
- Hackl, C.M.; Kullick, J.; Monzen, N. Optimale Betriebsführung von nichtlinearen Synchronmaschinen. In Elektrische Antriebe—Regelung von Antriebssystemen; Schröder, D., Böcker, J., Eds.; Springer: Berlin/Heidelberg, Germany, 2021; pp. 829–1079. [Google Scholar] [CrossRef]
- Monzen, N.; Hackl, C.M. Artificial Neural Network Based Optimal Feedforward Torque Control of Electrically Excited Synchronous Machines. In Proceedings of the 2023 IEEE 32nd International Symposium on Industrial Electronics (ISIE), Espoo, Finland, 19 June 2023; IEEE: Helsinki, Finland, 2023; pp. 1–8. [Google Scholar] [CrossRef]
- Armando, E.; Guglielmi, P.; Pellegrino, G.; Bojoi, R. Flux Linkage Maps Identification of Synchronous AC Motors under Controlled Thermal Conditions. In Proceedings of the 2017 IEEE International Electric Machines and Drives Conference (IEMDC), Miami, FL, USA, 21–24 May 2017; IEEE: Miami, FL, USA, 2017; pp. 1–8. [Google Scholar] [CrossRef]
- Preindl, M.; Bolognani, S. Model Predictive Direct Torque Control With Finite Control Set for PMSM Drive Systems, Part 2: Field Weakening Operation. IEEE Trans. Ind. Inf. 2013, 9, 648–657. [Google Scholar] [CrossRef]
- 8661—High-precision Torque Sensor—Burster.de. Available online: https://www.burster.com/products/sensors/torque-sensors/rotating-applications/8661 (accessed on 2 December 2025).
- IEC 60034-4-1:2018; Rotating Electrical Machines—Part 4-1: Methods for Determining Electrically Excited Synchronous Machine Quantities from Tests. International Electrotechnical Commission: Geneva, Switzerland, 2018. Available online: https://webstore.iec.ch/en/publication/31052 (accessed on 18 November 2025).
- Eaton, J.W.; Bateman, D.; Hauberg, S.; Wehbring, R. GNU Octave Version 9.4.0 Manual: A High-Level Interactive Language for Numerical Computations. 2024. Available online: https://docs.octave.org/v9.4.0/ (accessed on 18 November 2025).
- LA 55-P. LA55. Closed Loop Hall Effect. Available online: https://www.lem.com/en/product-list/la-55p (accessed on 2 December 2025).
Disclaimer/Publisher’s Note: The statements, opinions and data contained in all publications are solely those of the individual author(s) and contributor(s) and not of MDPI and/or the editor(s). MDPI and/or the editor(s) disclaim responsibility for any injury to people or property resulting from any ideas, methods, instructions or products referred to in the content. |
© 2025 by the authors. Licensee MDPI, Basel, Switzerland. This article is an open access article distributed under the terms and conditions of the Creative Commons Attribution (CC BY) license (https://creativecommons.org/licenses/by/4.0/).