Abstract
Ultra-high-voltage direct current (UHVDC) transmission serves as a vital method for long-distance transmission of renewable energy in China. Commutation failure represents a common fault type in UHVDC transmission systems, causing the sending-end bus voltage to exhibit a “low-to-high” characteristic. This phenomenon poses a high-voltage disconnection risk for renewable energy units at the sending end. The high-voltage ride-through criteria for renewable energy incorporate both time and voltage peak factors. However, existing research relies solely on the voltage peak metric to assess disconnection risks for renewable units, failing to determine the specific stability level of the voltage. Therefore, this paper considers the cumulative effect of voltage transients over time, constructing a mathematical model of transient voltage during the entire fault process of a UHVDC transmission system at the sending end under commutation failure. Subsequently, a transient voltage rise stability margin metric based on a multi-binary table is proposed to evaluate the system’s transient voltage rise stability margin from both time and voltage peak dimensions. Finally, the accuracy of the proposed mathematical model and evaluation metric is validated using the PSCAD/EMTDC simulation platform. Results indicate that following a commutation failure in a UHVDC system, under the scenario of overvoltage instability alone, a higher short-circuit ratio (SCR) correlates with a lower system rated voltage. This configuration enhances the voltage stability margin of the sending end grid, improves its transient voltage stability, and helps mitigate the risk of renewable energy units disconnecting from the sending end grid.
1. Introduction
Due to the overall reverse distribution of China’s new energy production bases and load centers, the cross-regional consumption of large-scale clean energy has become a national strategy [1,2]. UHVDC transmission offers distinct advantages for long-distance, high-capacity power transmission due to its benefits of conserving transmission corridors, delivering substantial power capacity, and minimizing losses. It has become the primary method for transmitting renewable energy over long distances in China and achieving the “dual carbon” goals [3].
Currently, most UHVDC transmission systems rely on grid-connected commutators without self-shutdown capability [4]. Commutation failure is an inherent characteristic of direct current transmission systems composed of semi-controlled converter valves [5]. During commutation failure events, the sending grid experiences low voltage followed by overvoltage, accompanied by a rapid decline in DC power. This can trigger grid disconnection incidents in renewable energy units at the sending end [6], posing a severe threat to the secure and stable operation of the current “strong DC, weak AC” grid configuration. Consequently, transient voltage stability issues in the sending grid have become prominent [7,8], necessitating urgent research into methods for evaluating transient voltage stability margins [9].
To effectively assess voltage stability margins, numerous transient voltage evaluation methods have been proposed by scholars worldwide. Ref. [10] investigates a quantitative approach for evaluating transient voltage stability in actual systems. Considering the transient voltage stability criteria stipulated in the Technical Specifications for Calculation of Power System Security and Stability, it introduces a voltage dip index incorporating both voltage dip severity and voltage compliance metrics. Ref. [11] simultaneously considers the combined effects of the system’s minimum transient voltage, the duration below the voltage setpoint, and the voltage amplitude after fault recovery to define a transient voltage stability margin indicator. However, these methods only specify single-fault peak values and durations, failing to distinguish faults with large transient voltage changes and short durations. Therefore, Refs. [12,13] proposed a multi-binary table-based transient voltage stability margin metric by weighting different voltage drop levels and integrating transient voltage stability requirements. However, the aforementioned studies focused on evaluating the transient voltage islanding margin of conventional power systems, with few publications accounting for the high voltage ride-through requirements at the generator terminals of renewable energy units. This makes it difficult to accurately assess the islanding risk of renewable energy units.
Obtaining the dynamic characteristics of the sending grid during faults is fundamental to assessing the risk of grid disconnection for new energy units at the sending end. Ref. [14] employs an estimation method, representing transient voltage rise as the ratio of reactive power surplus during the transient period to the system short-circuit capacity; however, this approach exhibits low accuracy. Ref. [15] employs an AC equivalent method, establishing an AC system equivalent approach that accounts for steady-state transmission power. It considers the reactive power characteristics of converter stations and reactive power compensation devices during transients, yielding a quantitative calculation method for transient overvoltage. However, in systems with low short-circuit capacity, this method may not yield a practical solution. Ref. [16] employs a single-branch voltage drop method to investigate rapid analysis techniques for transient overvoltage on converter buses and wind turbines. It derives sensitivity formulas for node voltage changes induced by load variations at nodes, though steady-state power flows must first be obtained. Notably, these references focus solely on overvoltage peaks, failing to capture the full temporal evolution of voltage faults and thus proving unsuitable for assessing disconnection risks of renewable energy sources at transmission terminals. Ref. [12] utilizes simulation software to obtain voltage dynamic characteristics. However, this method involves substantial computational effort and is only applicable to specific systems.
In summary, research on the risk of renewable energy units disconnecting from the grid during UHVDC commutation failures faces two challenges:
- (1)
- Regarding disconnection risk assessment metrics, few studies consider the high-voltage ride-through requirements of renewable energy units, evaluating disconnection risk from both temporal and voltage amplitude dimensions.
- (2)
- Regarding mathematical models, existing research has mostly focused solely on overvoltage peaks, lacking models capable of characterizing the full voltage dynamic behavior of the sending end grid during faults.
To address the shortcomings in the current state of research, this paper conducts its investigation from the following two perspectives:
- (1)
- Regarding grid disconnection risk assessment metrics, since most existing methods fail to coordinate the “voltage-time” dual constraints in high-voltage ride-through standards, this paper constructs a transient voltage rise stability margin metric based on multi-binary tables and a mathematical model of transient voltages during faults. This metric quantitatively evaluates the grid disconnection risk of renewable energy units from both voltage magnitude and duration dimensions.
- (2)
- Regarding mathematical modeling, existing studies focus solely on overvoltage peaks while neglecting the entire dynamic process. This paper addresses this limitation by analyzing the segmented characteristics of DC current during commutation failures. It establishes an analytical model for the entire voltage process in the sending grid, enabling a comprehensive description of voltage dynamics during faults.
Based on the above research, this paper establishes a quantitative assessment method for transient voltage stability margin using multi-binary tables and weighted integration. This approach builds upon practical criteria for acceptable transient voltage instability at the generator terminal of new energy units, while incorporating the cumulative effects of voltage transients. Combining the key factors affecting the voltage of the sending end grid during commutation failure faults with the constituent equipment of UHVDC transmission systems, a mathematical model for the entire voltage fault process at the point of common coupling (PCC) of new energy units is proposed, accounting for the segmented effects of DC current. Based on this, a multi-binary-table transient voltage stability margin quantification metric grounded in the dynamic characteristics of the sending end grid voltage is introduced, enabling in-depth quantitative analysis of transient voltage stability under commutation failure conditions.
The remainder of this paper is organized as follows. Section 1 quantifies transient voltage rise using the multi-binary table criterion. Section 2 models the entire transient voltage process in the sending-end grid during UHVDC transmission system commutation failure. Section 3 presents case validation of the proposed risk quantification metric for renewable power units’ grid disconnection during UHVDC commutation failure. Section 4 concludes the study.
2. Research on Transient Pressure Rise Quantification Indicators Using Multi-Binary Table Criteria
Mathematically, the acceptability of deviations from specified requirements during the dynamic process of a power system can be represented by the two-criterion table (Xcr, Tcr). In practical power system engineering, the voltage dip two-criterion table (Vcr, Tcr) indicates that the maximum duration of voltage falling below the threshold value Vcr must not exceed Tcr. If the transient voltage response time satisfies these requirements, the transient voltage is considered stable; otherwise, it is deemed unstable. Addressing the limitation of single-binary-table acceptability criteria—which cannot quantitatively analyze the cumulative effects of voltage dips—Reference [12] established a stability margin metric for transient voltage dips based on multi-binary tables. Building upon the concept of assigning different weights to varying degrees of voltage dips from [12], this paper defines a new risk metric for renewable energy disconnection considering voltage transients as follows:
In the formula, VN denotes the rated voltage reference value; t1 and t1′ represent the time points when the state quantity falls below Vcr,1 and rises above Vcr,1 during the drop process, respectively; and Kk is the weighting coefficient. During the state elevation process, when V is below Vcr.n, Vcr.2 to Vcr.1, i.e., during the elevation process, it is located in the intervals (tn, tn′), … and (t1, t2) ∪ (t2′, t1′), respectively, are assigned different weighting coefficients Kn, …, K1.
During the dynamic process, when the system state is in a critical stable condition, ηv = 0 is satisfied. Therefore, this condition can be used as a basis for sequentially solving the weight coefficients, as detailed below.
The weighting coefficient Kk quantifies the relative severity of overvoltage exceeding different voltage thresholds. Higher voltage intervals and shorter acceptable durations correspond to larger Kk values, indicating that the risk accumulation rate increases nonlinearly as the overvoltage becomes more severe. This accurately reflects the engineering reality that the stress imposed by overvoltage on power electronic components grows nonlinearly. The weighting factor Kk transforms discrete segmented criteria into a continuous, weighted integral, thereby enabling more accurate reflection of the overall severity of voltage waveform deviations from safe limits during transient processes.
When ηv > 0, the system transient voltage is considered stable, and the higher the value, the greater the system transient voltage stability. When ηv < 0, the system is deemed to be in transient voltage instability.
Current standards can only determine whether voltage and duration exceed fixed thresholds, failing to distinguish the differential impact of varying drop depths on stability. By configuring multiple voltage-time threshold combinations and assigning distinct weighting coefficients to different drop intervals, these metrics can better leverage the cumulative effect of voltage transients. This approach effectively resolves the limitations of traditional methods, which suffer from low discrimination and lack flexibility. Criteria combinations can be customized based on the differentiated stability requirements of busbars, dynamically adjusting rated voltage reference values to accommodate varying fault severity levels. However, this approach relies heavily on time and voltage magnitude. Existing research often obtains voltage dynamic characteristics through simulation software, but this method involves substantial computational effort and yields results applicable only to systems with specific parameters. Therefore, it is necessary to analyze the transient voltage stability margin of the sending grid based on key influencing factors and corresponding dynamic characteristics under commutation failure scenarios. This provides guidance for quantifying the risk of disconnection for current renewable energy units at the sending grid.
The transient voltage rise metric proposed in this paper quantifies the risk of disconnection for renewable energy units at the sending end by evaluating the compliance of transient voltages with the segmented linear voltage-time thresholds in high-voltage ride-through standards. It should be clarified that this approach does not simulate the nonlinear protection mechanisms or physical degradation processes within power electronic devices. Consequently, the proposed transient voltage rise metric serves as a system-level quantitative assessment tool. By establishing a link between grid characteristics and the operational standards of renewable energy units, it can be applied to scenarios such as system planning, parameter sensitivity analysis, and comparisons of different operating modes.
3. Modeling the Entire Voltage Transient Process in the Source Grid During Commutation Failure in UHVDC Transmission Systems
This paper establishes a UHVDC transmission control system based on the CIGRE standard test system for DC transmission control research. The UHVDC transmission system established in this paper is a bipolar system with a rated DC voltage of ±800 kV, DC power of 8000 MW, and direct current of 5 kA. Both the sending and receiving ends employ double-twelve-pulse converters to achieve UHVDC transmission. The equivalent model of the UHVDC DC sending end incorporating renewable energy units is shown in Figure 1. The transmission-end grid is equivalent to a voltage source with impedance. In the figure, Uac, Rs, and Xs represent the equivalent potential, resistance, and reactance of the sending end AC system; Uw and Xwl denote the equivalent potential and reactance of the renewable energy system; Xw2 indicates the equivalent reactance between the wind farm grid-connection bus and the transmission-end converter bus; Up represents the phase voltage of the renewable energy system’s grid connection bus; UL is the line voltage of the transmission-end converter bus; Pd denotes the active power transmitted via DC; Qd represents the reactive power consumed by the rectifier station; Ps, Qs, Pw, Qw, Pc, and Qc respectively indicate the active and reactive power injected into the transmission bus from the transmission AC system, the renewable energy system, and the compensation device.
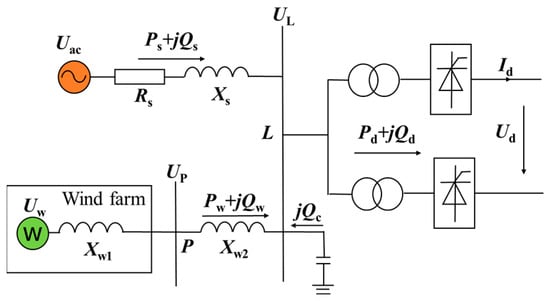
Figure 1.
UHVDC Transmission System Model for Delivering Renewable Energy from Source Regions via DC Transmission.
The UHVDC transmission system employs LCC-HVDC technology. The topology of a single twelve-pulse bridge is shown in Figure 2. The AC side is connected in parallel via two double-winding transformers. The Δ-side voltage phase of the transformer lags the Y-side voltage phase by 30°, and Ks denotes the transformer ratio.
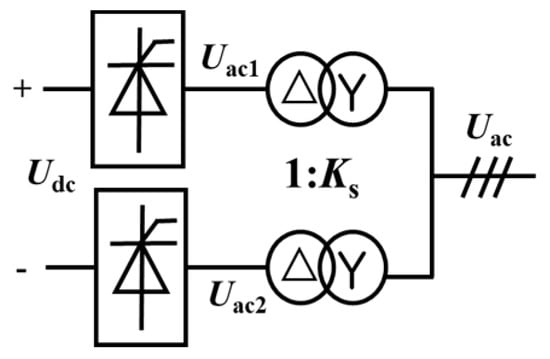
Figure 2.
Schematic diagram of UHVDC 12 pulse bridge.
The converter station uses a double twelve-pulse rectifier bridge, and the twelve-pulse rectifier bridge uses two six-pulse rectifier bridges connected in series. The DC side voltage is the sum of the DC voltages of the two thyristor-based six-pulse rectifier bridges. The primary side of the converter station transformer can be calculated using the following formula:
Among them, Udc represents the single-pole DC side voltage value, ω is the angular frequency of AC, α is the trigger angle of the converter station, Uac1 and Uac2 represent the AC side voltage on the sending end Y side of the transformer in a twelve-pulse rectifier bridge passing through the AC voltage on the Δ side of the transformer, and
Uac1 = Uac2 = Uac/Ks.
The relationship between the AC side and DC side voltages of the sending end converter station is expressed as follows:
Among them, Uac represents the AC side voltage value, that is, the effective value of the sending end grid voltage.
Considering the influence of smoothing reactors, the DC-side current ripple is assumed to be zero during modeling. Given that the sending end converter station employs a bipolar twelve-pulse rectifier bridge, the interaction between AC-side and DC-side currents at the sending end converter station can be expressed as follows [17]:
Among them, Iac represents the AC side current of the sending end converter station.
According to Equation (6), the converter bridges in UHVDC transmission systems generate harmonic currents at frequencies of 12k ± 1 (where k is a positive integer).
Neglecting the effects of harmonic currents of 12k ± 1 (where k is a positive integer) generated by the converter bridge, the mathematical relationship between the AC-side current and the DC-side current can be expressed as
Among them, Idc represents the direct current of the UHVDC transmission system.
The DC power of a bipolar twelve-pulse rectifier bridge can be expressed as
Among them, Ps represents the active power absorbed by the bipolar twelve-pulse rectifier bridge, Qs represents the reactive power absorbed by the bipolar twelve-pulse rectifier bridge, Qac0 represents the rated reactive compensation capacity of the AC filter, and Uac0 represents the rated voltage of the sending end power grid.
Considering only the transverse component, the sending end power grid voltage is expressed as
Among them, Us represents the equivalent internal potential of the sending end power grid; Ips represents the active current output of the sending end power grid; Rs represents the equivalent internal resistance of the sending end power grid; IQs represents the reactive current output of the sending end power grid; and Xs represents the equivalent internal reactance of the sending end power grid.
Ignoring the power consumed by the internal impedance of the sending end power grid, the voltage of the sending end power grid can be expressed as
Substituting Equation (7) into Equation (9) and solving simultaneously, we obtain
Solving the above equation yields the amplitude expression for the sending end power grid [17]:
Among them,
From the above equation, it can be seen that under transient faults in UHVDC transmission systems, the real-time sending end grid voltage can be obtained by determining the direct current Idc and the rectification angle α of the sending end converter station.
Based on the direct current characteristics of the UHVDC transmission system during commutation failure, this paper divides the entire process of commutation failure into four stages. Stage 1 is the thyristor pass-through stage, stage 2 is the direct current reduction stage, stage 3 is the direct current approximation stage, and stage 4 is the direct current recovery stage. The direct current in stages 1 to 4 is linearized, and the dotted line in Figure 3 shows the linearized fitting results of the direct current during commutation failure. Based on the fitting results of the direct current in the figure, mathematical modeling of the direct current is performed, and the durations of stages 1, 2, 3, and 4 are denoted as t1, t2, t3, and t4, respectively.
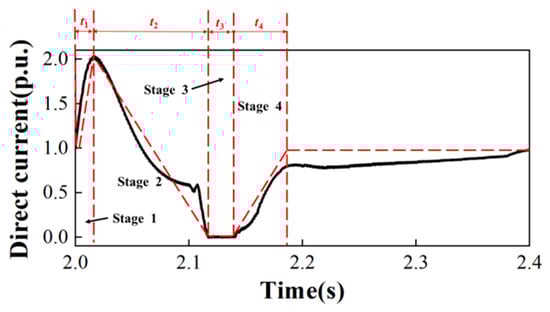
Figure 3.
Direct current in UHVDC transmission systems under commutation failure conditions.
In phase 1, a commutation failure occurs in the UHVDC transmission system, causing a direct connection between the upper and lower tubes of the converter bridge in the receiving-end converter station. In this phase, the DC-side voltage of the receiving-end converter station suddenly drops to zero, but the DC-side voltage of the sending-end converter station remains close to the rated value, and the direct current continues to rise under the action of the smoothing reactor. The direct current can be expressed as
Here, Udc denotes the DC-side voltage at the sending end converter station; Ldc represents the inductance of the smoothing reactor.
Based on the linear fitting results, the DC-side voltage at the receiving converter station is approximated as the average value before and after the instantaneous dip. The direct current in Phase I can be expressed as
Udc0 represents the rated DC voltage of the UHVDC transmission system before the fault, and Idc0 represents the rated direct current of the UHVDC transmission system before the fault.
In phase 2, the fault in the receiving-end power grid is cleared, and the thyristors in the receiving-end converter station return to their normal conduction order. In this phase, the DC-side voltage of the sending-end converter station quickly recovers, the DC-side voltage of the receiving-end converter station is higher than that of the sending-end converter station, and the direct current continuously decreases under the action of the smoothing reactor. The direct current can be expressed as
In stage 3, the reactive power consumption of the converter station continues to decrease. Under the action of the voltage dependent current order limiter, the direct current in this section remains at 10−3–10−4, which can be approximated as 0. At this moment, formula b in the expression for the sending end grid voltage amplitude is approximately equal to Us.
In stage 4, the DC voltage of the UHVDC transmission system has been restored, and the direct current gradually returns to its rated value under the control of the converter station.
The sending end converter station uses current loop calculation to calculate the commutation angle, which can be expressed as
Among them,
Iord = min{Ides, IVDCOL}
Kp is the current loop proportional coefficient of the sending end converter station, Ki is the current loop integral coefficient of the sending end converter station, and α0 represents the rated conversion angle of the sending end converter station before the fault. Iord denotes the actual current command value, IVDCOL represents the output value of the voltage dependent current order limiter (VDCOL), and Ides indicates the direct current setpoint. The sending end converter control model established in this paper aims to capture the dominant factors influencing transmission-end overvoltage following commutation failure. To construct a mathematical model suitable for system-level stability assessment, this study reasonably simplifies control loops operating at faster time scales, such as the phase-locked loop dynamics, assuming they achieve ideal phase tracking.
Substituting the current expressions for each phase and the trigger angle expression into Equation (11) gives the sending end grid voltage amplitude for phases 1–4.
For a given UHVDC project, linearized parameters can be pre-calculated or fitted through detailed simulations of a finite set of typical operating conditions. Once calibrated, this model serves as an efficient analytical tool for the specific system. Consequently, its primary application lies in stability assessment and planning for anticipated large disturbance faults within defined UHVDC systems.
The calculation process for the risk quantification indicators of grid disconnection for new energy generating units at the transmission end, as proposed in this paper, is illustrated in Figure 4.
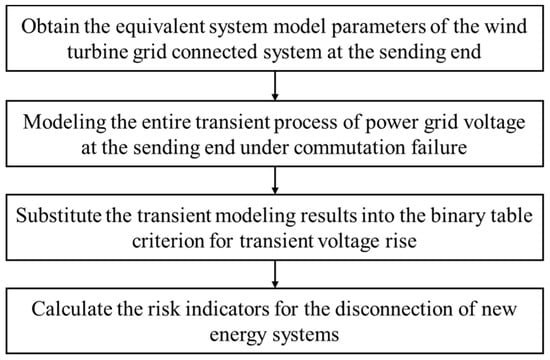
Figure 4.
Quantitative Indicators for Grid Disconnection Risk of New Energy Generators at the Transmission End.
4. Case Validation
Based on the topology diagram in Figure 1, a simulation model of the UHVDC transmission system was constructed in the PSCAD/EMTDC platform. Table 1 presents the system parameters for the ±800 kV DC transmission system. In this UHVDC transmission system, the sending-end converter station employs closed-loop direct current loop control, while the receiving-end converter station utilizes closed-loop DC voltage loop control. The control loop parameters for both rectifier and inverter stations listed in the table are normalized control parameters.

Table 1.
Parameters of UHVDC Transmission System.
In the constructed UHVDC transmission system, the rectifier side employs a constant-current controller. The actual current command value is determined by selecting the smaller of the output from the VDCOL and the direct current setpoint. This value serves as the input to the rectifier side constant-current controller. The actual simulation signal is shown in Figure 5.
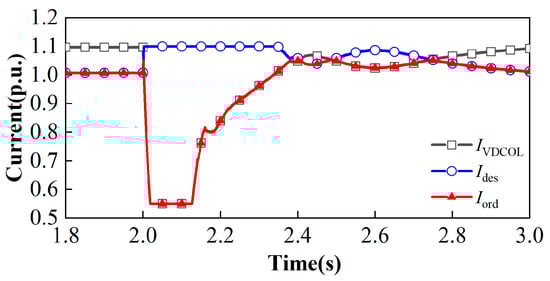
Figure 5.
Rectification side current command value signal.
As shown in Figure 5, between 0.3 and 0.4 s after the system commutation failure fault was cleared, a brief period occurred where the direct current setpoint Ides fell below the output value IVDCOL from the VDCOL. This caused the direct current setpoint to replace the VDCOL as the actual current command value Iord. Since this event occurred a relatively long time after the fault clearance and the difference between Ides and IVDCOL value was small, this paper concludes that following a commutation failure fault in the HVDC transmission system, the output current value IVDCOL from the VDCOL served as the actual current command value Iord throughout the entire fault duration.
4.1. Verification of the Full Process Model for Voltage Transients in the Source Grid During Commutation Failure in UHVDC Transmission Systems
Based on the established mathematical model for grid voltage at the sending end during commutation failure, electromagnetic transient simulation results and mathematical model calculations can be obtained for the direct current, sending-end trigger angle, and grid voltage amplitude following a commutation failure fault. To validate the accuracy of the mathematical model established in this section, a simulation model for commutation failure faults in a UHVDC transmission system was constructed in the PSCAD/EMTDC platform based on the data in Table 1. The specific configuration is illustrated in Figure 6.
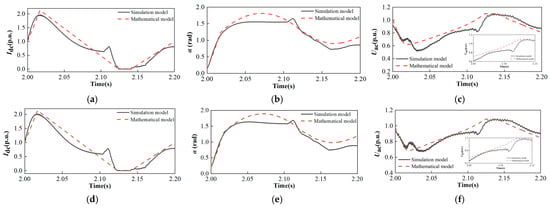
Figure 6.
Comparison of mathematical model considering VDCOL and simulation model results of UHVDC sending AC grid under commutation failure: (a) direct current when SCR is 3; (b) sending end converter station trigger angle when SCR is 3; (c) sending end grid voltage when SCR is 3; (d) direct current when SCR is 4; (e) sending end converter station trigger angle when SCR is 4; (f) sending end grid voltage when SCR is 4.
Figure 6 presents a comparison between simulation results and numerical model results for grid voltage amplitude under switching failure conditions across transmission-end grids of varying strengths. As shown in Figure 3, when SCR is 3, the transmission-end grid voltage of the UHVDC transmission system in the simulation first drops to 0.515 p.u. and then rises to 1.100 p.u. during a switching failure fault. The mathematical model established in this paper for the sending-end grid during commutation failure calculates a voltage that first drops to 0.615 p.u. and then rises to a maximum of 1.096 p.u., with a transient overvoltage peak error of 0.004 p.u. For a short-circuit ratio of 4, the simulation shows that under a commutation failure fault in a UHVDC transmission system, the sending-end grid voltage first drops to 0.671 p.u. and then rises to 1.088 p.u. The mathematical model for the sending-end grid under commutation failure established in this paper calculates a drop to 0.680 p.u. and a peak rise to 1.086 p.u., with a transient overvoltage peak error of 0.002 p.u.
Based on the comparison between the simulation model and mathematical model of key variables in the UHVDC sending-end grid during commutation failure, the mathematical model established in this paper for UHVDC transmission systems—which incorporates VDCOL—accurately reflects the trend changes in the simulation model. This enables the precise calculation of real-time voltage amplitude in the sending-end grid using the mathematical model, thereby revealing the dynamic evolution of the sending-end grid following a commutation failure fault.
4.2. Validation of Risk Assessment Indicators for Off-Grid Scenarios of New Energy Units Based on the Binary Table Method
Based on the overvoltage dual-meter model, the transient voltage rise stability margin index derived from the multi-dual-meter criterion incorporates mathematical modeling of the sending-end grid voltage during UHVDC commutation failure. By dividing the region enclosed between the post-fault transient voltage response curve and the voltage rating level line into multiple sub-regions, different weighting coefficients are assigned to each sub-region.
Commutation failure of UHVDC transmission may cause renewable energy units at the sending grid to disconnect due to transient overvoltage. To investigate the disconnection margin of these units, this paper establishes a model based on GB/T 19963.1-2021 “Technical Specifications for Wind Farm Connection to Power Systems—Part 1: Onshore Wind Power [18].” It addresses the requirements for high/low voltage ride-through capability under fault conditions while considering the actual operational status of renewable energy sources. combined with actual renewable energy operation conditions. Setting the rated voltage to 1 p.u., the overvoltage values at the turbine output node measured by dual-range meters are {[1.05 p.u., 10 s], [1.1 p.u., 1.2 s], [1.15 p.u., 0.1 s]}, yielding weighting coefficients K1 = 2, K2 = 7.33, and K3 = 61.11.
Based on the mathematical model of the sending end power grid under commutation failure, the voltage fluctuations of the sending end power grid with different levels of short circuit ratios (SCRs) under commutation failure can be calculated as shown in Figure 7. The obtained weight coefficients and corresponding indicators are shown in Table 2.
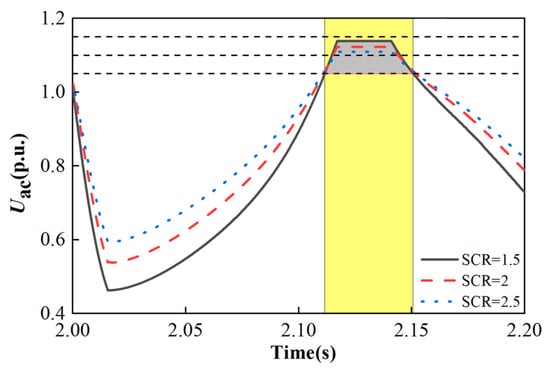
Figure 7.
Quantitative analysis of transient voltage rise based on mathematical modeling of the sending end grid of UHVDC.
Table 2.
Transient pressure rise quantification index with different SCRs.
As shown in the table, the higher the system short-circuit ratio, the greater the transient overvoltage peak during commutation failure faults in UHVDC systems. The table also indicates that a higher SCR corresponds to a larger ηv value, resulting in improved voltage transient stability. Appropriately increasing the system’s short-circuit ratio enhances voltage transient stability and reduces the risk of renewable energy units disconnecting from the sending end grid.
To validate the sensitivity of the proposed metrics to threshold voltage selection and segment count, this paper employs linear interpolation based on the original overvoltage binary table derived from national standards. This yields a two-segment overvoltage binary table, {[1.05 p.u., 10 s], [1.125 p.u., 0.3 s]}, yielding corresponding weighting coefficients K1 = 2 and K2 = 25.87. Under different SCRs, the transient voltage rise quantification metrics ηv calculated using the two-stage and three-stage standards are shown in Table 3.
Table 3.
Comparison of transient pressure rise quantification index at different number of segments.
The analysis results show that although the segmentation method and threshold setting have changed, ηv obtained in the two segmentation cases has numerical differences, but the relative trend of system stability remains consistent. That is, as the system SCR increases, ηv generally shows an upward trend, reflecting that the transient voltage stability of the system is stronger and the risk of disconnection of the new energy units at the transmission end is smaller. In addition, the fluctuation range of the indicator values under different segments is relatively small, indicating that the proposed quantitative indicator has a certain robustness in selecting the number of segments and threshold voltage, and can adapt to different levels of strict standard settings, which has practical engineering value.
Furthermore, the concept of assigning different weights to transient voltages on various busbar types based on their drop severity can be implemented by incorporating actual grid operational experience. This approach ensures rapid recovery to higher voltage levels after busbar voltage faults while limiting the minimum voltage during the transient process. Different fault recovery voltages can be set for distinct busbar types accordingly.
Table 4 shows that when the same two-element notation (Vcr, Tcr) is selected, the higher the rated voltage VN, the larger the corresponding weighting coefficient. Under the same grid impedance conditions, the transient voltage stability index will decrease, the transient voltage stability margin of the power grid will decrease, and stability will be worse. This shows that when only considering the risk of power grid voltage rise, the higher the rated voltage of the power grid, the worse the transient voltage stability margin, and the higher the risk of new energy disconnecting from the grid after connecting to the sending end. Appropriately reducing the rated voltage value can help improve the stability margin of the power grid voltage and reduce the risk of new energy units disconnecting from the grid due to overvoltage at the sending end.
Table 4.
Transient pressure rise quantification index and weighting factor for transient voltage rise at different rated voltages.
At the same time, Table 4 shows that for different rated voltage requirements, the higher the short circuit ratio, the greater the transient voltage stability index, further indicating that by increasing the strength of the sending end power grid, the smaller the voltage fluctuation of the UHVDC transmission system under commutation failure, that is, the larger the minimum low voltage peak and the smaller the maximum overvoltage peak, the greater the transient voltage stability margin of the power grid.
5. Conclusions
In response to the fault characteristics of UHVDC transmission grids at the sending end—specifically, the sequence of low-voltage penetration followed by high-voltage penetration during commutation failure—renewable energy units may experience voltage transient instability and disconnection from the grid. This paper proposes a transient voltage rise stability margin metric using a multi-binary table criterion, incorporating the concept of assigning different weights to varying degrees of voltage transient rise.
Compared with existing research, this paper demonstrates significant innovation in model completeness, evaluation dimensions, and methodological applicability. Existing approaches often rely on simulation software or focus solely on transient overvoltage peaks, failing to fully characterize voltage dynamics throughout the entire fault process. They also lack the capability to assess the risk of renewable energy units disconnecting from the grid based on both temporal and voltage amplitude dimensions. This paper establishes, for the first time, a mathematical model of voltage behavior at the sending end grid during the entire commutation failure process, accounting for the segmented characteristics of direct current. This model accurately reflects the temporal evolution of voltage. Building upon this foundation, a transient voltage rise stability margin indicator based on a multi-binary table is proposed. By introducing weighting coefficients for different voltage intervals, it quantifies the cumulative effects of voltage transients, better aligning with the practical requirements for high voltage ride-through capability of renewable energy units.
The following conclusions are drawn:
- (1)
- The mathematical model presented in this paper for the entire transient voltage process of the sending end grid during commutation failure in a UHVDC transmission system can accurately characterize the dynamic voltage behavior of the sending end grid throughout the fault process.
- (2)
- The multi-binary table criterion-based quantification metric for renewable energy unit disconnection risk precisely analyzes the transient voltage stability margin of the sending-end grid, enabling quantitative assessment of disconnection scenarios.
- (3)
- Following a commutation failure fault in a UHVDC system, a higher short-circuit ratio results in a lower transient overvoltage peak at the sending end. This, in turn, increases the risk quantification index for renewable energy units based on a multi-binary-criterion approach, thereby helping to reduce the risk of renewable energy units disconnecting from the sending end.
Furthermore, this study did not account for high-voltage ride-through control of renewable energy units or the impact of line impedance between renewable energy units and converter buses when establishing the dynamic characteristic mathematical model under commutation failure conditions. Future research will focus on these aspects.
Author Contributions
Conceptualization, H.G., T.X. and J.M.; methodology, H.G., L.C. and N.C.; formal analysis, H.G. and L.G.; resources, H.G. and X.D.; writing—review and editing, H.G. and X.D.; funding acquisition, L.C. All authors have read and agreed to the published version of the manuscript.
Funding
This work was supported by the Science and Technology Project of SGCC (Transient support for high proportion of new energy at UHVDC sending/receiving end Key Technology Research), 5100-202306384A-2-3-XG.
Data Availability Statement
Data are contained within the article.
Conflicts of Interest
Authors Tao Xu, Jianan Mu and Lin Cheng were employed by the company State Grid Corporation of China. The remaining authors declare that the research was conducted in the absence of any commercial or financial relationships that could be construed as a potential conflict of interest.
References
- Liu, Z.; Zhang, Q.; Dong, C.; Zhang, L.; Wang, Z. Efficient and Security Transmission of Wind, Photovoltaic and Thermal Power of Large-scale Energy Resource Bases Through UHVDC Projects. Proc. CSEE 2014, 34, 2513–2522. [Google Scholar]
- Xue, T.; Wei, Z.; Du, X.; Liu, J. A New Impedance Measurement Method for Wind Farms Considering the Influence of Background Harmonics. Electronics 2025, 14, 501. [Google Scholar] [CrossRef]
- Shi, Y.; Sun, Y.; Liu, J.; Du, X.; Tai, H.-M. New analysis on two-variable converter impedance model in grid-connected systems. IET Renew. Power Gener. 2021, 15, 3704–3714. [Google Scholar] [CrossRef]
- Liu, J.; Du, X.; Shi, Y.; Tai, H.-M. Impedance Measurement of Three-Phase Inverter in the Stationary Frame Using Frequency Response Analyzer. IEEE Trans. Power Electron. 2020, 35, 9390–9401. [Google Scholar] [CrossRef]
- Tang, Y.; Zheng, C. Review on Influencing Factors of Commutation Failure in HVDC Systems. Proc. CSEE 2019, 39, 499–513+647. [Google Scholar]
- Yan, J.; Liu, Q.; Li, K.; Wu, L.; Liu, H. DFIG Transient Overvoltage Characteristics Analysis and Overvoltage Suppression under DC Commutation Failure. Power Sys. Tech. 2024, 48, 3912–3920. [Google Scholar] [CrossRef]
- Zhang, N.; Zhang, Z.; Xu, Z. Voltage Stability Assessment for Reverse-blocking-IGCT-based HVDC Transmission System. High Volt. Eng. 2025, 51, 1329–1338. [Google Scholar]
- Han, Z.; Wang, T.; Wang, X.; Wang, Z.; Zhao, W. Characterization of Transient Overvoltage of Sending-end AC System When Commutation Failure Caused by Asymmetrical Fault. Power Syst. Technol. 2025, 49, 1532–1540. [Google Scholar]
- Liu, J.; Du, X.; Zhao, Y. A Novel Control Strategy for Enhancing System Stability in Weak Grids by Mitigating Additional Disturbance Components from PLL. IEEE Trans. Sustain. Energy 2025, 16, 1114–1124. [Google Scholar] [CrossRef]
- Hou, J.; Liu, Y.; Xie, X.; Ye, M.; Sun, Y.; Wang, K.; Zhang, Y. Quantitative assessment index and method of transient voltage stability. Electr. Power Autom. Equip. 2015, 35, 151–156. [Google Scholar]
- Zheng, C.; Guan, L. Assessment on Fault Characteristics of Yunnan to Guangdong UHVDC Transmission and The Influence of Forced Outage on Power System at Receiving End. Power Sys. Tech. 2012, 36, 32–38. [Google Scholar]
- Xue, A.; Zhou, J.; Liu, R.; Chow, J.; Bi, T. A New Practical Transient Voltage Stability Margin Index Based on Multiple-two-element Notation Criterion. Proc. CSEE 2018, 38, 4117–4125. [Google Scholar]
- Zhao, J.; Zhu, Y.; Pan, E.; Xu, D.; Dong, L. Study on Transient Voltage Rise Severity Index for the High Renewable Power—Penetrated UHVDC Sending—End Power Grid. South. Power Syst. Technol. 2020, 14, 1–9. [Google Scholar]
- Chen, H.; Lu, H.; Wang, C.; Liu, C.; Guo, Y.; Zhang, S. Coordinated optimization of HVDC and wind power control parameters for mitigating transient overvoltage on HVDC sending-side system. Electr. Power Autom. Equip. 2020, 40, 46–55. [Google Scholar]
- Wang, F.; Liu, T.; Ding, Y.; Zeng, Q.; Li, X. Calculation Method and Influencing Factors of Transient Overvoltage Caused by HVDC Block. Power Sys. Tech. 2016, 40, 3059–3065. [Google Scholar]
- Cao, S.; Zhang, W.; Wang, M.; Pan, Y.; Guo, Q.; Liu, J. Study on Fast Analysis Method Transient Fundamental Frequency Overvoltage of Wind Turbine Generators in Sending System when Serious Power Disturbances Occur in Large-capacity UHVDC. High Volt. Eng. 2017, 43, 3300–3306. [Google Scholar]
- Jin, X.; Nian, H. Overvoltage Suppression Strategy for Sending AC Grid With High Penetration of Wind Power in the LCC-HVdc System Under Commutation Failure. IEEE Trans. Power Electron. 2021, 36, 10265–10277. [Google Scholar] [CrossRef]
- GB/T 19963.1-2021; Technical Specification for Connecting wind Farm to Power System—Part 1: On Shore Wind Power. State Administration for Market Regulation (SAMR)/Standardization Administration of China (SAC): Beijing, China, 2021.
Disclaimer/Publisher’s Note: The statements, opinions and data contained in all publications are solely those of the individual author(s) and contributor(s) and not of MDPI and/or the editor(s). MDPI and/or the editor(s) disclaim responsibility for any injury to people or property resulting from any ideas, methods, instructions or products referred to in the content. |
© 2025 by the authors. Licensee MDPI, Basel, Switzerland. This article is an open access article distributed under the terms and conditions of the Creative Commons Attribution (CC BY) license (https://creativecommons.org/licenses/by/4.0/).