Abstract
The deployment of wireless sensor networks (WSNs) is fundamental for smart buildings, industrial automation, and healthcare. However, achieving uniform wireless coverage in complex indoor environments remains a significant challenge due to structural obstructions and non-line-of-sight areas. As an example of this problem and of the proposed solution, this paper addresses the signal coverage issue in an L-shaped corridor. We present a novel solution based on a double, entirely passive Reflective Intelligent Surface (RIS) configuration. This setup significantly improves both the amplitude and the spatial uniformity of the received power in the shadowed region, effectively overcoming the limitations of the single-RIS configuration, which often leaves coverage gaps in Non-Line-of-Sight areas. To model realistic multipath propagation, we developed a custom ray-tracing algorithm that takes advantage of the regular geometry of indoor environments to improve processing speed. The field response of an RIS is then evaluated by analyzing possible reflecting-surface configurations and comparing the performance of single- and double-RIS configurations. Additionally, a statistical analysis of the power received by an observer located anywhere in the corridor, considering RIS positioning uncertainties across various deployment scenarios, has been performed. Results show that the double-RIS solution increases the covered area by , considering a receiver sensitivity of dBm. The proposed approach can be easily generalized to other typical indoor environments with similar structural characteristics.
1. Introduction
With the rapid development of modern wireless communication systems and the emerging 6G technologies, many complex indoor environments suffer from poor signal coverage, especially in Non-Line-of-Sight (NLoS) regions. In contrast to traditional solutions like transceivers or active repeaters, Reflective Intelligent Surfaces (RISs) have gained significant attention as a low-cost alternative, both in terms of manufacturing and operational costs [1,2,3,4]. RIS implementations can be broadly categorized into active, hybrid, and entirely passive architectures [5,6]. Active and hybrid RISs incorporate amplifiers and active circuitry, enabling them not only to manipulate the phase of the incident wave and the amplitude of the reflected signal but also to adapt in real time to dynamic channel conditions, thereby realizing a truly “smart” radio environment. However, this enhanced functionality comes at the cost of higher energy consumption and hardware complexity. In an indoor environment, small transceivers offer a lower price due to their large-scale production and the same installation and maintenance costs. Thus, active RISs are not a profitable choice. For static or semi-static indoor environments with a well-defined, fixed geometry, such as the L-shaped corridor studied in this work, a passive RIS offers the best trade-off between performance, cost, and implementation complexity. An entirely passive RIS, once designed and fabricated, requires no operational power and, with no active components, offers greater resilience and lower long-term maintenance overhead. In addition, their planar structure makes them easy to install and seamlessly integrate into indoor spaces, such as by hiding them behind decorative elements like paintings or wall panels [7,8].
Generally, a passive RIS comprises a quasi-periodic array of cells formed by metallic elements printed on a grounded dielectric substrate. The printed element of each unit cell is characterized by one or more geometrical parameters, which can be varied to provide a tailored phase shift to compensate for the incident field and to obtain the desired reflected field pattern [9]. This allows the reflected wavefront to be steered toward a target direction, deviating from the specular one [10]. For this reason, RISs are often referred to as anomalous reflectors [11,12]. An in-depth introduction to RIS typologies, geometries, and electromagnetic modeling, along with a review of their state-of-the-art applications, is presented in [1]. Technological development, technical issues, and hardware implementation considerations for RIS designed for indoor and outdoor applications are discussed in [13].
In an indoor scenario, RIS-assisted signal propagation occurs in an electromagnetically complex environment, where the incident field on the RIS is generated by multiple reflections from walls, floors, ceilings, and nearby objects. Designing a RIS with the desired performance requires a detailed understanding of the propagation environment and an accurate characterization of the wireless channel. Although on-site measurements can provide highly accurate information, they are often time-consuming and require specialized equipment. As a practical alternative, simulation tools can accurately model indoor propagation scenarios. Among these, ray-tracing (RT) methods have emerged as a widely adopted solution for describing multipath effects.
Ray-tracing (RT) algorithms have undergone a long evolution, closely tied to the increasing computational capabilities of modern hardware. The fundamental principles of RT for radio-propagation modeling are reviewed in [14], while a comprehensive overview of academic and commercial RT-based simulators is provided in [15]. A detailed discussion of propagation modeling approaches, including the Visibility Tree method, Ray Launching, and Diffuse Scattering, is presented in [16]. More recent developments focus on acceleration techniques to mitigate the exponential growth of computational complexity. For example, ref. [17] proposes a Machine-Learning-aided ray-tracing strategy capable of sampling valid ray paths with reduced computational load while maintaining high accuracy.
Traditional RT methods typically do not account for the presence of passive or active reconfigurable intelligent surfaces (RISs) [1]. Although recent studies have introduced extensions to integrate their effects into RT frameworks [18,19], these apply only to metasurfaces whose bulk scattering coefficients are periodic functions of a phase parameter, which, in turn, is a continuous, smooth function of surface coordinates. Incorporating a full-wave electromagnetic model of RIS unit cells into general-purpose RT tools remains challenging due to the associated computational burden.
Several works have investigated RIS-assisted coverage enhancement in indoor environments. In [20], an RIS was integrated into the Wireless InSite ray tracer to analyze coverage improvement in a non-line-of-sight (NLoS) scenario at GHz and GHz, with the transmitter and receiver separated by a wall. In [21], passive RISs were evaluated in L-shaped and T-shaped corridors, demonstrating significant enhancement in NLoS regions. However, the proposed techniques do not allow the study of surfaces with radiating elements that introduce arbitrary or rapid phase-delay variations, precluding the use of optimization techniques to cover the areas of interest more uniformly. To address this gap, the present work pursues a twofold objective.
First, we propose a ray-tracing algorithm that efficiently exploits the specific geometry of the indoor environment. Unlike conventional shooting-and-bouncing-ray approaches, the proposed method is computationally efficient enough to determine the field incident on each RIS element, which typically numbers a few thousand. This enables the use of a Physical Optics approach [22] to analyze the re-irradiated field and permits overcoming the current limitations of some ray-tracing simulation software [21,23], which treats the RIS as a truncated periodic surface. A key advantage is that we can analyze reflective surfaces with elements that introduce any phase variations individually, and this enables us to design surfaces that produce arbitrarily shaped beams.
Second, using the developed tool, we address the signal-coverage problem in an L-shaped corridor.
We specifically focus on two aspects that are often overlooked in this type of problem but can significantly impact the performance of the Reconfigurable Intelligent Surface (RIS). First, we consider the non-exclusive use of direct rays in the design of the RIS. Second, we explore the potential to improve coverage by using two reflecting surfaces instead of just one.
The analysis shows that designing the RISs to account for the actual field impinging on them (i.e., the direct ray and the reflected rays from the environment) results in an almost dB improvement in the main beam field compared to using only the direct ray. Nevertheless, when environmental effects are considered, we observe very high lobes generated by low-order reflections from the walls. These findings are consistent with the measurements reported in [24] at GHz for indoor scenarios. Moreover, a sensitivity analysis showed that the enhanced design is more sensitive to positioning errors. For this reason, a statistical analysis of the power received by a sensor in the shaded area of the corridor has been conducted. Whatever the design approach, the study clearly shows that the proposed double RIS configuration outperforms the single RIS solution, providing more stable, uniform coverage of the shaded area of the corridor.
The paper is organized as follows. Section 2 describes the simulation scenario (Figure 1) and summarizes the geometrical and electromagnetic parameters of the environment and the RISs. Section 3 presents the developed ray-tracing algorithm and its application for calculating the incident field on the RIS and the transmitted field in the shadowed area. This section also analyzes the impact of the number of considered ray paths on the reflected field, comparing the far-field patterns resulting from two different RIS design approaches. A flowchart of the procedure followed to calculate the field scattered by one or two RISs is shown in Figure 2. Section 4 introduces and evaluates the double-RIS configuration deployed near the corridor’s corner, comparing its coverage performance in the shadowed region with that of single-RIS setups. Section 5 examines the computational complexity of the proposed analysis method. The system’s sensitivity to RIS positioning errors and manufacturing uncertainties is investigated in Section 6 and Section 7, respectively. In addition, a preliminary study of the system’s behavior under frequency variation is reported in Section 8. Finally, Section 9 provides concluding remarks.
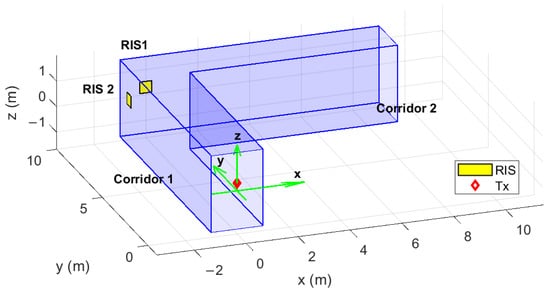
Figure 1.
Geometry of the simulated indoor propagation environment.
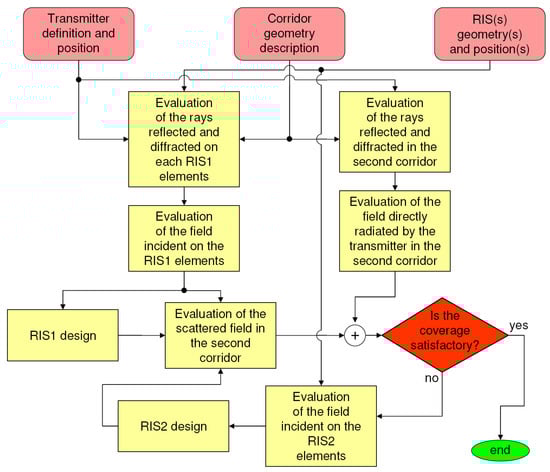
Figure 2.
Diagram illustrating the steps involved in calculating the field scattered in the second corridor by one or two RISs.
2. Geometry and Simulation Setup
The study scenario consists of a 10 m long corridor (first corridor segment) featuring a 90-degree turn, followed by another 10 m long section (second corridor segment), forming an L-shaped structure. The entire corridor is 3 m high and 2 m wide. A Cartesian coordinate system is adopted, with origin located at the centre of the entrance of the first corridor section, as illustrated in Figure 1. A transmitting antenna with a 12° half-power beamwidth in the horizontal plane and 60° beamwidth in the vertical plane is located at coordinates (0, 0, 0.3) m, corresponding to a height of 1.8 m from the floor. An effective isotropic radiated power (EIRP) of 3 dBm is assumed, and the radiated electromagnetic field is vertically polarized. Two RISs are located on the walls of the corridor as sketched in Figure 1. The first (RIS1) has its center at (0, 10, 0.3) m, while the second (RIS2) is at (−1, 9, 0.3) m. For the evaluation of the received signal in the shadowed area (i.e., the second corridor segment), a regular grid of observation points in the plane with a 15 cm spacing in both directions was considered. At each point, to simulate a simple receiving sensor, a matched half-wavelength dipole antenna was assumed, positioned at the same height from the floor as the transmitting antenna and the center of the RISs. The open-circuit voltage at the receiving antenna terminals was calculated by coherently summing the contributions from all rays originating from each element of the RIS. At a generic observation point, the propagation paths under consideration include the Line-of-Sight (LOS) ray, if available, along with rays that undergo single and multiple reflections from the walls, floor, and ceiling. Additionally, rays diffracted around the corner of the corridor are considered. In this study, we focus on scenarios where the walls are made of brick, concrete, or office glass panels for which the proposed analysis is profitable. Therefore, we do not account for propagation through the walls since its contribution is negligible.
The wall surfaces are modeled as electromagnetically smooth. According to the criteria described in [25] a surface can be considered smooth if the root mean square (rms) value s of surface height satisfies the Fraunhofer roughness criterion: , where is the free-space wave number, is the incidence angle, and is the free-space wavelength. At the design frequency of GHz, this condition is satisfied for typical interior wall surfaces, whose rms roughness generally ranges between 96.4 μm and 99.2 μm [26]. As such, the wall surface irregularities are sufficiently small compared to the wavelength, and their impact on the reflection behavior can be considered negligible. Reflections from the lateral walls, floor, and ceiling are thus modeled using standard electromagnetic parameters for dry concrete walls at the operating frequency [27], as reported in Table 1.

Table 1.
Simulation parameters.
3. Ray-Tracing and Field Estimation Methodology
3.1. Incident Field Estimation at the RIS Location
The first stage of the proposed methodology involves identifying the propagation paths of electromagnetic waves from the transmitter to an observation point on the RIS1, as shown in Figure 2, upper yellow block. A custom ray-tracing algorithm was developed to determine each ray’s path by exploiting the regular geometry of the scenario. In particular, instead of using the classical shooting-and-bouncing-rays method, we exploit the Image Theorem to determine the incidence direction of each ray connecting the transmitter to the observation point . The algorithm begins by calculating the transmitter’s image sources relative to the lateral walls, ceiling, and floor. Let be the position of the k-th image source and the vector that identifies the position of the observation point . Auxiliary rays are then traced from these image sources to the observation point . These rays are shown as cyan lines in Figure 3 and Figure 4a. Each of these auxiliary rays indicates the direction of the last bounce that the wave radiated by the transmitter follows to reach the observation point . Using this information, the full ray path is reconstructed in reverse, step by step, by iteratively identifying the preceding reflection points along the path to the transmitter. In particular, starting from the point , we define the initial reverse direction by the unit vector . Then, at each iteration , starting from a known point and a given direction vector , the algorithm computes the intersection of the ray with all wall surfaces using standard line–plane intersection equations. The following reflection is assumed to occur on the wall corresponding to the closest valid intersection point in the direction . Once the reflection point and its corresponding wall orthogonal unit vector are determined, the ray’s direction is updated according to the law of geometrical optics, i.e., . If the reconstructed path reaches the transmitter, the sequence of reflection points and direction vectors is stored. For each of these valid paths, the associated electric field contribution is then computed. The calculation begins at the transmitter, whose position is identified by the vector position . The field radiated on the closest reflection point is calculated according to the transmit antenna characterized by a radiation vector :
where EIRP is the effective isotropic radiated power, the free space characteristic impedance, and . Then, for the electric field incident on the point is calculated as the field reflected from the point that propagates to the point , i.e., , where . The reflected field can be calculated as follows:
where and are the perpendicular and parallel unit vectors, respectively; and are the parallel and perpendicular reflection coefficients, respectively; and is the unit vector orthogonal to the reflective wall.
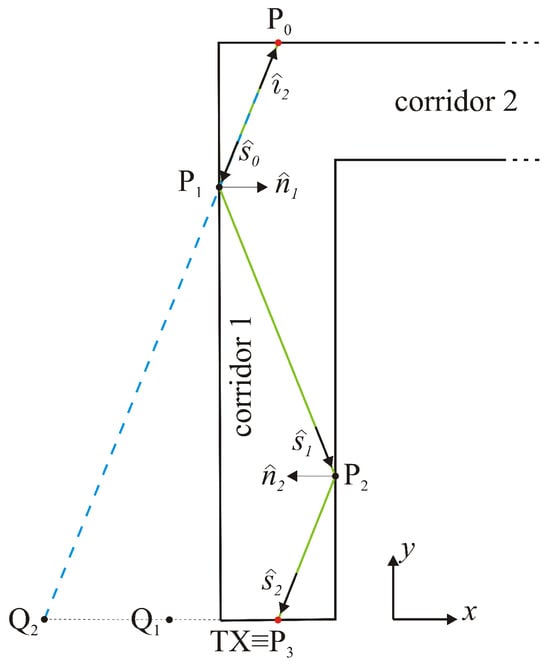
Figure 3.
Geometry of the first corridor with the path from the transmitter to a cell of the RIS1. (red dots) transmitter and observation point locations, (black points) ray reflection points, (dashed line) auxiliary ray traced from an image source to the observation point .
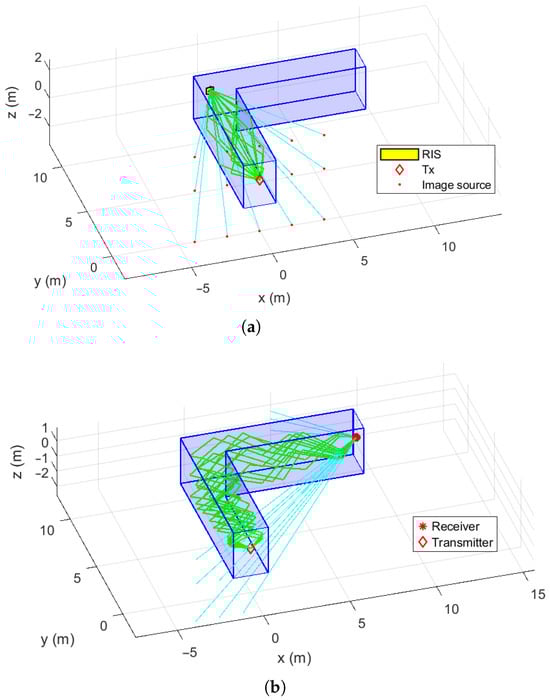
Figure 4.
Example of rays’ paths: (a) for an observation point on the RIS1 surface, (b) for a generic point in the shadowed area. The cyan lines show the directions of the rays incident at the observation point, obtained using the image theorem. The green lines depict the paths of the rays reflected from the walls, ceiling, and floor.
Finally, the total electric field at point is obtained by coherently summing the complex contributions from all reconstructed ray paths, preserving both amplitude and phase information. As an example, Figure 4a shows the set of propagation paths obtained when a limited number of image sources are considered (two images with respect to the left and right walls () and 1 with respect to the floor and the ceiling ()).
Moreover, the diffracted field from the corner between the two areas (located at m, m, m, as shown in Figure 1) was also included in the analysis. The diffracted field was computed using the Uniform Geometrical Theory of Diffraction (UTD) for spherical wave incidence. The core expression for the diffracted field is based on the formulation by Pathak et al. reported in Section IV of [28]:
where is the incident field at the diffraction edge, is the UTD dyadic diffraction coefficient, is the spreading factor for spherical waves, is the free-space wavenumber, and s are the distances from the source to the diffraction point on the edge and from the diffraction point to the observation point, respectively. The spreading factor A and the distance parameter L used to calculate were selected for the spherical wave incidence case as defined in Equations (23) and (32) of [28], respectively. To model the finite conductivity of the wall surfaces, the diffraction coefficient was modified using the well-established empirical approach of Luebbers [29,30]. Specifically, the reflection terms within the perfect-conductor diffraction coefficient were replaced by the appropriate Fresnel reflection coefficients for perpendicular and parallel polarization, and , in [31] Section 9.5. This is equivalent to implementing Equation (5) from [29] within the framework of Equation (22) of [28]. The reflection coefficients are functions of the complex relative permittivity of walls, the values of which are listed in Table 1.
3.2. Field Estimation in the Shadowed Area
We then extend the analysis to a generic observation point in the corridor’s shadowed region. In this case, the presence of a 90-degree turn introduces additional complexity, making the connection between the image sources and the actual reflection paths less intuitive. To address this, the image sources are first calculated relative to the lateral walls, floor, and ceiling of the initial corridor segment (i.e., we determine the same image sources located in the plane shown in Figure 4a). Then, the images of these virtual sources are computed relative to the lateral walls of the second corridor segment. Each of these sources is treated as a candidate for generating a valid propagation path.
The ray-tracing process then follows the same approach described earlier: a ray is traced from each candidate source to the observation point , and its direction is used to start the iterative reflection-finding algorithm. However, because of the geometry of the environment, only a small subset of these candidate rays yields a valid path to the transmitter. An example of this process, with , and , is shown in Figure 4b.
The method described in Section 3.1 is used to determine the incident field on each RIS element and the scattered field by the RIS toward the second corridor. In contrast, the approach described in this section is employed to compute the field propagating directly from the transmitter into the shadowed area. Figure 5 shows the received power in the shadow zone when considering propagation paths including up to 12 reflections from the walls, floor, and ceiling.
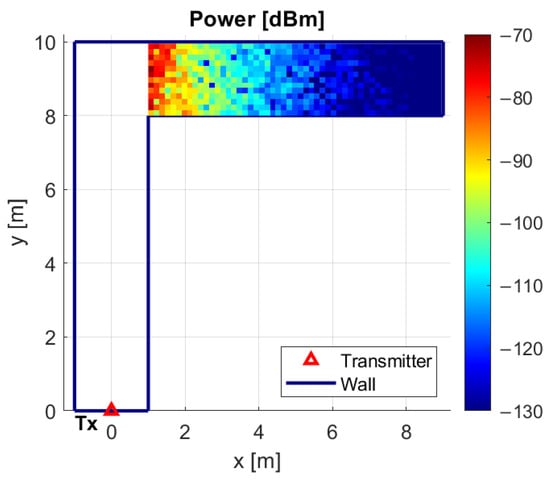
Figure 5.
Coverage map in the shadowed area when no RIS is used for signal enhancement.
Although the number of possible ray paths from the transmitter to an observation point is theoretically infinite, only a small subset of these paths makes a significant contribution. Therefore, an analysis was conducted to determine the optimal number of ray paths that balances computational complexity with the accuracy of the calculated electric field. Specifically, the electric field amplitude was evaluated at a representative observation point m, located on the RIS surface directly facing the transmitter. The magnitude of the electric field transmitted at the point P was computed for different numbers of reflections, and normalized to its maximum value corresponding to the direct path (i.e., the line-of-sight path).
Figure 6 shows the results obtained for three different scenarios: paths involving only lateral wall reflections (blue circle), only floor and ceiling reflections (green circle), and combined reflection paths (red cross). In all cases, the contribution to the field from paths with many reflections quickly decreases. This increasing attenuation results from two main factors: each additional reflection causes greater reflection losses, and the total path length increases, leading to higher free-space attenuation.
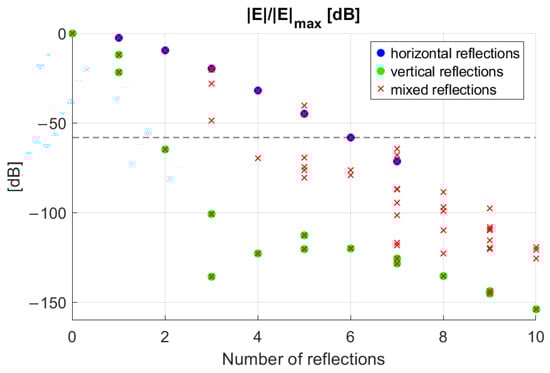
Figure 6.
Normalized electric field, associated with each ray path, incident on the point versus the number of reflections.
It should be noted that paths involving reflections from the floor and ceiling (green dots) are less significant since, because of the vertical polarization of the transmitting antenna, they engage the parallel reflection coefficient, which has a Brewster angle close to 65° and a lower magnitude compared to the perpendicular one.
3.3. Evaluation of the Field Scattered by the RIS
After examining the contribution to the field from each ray path, the next step is to evaluate the cumulative field generated by the RIS in a realistic multi-path scenario. In particular, we first consider a single RIS placed at the end of the first corridor, mounted on the wall directly in front of the transmitter, with its center at m. The RIS is designed to reflect the incident wave at a 60-degree angle from its surface normal (corresponding to an azimuthal angle of ° in the global coordinate system, as shown in Figure 1) towards the second corridor. We specifically considered an RIS composed of reradiating square elements, each with a dimension of mm, equivalent to at the central frequency of 28 GHz.
To direct the main beam in the desired direction, the generic mn-th element of the RIS has been designed to introduce a phase delay:
with the free-space wavenumber. In Equation (4), the first term compensates for the phase of the electric field impinging on the -th element. The second term, which involves indicating the position of the centre of the element unit cell, adds a progressive phase to steer the reflected wave toward the desired direction defined by the unit vector .
The total field scattered by the entire RIS is calculated as outlined in [22], which has shown the ability to generate accurate scattering patterns and absolute gains [32].
Specifically, for each -th element of the RIS, we define a spherical reference system with the origin at the element’s center (i.e., ) and z-axis aligned with its normal. Then, we assume each element is embedded in a periodic lattice, and we express its scattered field in terms of the incident field by using the scattering coefficients of the (along ) and (along ) Floquet modes, thus defining the dyad . The field scattered by each RIS element at the observation point is then given by the following:
where , and , are the dimensions and the axes of the rectangular periodic unit cell, respectively; identifies the observation point measured from each element’s center, while and with is the direction of the incident ray. In the case of multiple reflections, we analyze the contribution to scattering from each incident ray individually. Because of linearity, the electric field of the entire RIS is the superposition of the fields scattered by each RIS element.
Typically, an RIS is designed under the assumption of a single plane wave incident on it. In reality, however, the actual wavefront is distorted by the surrounding environment. To quantify this effect, we compare the RIS response across two different design approaches.
In the first scenario, the RIS is designed assuming a single incident plane wave along the line-of-sight path from the transmitting antenna. This configuration will be referred to as the LoS-based design in the remainder of the paper.
If only the direct path is considered incident on the RIS, the scattered field shows one main lobe at °, as expected (see the dotted blue curve in Figure 7). However, when the far-field pattern is evaluated under a more realistic condition, where the incident field is modeled as the superposition of rays that undergo up to 2 or 6 total reflections before reaching the RIS, several high lobes appear in the azimuth plane (red and green curves in Figure 7a). In the vertical plane, the issue is significantly reduced (Figure 7b).
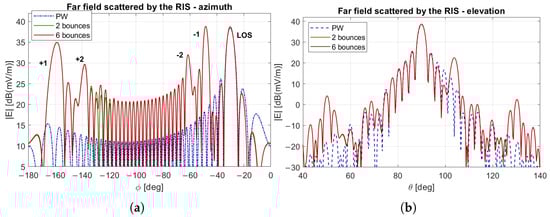
Figure 7.
Far field pattern of an RIS designed to reflect the impinging plane wave at an angle of 60°. This is accomplished while being excited by a realistic incident field that consists of both the line-of-sight (LoS) wave and multiple waves reflected from the walls, ceiling, and floor: (a) azimuth plane, (b) elevation plane. LoS-based design when only a plane wave impinges on the RIS (dotted blue), or the incident field is modeled as the superposition of rays that undergo 2 (solid green) or 6 (solid red) total reflections.
By considering the field incident on the RIS due to a single ray path at a time, it is possible to identify the contribution of each reflection to the radiation pattern. A key observation is that the lobes of highest intensity are mainly due to low-order reflections. For instance, the lobes labeled as correspond to rays with a single reflection: the plus sign indicates a bounce on the right wall (the plane m in Figure 1), while the minus sign indicates a reflection on the left wall ( m). The same convention applies to the lobes labeled with , though in this case it refers to the wall where the last bounce occurs. In particular, single-reflection paths generate two notable side lobes at ° and °.
The second scenario represents the case in which the RIS is designed based on an incident wave modeled as the coherent sum of the electric fields associated with multiple reflections from the walls, ceiling, and floor of the first corridor. This configuration will be referred to as the specific design case from now on.
The far field patterns in the azimuth and vertical plane for the latter case are shown in Figure 8. The lobe at ° is dB lower than in the LoS-based design case and also dB below the main beam. Moreover, the main lobe itself is dB stronger compared to the one obtained with the LoS-based design. This improvement is because, in the specific design case, the RIS is explicitly designed to reflect the actual incident field, which includes not only the direct wave but also the field reflected by the environment. This indicates that a design accounting for realistic wavefronts not only reduces radiation in undesired directions but also enhances the signal in the desired one.
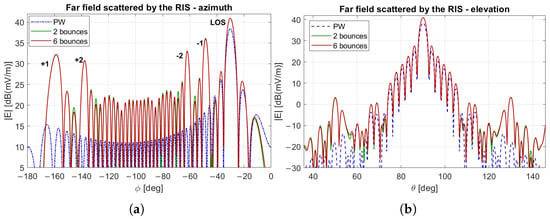
Figure 8.
Far field pattern of an RIS designed to reflect the simulated incident field from the considered scenario at an angle of 60°, varying the number of considered reflections from the environment geometry: (a) azimuth plane, (b) elevation plane. Specific design when only a plane wave impinges on the RIS (dotted blue), or the incident field is modeled as the superposition of rays that undergo 2 (solid green) or 6 (solid red) total reflections.
In support of this interpretation, Figure 9a shows the spatial distribution of the total incident power on the RIS in the specific design scenario. In contrast, Figure 9b shows the phase of the incident field. Compared to the LoS-based design case, where the incident power is uniformly distributed at approximately dBm across the surface, the inclusion of reflected rays results in a non-uniform distribution, with local maxima reaching about dBm. The spatial distribution reveals areas of constructive and destructive interference resulting from the superposition of the direct path and propagation paths involving up to six reflections. Nevertheless, the overall effect is a net power gain: the total incident power on the RIS surface reaches approximately dBm when both direct and reflected contributions are included, while it drops to dBm when only the direct path is considered. This increase in total incident power confirms that multipath components, when appropriately exploited in the RIS design, can enhance energy in the intended direction.
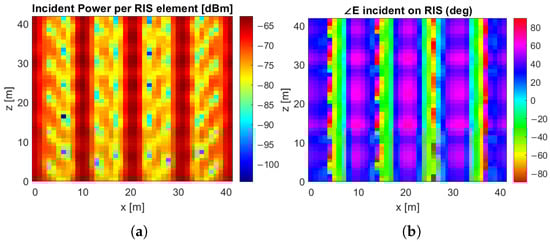
Figure 9.
The incident field includes both the direct wave and reflected rays with up to six reflections. (a) Incident Power per RIS element. (b) Phase of the incident field per RIS element.
Another observation concerns the far-field radiation pattern in the elevation plane. In the LoS-based design case, the pattern exhibits a noticeable asymmetry with respect to the one obtained when all contributions are taken into account. Specifically, a prominent grating lobe appears around °, on one side only (Figure 7b). Further analysis reveals that this phenomenon is related to the asymmetric vertical positioning of both the transmitting antenna and the RIS, located at m, i.e., closer to the ceiling than to the floor. Since the incident field is vertically polarized, the electric field components reflected from the ceiling and floor are controlled by the parallel reflection coefficient. Due to the specific geometry, the ray impinging on the floor shows an angle closer to the Brewster angle with respect to the ray impinging on the ceiling. This leads to a weaker reflected field, as evidenced by the much lower grating lobe observed around °, compared to the one resulting from the ceiling reflection at °. On the contrary, when the RIS is designed based on the actual incident field (specific design), this effect is compensated, resulting in a symmetric radiation pattern, as shown in Figure 8b.
It is worth noting that, when compensating properly for the non-uniform phase variation of the incident field, the radiated field in Figure 8 shows high side lobes in the same positions as those of Figure 7. This is due to the magnitude modulation evident in Figure 9a, which reaches even dB, and passive elements cannot compensate for that.
Furthermore, as shown in Figure 7 and Figure 8, the main lobe and most of the energy distribution remain practically unchanged when increasing the maximum number of considered reflections from 2 to 6. This confirms that limiting the ray-tracing algorithm to 6 reflections results in negligible loss of accuracy while significantly reducing computational effort. Based on these findings, a maximum of 6 reflections is imposed in all subsequent simulations, as it ensures accurate field estimation while keeping computational complexity within an acceptable limit.
4. Double RIS Scenario and Coverage Performance Analysis
The results summarized above show that to cover the second corridor segment, a single RIS must be designed to redirect the incident field in a direction that is significantly different from the incident direction. This can increase the sensitivity of the reflective surface at higher frequencies, leading to an appreciable squint of the main beam and a consequent reduction in uniformity of coverage. To overcome this drawback, we propose a double-RIS configuration. In particular, we consider that the RIS1 reflects the incident field at (°, °) toward a second RIS (RIS2) located on the adjacent wall at coordinates m, as illustrated in Figure 1. The RIS2 has the same geometry as the RIS1 (see Table 1). Figure 10 compares the power incident on each element of RIS2 for the two design strategies previously applied to RIS1. The spatial maps confirm that the received power on the second surface is higher overall when the RIS1 is designed based on the actual incident field rather than assuming a plane wave. In particular, the total incident power increases by approximately dB.
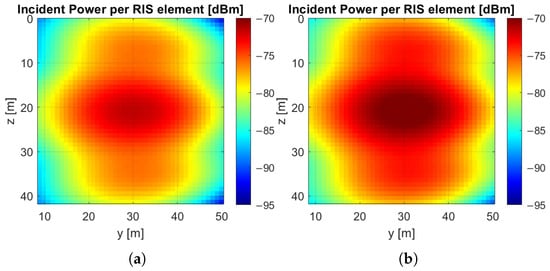
Figure 10.
Incident power on RIS2 when the two design strategies are applied to RIS1: (a) LoS-based design, (b) specifc design.
In the configuration where a single RIS is placed in front of the transmitter, simulations performed with various reflection angles indicate that directing the beam at 80° from the RIS’s normal direction (i.e., °) yields the best coverage in the shadowed region. On the other hand, when two equal RISs are deployed on the adjacent walls forming the corner, the coverage in the second corridor becomes nearly symmetrical but non-uniform along the corridor width due to the high directivity of RIS2. To address this, a beam shaping strategy is required for RIS2. Specifically, a phase delay is applied along the azimuth direction, calculated with respect to its center and defined by the quadratic profile . As a result, the phase delay introduced by the -th element is as follows:
where represents the incident electric field generated by the RIS1, while the unit vector defines the target direction for the reflected wave, corresponding to ° and °. Through simulation, the most effective value for the shaping parameter was found to be for the specific width of the second corridor. Figure 11 illustrates the spatial distribution of phase delay on the surface of RIS2. Figure 12 shows the pattern radiated by the RIS2 in the azimuth plane when the LoS-based design (Figure 12a) or the specific design (Figure 12b) is applied. We note that the beam-enlargement strategy produces a flat-top pattern that illuminates the entire width of the second corridor.
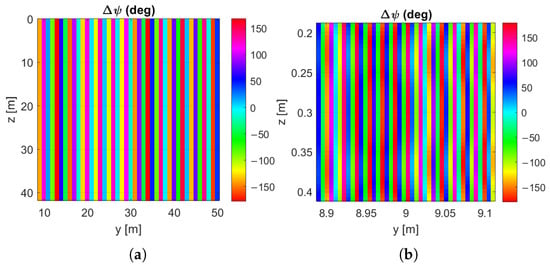
Figure 11.
Phase delay each introduced by RIS2: (a) both RISs are designed in the LoS-based design, (b) both RISs are designed using the specific design scenario. In both cases, the beam enlargement strategy given in Equation (6) has been applied to RIS2.
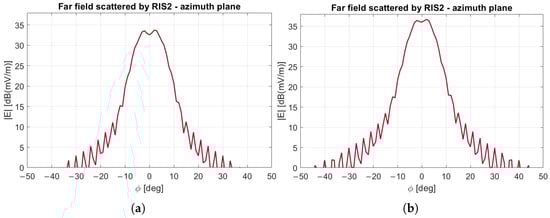
Figure 12.
Pattern of the field radiated by the RIS2 in the second corridor. Azimuth plane: (a) LoS-based design, (b) specific design, for both RISs.
Coverage Performance Analysis
This section compares the coverage performance of three RIS-assisted configurations: two single-RIS setups (one to deflect the beam of 60° and one of 80° toward the shadow region) and the proposed double-RIS system. In all cases, the RIS (or both RISs) is specifically designed for the environment.
The limitations of a single-RIS approach are evident in Figure 13a,b. The first configuration, which employs a single RIS pointing 60°, exhibits significant shadowed areas outside its main beam. The RIS is unable to cover the second corridor uniformly. Similarly, if the RIS reflects at 80°, it suffers from a critical coverage gap due to the position of the first null in the radiation pattern where the received power drops to approximately dBm.
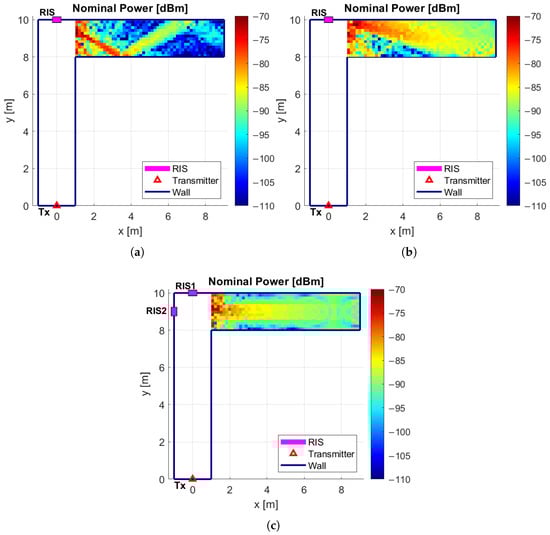
Figure 13.
Received power in the second corridor with: (a) one RIS pointing at 60°, (b) one RIS pointing at 80°, (c) the double RIS configuration.
In contrast, the double-RIS configuration (as reported in Figure 13c) exhibits significantly fewer low-coverage zones, with a weak signal only in a few areas near the walls. This improvement is attributed to the beam shaping applied to RIS2.
Table 2 summarizes the quantitative performance metrics for the studied configurations, including the average received power and its standard deviation in the shadowed area. The third column reports the percentage of area covered relative to a dBm threshold, compared to the no-RIS baseline scenario (Figure 5).
Table 2.
Performance metrics in the shadowed region.
5. Computational Complexity
The simulation runtime depends mainly on three factors: the maximum number of reflections of each ray, the corridor geometry, and the number and size of the RISs. The computational time required to evaluate the total received power at a generic point P in the shadowed zone was measured for different configurations. Average values, computed using the cputime function in MATLAB (software version 2024b) on a workstation with an Intel Core i9-14900HX CPU and 32 GB RAM, are reported in Table 3.
Table 3.
Average computational time required to evaluate the total received power at a generic point P in the shadowed zone.
The simulation workflow is split into two stages to optimize the calculation of the coverage map. Stage 1 is executed only once and involves defining the transmitter and simulation parameters, constructing the corridor and the RIS geometry, computing the total incident field on each RIS element, and determining the associated equivalent surface currents through the adopted scattering model. For a double-RIS system, Stage 1 also encompasses the computation of the fields incident on the RIS2 (excited by the RIS1) and the corresponding surface currents they generate. Stage 2, which is executed for each observation point P of the coverage map, computes the total field at point P by evaluating the contribution radiated by the equivalent currents of every RIS element and summing all multipath components.
The baseline scenario (no RIS), where each propagation path can undergo up to 12 reflections, requires approximately s to compute the total received power at a single point P.
As expected, introducing a RIS significantly increases the computational load, as the incident and reflected fields must be computed for each unit cell. The transition from a single-RIS to a double-RIS configuration introduces substantial overhead. This is fundamentally due to the system’s cascaded nature: the incident field on each unit cell of the RIS2 is generated by the coherent superposition of the fields radiated by all unit cells of the RIS1. A nearly linear scaling of runtime with the maximum number of reflections is also observed.
6. Uncertainty on the RIS Position
6.1. Single RIS Scenario
In a real-world application, the RIS is likely to have a positioning error of about cm at GHz, which is about . To evaluate how such deviations affect performance, the radiation pattern associated with the nominal placement of the RIS is compared with those produced under horizontal displacements of or .
As shown in Figure 14, the far field pattern of an RIS designed to reflect at 60° in the specific design case appears highly sensitive to displacement. As the horizontal offset increases, the main lobe progressively decreases, reaching a reduction of approximately dB for a displacement of (i.e., about cm). Significant variations also occur in the side lobes. For instance, the side lobe at ° increases by dB, while the one at ° increases by nearly dB. Additionally, the elevation plane exhibits an increasing asymmetry in the side lobes.
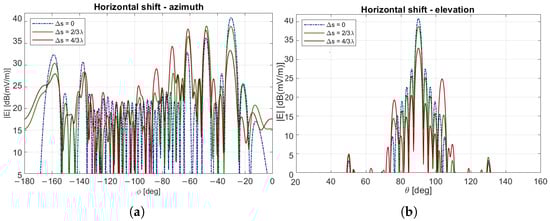
Figure 14.
Far field pattern for different RIS displacements when the RIS is designed to reflect at an angle of 60°, in the specific design scenario: (a) azimuth plane, (b) elevation plane.
In contrast, in the LoS-based design scenario, the radiation pattern proves considerably more robust to displacement. As illustrated in Figure 15, the main lobe experiences only a minor reduction of approximately dB, and the side lobe at ° increases by nearly dB under the most significant displacement considered.
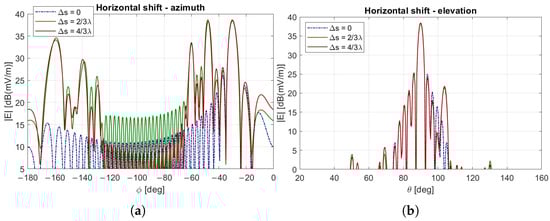
Figure 15.
Far field pattern for different RIS displacements when the RIS is designed to reflect at an angle of 60° degrees, in the LoS-based design case: (a) azimuth plane, (b) elevation plane.
When we translate the RIS vertically, the impact on the radiation pattern is less pronounced. For the maximum offset, the main lobe decreases by approximately dB. This behavior can be attributed to the fact that the RIS is designed to reflect the incident wave in the horizontal plane, with no specific vertical reflection control applied.
Similar trends are observed when the RIS is designed to reflect at 80°, confirming the same behavior across both design strategies.
6.2. Double RIS Scenario
A similar analysis is carried out for the double-RIS configuration. The far field patterns produced by the RIS2 are compared between the LoS-based design and specific design cases, considering horizontal displacements of and applied to each RIS (along the x-axis for RIS1 and along the y-axis for RIS2 of the global coordinate system, see Figure 1).
Figure 16, relevant to the specific design case, shows that shifting the RIS1 away from its nominal position leads to a reduction in the main lobe amplitude. In the worst case (), the main lobe drops by approximately dB compared to the nominal configuration. Such a reduction does not occur in the LoS-based design case: as shown in Figure 17, the amplitude remains nearly unchanged, with only a dB drop compared to the nominal positioning. Moreover, we cannot see that, in both cases, when the position of RIS1 is fixed, displacing RIS2 has no impact. This behavior can be explained by considering the proximity between the two RISs. Being in the radiating near-field region of RIS1, the RIS2 is only marginally affected by minor positional errors, as it receives a comparable excitation even after the displacement.
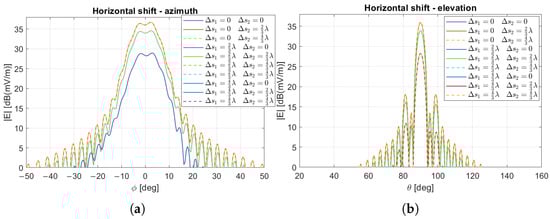
Figure 16.
Far field pattern for horizontal displacements of and for RIS1 and RIS2. Specific design: (a) azimuth plane, (b) elevation plane.
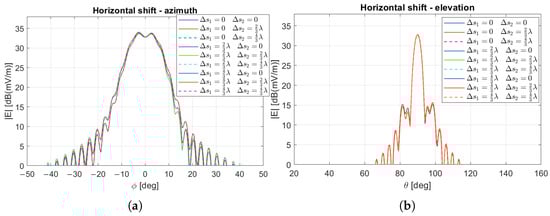
Figure 17.
Far field pattern for horizontal displacements of and for RIS1 and RIS2. LoS-based design: (a) azimuth plane, (b) elevation plane.
These findings suggest that if the positional uncertainty of the RIS1 remains within approximately , the LoS-based design is preferable and is only slightly affected by positioning errors.
6.3. Statistical Analysis
While the previous analysis focused on the deterministic effects of fixed positional displacements, practical deployments are more likely to involve random uncertainties in the RIS placement. Therefore, a statistical analysis of the average power received by a sensor in the shadowed region under the specific design scenario applied to both RISs has been carried out. Specifically, a Monte Carlo approach has been implemented with 100 iterations, where the RIS position (in the first case study) or the positions of both RISs (in the second case study) are randomly perturbed with a uniform distribution and a variance of a wavelength in both vertical and horizontal directions along the wall, around their nominal placement. The uniform distribution was chosen under the assumption that all possible positions have the same probability of being selected.
The statistical analysis reveals that, when using a single RIS reflecting at 60°, spatial variations in received power due to RIS displacement are generally modest within the main lobe. As shown in Figure 18b, the standard deviation of the received power remains below approximately dBm in this region, indicating a stable signal profile. In contrast, the most significant fluctuations are observed in the side lobes, which correspond to areas with higher sensitivity to RIS misplacement. A similar behavior is observed in Figure 19 when the RIS reflects at 80°. For the double RIS configuration, Figure 20 shows results similar to those in Figure 19, but the average power distribution is more uniform in the corridor, with a lower standard deviation.
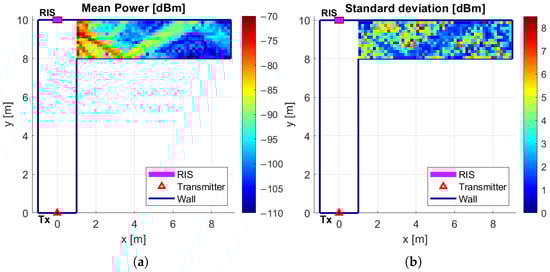
Figure 18.
Received power in the second corridor with one RIS pointing at 60°: (a) mean value, (b) standard deviation. Specific design scenario.
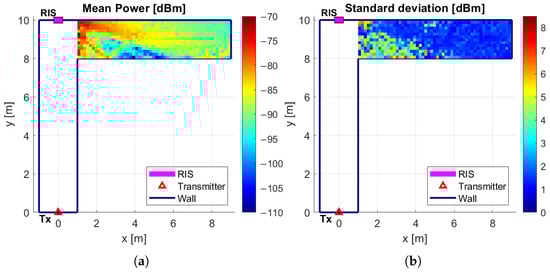
Figure 19.
Received power in the second corridor with one RIS pointing at 80°: (a) mean value, (b) standard deviation. Specific design scenario.
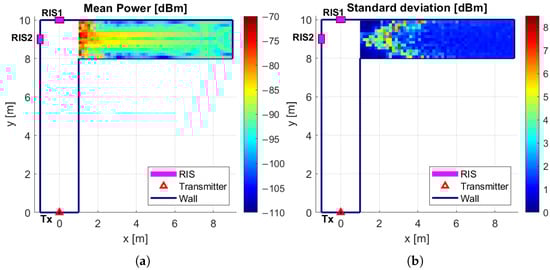
Figure 20.
Received power in the second corridor with double RIS configuration: (a) mean value, (b) standard deviation. Specific design scenario.
7. Manufacturing Uncertainty
It is well known that the RIS manufacturing process is subject to tolerances, which introduce uncertainties in the geometric dimensions of the elements composing the unit cells. These uncertainties, in turn, affect the phase delay introduced by each re-radiating element.
To model this effect, we considered a Phoenix unit cell [33]. Its reflection coefficient phase delay has been analyzed, under the locally periodicity assumption, as a function of the element dimension by using the Ansys High Frequency Structure Simulation Software (HFSS), specifically the student version of Ansys Electronics Desktop 2024 R2 [34]. Then, a uniform dimensional error of 70 μm has been applied to the nominal dimension of the elements.
A comparison between the far field patterns of a plane wave reflected at 60°, with and without the introduced phase error, is shown in Figure 21a, for the LoS-based design. The results show that manufacturing uncertainties generate secondary gratings. In particular, the lobe in the specular direction of the RIS (°) increases by approximately dB, and an additional pronounced side lobe appears at azimuth °.
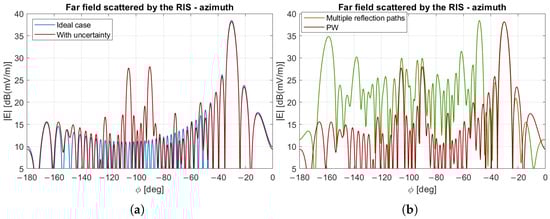
Figure 21.
Far field pattern in case of 70 μm error for the case of a single RIS. (a) LoS-based design when the RIS is assumed in isolation, without (blue) or with (red) dimensional error. (b) LoS-based design when the dimensional error is present, and the RIS is in isolation (red) or the actual impinging field on the RIS due to the presence of the corridor is considered (green).
In Figure 21b, the far field pattern is compared for two cases under the presence of phase errors: When the RIS is illuminated by a plane wave incident orthogonally on it, and when the incident field includes ray paths undergoing up to six reflections. This comparison clearly demonstrates that multiple reflections within the environment have a significantly greater impact on the RIS response than manufacturing imperfections. The effects of phase error due to production uncertainty, as studied in the specific case design, yield the same overall outcomes.
8. Frequency Behavior
A preliminary analysis was carried out to assess the frequency dependence of the adopted RIS model. Figure 22a reports the far-field patterns of a single RIS (i.e., RIS1), designed at the central frequency ( GHz) for the LoS-based configuration to steer the reflected beam at °, °) in the global coordinate system, when illuminated at , 28, and GHz. The corresponding far-field patterns of the double RIS configuration are shown in Figure 22b. In both cases, the radiation pattern squints from the nominal direction as the operating frequency moves away from the design value. An angular deviation of approximately 2° is observed for the single, and about 3° for the double configuration.
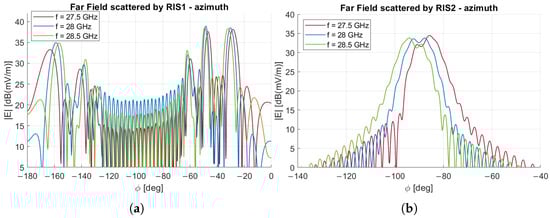
Figure 22.
Far-field pattern in the ° plane versus frequency for the single and double RIS configuration designed at GHz: (a) single RIS configuration pointing at °, , (b) double RIS configuration.
This behavior is consistent with the intrinsic frequency sensitivity of RIS unit cells. Since the unit-cell response is strongly dependent on the operating wavelength, variations in frequency alter the effective electrical size of the elements and the phase progression achievable across the surface.
Although we did not perform any optimization of the unit-cell geometry for broadband operation, since it was not within the scope of the present work, and the reported results should be considered preliminary, the limited squint in the band 27.5–28.5 GHz is sufficient to cover, for example, the n261 5G band in the FR2 range.
To increase the frequency bandwidth and to cover the entire n257 or n258 bands, multiresonant and/or multilayer unit cells needed to be adopted. However, these solutions increase the RIS cost, since in printed technology it is proportional to the number of layers and metalizations. Recently, dielectric-only reflective surfaces have been proposed [35] that exhibit broadband performance while keeping complexity low. However, a dedicated study to improve the bandwidth performance of the RIS elements is required, which is out of the scope of this work.
9. Conclusions
This paper addresses a common signal coverage issue in indoor environments through a simulation-based study of an L-shaped corridor. A fast, computationally efficient ray-tracing algorithm was developed to model electromagnetic propagation in this scenario accurately. The proposed tool was used to analyze the response of a passive reflective intelligent surface to an incident electromagnetic field shaped by reflections from walls, the floor, and the ceiling. Results indicate that paths with few reflections are sufficient to accurately describe the incident field. A key finding is that these reflection paths are responsible for generating strong side lobes in the azimuthal plane, with amplitudes close to those of the direct path. Moreover, the amplitude of these lobes exceeds that of those potentially caused by manufacturing uncertainties, reinforcing the need for careful environmental considerations in the RIS design phase.
Better performance is achieved when the RIS is designed based on the actual field impinging on its surface, rather than assuming an ideal plane wave. However, this solution is highly sensitive to positioning errors. Even small displacements can significantly reduce the main beam amplitude and increase undesired secondary lobes. The results suggest that, to fully exploit the performance of an RIS designed at GHz explicitly for the given environment, the positioning error should remain below cm (i.e., approximately one wavelength). If such placement accuracy cannot be ensured, a design that considers a single plane wave impinging on the RIS is a more robust and reliable solution. A statistical analysis of the received power in the shadowed area as a function of RIS positioning uncertainty confirms this sensitivity, revealing pronounced power variations near the first nulls of the RIS radiation pattern. In contrast, more stable performance is found around the main beam direction.
Among the tested configurations, using a single RIS designed to reflect at 60° from its normal direction provides improved coverage compared to the no-RIS case, but still leaves significant signal gaps. Similarly, a single RIS reflecting at 80° introduces a critical coverage hole adjacent to the main beam. In contrast, the proposed double-RIS configuration yields the best results, enhancing the received signal power by approximately dB at the farthest point in the corridor and ensuring more symmetrical, nearly uniform coverage across the shadowed area, thanks to an appropriately tailored phase profile for the second RIS.
Author Contributions
Conceptualization, A.B., A.F., P.P. and A.M.; methodology, A.B., A.F., P.P. and A.M.; software, A.B.; validation, A.B., A.F., P.P. and A.M.; formal analysis, A.B., A.F., P.P. and A.M.; investigation, A.B., A.F., P.P. and A.M.; resources, A.F., P.P. and A.M.; data curation, A.B., A.F., P.P. and A.M.; writing—original draft preparation, A.B., A.F., P.P. and A.M.; writing—review and editing, A.B., A.F., P.P. and A.M.; project administration, P.P. and A.M.; funding acquisition, A.F. and P.P. All authors have read and agreed to the published version of the manuscript.
Funding
This study was partially supported by the European Union–Next Generation EU under the Italian National Recovery and Resilience Plan (NRRP), Mission 4, Component 2, Investment 1.3, CUP E13C22001870001, partnership on “Telecommunications of the Future” (PE00000001—program “RESTART”).
Data Availability Statement
The data presented in this study are available on request from the corresponding author.
Conflicts of Interest
The authors declare no conflict of interest.
Abbreviations
The following abbreviations are used in this manuscript:
| LoS | Line of Sight |
| NLoS | Non-line of Sight |
| RIS | Reflective Intelligent Surface |
| RT | Ray Tracing |
| UTD | Uniform Theory of Diffraction |
| WSN | Wireless Sensor Networks |
References
- Di Renzo, M.; Zappone, A.; Debbah, M.; Alouini, M.S.; Yuen, C.; de Rosny, J.; Tretyakov, S. Smart Radio Environments Empowered by Reconfigurable Intelligent Surfaces: How It Works, State of Research, and the Road Ahead. IEEE J. Sel. Areas Commun. 2020, 38, 2450–2525. [Google Scholar] [CrossRef]
- Gong, S.; Lu, X.; Hoang, D.T.; Niyato, D.; Shu, L.; Kim, D.I.; Liang, Y.C. Toward Smart Wireless Communications via Intelligent Reflecting Surfaces: A Contemporary Survey. IEEE Commun. Surv. Tutor. 2020, 22, 2283–2314. [Google Scholar] [CrossRef]
- Hameed, I.; Koo, I. Enhancing Throughput in IoT Networks: The Impact of Active RIS on Wireless Powered Communication Systems. Electronics 2024, 13, 1402. [Google Scholar] [CrossRef]
- Freni, A.; Beccaria, M.; Mazzinghi, A.; Massaccesi, A.; Pirinoli, P. Low-Profile and Low-Visual Impact Smart Electromagnetic Curved Passive Skins for Enhancing Connectivity in Urban Scenarios. Electronics 2023, 12, 4491. [Google Scholar] [CrossRef]
- Hassouna, S.; Jamshed, M.A.; Rains, J.; Kazim, J.R.; Rehman, M.U.; Abualhayja, M.; Mohjazi, L.; Cui, T.J.; Imran, M.A.; Abbasi, Q.H. A survey on reconfigurable intelligent surfaces: Wireless communication perspective. IET Commun. 2023, 17, 497–537. [Google Scholar] [CrossRef]
- Raeisi, M.; Yildirim, I.; Ilter, M.C.; Gerami, M.; Basar, E. Plug-In RIS: A Novel Approach to Fully Passive Reconfigurable Intelligent Surfaces. IEEE Trans. Wirel. Commun. 2024, 23, 14776–14789. [Google Scholar] [CrossRef]
- He, Z.; Shen, H.; Xu, W.; Zhao, C. Low-Cost Passive Beamforming for RIS-Aided Wideband OFDM Systems. IEEE Wirel. Commun. Lett. 2022, 11, 318–322. [Google Scholar] [CrossRef]
- Zhi, K.; Pan, C.; Ren, H.; Chai, K.K.; Elkashlan, M. Active RIS Versus Passive RIS: Which is Superior With the Same Power Budget? IEEE Commun. Lett. 2022, 26, 1150–1154. [Google Scholar] [CrossRef]
- Wu, Q.; Zhang, S.; Zheng, B.; You, C.; Zhang, R. Intelligent Reflecting Surface-Aided Wireless Communications: A Tutorial. IEEE Trans. Commun. 2021, 69, 3313–3351. [Google Scholar] [CrossRef]
- Sejan, M.A.S.; Rahman, M.H.; Shin, B.-S.; Oh, J.-H.; You, Y.-H.; Song, H.-K. Machine Learning for Intelligent-Reflecting-Surface-Based Wireless Communication towards 6G: A Review. Sensors 2022, 22, 5405. [Google Scholar] [CrossRef]
- Vuyyuru, S.K.; Hao, L.; Rupp, M.; Tretyakov, S.A.; Valkonen, R. Modeling RIS from Electromagnetic Principles to Communication Systems—Part I: Synthesis and Characterization of a Scalable Anomalous Reflector. IEEE Trans. Antennas Propag. 2024, 73, 1743–1755. [Google Scholar] [CrossRef]
- El Mossallamy, M.A.; Zhang, H.; Song, L.; Seddik, K.G.; Han, Z.; Li, G.Y. Reconfigurable intelligent surfaces for wireless communications: Principles, challenges, and opportunities. IEEE Trans. Cogn. Commun. Netw. 2020, 6, 990–1002. [Google Scholar] [CrossRef]
- Hong, I.P. Reviews Based on the Reconfigurable Intelligent Surface Technical Issues. Electronics 2023, 12, 4489. [Google Scholar] [CrossRef]
- Yun, Z.; Iskander, M.F. Ray tracing for radio propagation modeling: Principles and applications. IEEE Access 2015, 3, 1089–1100. [Google Scholar] [CrossRef]
- He, D.; Ai, B.; Guan, K.; Wang, L.; Zhong, Z.; Kürner, T. The design and applications of high-performance ray-tracing simulation platform for 5G and beyond wireless communications: A tutorial. IEEE Commun. Surv. Tutor. 2019, 21, 10–27. [Google Scholar] [CrossRef]
- Fuschini, F.; Vitucci, E.M.; Barbiroli, M.; Falciasecca, G.; Degli-Esposti, V. Ray tracing propagation modeling for future small-cell and indoor applications: A review of current techniques. Radio Sci. 2015, 50, 469–485. [Google Scholar] [CrossRef]
- Eertmans, J.; di Cicco, N.; Oestges, C.; Jacques, L.; Vitucci, E.M.; Degli-Esposti, V. Towards Generative Ray Path Sampling for Faster Point-to-Point Ray Tracing. In Proceedings of the 2025 IEEE International Conference on Machine Learning for Communication and Networking (ICMLCN), Barcelona, Spain, 26–29 May 2025. [Google Scholar] [CrossRef]
- Vitucci, E.M.; Albani, M.; Kodra, S.; Barbiroli, M.; Degli-Esposti, V. An Efficient Ray-Based Modeling Approach for Scattering From Reconfigurable Intelligent Surfaces. IEEE Trans. Antennas Propag. 2024, 72, 2673–2685. [Google Scholar] [CrossRef]
- Khelifi, M.; Lioce, S.; Saucez, D.; Dabbous, W. To RIS or not to RIS: A ray-tracing study of RIS-assisted indoor 5G communications. In Proceedings of the EUSIPCO 2025—33rd European Signal Processing Conference, European Association for Signal Processing (EURASIP), Palerme, Italy, 8–12 September 2025. [Google Scholar]
- Huang, J.; Wang, C.X.; Sun, Y.; Huang, J.; Zheng, F.C. A Novel Ray Tracing Based 6G RIS Wireless Channel Model and RIS Deployment Studies in Indoor Scenarios. In Proceedings of the 2022 IEEE 33rd Annual International Symposium on Personal, Indoor and Mobile Radio Communications (PIMRC), Kyoto, Japan, 12–15 September 2022; pp. 884–889. [Google Scholar] [CrossRef]
- Vitucci, E.M.; Fabiani, M.; Degli-Esposti, V. Use of a Realistic Ray- Based Model for the Evaluation of Indoor RF Coverage Solutions Using Reconfigurable Intelligent Surfaces. Electronics 2023, 12, 1173. [Google Scholar] [CrossRef]
- Pozar, D.M.; Targonski, S.D.; Syrigos, H.D. Design of millimeter wave microstrip reflectarrays. IEEE Trans. Antennas Propag. 1997, 45, 287–296. [Google Scholar] [CrossRef]
- Degli-Esposti, V.; Vitucci, E.M.; Renzo, M.D.; Tretyakov, S.A. Reradiation and Scattering From a Reconfigurable Intelligent Surface: A General Macroscopic Model. IEEE Trans. Antennas Propag. 2022, 70, 8691–8706. [Google Scholar] [CrossRef]
- Khawaja, W.; Ozdemir, O.; Erden, F.; Ozturk, E.; Guvenc, I. Multiple Ray Received Power Modeling for mmWave Indoor and Outdoor Scenarios. IET Microw. Antennas Propag. 2020, 14, 1825–1836. [Google Scholar] [CrossRef]
- Ulaby, F.T.; Long, D.G. Microwave Radar and Radiometric Remote Sensing; The University of Michigan Press: Ann Arbor, MI, USA, 2014. [Google Scholar]
- Wang, M.; Wang, Y.; Li, W.; Ding, J.; Bian, C.; Wang, X.; Wang, C.; Li, C.; Zhong, Z.; Yu, J. Reflection Characteristics Measurements of Indoor Wireless Link in D-Band. Sensors 2022, 22, 6908. [Google Scholar] [CrossRef]
- Zhekov, S.S.; Franek, O.; Pedersen, G.F. Dielectric Properties of Common Building Materials for Ultrawideband Propagation Studies [Measurements Corner]. IEEE Antennas Propag. Mag. 2020, 62, 72–81. [Google Scholar] [CrossRef]
- Kouyoumjian, R.G.; Pathak, P.H. A Uniform Geometrical Theory of Diffraction for an Edge in a Perfectly Conducting Surface. Proc. IEEE 1974, 62, 1448–1461. [Google Scholar] [CrossRef]
- Luebbers, R.J. Finite Conductivity Uniform GTD Versus Knife Edge Diffraction in Prediction of Propagation Path Loss. IEEE Trans. Antennas Propag. 1984, 32, 70–76. [Google Scholar] [CrossRef]
- Carluccio, G.; Puggelli, F.; Albani, M. Generalization of UTD double diffraction to the case of impenetrable wedges with relatively general boundary conditions. IEEE Trans. Antennas Propag. 2014, 62, 3829–3834. [Google Scholar] [CrossRef]
- Stratton, J.A. Electromagnetic Theory; McGraw-Hill: New York, NY, USA, 1941. [Google Scholar]
- Carluccio, G.; Mazzinghi, A.; Freni, A. Design of complementary reflectarray. Electron. Lett. 2014, 50, 16–17. [Google Scholar] [CrossRef]
- Moustafa, L.; Gillard, R.; Peris, F.; Loison, R.; Legay, H.; Girard, E. The phoenix cell: A new reflectarray cell with large bandwidth and rebirth capabilities. IEEE Antennas Wirel. Propag. Lett. 2011, 10, 71–74. [Google Scholar] [CrossRef]
- Ansys HFSS. 2025. Available online: https://www.ansys.com/products/electronics/ansys-hfss (accessed on 1 December 2025).
- Beccaria, M.; Massaccesi, A.; Lumia, M.; Addamo, G.; Freni, A.; Pirinoli, P. Ka-Band Reflectarray with Cylindrical Dielectric Unit Cells: Optimized Additive Manufacturing and High-Permittivity Material Characterization. Sensors 2025, 25, 5480. [Google Scholar] [CrossRef] [PubMed]
Disclaimer/Publisher’s Note: The statements, opinions and data contained in all publications are solely those of the individual author(s) and contributor(s) and not of MDPI and/or the editor(s). MDPI and/or the editor(s) disclaim responsibility for any injury to people or property resulting from any ideas, methods, instructions or products referred to in the content. |
© 2025 by the authors. Licensee MDPI, Basel, Switzerland. This article is an open access article distributed under the terms and conditions of the Creative Commons Attribution (CC BY) license (https://creativecommons.org/licenses/by/4.0/).