Abstract
The capacitor is a key component in power electronic transmission systems. The decrease in capacitance and increase in equivalent series resistance (ESR) serve as critical parameters for characterizing the aging state of capacitors. To address this, this paper proposes a convolutional neural network-long short-term memory (CNN-LSTM) model for predicting the aging state and remaining useful life (RUL) of capacitors. First, the parameter dispersion characteristics of capacitance change rate and ESR are analyzed. A CNN-LSTM hybrid model is constructed, along with a prediction framework for aging state evaluation and RUL estimation. Second, an accelerated aging test platform for aluminum electrolytic capacitors is built, and eight sets of capacitor aging experiments are conducted. Finally, the effectiveness of the proposed method is validated. Comparative results show that the CNN-LSTM model achieves higher accuracy in aging parameter evaluation compared to the traditional LSTM model and yields smaller errors in RUL prediction than the conventional Arrhenius lifetime model.
1. Introduction
In modern power electronics, capacitors, as pivotal energy storage components, are extensively employed in diverse power electronic systems. Their performance and service life directly determine the reliability and stability of such systems. Statistical analyses on module failures in power electronic systems indicate that the failure probability of capacitors is as high as 30% []. During operation, capacitors undergo aging under the combined effects of voltage, current, frequency, temperature, and other factors, which results in a reduction in capacitance (C) and an elevation in equivalent series resistance (ESR). These parameter variations can adversely affect the normal operation of the associated equipment [,,]. Therefore, accurately assessing the aging state of capacitors and predicting their remaining useful life (RUL) is of great significance for guaranteeing their long-term reliable service.
In the production and manufacturing process of power electronic devices, even devices with the same model exhibit parameter differences due to factors such as manufacturing technology, material characteristics, and environmental conditions [,]. Owing to the influence of the manufacturing process, the initial parameters of C and ESR of capacitors show dispersion. Such parameter dispersion can affect the electrical performance and aging life of capacitors during operation.
At present, aging experiments, multi-physics models, and data statistics are mainly used for capacitor state assessment. Reference [] used capacitor aging tests to analyze changes in dielectric loss and constants during the aging process of capacitor devices. Reference [] established a capacitor thermal network model and a multiphysics field model to obtain the temperature variation law of capacitors. Reference [] established models for the electrical and thermal fields of capacitors and obtained changes in C, ESR, and temperature during the aging process. The above literature has obtained the parameter variation law of the capacitor aging process through aging experiments and multi-physics field models but ignores the dispersion of capacitor parameters.
In terms of modeling the lifespan of capacitors, the Arrhenius model and Peck model are mainly used to establish the remaining lifespan model. These models extract parameters such as C decrease and ESR increase from accelerated aging tests and fit them into the lifespan model to obtain average lifespan predictions []. In [], empirical models for C and ESR were established, and the equivalent service time was calculated based on the aging state of the capacitor. RUL was then obtained by subtracting these results from the lifespan given in the data sheet. Statistical models mainly analyze aging data through statistical methods, including the Weibull distribution, Wiener distribution, and Gamma distribution []. In [], a simple two-stage RUL prediction method for capacitors was proposed based on a Wiener distribution model with linear drift. However, empirical formulas and statistical models often rely on experimental data and assumptions, with relatively fixed model parameters that make them difficult to adapt to changes in capacitor performance and nonlinear degradation under different conditions. Additionally, the study in [] investigated the impact of surface humidity and ESR parameter differences on the lifespan model of capacitors. Therefore, ignoring the differences in capacitor parameters will affect the accuracy of capacitor RUL prediction.
Data-driven, machine learning, and deep learning methods can improve the accuracy of predicting the lifetime of power electronic devices to a certain extent. These methods have been widely applied to the state assessment and life prediction of power electronic devices. Alghassi et al. used the k-means clustering method to predict the aging state of IGBTs [] and applied a support vector machine (SVM) method based on time-domain fault features to detect abnormal states of IGBTs []. The relevance vector machine (RVM) method has been used for fault diagnosis of cascaded H-bridge multilevel inverters []. However, machine learning methods are susceptible to factors such as data noise and measurement errors. In [], the authors proposed a method for predicting the RUL of power semiconductor devices under noisy and non-periodic condition monitoring. In recent years, deep learning methods—especially convolutional neural networks (CNN) and long short-term memory (LSTM) networks—have been increasingly applied to the state assessment and life prediction of power electronic devices due to their powerful feature extraction capabilities []. In [], the authors proposed a deep learning method based on CNN for time-series prediction and anomaly detection, while in [], they proposed a health monitoring method using fuzzy neural networks to predict C and ESR. In [], the authors proposed Transformer models based on a generalized REF framework to predict parameter changes in renewable energy forecasting, which is also an efficient method for predicting capacitor parameters in the future. Compared with conventional deep learning techniques, transformer models achieve a significant improvement in forecasting accuracy. However, existing research mostly focuses on predicting the life of individual capacitors, neglecting the impact of parameter differences between capacitors on their life.
This paper aims to propose a method for evaluating the aging state and predicting the RUL of capacitors based on a CNN-LSTM network, fully considering the influence of discrete C values and ESR parameters of capacitors. Firstly, the mechanism of capacitor parameter dispersion is analyzed, and a CNN-LSTM network is proposed for the aging state assessment and RUL prediction model. Secondly, by conducting accelerated aging experiments on capacitors of the same model, time-series data of capacitor C and ESR are obtained, verifying that the capacitor state parameters follow a normal distribution. Finally, applying these data to the proposed model significantly improves the accuracy of aging state evaluation and RUL prediction.
2. Aging State Evaluation and Remaining-Life-Prediction Methods Based on a CNN-LSTM Network
2.1. Parameter Dispersion Characteristics
Due to the influence of manufacturing processes and materials, there are differences in the performance parameters of aluminum electrolytic capacitors (AECs) of the same model. Consequently, under the same operating conditions, the degradation processes of characteristic parameters such as capacitance change rate (ΔC) and ESR of AECs also exhibit certain differences. Therefore, based on Bayesian statistical theory, ΔC and ESR can be regarded as a set of random variables with specific probability distribution characteristics. This paper employs a normal distribution function to describe the differences in the parameters and degradation processes of ΔC and ESR in the AECs [,,,]:
where μ and σ are the mean and variance of the normal distribution, respectively. f (xi) is the probability density function of the normal distribution, which can be calculated using Equations (2)–(4).
where i = 1, 2 represent the two model parameters, x1 and x2, mean the degradation model; n is the total number of samples involved in the calculation; and k = 1, 2, …, n represent the current set of sample data.
2.2. CNN-LSTM Network Model
The convolutional neural network (CNN) is a neural network model that is widely used in fields such as computer vision and natural language processing. Convolution operation, a widely used mathematical operation in image processing and signal processing, is the core part of this model. Convolution can merge two functions into a new function, reflecting their relationship.
In mathematics, the convolution of two functions is defined as the integral of their integrals. For continuous functions f (x) and g (x), their convolution is defined as follows:
where * represents convolution operation, t is the integral variable, x is the displacement variable. The result of convolution is a new function that represents the relationship between f and g. In practical applications, discrete convolution is commonly used, which replaces continuous functions with discrete functions and replaces integration with summation. The definition of discrete convolution is as follows:
where [n] is the discrete value of the function, [m] is the sun variable, and f and g are both discrete functions.
CNN-LSTM networks are trained using a gradient-based backpropagation algorithm. The model mainly includes convolutional layers, pooling layers, LSTM layers, and fully connected layers, as shown in Figure 1.
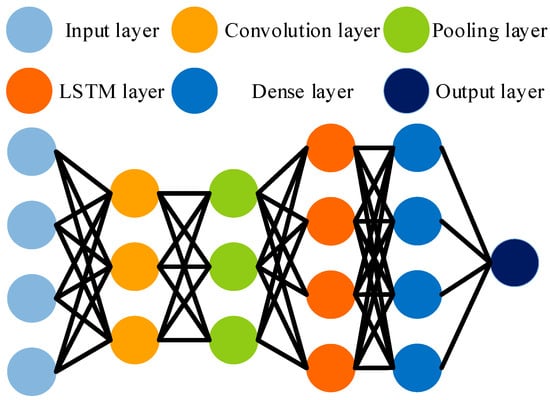
Figure 1.
Architecture of CNN-LSTM network.
- (a)
- Convolutional Layer
The convolutional layer is one of the most important components in CNNs, responsible for extracting features from the input data. In convolutional layers, a set of convolution kernels is defined to perform convolution operations on input data, resulting in a series of feature maps. Convolution operations can effectively capture local features and spatial structures, enabling feature extraction and representation of input data. The calculation formula is as follows:
where hi,j,k are the output of the k-th convolution kernel at position (i, j), xi+m,j+n are the pixel values of the input image at position (i + m, j + n), wm,n,k are the weights of the kth convolution kernel at position (m, n), bk is the bias term of the k-th convolution kernel, and M and N are the sizes of the convolution kernels.
- (b)
- ReLU Activation
The activation function introduces nonlinear factors, enabling neural networks to learn complex nonlinear relationships. Common activation functions include ReLU (Rectified Linear Unit), Sigmoid, and Tanh. The ReLU function can effectively alleviate the gradient vanishing problem and accelerate the convergence of the network, which is defined as follows:
- (c)
- Pooling Layer
The pooling layer adopts maximum pooling as shown in Equation (9). The pooling layer is used to downsize and sample the feature maps output by the convolutional layer to reduce the number of model parameters and computational complexity. It preserves important information and reduces data volume by taking the maximum or average value in a specific region. Pooling operations can also enhance the robustness of the model to translation and scale changes and improve the model’s generalization ability.
- (d)
- LSTM Layer
The long short-term memory (LSTM) network is a recurrent neural network (RNN) variant specifically designed to handle and predict long-term dependencies in time series data. LSTM effectively addresses the vanishing gradient problem that standard RNNs encounter for long sequences by introducing multiple gating mechanisms. The core of an LSTM network is its cell state and hidden state, which can carry long-term information. The structure of the LSTM layer involves the following components as (10)–(15): the input gate determines which new information will be added to the cell state; the forget gate decides which information will be removed from the cell state; the candidate memory cell generates new information to be added to the cell state, uses the input, and forget gates to update the cell state; and the output gate decides which information will be output from the cell state, generating the current hidden state based on the output gate and the current cell state.
where it is the activation value of the input gate at the current time step, σ is the Sigmoid activation function, Wi is the weight matrix for the input gate, ht−1 is the hidden state from the previous time step, xt is the input at the current time step, and bi is the bias term for the input gate. ft is the activation value of the forget gate at the current time step, Wf is the weight matrix for the forget gate, and bf is the bias term for the forget gate. Cn is the candidate memory cell at the current time step, WC is the weight matrix for the candidate memory cell, and bC is the bias term for the candidate memory cell. The tanh function is the hyperbolic tangent activation function, Ct is the cell state at the current time step, Ct−1 is the cell state from the previous time step, ot is the activation value of the output gate at the current time step, Wo is the weight matrix for the output gate, bo is the bias term for the output gate, and ht is the hidden state at the current time step.
- (e)
- Fully Connected Layer
The fully connected layer is usually located in the last few layers of a convolutional neural network and is responsible for combining and classifying the features extracted by the convolutional and pooling layers. Each neuron in the fully connected layer is connected to all neurons in the previous layer, and advanced feature learning and classification of input data are achieved by learning weights and bias parameters. The fully connected layer flattens the feature map output by the pooling layer into a one-dimensional vector, and then multiplies it with the weight matrix to obtain the output:
where x is the input one-dimensional vector (flattened feature map), W is the weight matrix, b is the bias vector, and y is the output vector, in this article, the output is the RUL of capacitor.
2.3. Aging Status Assessment and RUL Prediction Process
Based on the input features, the model evaluates the aging state of the capacitor, outputs the predictive classification of the aging state, and predicts the RUL, as shown in Figure 2.
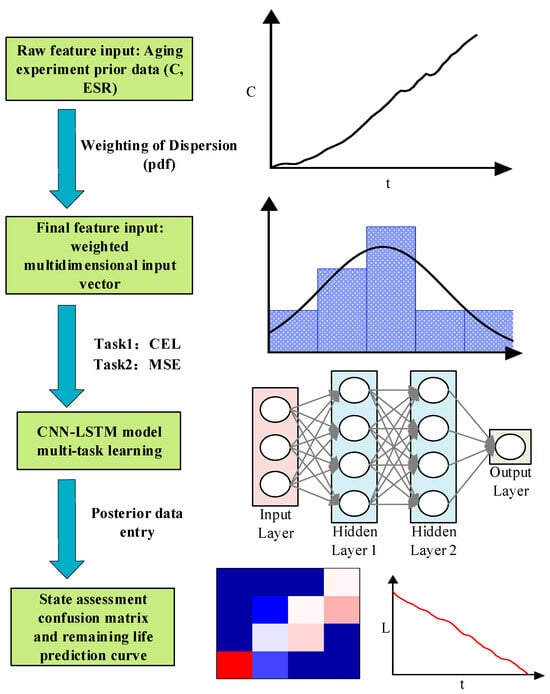
Figure 2.
CNN-based process for aging status assessment and RUL prediction.
Firstly, the capacitance loss ΔC and ESR from the prior data were extracted as features, and the aging state and RUL of the prior data were extracted as guidance for the model task. The capacitance loss ΔC is calculated using Equation (17).
where C0 is the capacitance initial value, Ct is the capacitance test value at test time.
Then, the mean and variance of the normal distribution of capacitance parameters (ESR and ΔC) at each time point were calculated from Equations (2)–(4), and the corresponding probability density (PDF) was calculated, the PDF method is an effective weighting method for analyzing the differences in aging parameters of power devices []. The PDF was standardized according to Equation (18), the original features were weighted as the weight value of each feature, the weights of wi are applied per sample per time step, and the final features were obtained from Equation (19) as input to the CNN-LSTM model (state evaluation and life prediction). The CNN-LSTM model performs multi-task learning, in which task 1 is the classification task of state assessment, task 2 is the time series regression task of life prediction, the task 1 and task 2 use a shared CNN-LSTM backbone, and the final loss is computed through a weighted sum. The loss functions of the classification task and the time series regression task are given in Equations (20) and (21), respectively. The cross-entropy loss function (CEL) was used for classification tasks, and the mean square error loss function (MSE) was used for time series regression tasks. The cross-entropy loss function and the mean square error loss function are used separately. The cross-entropy loss function is used to evaluate the aging state of the capacitor, because the aging parameters of capacitors with the same model under the same conditions are dispersed. While the mean square error loss function is used to evaluate the RUL of the capacitor, the aging process of capacitors is time continuous.
The model was trained using an adaptive momentum estimation (Adam) optimizer, and the model performance was monitored using the validation set. The trained model was used to predict the a posteriori data, and the confusion matrix and remaining life curve were output to evaluate the performance of model state evaluation and life prediction, respectively. The CNN-LSTM model hyperparameters are listed below: the CNN kernel size is [,]. There are two layers in the CNN-LSTM model, in first layer the filter is 16, in second layer the filter is 32. The batch size is 64. The number of epochs is 1000. The early stopping criteria is 50. The learning rate is 1 × 10⁻³.
3. Accelerated Aging Experiment of AECs
In order to quantify the parameter dispersion, detailed experiments and analyses were carried out on aluminum electrolytic capacitors of the same type. Eight Hitachi HCGF5A2W5611 AECs from the same manufacturer were selected for measurement, the maximum rated voltage for the AECs is 450 V, the maximum leakage current for the AECs is 5 mA, the maximum ripple current is 6.7 A, and the maximum temperature for the AECs is 85 °C []. Aging experiments were performed on AECs using a high-temperature and constant-voltage aging test platform, as shown in Figure 3.
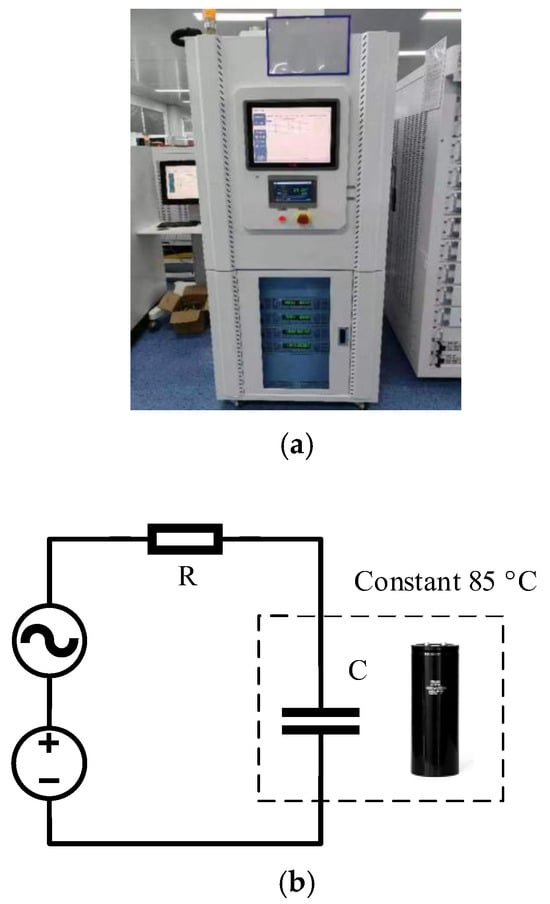
Figure 3.
Accelerated aging experiment. (a) High-temperature and constant-pressure test chamber. (b) Experimental circuit diagram.
A DC voltage source of 450 V was set according to the rated voltage. The voltage was derived from an AC ripple with 12 A for accelerated aging with is about 1.7 times higher than the rated ripple current. A resistor R was connected in series for protection, the temperature was set to 85 °C, which is the highest operation temperature based on the datasheet. The ESR and ΔC values were measured once every 20 h after cooling to 20 °C using a digital bridge, the cooling time for each period is about 20 min, the whole experiment time for a capacitor is 1000 h. The experimental results of ΔC and ESR are shown in Figure 4.
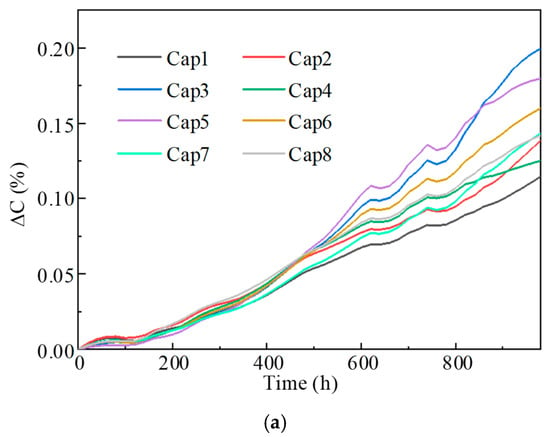
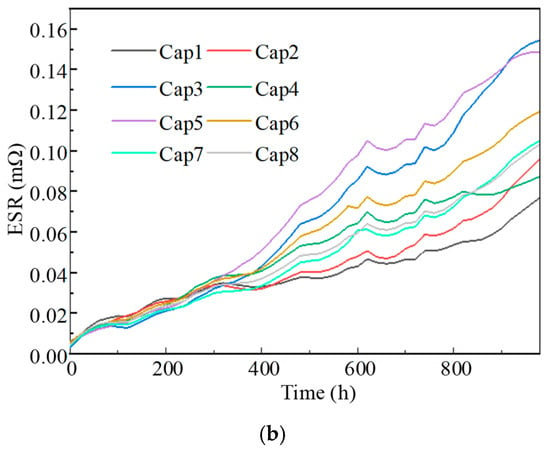
Figure 4.
Accelerated aging test results. (a) ΔC. (b) ESR.
The results of the accelerated aging experiment of capacitors indicate that as the capacitor operates, the ΔC and ESR of the capacitor continue to increase. After running for 400 h, it can be clearly seen that at the same time, the state parameters of capacitors with the same model will exhibit different aging states. Based on literature [], in order to predict the life of power electrical device with higher than 90% accuracy, at least six sets of aging data are required for training in order to accurately evaluate the life of capacitors. Therefore, the first six sets of capacitor data were selected as the training data set to analyze the impact of capacitor aging on ΔC and ESR. A capacitance variation of 5% to 20% is commonly used as the fault threshold for capacitors. In this study, a ΔC value of 12% was defined as the fault threshold for capacitors [,].
Based on the references [,], the aging data of the ΔC and ESR follows normal distribution. Extracting the experimental results of ΔC and ESR at 600 h, a Kolmogorov–Smirnov test with a significance of 0.05 was performed on the normal distribution at each time point. Figure 5 shows the normal distribution of ΔC and ESR, and the p-values of ΔC and ESR at each time during the experiment.
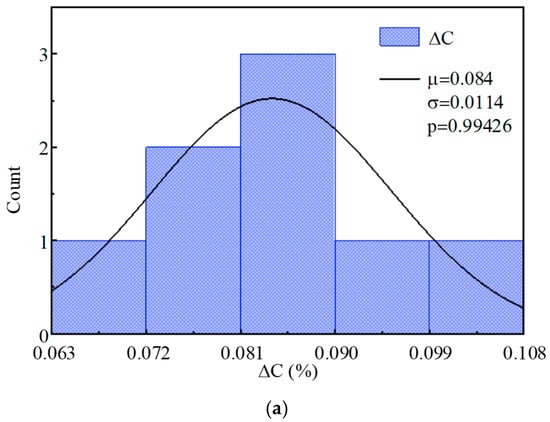
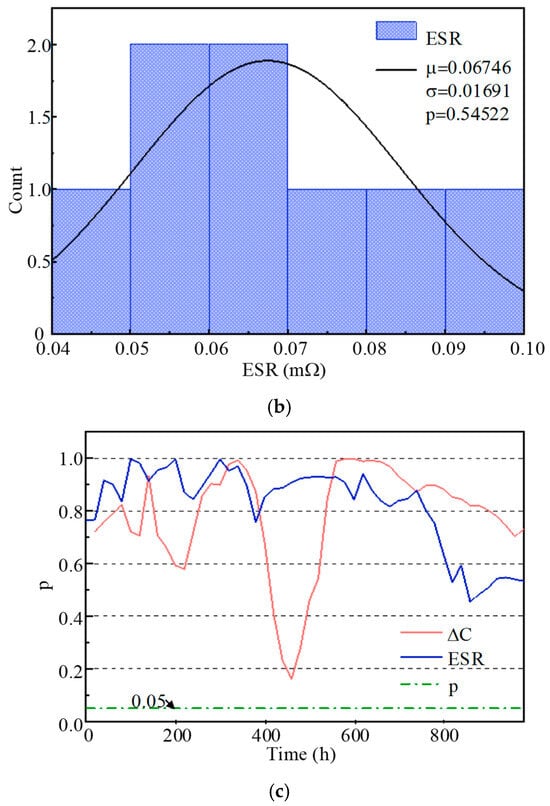
Figure 5.
The 600 h parameter distribution and KS test. (a) Normal distribution of ΔC. (b) Normal distribution of ESR. (c) p-values of ΔC and ESR.
As shown in Figure 5, the eight sets of experiment data of ΔC and ESR follows normal distribution, and the p-values of ΔC and ESR are all greater than 0.05 at each time during experiment, which indicates that all the data in the experimental results conforms to a normal distribution.
4. Evaluation of Capacitor Aging Status and RUL Prediction Results
4.1. Aging State Assessment
- (a)
- K-means algorithm
Based on the experimental results in Figure 4, in order to verify the accuracy of the established model, a k-means clustering algorithm model was constructed using the capacitance value test data of capacitor 1 to capacitor 6. Each data point was based on real measurement results every 20 h. According to Euclidean distance, the data was divided into four clusters, which are sequentially categorized as healthy states—normal, mild aging, severe aging, and exhaustion—corresponding to labels 1, 2, 3, and 4, respectively. The data of capacitor 7 and capacitor 8 were used as test sets for state evaluation and prediction. The feature clustering distribution of the trained model, the confusion matrix of the training set, and the state evaluation and prediction of the testing set are shown in Figure 6.
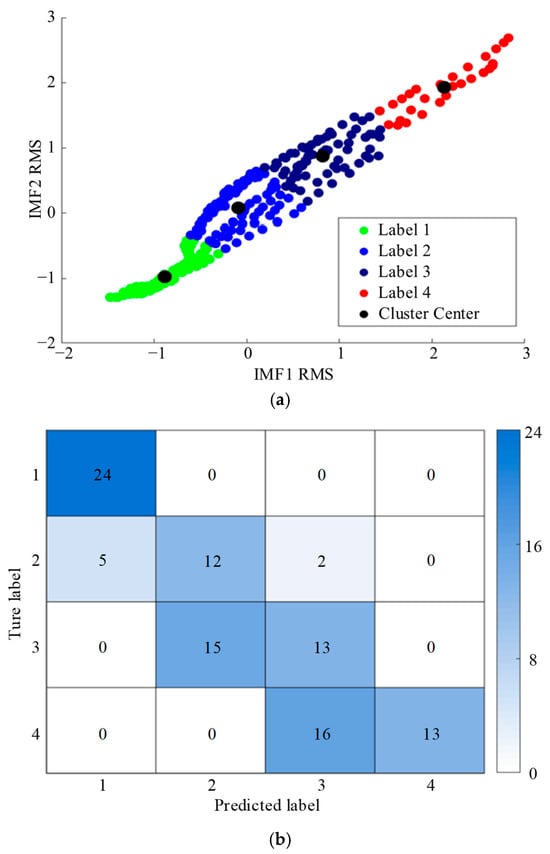
Figure 6.
Assessment results of k-means. (a) Feature clustering results. (b) The results of k-means.
The results indicate that the accuracy of state assessment using the k-means algorithm model is relatively low, reaching only 62%. As evidenced by the feature clustering graph, the parameter dispersion during the aging process of capacitors leads to significant parameter fluctuation, resulting in unstable cluster center positions in k-means clustering. Moreover, the k-means algorithm is unable to accurately learn the distribution characteristics of parameter dispersion, which consequently limits the model’s generalization capability and leads to inaccurate classification.
- (b)
- Failure threshold equal divide
The training data were input into the capacitor aging state assessment and remaining lifespan prediction model established in Section 2. The classification metric of this model is presented in Table 1, with a failure criterion of Δ = 12% and defined state levels.

Table 1.
Vibration and power cycling parameters of experiment.
After training, the test data were input, and the aging state assessment confusion matrix is shown in Figure 7. In this confusion matrix, the diagonal elements represent the accuracy of each category, with the shade of color clearly indicating the magnitude of accuracy. The results demonstrate that the CNN-LSTM model achieved an accuracy rate of 96.7% for the training set and 99% for the test set, which is significantly higher than the accuracy rate of the k-means clustering algorithm.
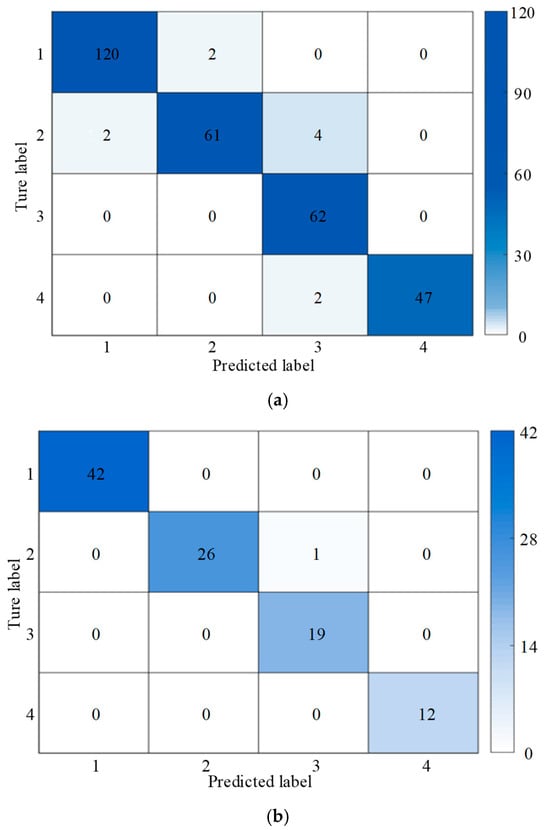
Figure 7.
Assessment results of CNN-LSTM model. (a) Results of the training set. (b) Results of the test set.
Therefore, when evaluating the aging state of capacitors, dividing the failure threshold equally and then using the CNN-LSTM method for evaluation yields higher accuracy. The small errors observed in the training set can be attributed to the noise present during the sample extraction process. Despite the presence of noise, the CNN-LSTM model still maintains extremely high accuracy.
4.2. RUL Prediction
To verify the effectiveness of the CNN-LSTM model for RUL prediction of capacitor, the Arrhenius life model of capacitor was used to compare it with the proposed model. The Arrhenius model for capacitor life calculation is calculated by Equation (22), the RUL calculates by Equation (23) [].
where LT is the life of the capacitor at operation temperature T, L0 is the rated life of the capacitor at operation temperature T0, a is the calculation coefficient, LRUL is the remaining-useful-life of the capacitor, which means time-to failure from current time of the capacitors. LLIFE is the whole lifetime of the capacitor, and LUSE is the used life of the capacitor, which is obtained from the experimental result. The prediction results for the remaining lifespan are shown in Figure 8.
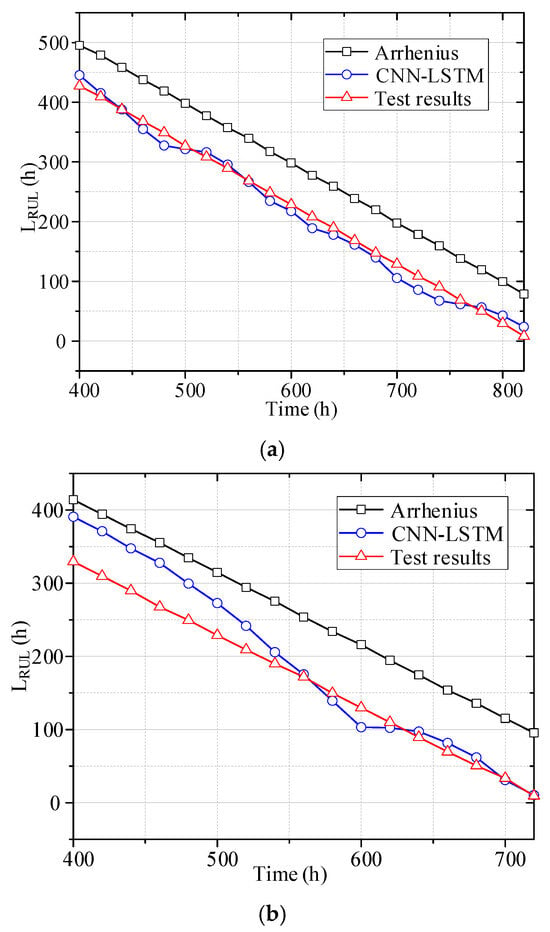
Figure 8.
Predicted RUL and true RUL. (a) RUL of capacitor 7. (b) RUL of capacitor 8.
Using relevance (R), mean absolute error (MAE), and mean relative error (MRE) as evaluation metrics for the model’s RUL prediction, the results are presented in Table 2. For capacitor 7, the correlation index reached 99.73%, with a mean error of 13.5, demonstrating the excellent predictive performance of the proposed CNN-LSTM model.

Table 2.
Metrics of predicted RUL.
As shown in Table 2, the results for Capacitor 8 show a higher MAE and MRE. As shown in Figure 4, before 400 h, the ESR and capacitance change rate of capacitor 8 had a lower rate of increase, which resulted in RUL evaluation results being higher than the true remaining life. After 500 h, the capacitance and ESR change rates of capacitor 8 were almost the same as those of capacitor 7, gradually bringing the RUL evaluation results closer to the true values.
Table 3 presents the predicted RUL by the CNN-LSTM model at 600 h, along with the actual RUL and the lifespan predicted by the Arrhenius model. After 600 h of operation, the actual RUL of capacitor 7 is about 230 h. The method proposed in this paper predicts 219 h with an error of 11 h, while the Arrhenius model calculates 300 h with an error of 70 h. After 600 h of operation, the actual RUL of capacitor 8 is about 130 h. The method proposed in this paper predicts a result of 107 h with an error of 23 h, while the Arrhenius model calculates a result of 215 h with an error of 85 h. Therefore, the proposed method in this study significantly more precise predictions of the RUL compared to the Arrhenius model.

Table 3.
Comparison of predicted RUL after 600 h.
The feature parameters were tracked during the time series regression prediction, and the tracking results obtained are shown in Figure 9. It can be seen that the direct use of LSTM for time series prediction may lead to insufficient learning ability or overfitting, resulting in inaccurate prediction results, while the CNN-LSTM method can effectively extract the spatial features in the prior data, accurately learn the dispersion of feature parameters, and improve the prediction reliability.
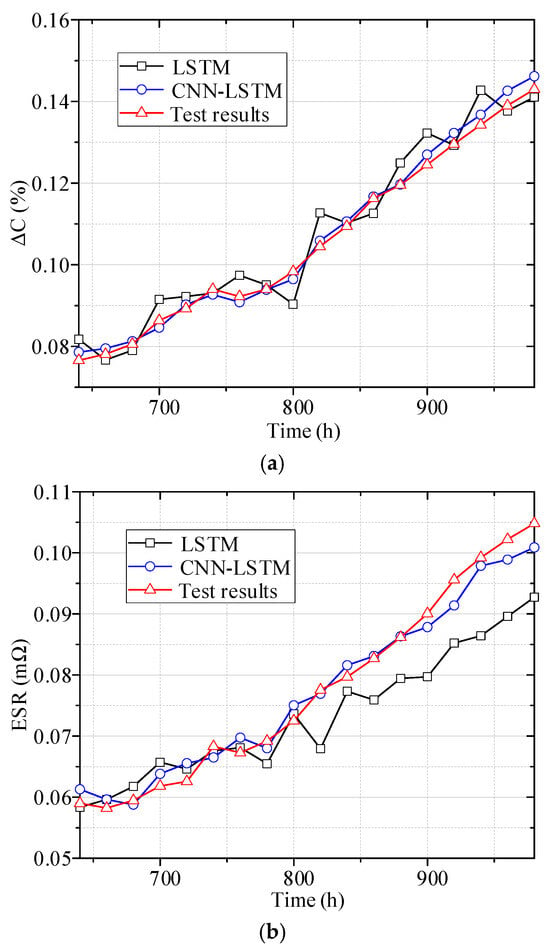
Figure 9.
Parameter time series prediction of capacitor 7. (a) ΔC of capacitor 7. (b) ESR of capacitor 7.
Table 4 shows the R, MAE, and MRE of the ΔC predicted with the LSTM and CNN-LSTM models. For the LSTM model, the relevance is 97.9%, the MAE is 0.0038, and the MRE is 0.0371. For the CNN-LSTM model, the relevance is 99.8%, the MAE is 0.0016, and the MRE is 0.0005. The CNN-LSTM model used for predicting the ΔC of the capacitor has higher relevance and lower MAE and MRE.

Table 4.
Metrics of predicted ΔC with the LSTM and CNN-LSTM models.
Table 5 shows the R, MAE, MRE of predicted the ESR with the LSTM and CNN-LSTM model. For the LSTM model, the relevance is 97.8%, the MAE is 0.0056, the MRE is 0.0648. For the CNN-LSTM model, the relevance is 99.3%, the MAE is 0.0020, the MRE is 0.0256. Compared to the LSTM model, the CNN-LSTM model used for predicting the ΔC and ESR has lower MAE and MRE and higher R values. Using the CNN-LSTM model for evaluating the aging state of capacitors has higher accuracy.

Table 5.
Metrics of predicted ESR with the LSTM and CNN-LSTM model.
5. Conclusions
This study constructed a CNN-LSTM model that considers parameter dispersion to achieve capacitor aging state assessment and RUL prediction. The experimental results show that the parameter dispersion caused by manufacturing processes significantly affects the aging rate and remaining life of capacitors. The model uses experimental data from six capacitors of the same model as the training set, and data from two capacitors as the test set. The characteristic parameters are capacitor capacitance loss ΔC and ESR. By introducing the normal distribution feature to account for parameter dispersion, the model exhibits good fitting and prediction capabilities, with accuracy and robustness far superior to those of empirical models (e.g., the k-means model, the Arrhenius model) and simplified data-driven methods. The proposed method provides an effective technical approach for evaluating the remaining life of aluminum electrolytic capacitors, such as Hitachi HCGF5A Series. In the future, to better calibrate the capacitor RUL model, more experiments will be conducted under different operating and humidity conditions.
Author Contributions
Writing—review and editing and validation, Y.J.; project administration, S.P.; funding acquisition, Z.C.; conceptualization, L.L.; formal analysis, W.Z.; data curation, J.L.; methodology, Q.H. All authors have read and agreed to the published version of the manuscript.
Funding
This research was funded by the National Natural Science Foundation of China, grant number U2267206, and by the China National Atomic Energy Agency Stable Support Project, Research on Intelligent Diagnosis and Health Management Technology for Key Electrical Drive Equipment in Nuclear Power Plants, grant number WDZC-2023-05-03-04.
Data Availability Statement
The original contributions presented in this study are included in the article material; further inquiries can be directed to the corresponding authors.
Conflicts of Interest
The authors declare no conflicts of interest.
References
- Khera, N.; Khan, S.A.; Islam, T.; Agarwala, A.K. An intelligent technique for condition based self-maintenance of aluminum electrolytic capacitors. Int. J. Syst. Assur. Eng. Manag. 2016, 7, 25–34. [Google Scholar] [CrossRef]
- Parler, S., Jr. Improved spice models of aluminum electrolytic capacitors for inverter applications. IEEE Trans. Ind. Appl. 2003, 39, 929–935. [Google Scholar] [CrossRef]
- Gasperi, M. Life prediction modeling of bus capacitors in AC variable frequency drives. IEEE Trans. Ind. Appl. 2025, 41, 1430–1435. [Google Scholar] [CrossRef]
- Chang, T.Y.; Wang, X.; Evans, D.; Roberson, S.; Zheng, J. Characterization of tantalum oxide-ruthenium oxide hybrid capacitor. IEEE Trans. Ind. Electron. 2004, 51, 1313–1317. [Google Scholar] [CrossRef]
- Karnik, T.; De, V.; Borkar, S. Statistical design for variation tolerance: Key to continued Moore’s law. In Proceedings of the 2004 International Conference on Integrated Circuit Design and Technology (IEEE Cat. No.04EX866), Austin, TX, USA, 17–20 May 2004; pp. 175–176. [Google Scholar]
- Wu, W.F.; Hsu, T.K.; Su, C.Y.; Chen, Y.C.; Hsu, Y. Effect of parametric randomness on reliability analysis of wafer-level chip-scale packages. In Proceedings of the 2008 International Conference on Electronic Materials and Packaging, Taipei, Taiwan, 22–24 October 2008; pp. 297–300. [Google Scholar]
- Cheng, L.; Li, Z.; Wang, J.; Xu, Z.; Liu, W.; Li, S. Degradation Behavior and Mechanism of Metalized Film Capacitor Under Ultrahigh Field. IEEE Trans. Dielectr. Electr. Insul. 2023, 30, 509–517. [Google Scholar] [CrossRef]
- Lv, C.; Liu, J.; Zhang, Y.; Yin, J.; Zhang, X. A High-Resolution Analytical Thermal Modeling Method of Capacitor Bank Considering Thermal Coupling and Different Cooling Modes. IEEE Trans. Power Electron. 2023, 38, 7674–7684. [Google Scholar] [CrossRef]
- Yao, R.; Li, H.; Lai, W.; Bahman, A.S.; Iannuzzo, F. Lifetime Analysis of Metallized Polypropylene Capacitors in Modular Multilevel Converter Based on Finite Element Method. IEEE J. Emerg. Sel. Top. Power Electron. 2021, 9, 4248–4259. [Google Scholar] [CrossRef]
- Lv, C.; Liu, J.; Zhang, Y.; Lei, W.; Cao, R.; Lv, G. Reliability modeling for metallized film capacitors based on time-varying stress Mission profile and aging of ESR. IEEE Trans. Emerg. Sel. Top. Power Electron. 2021, 9, 4311–4319. [Google Scholar] [CrossRef]
- Abdennadher, K.; Venet, P.; Rojat, G.; Rétif, J.-M.; Rosset, C. A real-time predictive maintenance system of aluminum electrolytic capacitors used in uninterrupted power supplies. IEEE Trans. Ind. Electron. 2010, 46, 1644–1652. [Google Scholar] [CrossRef]
- Zhao, S.; Chen, S.; Wang, H. Degradation modeling for reliability estimation of DC film capacitors subject to humidity acceleration. Microelectron. Reliab. 2019, 100–101, 113401. [Google Scholar] [CrossRef]
- Zhao, J.; Zhou, Y.; Zhu, Q.; Song, Y.; Liu, Y.; Luo, H. A remaining useful life prediction method of aluminum electrolytic capacitor based on wiener process and similarity measurement. Microelectron. Reliab. 2023, 142, 114928. [Google Scholar] [CrossRef]
- Miao, J.; Yin, Q.; Zhao, S.; Li, H.; Wang, H. A Dummy-Variable Model for Humidity-Influenced DC Film Capacitors Lifetime Estimation. IEEE J. Emerg. Sel. Top. Power Electron. 2023, 11, 1056–1070. [Google Scholar] [CrossRef]
- Benmansour, A.; Azzopardi, S.; Martin, J.C.; Woirgard, E. A step by step methodology to analyze the IGBT failure mechanisms under short circuit and turn-off inductive conditions using 2D physically based device simulation. Microelectron. Reliab. 2007, 47, 1800–1805. [Google Scholar] [CrossRef]
- Kiranyaz, S.; Gastli, A.; Ben-Brahim, L.; Al-Emadi, N.; Gabbouj, M. Real-Time Fault Detection and Identification for MMC Using 1-D Convolutional Neural Networks. IEEE Trans. Ind. Electron. 2019, 66, 8760–8771. [Google Scholar] [CrossRef]
- Bandyopadhyay, I.; Purkait, P.; Koley, C. Performance of a Classifier Based on Time-Domain Features for Incipient Fault Detection in Inverter Drives. IEEE Trans. Ind. Inform. 2019, 15, 3–14. [Google Scholar] [CrossRef]
- Zhao, S.; Peng, Y.; Yang, F.; Ugur, E.; Akin, B.; Wang, H. Health state estimation and remaining useful life prediction of power devices subject to Noisy and aperiodic condition monitoring. IEEE Trans. Instrum. Meas. 2021, 70, 3510416. [Google Scholar] [CrossRef]
- Jeong, S.-H.; Park, J.-W.; Kim, H.-S. Deep neural network-based lifetime diagnosis algorithm with electrical capacitor accelerated life test. J. Power Sources 2024, 599, 234182. [Google Scholar] [CrossRef]
- Munir, M.; Siddiqui, S.A.; Dengel, A.; Ahmed, S. DeepAnT: A Deep Learning Approach for Unsupervised Anomaly Detection in Time Series. IEEE Access 2019, 7, 1991–2005. [Google Scholar] [CrossRef]
- Soualhi, A.; Makdessi, M.; German, R.; Echeverría, F.R.; Razik, H.; Sari, A.; Venet, P.; Clerc, G. Heath monitoring of capacitors and supercapacitors using the neo-fuzzy neural approach. IEEE Trans. Ind. Inform. 2018, 14, 24–34. [Google Scholar] [CrossRef]
- Hussan, U.; Wang, H.; Peng, J.; Jiang, H.; Rasheed, H. Transformer-based renewable energy forecasting: A comprehensive review. Renew. Sustain. Energy Rev. 2026, 226, 116356. [Google Scholar] [CrossRef]
- Reigosa, P.D.; Wang, H.; Yang, Y.; Blaabjerg, F. Prediction of Bond Wire Fatigue of IGBTs in a PV Inverter Under a Long-Term Operation. IEEE Trans. Power Electron. 2015, 31, 7171–7182. [Google Scholar] [CrossRef]
- Huang, H.; Mawby, P.A. A Lifetime Estimation Technique for Voltage Source Inverters. IEEE Trans. Power Electron. 2013, 28, 4113–4119. [Google Scholar] [CrossRef]
- McPherson, J.W. Reliability Physics and Engineering: Time-To-Failure Modeling, 2nd ed.; Springer International Publishing: Cham, Switzerland, 2013; pp. 12–13. [Google Scholar]
- Si, X.S.; Wang, W.; Chen, M.Y.; Hu, C.H.; Zhou, D.H. A Degradation Path-Dependent Approach for Remaining Useful Life Estimation with an Exact and Closed-Form Solution. Eur. J. Oper. Res. 2013, 226, 53–66. [Google Scholar] [CrossRef]
- Ma, K.; Choi, U.-M.; Blaabjerg, F. Prediction and Validation of Wear-Out Reliability Metrics for Power Semiconductor Devices With Mission Profiles in Motor Drive Application. IEEE Trans. Power Electron. 2018, 33, 9843–9853. [Google Scholar] [CrossRef]
- Hitachi Metals, Ltd. HCGF5A2W5611 Datasheet, HCGF5A Series. Available online: https://www.alldatasheet.com/datasheet-pdf/pdf/155106/HITACHI-METALS/HCGF5A2W5611.html (accessed on 20 March 2024).
- Ahmad, M.W.; Agarwal, N.; Kumar, P.N.; Anand, S. Low-Frequency Impedance Monitoring and Corresponding Failure Criteria for Aluminum Electrolytic Capacitors. IEEE Trans. Ind. Electron. 2017, 64, 5657–5666. [Google Scholar] [CrossRef]
- Liu, H.; Claeys, T.; Pissoort, D.; Vandenbosch, G.A.E. Prediction of Capacitor’s Accelerated Aging Based on Advanced Measurements and Deep Neural Network Techniques. IEEE Trans. Instrum. Meas. 2020, 69, 9019–9027. [Google Scholar] [CrossRef]
- Xue, J.; Wang, L.; Wei, X.; Yang, S. Remaining Useful Life Prediction of Aluminum Electrolytic Capacitors Used in Wind Turbines. In Proceedings of the 2017 International Conference on Sustainable and Renewable Energy Engineering, Hiroshima, Japan, 10–12 May 2017; pp. 1–4. [Google Scholar]
Disclaimer/Publisher’s Note: The statements, opinions and data contained in all publications are solely those of the individual author(s) and contributor(s) and not of MDPI and/or the editor(s). MDPI and/or the editor(s) disclaim responsibility for any injury to people or property resulting from any ideas, methods, instructions or products referred to in the content. |
© 2025 by the authors. Licensee MDPI, Basel, Switzerland. This article is an open access article distributed under the terms and conditions of the Creative Commons Attribution (CC BY) license (https://creativecommons.org/licenses/by/4.0/).