Abstract
This paper presents a novel continuous-wave Doppler RADAR system for real-time speed measurement of moving objects, implemented using software-defined radio (SDR). Unlike traditional high-cost solutions typically found in research centers or specialized laboratories, this prototype offers a low-cost, compact, and easily deployable platform that lowers the entry barrier for experimentation and research. Operating within the 70 MHz–6 GHz range, SDR enables highly flexible signal processing; in this implementation, a 5.5 GHz carrier is selected to improve the detection precision by exploiting its reduced bandwidth for more accurate observation of frequency shifts. The carrier is modulated with a 2 kHz signal, and Doppler frequency deviations induced by object motion are processed to calculate velocity. Using a Welch spectral estimator, the system effectively reduces noise and extracts the Doppler frequency with high reliability. The prototype achieves speed measurements up to 196.36 km/h with approximately 2% error in the 0–100 km/h range, confirming its suitability for road traffic monitoring. A key innovation of this work is its single-antenna cross-polarized configuration, which simplifies hardware requirements while maintaining measurement accuracy. Furthermore, the system’s portability and open-access design make it ideal for in-vehicle applications, enabling direct deployment for automotive testing, driver-assistance research, and educational demonstrations. All design files and implementation details are openly shared, eliminating patent restrictions and encouraging adoption in low-resource academic and research environments.
1. Introduction
Nowadays, radio detection and ranging (RADAR) technology is widely used in diverse fields, including aircraft detection systems at airports, maritime object tracking, and highway speed enforcement, among others [1]. However, the high implementation cost of these systems often limits access to such technology. In recent years, the emergence of software-defined radio (SDR) technology has significantly simplified the development of radio frequency systems [2]. SDR dramatically reduces the system complexity, enabling deployment in environments lacking specialized infrastructure but requiring access to detection and measurement capabilities.
Motivated by these developments, this paper proposes a cost-effective RADAR prototype capable of real-time speed measurement of moving objects using the ADALM-Pluto SDR platform [3]. The prototype is based on a continuous-wave (CW) RADAR, which transmits a continuous signal while simultaneously receiving the echo reflected from moving targets. Depending on whether the object is stationary or in motion, the frequency of the echo signal remains unchanged or is shifted due to the Doppler effect [1]. The proposed CW RADAR can detect moving targets in a multi-target environment, enabling accurate speed and range estimation. Unlike traditional systems, which often require multiple antennas and complex synchronization, our design uses a single dual-polarization antenna, achieving compactness and portability while maintaining high accuracy [4,5].
The remainder of this paper is organized as follows. Section 2 reviews the related research. Section 3 describes the methodology for CW RADAR design. Section 4 presents the real-time CW Doppler implementation. Section 5 discusses the experimental results under various speed conditions. Finally, Section 6 summarizes the findings and outlines directions for future work.
2. Related Work
In radar technology, various approaches have been explored for object speed measurement and localization. We first provide an overview of the relevant prior work and then highlight the novelty of our approach. In [6], the authors employ three antennas to achieve short-range 3-D localization using CW Doppler RADAR, assuming the target path is orthogonal to the antenna’s pointing vector. Similarly, In ref. [7], the authors describes a commercial CW Doppler RADAR using two sensor modules to estimate relative object speed. In [8], a method for measuring multiple targets’ velocities based on CW Doppler RADAR is presented.
Moving beyond CW Doppler RADAR, pulsed Doppler RADAR has been used to address receiver saturation by separating transmission and reception time slots [9]. However, this comes at the expense of higher system complexity. Frequency-modulated continuous-wave (FMCW) RADAR systems, as demonstrated in [10,11,12], enable simultaneous range and speed estimation but require more sophisticated hardware and signal-processing algorithms [13,14].
In [15], a CW Doppler RADAR at 100 GHz is implemented using a low-IF dual-sideband architecture for mechanical vibration and vital-sign monitoring. In ref. [3], the authors proposed a CW Doppler RADAR based on SDR for offline speed measurement, achieving errors between 0.18 % and 6 %. Building on this work, our study introduces a real-time SDR-based RADAR system distinguished by its simplicity, consisting of a single SDR device, a dual-polarized antenna, and a standard laptop.
Receiver saturation is a well-known challenge in single-antenna CW RADAR systems [9]. Our implementation overcomes this issue by leveraging SDR technology, which facilitates precise signal conditioning, software-based filtering, and flexible debugging, thereby improving the detection performance. Furthermore, as noted in [16], the design of CW Doppler RADAR typically involves significant hardware complexity. In contrast, our approach integrates the necessary RF components into the SDR platform, allowing reconfiguration through software without additional hardware modifications.
Unlike prior studies [4,6,8,17] that require expensive and bulky instruments, our system minimizes hardware requirements and uses computationally efficient algorithms—such as the Welch spectral estimator and peak detection—to extract the Doppler frequency. Additionally, we reduce the system architecture from two antennas to one, resulting in a compact, portable, and cost-effective solution. In [18], the authors explore circularly polarized single-antenna configurations for short-range detection. In contrast, our prototype uses dual polarization and demonstrates that Doppler-induced peak power remains unaffected, achieving comparable accuracy while improving portability.
Software-defined radio (SDR) platforms have become a primary tool for rapid prototyping and experimental validation of automotive radar concepts due to their flexibility to modify waveforms, signal-processing chains, and real-time control without hardware redesign. Recent works demonstrate low-cost SDR + GNU Radio testbeds for Frequency-Modulated Continuous-Wave (FMCW) and alternative waveform families (e.g., PMCW, OFDM) enabling over-the-air hardware-in-the-loop (HWIL) experiments and waveform co-design for integrated sensing-and-communications (ISAC). These efforts show that SDR testbeds can evaluate practical issues such as timing/synchronization, waveform distortion, and real-time performance trade-offs before moving to dedicated RF hardware [19,20].
Joint radar–communication (JRC) and multi-function radar waveform research has used SDRs to implement digital baseband strategies and prototype full-stack JRC platforms. Implementations reported in 2023 demonstrate fully digital MIMO OFDM JRC platforms and real-time JRC experiments using commercially available SDRs (USRP family) and custom mmWave front-ends, illustrating SDRs’ role in validating multifunctional automotive sensing paradigms and exploring spectrum-sharing strategies [21].
Several 2024 studies emphasize real-time radar processing and classification on SDR platforms. For example, SDR implementations combined with GPU acceleration and efficient clustering/classification algorithms enable real-time radar signal classification and parameter extraction at high sampling rates—a capability relevant for in-vehicle processing and edge-AI deployment on automotive platforms. These works highlight processing-chain optimization (e.g., C++ implementations, parallel extraction of PDWs) required to meet real-time constraints on SDR testbeds [22].
The SDR research stream has also been used to study vulnerabilities, interference, and countermeasures in automotive radar. Notably, black-box physical-layer attack frameworks and experimental demonstrations have used SDR prototypes to show spoofing, false-object injection, and other threats against mmWave FMCW automotive radars—underscoring the importance of security testing on reconfigurable SDR platforms prior to field deployment. Parallel work addresses mutual interference mitigation (e.g., PMCW waveform design) and synchronization issues for netted SDR systems, which are both critical for dense automotive deployment scenarios [23,24].
Finally, the open-source ecosystem (GNU Radio, gr-plasma additions, USRP/Adalm-Pluto front-ends) has accelerated reproducible SDR radar research: multiple conference contributions (GRCon, RadarConf, EuRAD) and community modules now provide reusable blocks for FMCW/PMCW generation, real-time processing, and support for newer SDR front-ends—enabling researchers to iterate quickly on automotive radar algorithms and evaluate system-level tradeoffs such as range/velocity resolution, angular processing, and real-time latency [19,20].
3. Methodology for CW Doppler RADAR
To implement the CW Doppler RADAR design using SDR, as shown in Figure 1, we first analyze the block diagram of a conventional CW RADAR system. This analysis not only guides the replication of each functional stage but also enables us to simplify and optimize the design for SDR implementation, reducing the hardware complexity and enhancing the portability. Each stage is carefully mapped to the corresponding hardware and software elements, resulting in a compact, reconfigurable, and cost-effective prototype.
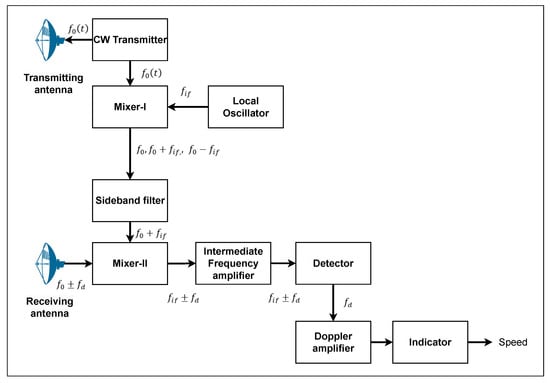
Figure 1.
Block diagram RADAR CW doppler [17].
3.1. Operating Principle RADAR CW Doppler
The Doppler RADAR system comprises multiple stages that work together to detect the relative speed of a moving object. The CW transmitter generates a stable analog signal at a fixed frequency . This signal is simultaneously routed to both the transmitting antenna and a mixer-I. A local oscillator (LO) produces a separate signal at a frequency , which is also fed into Mixer-I. Mixer-I performs frequency translation by outputting the sum and difference of the input signals, resulting in three components: , and . A sideband filter isolates the desired signal, allowing only the upper sideband frequency to pass through. This filtered signal is then used as a reference for the second mixing stage.
Mixer-II receives signals at or , where represents the Doppler frequency change caused by a moving target. The output of Mixer-II includes new frequency components at . These are passed through an IF amplifier, which selectively amplifies only the desired frequencies, enhancing the Doppler-shifted signal for further processing. The detector stage then extracts the Doppler frequency , which is directly related to the relative speed of the target. The Doppler amplifier further amplifies this signal to ensure clarity and readability. Finally, the processed signal reaches the indicator stage, which displays whether the target is approaching or receding, along with its estimated speed. In the prototype presented in this paper, the oscillator modules and the mixers are programmed within the SDR, and the acquisition or processing of the Doppler frequency is carried out using Matlab and Simulink, as shown in Figure 2.
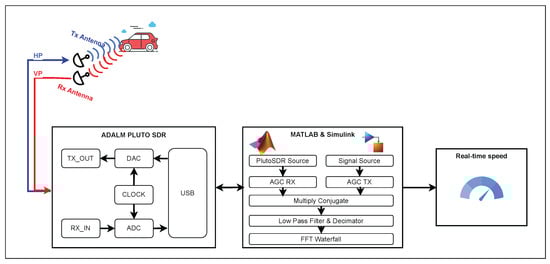
Figure 2.
Radar flow diagram with SDR.
3.2. Materials
To implement the CW Doppler RADAR, the operating frequency was set to 5.5 GHz to match the operating range of the external Altelix AD5G23M2-2PK antennas. The SDR was configured with minimum attenuation and maximum gain settings to maximize the amount of data acquired. Although the experiments were conducted at 5.5 GHz, it is recommended to operate at 5.8 GHz in future implementations, as this frequency lies within an unlicensed ISM band, thereby avoiding potential regulatory constraints and simplifying system deployment. Table 1 summarizes the parameters of the SDR and antennas used in this work.

Table 1.
SDR, antennas, and PC specifications.
The next step for implementing the CW RADAR is configuring the equipment with the parameters of carrier frequency, continuous signal type, sampling time, and bandwidth. Table 2 shows the specifications for the CW RADAR. The software platform used to process data in real-time is Matlab and Simulink.
Table 2.
Design specifications for CW Doppler RADAR.
4. Implementation of Real-Time CW Doppler RADAR
The real-time CW Doppler RADAR diagram implemented is shown in Figure 3; its blocks are described below. In the proposed prototype, the hardware is concentrated in the SDR and sends the signals to the antenna; the return signal is processed in the SDR and then processed by the Simulink computer program. An automatic gain control (AGC) adjusts the gain for the conjugate multiplication process to obtain the baseband signal, which is then filtered to avoid components more significant than 2 kHz. Spectral estimation by the Welch method allows us to improve the processed signal. Peak detection discriminates between the values of stationary and mobile objects to process these detected peaks and transform them into speed.
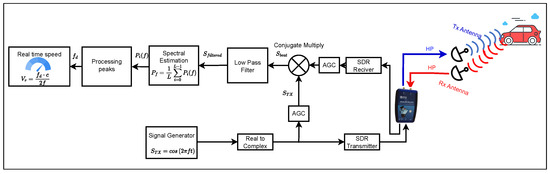
Figure 3.
SDR-based real-time CW Doppler RADAR diagram.
4.1. Signal Generator
The transmission and reception blocks of the Adalm-Pluto platform are configured in Simulink. The continuous signal used is a cosine wave at 2 kHz using the signal generator, as shown in Equation (1). By adjusting the frequency to 2 kHz, we can obtain a maximum deviation in the Doppler frequency equivalent to a range of 0 to 196.86 km/h, which is theoretically sufficient to measure vehicle speeds up to this limit. However, due to road safety considerations and current traffic regulations, it was not possible to experimentally validate speeds above 100 km/h, which is the maximum legal speed limit on public roads in our country.
4.2. Transformation to Complex Signal
A binary phase shift modulation block (BPSK) transforms the real signal into a complex signal. The complex signal is then modulated with the 5.5 GHz carrier frequency to transmit the signal . The SDR requires a complex signal as input; so, the modulation above is performed.
4.3. Sending the Signal to the Moving Object
The modulated signal is transmitted by the Altelix antenna, whose operating range is from 4.9 to 6.4 GHz. Stationary objects that the signal encounters in its path cause this wave to be reflected, and a portion of it returns to the CW Doppler RADAR [3,25,26].
4.4. Acquisition of the Signal Reflected on the Moving Object, Including the Doppler Effect
The received signal, which includes the Doppler effect due to the bounce of the wave transmitted on the mobile object, enters the SDR, and a demodulation process is performed by conjugate multiplication. Before this operation, the AGCs ensure that the transmitted and received signals are at equal amplitude levels. Equation (5) indicates two components, one at high frequency and one at low frequency, containing the Doppler frequency information plus the noise input . To obtain the value of such a Doppler frequency, it is necessary to use a low-pass filter [17,27].
appears when two waves with slightly different frequencies interfere; the resulting wave is called a beat.
4.5. Spectral Estimation of the Filtered Signal Including the Doppler Effect
To detect the component due to the Doppler effect more efficiently, it is necessary to reduce the impact of noise. Therefore, the Welch spectral estimation technique was used, which is summarized in the following steps: (i) divide the signal into overlapping segments, (ii) apply a window function to each segment to reduce spectral leakage, (iii) compute the Fourier transform of each segment, and (iv) average the squared magnitudes of the Fourier transforms to obtain the spectral estimate. This technique helps to improve the signal-to-noise ratio and enhances the detection of the Doppler frequency component. The rest of the spectral estimation process is described as follows.
- Divide the signal into L segments using a sliding window, which is overlapped by 50%, as shown in Equation (6).whereL: number of segments,i: 0, 1, …, ,M: the number of signal samples,n: 0, 1, …, ,D: sequence i start index number.
- Calculate the modified periodogram of each segment according to Equation (7).where: is the time signal from 0, 1, … to ,: sliding window,, normalization factor.
- Reduce noise variability by averaging periodograms of all L segments according to Equation (8) so that only the peak due to the Doppler effect stands out.
To observe the advantages of this method, consider a signal with added white Gaussian noise, as shown in Figure 4a. When using a simple or modified periodogram, as illustrated in Figure 4b, the spectral estimate exhibits high variability due to noise. If this were the received signal, such variability could hinder accurate Doppler peak detection. Welch’s method was therefore selected because it reduces the variance of the spectral estimate compared to the classical periodogram, which is critical for reliable Doppler peak detection under noisy conditions. In our implementation, a Hamming window of 1024 samples (NFFT segment length) with 50% overlap is applied to the signal. This configuration was chosen because it provides an optimal trade-off between spectral resolution and noise smoothing. The resulting partial spectra are computed and averaged, yielding the smoothed spectrum shown in Figure 4c, where noise-induced variability is significantly reduced, and the Doppler peak becomes easier to identify.
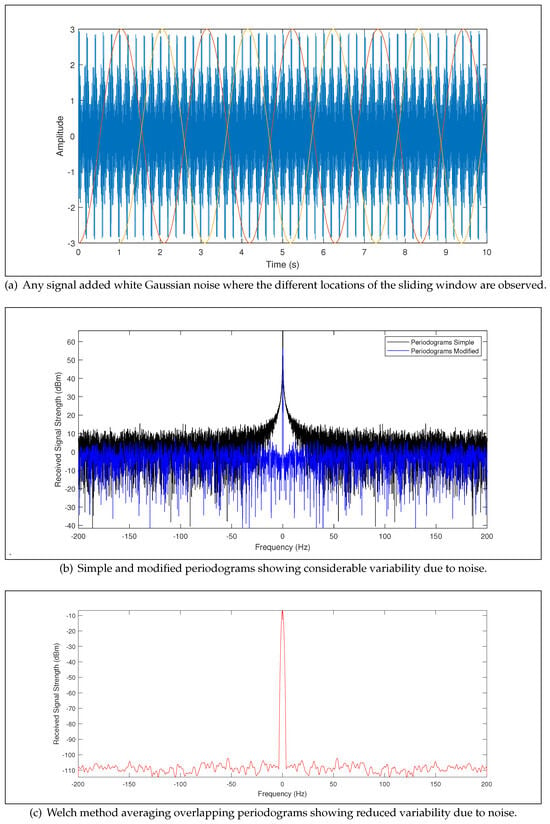
Figure 4.
Welch method.
4.6. Determination of the Threshold for Eliminating Noise Peaks
After reducing the noise effect in the previous stage, the noise level was analyzed for urban environments (between −90 and −110 dBW approximately) and rural environments (between −93 and −112 dBW approximately). As can be seen (Figure 5), there are no significant differences between these two scenarios; therefore, we proceeded to set a threshold at −85 dBW, a value established through field testing, where it was identified as the optimal threshold, whereby signals below this limit are discarded in later stages (Figure 5).

Figure 5.
Power spectral density of the received signal, estimated by the Welch method, where the peak can be observed due to the Doppler effect.
4.7. Determination of the Peak Due to the Doppler Effect
As seen in Figure 5, the maximum peak is fixed at the frequency 0 Hz, which corresponds to stationary objects that produce a reflection of the transmitted signal. The second peaks are also fixed; so, they are discarded. The third peak, which moves, is due to the reflection of the transmitted signal on the moving object (Doppler effect), and it reaches its most significant distance from the central frequency. This is the point at which it must be captured to calculate the corresponding speed of the moving object.
4.8. Determining the Speed of the Moving Object in Real Time
The speed is considered the speed of the moving object relative to the RADAR location, V is the speed in the direction of travel of the moving object, and is the angle between the direction of propagation of electromagnetic waves and the direction of the speed of the target, as shown in Figure 6.
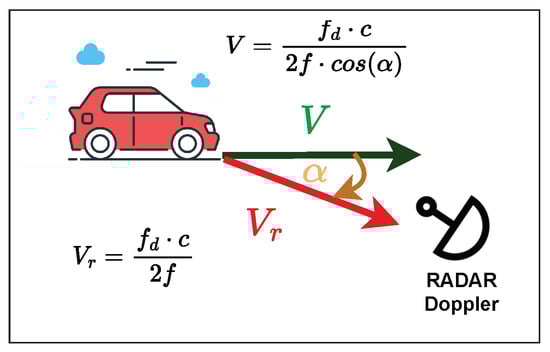
Figure 6.
Variables involved in determining speed using a CW Doppler RADAR.
Equation (9) relates the previous velocities to the Doppler frequency , where f is the carrier frequency (5.5 GHz), and c is the speed of light with a value of m/s, which is the speed concerning RADAR.
We are interested in measuring the object’s speed relative to the road, for which we include the angle between the location of the radar and the road. In this way, Equation (10) relates this data and determines the object’s speed relative to the road.
Once the implementation phase of the CW RADAR based on the Doppler effect using SDR and following the diagram in Figure 3 is completed, it can be easily transported to research sites due to its modular design, as shown in Figure 7.
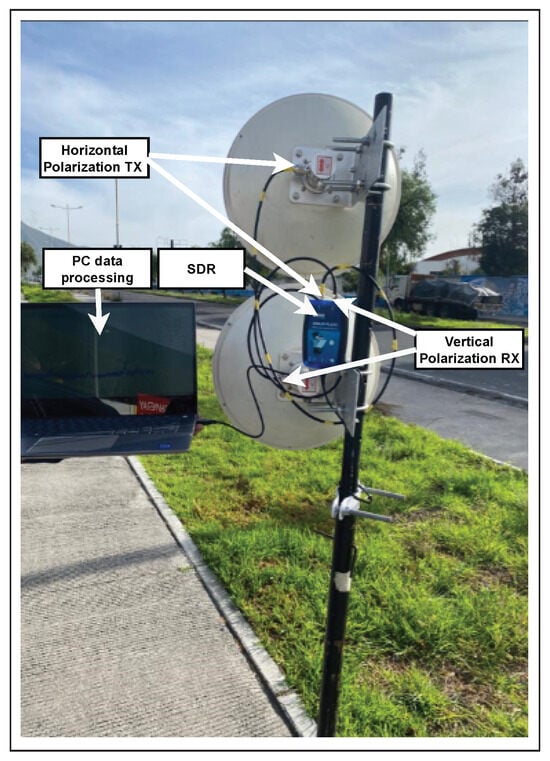
Figure 7.
CW Doppler RADAR implemented with an SDR, two antennas, and a computer for data processing.
4.9. Reduction to a Single Antenna
To reduce the complexity and optimize our system, we reduced two antennas to only one, transforming the bistatic RADAR into a monostatic one [28], as shown in Figure 8.
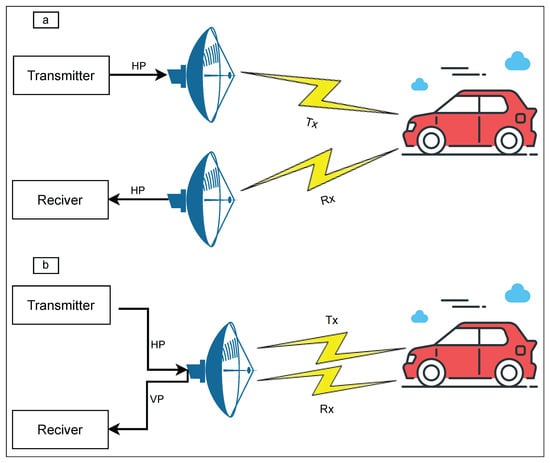
Figure 8.
(a) Bistatic and (b) monostatic RADARs.
If a single antenna is used with two connectors, one with horizontal polarization and one with vertical polarization, it should be considered that the maximum polarization information is obtained when measuring the polarization scattering matrix S (PSM) of a target. Equation (11) describes the four components of PSM [17,27]. These terms are called echo backscatter coefficients, expressed as a vector quantity having magnitude and phase. The subscripts indicate polarization: 1 for horizontal polarization (HP) and 2 for vertical polarization (VP). Subscript 11 indicates the transmission and reception HP, index 22 indicates transmission and reception VP, index 21 indicates the transmission HP and reception VP, and finally, index 12 indicates the transmission VP and reception HP.
To analyze the effect of using a single antenna with two polarizations, two antennas (one for transmission and one for reception) were initially used as a reference during the experimental phases, both with horizontal polarization, obtaining the spectrum (Figure 9a). At the time of the change in the receiver antenna connector, from horizontal to vertical polarization, it was observed that the levels of received power remained unchanged (Figure 9b). This allowed us to infer that having a single antenna with dual polarization might be enough. Then, by replacing the two antennas with a single one, where the transmitter connects to the horizontal polarization terminal and the receiver to the vertical polarization connector, it was confirmed that the power levels remained similar to the two previous cases (Figure 9c), thus reducing the complexity of the system by using a single antenna as seen in Figure 10. Therefore, thanks to SDR-based technology and a single antenna, the complexity of a Doppler RADAR system used to measure the speed of an object in real time was significantly reduced compared to previously used systems.
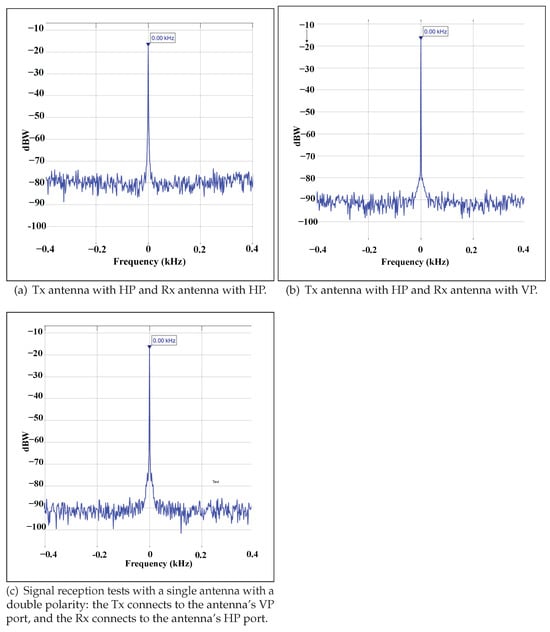
Figure 9.
Signal reception tests with two antennas in different polarities.
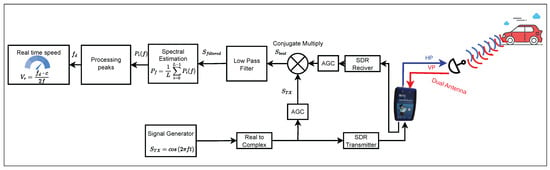
Figure 10.
Block diagram of a Doppler RADAR system for measuring the speed of an object in real time, using SDR technology and a single antenna with double polarity.
The final aspect of the CW Doppler RADAR for real-time speed measurement, implemented with a single SDR, a dual-polarization antenna, and a computer, is shown in Figure 11. The use of a dual-polarization antenna is a key requirement that enables the system to operate with a single antenna for both transmission and reception, reducing the hardware complexity and improving the portability. During experimentation, no issues were observed related to cross-polarization interference or signal degradation, confirming the feasibility of this configuration. A dual-polarized antenna provides two independent polarization channels while sharing the same feed point and physical structure, maintaining performance equivalent to two. Furthermore, the ability to measure an object’s speed in real time allows tracking its evolution over time, enabling its use in multiple applications such as traffic monitoring, in-vehicle testing, and dynamic object tracking.
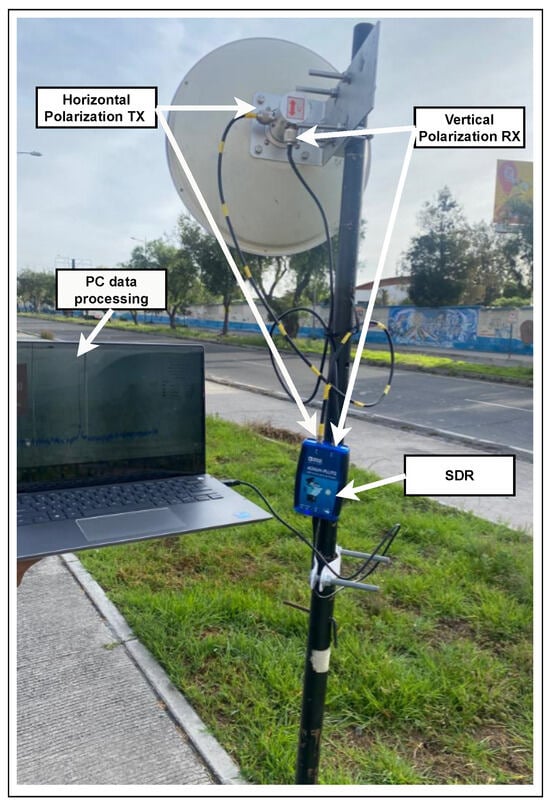
Figure 11.
CW Doppler RADAR using SDR and a single antenna in real time.
4.10. Testing and Calibration Site
The testing and calibration of the prototype were carried out on a 500 m road located in a remote area to ensure equipment safety and allow testing at specific speeds, as shown in Figure 12. The system calibration focused on adjusting the frequency-to-speed conversion process implemented in Simulink, using as reference both the vehicle’s speedometer and a commercially available roadside radar.
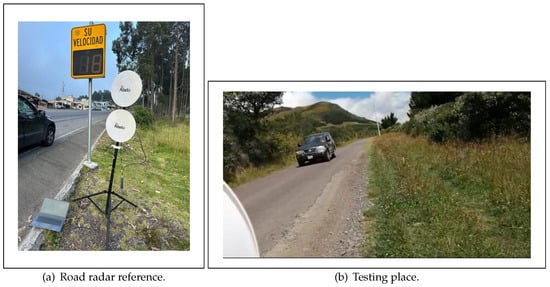
Figure 12.
Testing and calibration site.
The environmental conditions were not considered in the present work and are proposed as part of future research. During the initial tests performed to validate the prototype, no issues were observed related to signal reflections or refractions. Therefore, the system was subsequently validated under controlled test conditions, and the necessary data were collected to perform the analysis.
Unlike commercial roadside radar systems that directly display the measured speed, our prototype implements the underlying radar measurement concept but does not provide real-time speed visualization. This limitation is acknowledged in the manuscript, and future work will consider adding user-friendly visualization features to align more closely with commercial solutions.
5. Experimental and Simulation Results
The first step in acquiring results was determining the noise floor, which, as mentioned above, is at −85 dBW. Tests were performed in rural (outside the city) and urban (inside the town) environments to obtain this data.
5.1. Polarization Isolation
Tests conducted using either a single antenna or a two-antenna configuration showed no evident changes in the measured noise floor, confirming the stability of the system before data acquisition. The second step was determining the effect of using a bistatic or monostatic RADAR. In both cases, the data obtained did not present variations that should be considered significant. Therefore, an analysis was performed by configuring the CW RADAR in monostatic mode. These tests were carried out on a highway where the speeds of vehicles passing through the site were monitored. Although the experiments presented in this work were conducted under clear weather conditions, it is important to acknowledge the potential impact of environmental factors on radar performance. Rainfall, in particular, introduces attenuation of electromagnetic waves due to absorption and scattering. This effect becomes more pronounced at higher operating frequencies: moderate in the X-band (8–12 GHz) and significant in the K/Ka bands (24–77 GHz), often leading to reduced effective detection range. Since our prototype operates at 5.5 GHz, rain-induced attenuation is expected to be less critical; however, future work will explicitly validate the system under rainy conditions to ensure robustness in real-world deployment. Controlled environment tests with constant speeds were also conducted on straight paths, where speeds ranging from 0 to 100 km/h could be safely achieved. The following operating parameters were considered, as described in Table 3.
Table 3.
Parameters of the RADAR CW Doppler.
Two antennas with identical polarization typically yield maximum received power, but they demand larger physical separation, precise alignment, and higher deployment costs. In contrast, a dual-polarized antenna provides orthogonal channels (horizontal/vertical), which significantly reduce the direct coupling from Tx to Rx and act as a natural filter against self-interference.
In our experiments, the backscattered signal from the target was received with the same power level under cross polarization, demonstrating that the change in polarization does not degrade the useful signal. Furthermore, the computed noise statistics (mean, variance, standard deviation, as well as maximum and minimum values) confirm the stability of the measurement and validate the effectiveness of using cross polarization in this setup, as shown in Table 4.
Table 4.
Noise statistics in dual-polarized antenna.
5.2. Performance Analysis
The measured end-to-end latency of the prototype is below 100 ms, which is widely recognized as the threshold for real-time operation in communication and signal processing systems. This value includes both the processing time of the software-defined radio (SDR) and the computational delay introduced by the host CPU. Latencies under this level ensure that the system responds fast enough to be perceived as instantaneous and suitable for time-critical applications. Therefore, the obtained results validate that the proposed prototype operates in real time, as shown in Table 5.
Table 5.
Latency measurements.
5.3. Statistical Analysis
In the analysis of physical or engineering systems, the results depend not only on the measured or modeled variables but also on the uncertainty associated with them. The propagation of uncertainty describes how the individual uncertainties of input variables affect the uncertainty of the output.
For a function that depends on three variables, the combined uncertainty Equation (12), can be approximated using an error propagation formula, using the partial derivatives present in Equation (13):
where , , and represent the uncertainties associated with f, , and , respectively. This approach allows quantifying how variations in each input parameter propagate through the model, providing insight into the reliability and sensitivity of the results.
Incorporating uncertainty propagation enhances the rigor of the analysis and provides critical information for decision-making, experimental design, and process optimization.
At lower speeds, the absolute uncertainty decreases (e.g., ±0.30 km/h at 20 km/h). The trend is approximately linear: the uncertainty increases with the speed, since a higher amplifies the effects of . This provides a strong argument for including Table 6 as extended validation and uncertainty analysis.
Table 6.
Propagation uncertainty.
5.4. Experimental Results
About 50 experiments were performed for each speed test (20, 40, 60, 80, 100 km/h). The data obtained from these experiments are represented by the box diagram presented in Figure 13. The operational parameters and object speed values, the theoretical value of the Doppler frequency, the actual value obtained by the proposed algorithm, and the error committed were processed and are shown in Table 7.
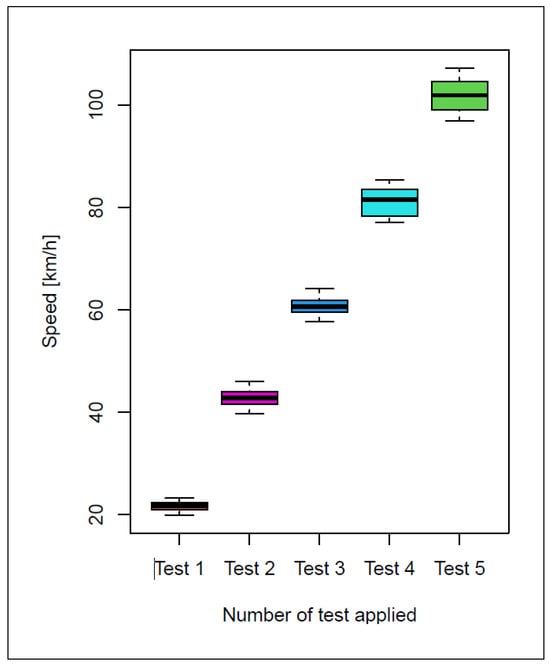
Figure 13.
Boxplot test vs. speed.
Table 7.
Real values, theoretical values, and those found with the proposed algorithm.
A Student’s t-test was performed on the 50 speed measurements for each of the three test speeds (20, 40, 60, 80, and 100 km/h) obtained with the CW Doppler RADAR prototype, using RStudio V 2025.05.1 for statistical analysis. In all three cases, the resulting p-values were below or close to 0.05, indicating statistical significance at approximately the 95% confidence level. These results validate the accuracy and repeatability of the prototype across different speed conditions, confirming that the measured values are consistent and not due to random variation, as shown in Table 8.
Table 8.
One-sample t-test.
In the following link: https://epnecuador-my.sharepoint.com/:v:/g/personal/luis_flores04_epn_edu_ec/EUlucyoZRcFFvbqM5zY2q-wB0rAm_k5J22dtjpnMwjcKcw?nav=eyJyZWZlcnJhbEluZm8iOnsicmVmZXJyYWxBcHAiOiJPbmVEcml2ZUZvckJ1c2luZXNzIiwicmVmZXJyYWxBcHBQbGF0Zm9ybSI6IldlYiIsInJlZmVycmFsTW9kZSI6InZpZXciLCJyZWZlcnJhbFZpZXciOiJNeUZpbGVzTGlua0NvcHkifX0&e=TbHRbc (accessed on 25 September 2025), we present a video that demonstrates the operation of the real-time device implemented in this research for measuring the speed of an object using CW Doppler RADAR with SDR.
5.5. Economic Analysis
In terms of the cost–benefit analysis, the implemented system demonstrates a clear advantage compared to commercial radar solutions. As summarized in Table 9, the total cost of the developed prototype is approximately USD 910, including all the components required for operation. This value contrasts strongly with commercial traffic radars, whose prices can easily exceed USD 7500 in advanced configurations [29]. The difference of more than one order of magnitude in initial investment makes the proposed system a highly accessible alternative for academic institutions, research centers, and pilot field applications. Moreover, the system is fully autonomous and does not require proprietary software licenses, which substantially reduces the operation and maintenance costs compared to many commercial radars that often depend on licenses, subscriptions, or additional support services. Consequently, the proposed solution not only provides comparable performance in speed estimation and statistical robustness but also democratizes access to this technology by enabling replication and scaling at a low cost.
Table 9.
Cost details of the radar with SDR.
6. Conclusions
This paper presents the detailed implementation of RADAR technology based on a single SDR, a single antenna with vertical and horizontal polarization connectors, and a laptop. This will enable access to RADAR technology at a low cost and with minimal infrastructure requirements. Consequently, research centers and universities with limited resources can now continue investigating various scenarios, such as the material composition of moving objects and the factors influencing their size. Moreover, the system will be open, as all necessary files and equipment are available for implementation without restrictions through patents. A software-defined radar allows full control over maintenance and configuration. All adjustment parameters can be safely managed by the user, reducing the operational costs and increasing the flexibility compared to commercial alternatives.
The Welch method was employed to mitigate the variability resulting from noise, a common issue with traditional spectral estimation methods. This method was prioritized to enhance the detection of the component attributed to the Doppler effect. The noise level remained relatively consistent throughout testing conducted in both rural and urban environments. As a result, a noise threshold was determined to filter out peaks attributed to this background noise, thereby emphasizing the component associated with the Doppler effect.
The experimental tests were carried out at speeds ranging from 20 to 100 km/h, resulting in a remarkably low relative error of 2.03%, calculated as the difference between the measured value and the expected value obtained from the theoretical formula, which served as the calibration of the equipment.
Due to its affordability and ease of implementation, the system described herein will facilitate applications that enhance road safety. While commercial radar systems are proprietary and require complex maintenance, our software-defined radar allows complete control over maintenance and configuration. Users can safely adjust all system parameters, providing operational flexibility and potential cost savings. This offers a practical advantage over commercial alternatives, even though direct quantitative performance comparisons are limited at this stage. For instance, it could detect pedestrians in scenarios with poor visibility. Unlike cameras, CW RADAR operates based on the transmission of electromagnetic waves and is not affected by low-light conditions. This system can generally be deployed at various points around a vehicle, enhancing safety and mitigating potential accidents. The risk of accidents and associated mortality rates can be significantly reduced by integrating it with audible alarms or emergency braking systems.
Author Contributions
Methodology, A.F., P.L. and R.A.; Software, A.F. and F.L.; Validation, A.F. and R.A.; Investigation, A.F., R.A., P.L., R.L. and C.T.; Resources, A.F., R.A. and P.L.; Writing—original draft, A.F., P.L., F.L., R.L. and C.T.; Supervision, P.L., F.L., R.L. and R.A. All authors have read and agreed to the published version of the manuscript.
Funding
This research received no external funding.
Data Availability Statement
In the following link: https://epnecuador-my.sharepoint.com/:v:/g/personal/luis_flores04_epn_edu_ec/EUlucyoZRcFFvbqM5zY2q-wB0rAm_k5J22dtjpnMwjcKcw?nav=eyJyZWZlcnJhbEluZm8iOnsicmVmZXJyYWxBcHAiOiJPbmVEcml2ZUZvckJ1c2luZXNzIiwicmVmZXJyYWxBcHBQbGF0Zm9ybSI6IldlYiIsInJlZmVycmFsTW9kZSI6InZpZXciLCJyZWZlcnJhbFZpZXciOiJNeUZpbGVzTGlua0NvcHkifX0&e=TbHRbc (accessed on 25 September 2025), we present a video that demonstrates the operation of the real-time device implemented in this research for measuring the speed of an object using continuous wave Doppler RADAR with SDR.
Acknowledgments
The authors acknowledge the support from Escuela Politécnica Nacional.
Conflicts of Interest
The authors declare no conflicts of interest.
Abbreviations
The following abbreviations are used in this manuscript:
| AGC | Automatic gain control |
| CW | Continuous wave |
| FMCW | Frequency-modulated continuous wave |
| HP | Horizontal polarization |
| IF | Intermediate-frequency |
| RADAR | Radio detecting and ranging |
| SDR | Software-defined by radio |
| VP | Vertical polarization |
References
- Melvin, W.; Scheer, J. Principles of Modern RADAR—RADAR Applications; Institution of Engineering and Technology: London, UK, 2012. [Google Scholar]
- Mitola, J., III. Software Radios. Survey, Critical Evaluation and Future Directions. In Proceedings of the National Telesystems Conference, Washington, DC, USA, 19–20 May 1992; pp. 13–15. [Google Scholar]
- Vargas, A.; Álvarez, R.; Lupera, P.; Grijalva, F. SDR-based Speed Measurement with Continuous-Wave Doppler RADAR. In Proceedings of the 2021 IEEE International Mediterranean Conference on Communications and Networking (MeditCom), Athens, Greece, 7–10 September 2021; pp. 401–406. [Google Scholar] [CrossRef]
- Herath, S.C.K.; Nagahawatte, C.V.D.; Pathirana, P.N. Tracking multiple mobile agents with single frequency Continuous Wave RADAR. In Proceedings of the International Conference on Intelligent Sensors. Sensor Networks and Information Processing (ISSNIP), Melbourne, VIC, Australia, 7–10 December 2009; pp. 163–167. [Google Scholar]
- Gogoi, P.K.; Mandal, M.K.; Kumar, A.; Chakravarty, T. A Compact Multi-mode Integrated Doppler radar at 2.4 GHz for Multipurpose Applications. In Proceedings of the Wireless Antenna and Microwave Symposium (WAMS), Rourkela, India, 5–8 June 2022; pp. 1–4. [Google Scholar] [CrossRef]
- Villien, C.; Fleck, V.; Ostertag, E.; Raymond, P. 3-D short-range localization device by low-cost CW-Doppler RADAR. In Proceedings of the International RADAR Conference, Arlington, VA, USA, 9–12 May 2005; pp. 557–561. [Google Scholar]
- Reznicek, M.; Bezousek, P. Commercial CW Doppler RADAR design and application. In Proceedings of the 27th International Conference Radioelektronika (RADIOELEKTRONIKA), Brno, Czech Republic, 19–20 April 2017; pp. 1–5. [Google Scholar]
- Ishii, T.K. Analysis of Target-Speed Determination with Doppler RADAR. In Proceedings of the IEEE Transactions on Instrumentation and Measurement, New York, NY, USA, 31 May 1970; Volume 19, pp. 86–91. [Google Scholar] [CrossRef]
- Goetz, L.P.; Albright, J.D. Airborne Pulse-Doppler RADAR. In Proceedings of the IRE Transactions on Military Electronics, New York, NY, USA, April 1961; Volume MIL-5, pp. 116–126. [Google Scholar] [CrossRef]
- Rohling, H.; Meinecke, M. Waveform design principles for automotive RADAR systems. In Proceedings of the CIE International Conference on RADAR Proceedings (Cat No.01TH8559), Beijing, China, 15–18 October 2001; pp. 1–4. [Google Scholar] [CrossRef]
- Sun, Y.; Fei, T.; Schliep, F.; Pohl, N. Gesture Classification with Handcrafted Micro-Doppler Features using a FMCW Radar. In Proceedings of the IEEE MTT-S International Conference on Microwaves for Intelligent Mobility (ICMIM), Munich, Germany, 16–18 April 2018; IEEE: Piscataway, NJ, USA, 2018; pp. 1–4. [Google Scholar] [CrossRef]
- Chae, R.; Wang, A.; Li, C. FMCW Radar Driver Head Motion Monitoring Based on Doppler Spectrogram and Range-Doppler Evolution. In Proceedings of the Topical Conference on Wireless Sensors and Sensor Networks (WiSNet), Orlando, FL, USA, 20–23 January 2019; IEEE: Piscataway, NJ, USA, 2019; pp. 1–4. [Google Scholar] [CrossRef]
- Barlow, E.J. Doppler RADAR. In Proceedings of the IRE, New York, NY, USA, 5 April 1949; Volume 37, pp. 340–355. [Google Scholar]
- Nallabolu, P.; Li, C. Investigating a Portable Low-Cost Target Simulator for Doppler Radars. In Proceedings of the USNC-URSI Radio Science Meeting (Joint with AP-S Symposium), Denver, CO, USA, 10–15 July 2022; pp. 72–73. [Google Scholar] [CrossRef]
- Ma, X.; Wang, Y.; Lu, L.; Zhang, X.; Chen, Q.; You, X. Design of a 100-GHz Double-Sideband Low-IF CW Doppler Radar Transceiver for Micrometer Mechanical Vibration and Vital Sign Detection. IEEE Trans. Microw. Theory Tech. 2020, 68, 2876–2890. [Google Scholar] [CrossRef]
- Placentino, F.; Alimenti, F.; Battistini, A.; Bernardini, W.; Mezzanotte, P.; Palazzari, V. Measurements of length and velocity of vehicles with a low-cost sensor RADAR Doppler operating at 24 GHz. In Proceedings of the 2nd International Workshop on Advances in Sensors and Interface, Bari, Italy, 26–27 June 2007; pp. 1–5. [Google Scholar]
- Skolnik Merrill, I. Introduction to RADAR Systems, 2nd ed.; McGraw Hill: New York, NY, USA, 1980. [Google Scholar]
- Lu, J.; Shao, Z.; Li, C.; Gu, C.; Mao, J. A Portable 5.8 GHz Dual Circularly Polarized Interferometric Radar Sensor for Short-Range Motion Sensing. In Proceedings of the IEEE Transactions on Antennas and Propagation, Piscataway, NJ, USA, 19 January 2022; Volume 70, pp. 5849–5859. [Google Scholar] [CrossRef]
- Doly, S.A.; Chiriyath, A.; Standage-Beier, W.; Bliss, D. GNU Radio realization of Waveform Co-design for Joint Radar-Communications system using SDRs. In Proceedings of the GRCon 2023, Tempe, AZ, USA, 13 September 2023. [Google Scholar]
- Doly, S.A. Real-Time FMCW Radar System for Waveform Optimization using SDRs. In Proceedings of the GRCon/GNU Radio Conference Contribution (Paper/PDF), Knoxville, TN, USA, 17 September 2024. [Google Scholar]
- Ozkaptan, C.D.; Zhu, H.; Ekici, E.; Altintas, O. Software-Defined MIMO OFDM Joint Radar-Communication Platform with Fully Digital mmWave Architecture. arXiv 2023, arXiv:2302.05812. [Google Scholar]
- Oncu, S. Real-Time Radar Classification Based on Software-Defined Radio Platforms. Sensors 2024, 24, 7776. [Google Scholar] [CrossRef] [PubMed]
- Hunt, D.; Angell, K.; Qi, Z.; Chen, T. MadRadar: A Black-Box Physical Layer Attack Framework on mmWave Automotive FMCW Radars. arXiv 2023, arXiv:2311.16024. [Google Scholar]
- Esmaeilbeig, Z.; Bose, A.; Soltanalian, M. Mutual Interference Mitigation in PMCW Automotive Radar. arXiv 2023, arXiv:2306.10188. [Google Scholar] [CrossRef]
- S, S.; C, A.; Zacharia, T.; Gandhiraj, R. Real time implementation of FMCW RADAR for target detection using GNU radio and USRP. In Proceedings of the International Conference on Communications and Signal Processing (ICCSP), Melmaruvathur, India, 2–4 April 2015; pp. 1530–1534. [Google Scholar]
- Richards, M.; Scheer, J.; Holm, W. Principles of Modern RADAR—Basic Principles; Institution of Engineering and Technology: London, UK, 2010. [Google Scholar]
- Gianluca, G.; Colonna, V.E.; Noviello, C.; Perna, S.; Soldovieri, F.; Catapano, I. Doppler RADAR as Occupancy Sensor: A Comparison of Different Detection Strategies. Signal Process. 2022, 2, 847980. [Google Scholar] [CrossRef]
- Melvin, W.; Scheer, J. Principles of Modern RADAR—Advanced Techniques; Institution of Engineering and Technology: London, UK, 2012. [Google Scholar]
- Radar, S. Stalker II SDR Radar System. Typical Listed Price up to 7500 USD Depending on Configuration. 2023. Available online: https://www.stalkerradar.com (accessed on 25 September 2025).


Disclaimer/Publisher’s Note: The statements, opinions and data contained in all publications are solely those of the individual author(s) and contributor(s) and not of MDPI and/or the editor(s). MDPI and/or the editor(s) disclaim responsibility for any injury to people or property resulting from any ideas, methods, instructions or products referred to in the content. |
© 2025 by the authors. Licensee MDPI, Basel, Switzerland. This article is an open access article distributed under the terms and conditions of the Creative Commons Attribution (CC BY) license (https://creativecommons.org/licenses/by/4.0/).