Abstract
Diabetes is a significant global health issue that demands accurate, accessible, and non-invasive diagnostic methods for effective prevention and treatment. Conventional diagnostic systems are often expensive, painful, time-consuming, and not universally available. In this study, we present a smart system for acetone estimation using simulated breath and a recurrent neural network (RNN) model. The detection system employs a new sensor fabricated from a composite of 1D nanostructured KWO (K2W7O22) and 2D nanosheet MXene (Ti3C2), designed to measure the chemiresistive response to acetone by mimicking human breath. Resistance data collected by the sensor are used to compute sensitivity values for each acetone concentration (in parts per million, PPM). These values serve as input features for the RNN model, which learns to evaluate health as healthy, high-risk, or diabetic. Trained on acetone concentrations ranging from 0.4 to 2 PPM, the RNN achieves an R2 of 99.41% in predicting potential for accurate breath acetone prediction. In future work, we aim to develop a smart device and mobile application based on this model to facilitate real-time diabetes monitoring and prediction.
Keywords:
diabetes; MXene/KWO nanocomposites; breath sensor; PPM; sensitivity; neural network; nanomaterials 1. Introduction
Diabetes is a growing global health crisis, currently affecting millions and increasing in prevalence each year. According to the International Diabetes Federation, as of 2021, approximately 537 million people, about 10.5% of the global population are living with diabetes, with projections reaching 783 million by 2045 [1]. The economic burden is also significant: global healthcare expenditures related to diabetes have risen sharply from $232 billion in 2007 to $760 billion in 2019, with costs expected to climb to $845 billion by 2045 [2]. Beyond its direct impact, diabetes can lead to serious complications such as kidney failure, blindness, and cardiovascular disease if not properly managed [3]. Traditional diagnostic methods rely on blood glucose testing, which is invasive, uncomfortable, and carries a risk of infection. In response to these limitations, recent research has identified volatile organic compounds (VOCs) in exhaled breath as potential non-invasive biomarkers for diabetes detection [4,5]. Among these, acetone has emerged as a particularly reliable indicator, with elevated breath acetone levels strongly correlating with high blood glucose concentrations [6]. Breath-based acetone analysis thus offers a promising, non-invasive, cost-effective, and user-friendly alternative to conventional blood glucose testing [1,2,3,4,5,6].
In this study, we propose an acetone estimation model system based on a breath acetone sensor fabricated from a nanocomposite of KWO and MXene, materials selected for their excellent chemiresistive sensitivity. KWO is a one-dimensional (1D) nanostructured functional semiconductor synthesized via a hydrothermal method, capable of sensitively detecting breath acetone at room temperature [7]. To enhance performance, KWO is mixed with MXene (Ti3C2), a two-dimensional (2D) material known for its high conductivity and stability to form nanocomposite structures. This 1D/2D KWO/Ti3C2 nanocomposite significantly improves acetone detection, achieving sensitivity down to 0.4 parts per million (PPM) at room temperature. Compared to pure 1D KWO nanowires, the nanocomposite exhibits nearly nine times greater sensitivity and shows excellent humidity tolerance [8]. Additionally, the KWO/Ti3C2-based sensor demonstrates strong selectivity when exposed to other common vapors found in human breath. Complementary to this, MXene-based aptasensors have shown high precision in detecting biomarkers such as insulin and vaspin in human serum, supporting the diagnosis of specific diabetes types and enabling more targeted treatment strategies [7,8,9].
Artificial intelligence (AI) and machine learning (ML) are increasingly being applied in healthcare, particularly for disease prediction and detection. These technologies enable the development of models capable of processing large, complex datasets and making accurate diagnostic predictions. In the context of diabetes, ML techniques have been widely used to build classification models that predict disease risk based on clinical and demographic variables such as age, body mass index (BMI), HbA1c levels, family history, education, and hypoglycemia, among others [10,11]. Score-based prediction models have also gained traction due to their interpretability and effectiveness [12]. Among ML approaches, deep learning, an advanced subset of machine learning, has significantly enhanced the accuracy of medical diagnostic systems. Various deep learning architectures, including recurrent neural networks (RNNs), feedforward neural networks (FFNNs), convolutional neural networks (CNNs), and hybrid models, have been successfully applied to diabetes prediction [13]. For instance, artificial neural networks have achieved prediction accuracies exceeding 93% [14], while a convolutional long short-term memory (Conv-LSTM) model reached 97.26% accuracy using the Pima Indians Diabetes Database (PIDD) [15]. More recently, a deep learning-based system demonstrated an accuracy of 98.35% in diabetes detection [16], and convolutional recurrent neural networks (CRNNs) have shown strong performance in predicting glucose levels, outperforming traditional methods in both simulated and clinical scenarios [17].
In this study, we developed an RNN model to analyze resistance values obtained from our simulated breath acetone sensor and classify them into three categories: healthy, high risk, or diabetic. The model achieved a high regression performance with an R2 of 99.41%, demonstrating its effectiveness in estimating breath acetone levels corresponding to health conditions such as good health, high risk, and diabetic range. These results highlight the potential of our system for future integration into non-invasive, portable breath monitoring devices targeting diabetes-related biomarker detection [10,11,12,13,14,15,16,17].
2. Methodology
In this study, we utilized a novel breath sensor to detect volatile organic compounds (VOCs) in human breath, focusing on acetone as a key biomarker for diabetes. VOCs are exhaled through the breath, and among them, acetone has been strongly correlated with blood glucose levels, making it a reliable non-invasive indicator of diabetes. Acetone concentrations in breath rise significantly when glucose metabolism is impaired, allowing for early detection of diabetic conditions. To simulate human breath and deliver controlled concentrations of acetone, we employed the OVG-4 vapor generator and OHG humidity generator from Owlstone Medical. These systems enable the generation of acetone vapor at concentrations ranging from parts per billion (PPB) to parts per million (PPM), while maintaining adjustable relative humidity levels between 15% and 85%.
2.1. Breath Sensor Processing
The breath sensor device used different sensing composites made of K2W7O22 and Ti3C2 nanocomposites with different molecular ratios and configurations (thickness), to compare their sensing performance sensitivity and response to acetone. In this study, one-dimensional nanostructured (1D) potassium tungstate, KWO, was synthesized via the hydrothermal method and served as the key sensing material to detect acetone [18]. The material structure and properties can be modulated via the synthesis procedure, such as using the hydrothermal temperature of 225 °C with HCl and Na2WO4 for 24 h to achieve high-quality sensing response to acetone. Two-dimensional nanosheet, MXene (Ti3C2), was synthesized using the hot-etching method via the reaction of LiF and hydrochloric acid HCl to selectively remove the ‘A’ layer in MAX and produce multi-layered MXene [19]. After obtaining pure MXene, the nanocomposite was prepared by mixing KWO at a specific molecular ratio, to optimize the sensing response for acetone detection.
In this study, the two materials were mixed in a weight ratio of 5:1 (KWO:MXene), and ethanol was added to form a homogeneous paste for uniform coating. This paste was applied to gold interdigitated electrode (IDE) glass substrates that were pre-cleaned with deionized water and 200-proof ethanol. A mask was used to define different film thicknesses of approximately 0.05 mm, 0.10 mm, and 0.20 mm. The dried material was ground using a mortar and pestle, before being suspended in 200-proof ethanol. The suspension was deposited onto the glass substrate via mechanical pipette, then blade-coated to the thickness of the mask. Samples were allowed to dry before the mask was removed.
Subsequently, six sensor samples were made with varying film thicknesses and compositions to evaluate their sensing performance. These included: (1) 0.20 mm thickness with a 5:1 KWO:MXene ratio, (2) 0.05 mm thickness with a 5:1 ratio, (3) 0.10 mm thickness with a 5:1 ratio, (4) another 0.10 mm thickness with a 5:1 ratio, (5) 0.10 mm thickness with a 4:1 ratio, and (6) 0.10 mm thickness with a 5:1 ratio. These variations were made to investigate the effects of thickness and material composition on sensor performance.
2.2. Data Collection
Data collection processes were conducted using a vapor generator, a breath analyzer (acetone sensor device), and a real-time data monitoring and storage system. The acetone vapor and relative humidity (RH) can be produced and controlled through an OVG-4 vapor generator and OHG-4 humidity generator, (Owlstone Inc., Westport, CT, USA), as shown in Figure 1.
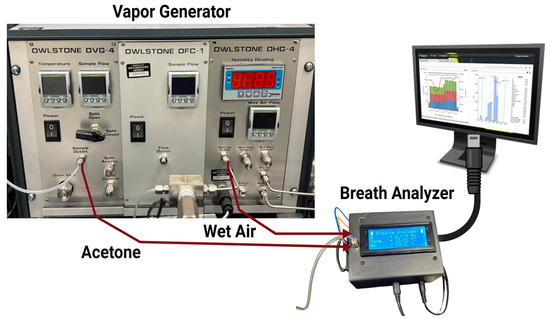
Figure 1.
Experimental Equipment.
The experimental setup worked to measure acetone concentration in terms of parts per million (PPM) [20]. In this setup, the vapor generator included an acetone pipe with a button to switch the acetone ON and OFF during the test. Throughout the test, acetone was carried by air with a relative humidity (RH) of ~32% [18].
All data were collected using the six novel sensors across acetone concentrations ranging from 0.4 PPM to 2 PPM. For each PPM level, approximately 480 data points were collected for each PPM, giving 8200 data points per sensor detector. The system for mixing the generated acetone vapor with air, a breath analyzer to detect the concentration, and the real-time monitoring system were used to collect data. This data was simulated data and did not involve real human breath samples. To simulate breath conditions relevant for diabetes detection, we used OVG-4, which is a vapor generator that systematically produces precise concentrations of gases. One acetone permeation tube was inserted into the OVG-4, which also generated acetone concentration. A manual external switch was used to control and identify acetone levels within the gas flow. Acetone levels in human breath increase more than 1.7 ppm in diabetic patients due to impaired glucose metabolism, making it a reliable indicator for diabetes. Therefore, controlled acetone concentrations ranging from 0.4 PPM to 2 PPM were generated using the OVG system to create a representative dataset suitable for training and validating our diabetes detection model. Below, Table 1 shows the relationship between the exhaust flow rates from the vapor generator and the corresponding PPM of acetone.

Table 1.
PPM range based on OVG-4 flow range.
The resistance values were recorded for different acetone concentrations controlled by OVG-4 exhaust flow rates (Table 1). During the entire test, the OVG-4 temperature was at 30 °C. The sensor resistance values changed depending on whether acetone was ON or OFF, with higher resistance when acetone was introduced and lower resistance when only air was present.
2.3. Data Processing
Once data was collected, the sensitivity was computed for each PPM concentration using the following formula.
Rmax denotes the maximum resistance when a given PPM concentration of acetone is introduced, and R0 means the initial resistance with air only. For the percentage sensitivity calculation, this gives the equation below.
This metric quantifies the sensor detector’s performance in response to acetone levels. Based on this metric, the quality of the detector can be evaluated [21]. A good sensor detector exhibits high sensitivity to acetone, providing the highest sensitivity values, whereas a poor sensor detector shows a weaker response to acetone, resulting in low sensitivity values. Finally, the processed dataset was divided into training and testing subsets for recurrent neural network model development.
2.4. Proposed Algorithm
The above flowchart in Figure 2 shows how the system works from data collection through breath analysis to predicting diabetes conditions and making a final classification.
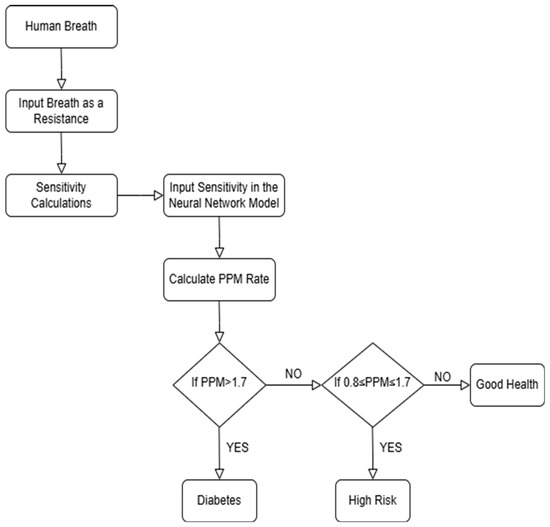
Figure 2.
Flow chart of the Diabetes Detection algorithm.
Our process started with capturing simulated human breath, which was evaluated for acetone concentration based on sensor resistance values. Diabetic patients typically have more acetone in their breath, while non-diabetic individuals have much less acetone. Based on these resistance measurements, the system calculated the sensitivity and determined the PPM (parts per million) of acetone from this data. Then, our model followed a sequence to classify patients: if the PPM is above 1.7, the patient was classified as diabetic; if the PPM is between 0.8 and 1.7, the patient was considered at high risk; and if the PPM is below 0.8, the patient was classified as in good health [21,22,23].
2.5. Neural Network Architecture Model
Recent advancements in deep learning have significantly increased the accuracy of disease prediction and detection systems, including those targeting diabetes. In diabetes detection by breath analysis, the main focus is on achieving the highest selectivity and sensitivity for acetone as a biomarker [24]. In this study, a three-layer recurrent neural network (RNN) model was developed, as detailed below. In the first input layer, the input features include sensitivity and PPM values. Initially, the model took sensitivity values as input, which were then converted into PPM acetone, ranging from low sensitivity to high sensitivity. As the second layer of the model, the hidden layer consisted of 32 neurons and used the ReLU activation function. Finally, the output layer of the model adopts a Softmax activation function and classified individuals into one of three health categories based on the calculated PPM acetone: Good Health, High Risk, or Diabetic.
The dataset was split into 80% for training and 20% for testing. The developed model was trained using the Adam optimizer with a 0.001 learning rate for 20,000 epochs. The number of epochs is a hyperparameter that defines the number of times that the learning algorithm will process the entire training dataset [25]. Residual plot was used for the model predictions and R2 score was used to measure performance. Finally, the model achieved a strong regression performance with an R2 value of 0.9941, demonstrating its effectiveness in accurately estimating health conditions based on breath acetone analysis under simulated conditions.
3. Results and Discussion
The performance of the proposed breath analysis system and algorithm for acetone-based diabetes screening was evaluated using different factors, including accuracy, loss values, and R2 scores. The results focused on identifying health conditions level (Good health, High Risk, and Diabetic) based on acetone levels in simulated human breath.
Figure 3 illustrates the sensitivity responses of various breath sensors made from KWO and MXene materials, tested at an average relative humidity of approximately 32% across acetone concentrations ranging from 0.4 PPM to 2 PPM. Six different sensor detectors were tested, emphasizing sensors composed of a KWO 5:1 MXene ratio due to their high sensitivity values. Sensors of different thicknesses, as well as sensors with identical thickness (0.10 mm) fabricated at different times, were compared.
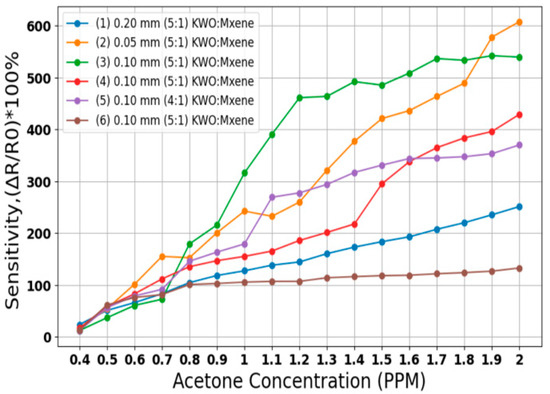
Figure 3.
Sensitivity reading using different breath sensor (RH) of ~32%.
Sensitivity percentage was calculated to evaluate the performance of each sensor configuration. Since breath sensor slides are critical to the proposed system, initial tests were conducted to determine the optimal sensor for use with the algorithm. As shown in Figure 3, the 0.05 mm thickness sensor with a KWO 5:1 MXene ratio demonstrates high and linear sensitivity in response to increasing acetone concentrations. Thinner sensors exhibit higher sensitivity than thicker ones, as illustrated by comparing the 0.05 mm sensor with the comparatively less sensitive 0.20 mm (KWO 5:1 MXene) and 0.10 mm (KWO 4:1 MXene) sensors. As a result of these tests, the best sensor slide for high, linear sensitivity response is the 0.05 mm KWO 5 and MXene 1 sensor detector.
Additionally, sensors labeled as sample (3), (4), and (6) share the same ratio (KWO 5:1 MXene) and thickness (0.10 mm) but were manufactured at different times. Sample (6) was a 2-week-old sensor, while sample (4) was comparatively 1 week old and showed improved sensitivity. Sample (3), being the newest at the time of testing, demonstrated the highest sensitivity among these three. However, we analyzed data from all sensors using the proposed algorithm, and each sensor demonstrated good overall results, confirming the robustness and effectiveness of our model.
3.1. Training and Testing Results Using Neural Network Model
Although the model was trained for 20,000 epochs, both the training and testing losses converged and stabilized after approximately 600 epochs. Therefore, Figure 4 and Figure 5 present the loss behavior up to 800 epochs as a representative validation check. In Figure 4, the training loss began at the maximum and rapidly decreased after a few epochs, stabilizing near 0 after approximately 100 epochs. Finally, a training loss of 0.0012 was achieved, which indicates excellent performance on the training data [26]. Similarly, Figure 5 illustrates that the test loss also dropped significantly for the training process, and it stabilized at 0.00589, indicating that the model can generalize well to test data. So, both training losses and test losses show that the model effectively fits the data without overfitting, accurately predicting diabetes threshold status from simulated breath analysis data.
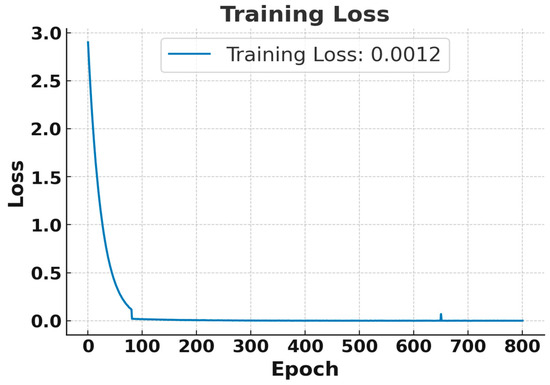
Figure 4.
Training loss curve for the RNN using breath sensor data. Results shown for the first 800 epochs out of 20,000 epochs.
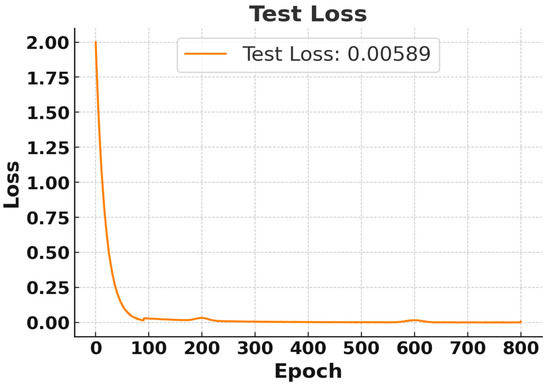
Figure 5.
Test Loss Curve for RNN Using Breath Sensor. Results displayed for the first 800 epochs out of 20,000 epochs.
Table 2 summarizes the training and testing losses for each of the six different sensors. Each sensor was fabricated from various ratios and thicknesses of KWO and MXene composites. Data were collected from acetone concentrations ranging from 0.4 PPM to 2 PPM, resulting in approximately 8200 data points per breath sensor. It can be observed that all sensors achieved low training and testing loss values, indicating effective learning and consistently good performance.
Table 2.
Loss Calculations for Each Sensor Detector.
3.2. Model Performance
Figure 6 and Figure 7 show the R2 and residual plot of predicted acetone concentration performance of the neural network model during the training and testing phase. R2 training value stabilizes at approximately 99.26%, whereas R2 testing value stabilizes at 99.41%, indicating the model’s strong predictive capabilities and excellent generalization to test data. During the test, epochs are divided by 500, such as 15 epochs means 7500. The R2 figure highlights that after 2500 epochs, the model’s stability and effectiveness in learning have converged. Additionally, it shows that the testing R2 is a slightly higher than the train R2 due to the limited testing data.
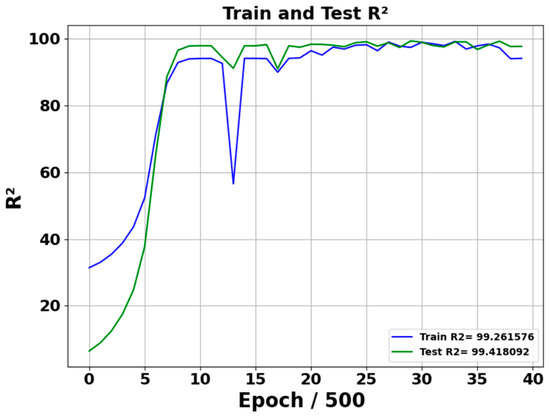
Figure 6.
R2 Performance of model training and testing. Training and testing across 20,000 epochs; plotted at intervals of 500 epochs.
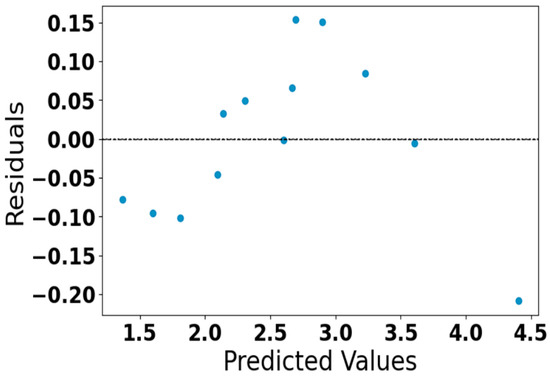
Figure 7.
Residual plot of predicted acetone concentration.
Figure 7 represents the residual plot of the predicted acetone concentration generated by our neural network model. The residuals are randomly scattered around zero without distinct patterns, which means the model predicts perform well without systematic bias. All residuals fall within a small range (approximately ±0.15), indicating a high level of prediction accuracy and confirming the reliability of the developed model.
Overall, the R2 values and residual plot indicate a well-trained model capable of classifying threshold health conditions, such as- Good Health, High Risk and Diabetes, based on the simulated breath acetone concentration level.
One of the drawbacks of this study is that it uses the generated breath containing acetone only. The real breath of humans contains multiple VOCs and can vary individually. We tested the sensor in lower humidity conditions, while humidity can be variable in real breath samples, creating challenges for accurate measurements. In our future studies, we plan to address these issues and keep working on modifying the nanomaterial sensor for more robust operation. No patient data or clinical validation were included; thus, our results should be interpreted strictly as bench-top screening/estimation under simulated conditions, not as evidence of diagnostic performance or clinical utility. Future work will incorporate breath-like RH (40–90%), temperature (25–37 °C), structured interferent panels and mixtures, and prospective testing with human participants to establish robustness and clinical relevance.
4. Conclusions
In this study, we introduced a novel, non-invasive system for diabetes screening using a breath sensor device and a recurrent neural network (RNN) model. By utilizing a nanocomposite sensor composed of KWO (K2W7O22) and MXene (Ti3C2) based materials, we effectively measured acetone levels in simulated breath conditions. The RNN model achieved high regression accuracy, with a training R2 of 99.26% and a testing R2 of 99.42%, demonstrating strong generalization in predicting acetone concentration from simulated breath sensor data. This approach highlights the potential for developing low-cost, non-invasive, and portable breath analysis systems.
In the future, we plan to develop a prototype device capable of collecting real human breath samples and applying our model to predict and detect diabetes. In addition, we will design a smart, automated system that is user-friendly, portable, and long-lasting, enabling individuals to conveniently monitor their diabetes status anywhere, similar to using a smartphone.
Author Contributions
Conceptualization: D.W. and M.F.A.M.; Data curation, formal analysis, in-vestigation, methodology: M.F.A.M., M.H.F. and L.Y.; Funding acquisition, project administration: D.W. and N.G.; Resources, software: M.F.A.M., M.H.F. and L.Y.; Validation, visualization: D.W., M.F.A.M. and N.G.; Writing—original draft: M.F.A.M. and D.W.; Writing—review and editing: N.G., L.Y. and M.H.F.; Supervision: D.W. and N.G. All authors have read and agreed to the published version of the manuscript.
Funding
This work was supported by the Department of Electrical and Computer Engineering at North Dakota State University, Fargo, USA, through an NSF project under Grants OIA-2218046, OIA-1946202, 2226202.
Institutional Review Board Statement
Not applicable.
Data Availability Statement
The raw datasets used and/or analyzed during the current study are available from the corresponding author on reasonable request.
Conflicts of Interest
The authors declare no conflict of interest.
References
- Hossain, M.J.; Al-Mamun, M.; Islam, M.R. Diabetes mellitus, the fastest growing global public health concern: Early detection should be focused. Health Sci. Rep. 2024, 7, e2004. [Google Scholar] [CrossRef]
- Gupta, H.; Varshney, H.; Sharma, T.K.; Pachauri, N.; Verma, O.P. Comparative performance analysis of quantum machine learning with deep learning for diabetes prediction. Complex Intell. Syst. 2022, 8, 3073–3087. [Google Scholar] [CrossRef]
- Narayan, K.M.V.; Gregg, E.W.; Fagot-Campagna, A.; Engelgau, M.M.; Vinicor, F. Diabetes—A common, growing, serious, costly, and potentially preventable public health problem. Diabetes Res. Clin. Pract. 2000, 50 (Suppl. 2), S77–S84. [Google Scholar] [CrossRef]
- Moura, P.C.; Raposo, M.; Vassilenko, V. Breath volatile organic compounds (VOCs) as biomarkers for the diagnosis of pathological conditions: A review. Biomed. J. 2023, 46, 100623. [Google Scholar] [CrossRef]
- Lekha, S.; Suchetha, M. Recent Advancements and Future Prospects on E-Nose Sensors Technology and Machine Learning Approaches for Non-Invasive Diabetes Diagnosis: A Review. IEEE Rev. Biomed. Eng. 2021, 14, 127–138. [Google Scholar] [CrossRef] [PubMed]
- Velusamy, P.; Su, C.H.; Ramasamy, P.; Arun, V.; Rajnish, N.; Raman, P.; Baskaralingam, V.; Senthil Kumar, S.M.; Gopinath, S.C. Volatile Organic Compounds as Potential Biomarkers for Noninvasive Disease Detection by Nanosensors: A Comprehensive Review. Crit. Rev. Anal. Chem. 2023, 53, 1828–1839. [Google Scholar] [CrossRef] [PubMed]
- Wang, D. Investigation of Different Materials as Acetone Sensors for Application in Type-1 Diabetes Diagnosis. Biomed. J. Sci. Tech. Res. 2019, 14, 10940–10945. [Google Scholar] [CrossRef]
- Rudie, A.; Schornack, A.M.; Wu, Q.; Zhang, Q.; Wang, D. Two-Dimensional Ti3C2 MXene-Based Novel Nanocomposites for Breath Sensors for Early Detection of Diabetes Mellitus. Biosensors 2022, 12, 332. [Google Scholar] [CrossRef]
- Cui, H.; Yang, L.; Fu, X.; Li, G.; Xing, S.; Wang, X.F. Ti3C2 MXene-based aptasensor for sensitive and simultaneous detection of two diabetes biomarkers. Surf. Interfaces 2023, 41, 103196. [Google Scholar] [CrossRef]
- Mujumdar, A.; Vaidehi, V. Diabetes Prediction using Machine Learning Algorithms. Procedia Comput. Sci. 2019, 165, 292–299. [Google Scholar] [CrossRef]
- Asaduzzaman, S.; Al Masud, F.; Bhuiyan, T.; Ahmed, K.; Paul, B.K.; Rahman, S.A.M.M. Dataset on significant risk factors for Type 1 Diabetes: A Bangladeshi perspective. Data Brief 2018, 21, 700–708. [Google Scholar] [CrossRef]
- Al Masud, F.; Hosen, M.S.; Ahmed, A.; Ibn Bashar, M.; Muyeed, A.; Jahan, S.; Paul, B.K.; Ahmed, K. Development of score based smart risk prediction tool for detection of type-1 diabetes: A bioinformatics and machine learning approach. Biointerface Res. Appl. Chem. 2021, 11, 9007–9016. [Google Scholar] [CrossRef]
- Shokrekhodaei, M.; Cistola, D.P.; Roberts, R.C.; Quinones, S. Non-Invasive Glucose Monitoring Using Optical Sensor and Machine Learning Techniques for Diabetes Applications. IEEE Access 2021, 9, 73029–73045. [Google Scholar] [CrossRef] [PubMed]
- Bukhari, M.M.; Alkhamees, B.F.; Hussain, S.; Gumaei, A.; Assiri, A.; Ullah, S.S. An Improved Artificial Neural Network Model for Effective Diabetes Prediction. Complexity 2021, 2021, 5525271. [Google Scholar] [CrossRef]
- Rahman, M.; Islam, D.; Mukti, R.J.; Saha, I. A deep learning approach based on convolutional LSTM for detecting diabetes. Comput. Biol. Chem. 2020, 88, 107329. [Google Scholar] [CrossRef]
- Ayon, S.I.; Islam, M.M. Diabetes Prediction: A Deep Learning Approach. Int. J. Inf. Eng. Electron. Bus. 2019, 11, 21–27. [Google Scholar] [CrossRef]
- Li, K.; Daniels, J.; Liu, C.; Herrero, P.; Georgiou, P. Convolutional Recurrent Neural Networks for Glucose Prediction. IEEE J. Biomed. Health Inform. 2020, 24, 603–613. [Google Scholar] [CrossRef]
- Zhang, Q.; Wang, D. Room temperature acetone sensor based on nanostructured K2W7O22. In Proceedings of the 2016 IEEE SENSORS, Orlando, FL, USA, 30 October–3 November 2016; pp. 1–3. [Google Scholar]
- Sadiq, M.; NK_Hoang, Q.; Kishlock, A.; Ghafouri_Sabzevari, F.; Katti, K.; Katti, D.; Zhang, Q.; Wang, D. MXene-montmorillonite nanocomposites-based scaffold sensors for early pancreatic cancer diagnosis. Cancer Plus 2024, 6, 3793. [Google Scholar] [CrossRef]
- Hossain, M.R.; Schornack, A.M.; Johnson, M.; Zhang, Q.; Wang, D. The Temperature Effect on the Performance of Acetone Sensor Based on K2W7O22 Nanorods. J. Nanosci. Nanotechnol. Appl. 2021, 5, 103. [Google Scholar]
- Hossain, M.R.; Zhang, Q.; Johnson, M.; Wang, D. Highly sensitive room-temperature sensor based on nanostructured K2W7O22 for application in the non-invasive diagnosis of diabetes. Sensors 2018, 18, 3703. [Google Scholar] [CrossRef]
- Wang, D.; Zhang, Q.; Hossain, M.R.; Johnson, M. High Sensitive Breath Sensor Based on Nanostructured K2W7O22 for Detection of Type 1 Diabetes. IEEE Sens. J. 2018, 18, 4399–4404. [Google Scholar] [CrossRef]
- Deng, C.; Zhang, J.; Yu, X.; Zhang, W.; Zhang, X. Determination of acetone in human breath by gas chromatography–mass spectrometry and solid-phase microextraction with on-fiber derivatization. J. Chromatogr. B 2004, 810, 269–275. [Google Scholar] [CrossRef]
- Paleczek, A.; Rydosz, A. Review of the algorithms used in exhaled breath analysis for the detection of diabetes. J. Breath Res. 2022, 16, 026003. [Google Scholar] [CrossRef] [PubMed]
- Brownlee, J. What is the Difference Between a Batch and an Epoch in a Neural Network? Mach. Learn. Mastery 2018, 20, 1–15. [Google Scholar]
- Misbah; Rivai, M.; Kurniawan, F. Diabetes Detection Using Carbon Nanomaterial Coated QCM Gas Sensors and a Convolutional Neural Network through Urine Sample. Int. J. Intell. Eng. Syst. 2023, 16, 417–427. [Google Scholar] [CrossRef]


Disclaimer/Publisher’s Note: The statements, opinions and data contained in all publications are solely those of the individual author(s) and contributor(s) and not of MDPI and/or the editor(s). MDPI and/or the editor(s) disclaim responsibility for any injury to people or property resulting from any ideas, methods, instructions or products referred to in the content. |
© 2025 by the authors. Licensee MDPI, Basel, Switzerland. This article is an open access article distributed under the terms and conditions of the Creative Commons Attribution (CC BY) license (https://creativecommons.org/licenses/by/4.0/).