Abstract
Accurate and rapid detection of Plasmodium falciparum parasites in blood smears is critical for the timely diagnosis and treatment of malaria, particularly in resource-constrained field settings. This paper presents a proof-of-concept solution demonstrating the feasibility of the Google Coral Edge Tensor Processing Unit (TPU) for real-time screening of thin blood smears for P. falciparum infection. We develop and deploy a lightweight deep learning model optimized for edge inference using transfer learning and training data supplied by the NIH. This model is capable of detecting individual parasitized red blood cells (RBCs) with high sensitivity and specificity. In a final deployment, the system will integrate a portable digital microscope and low-power color display with the Coral TPU to perform on-site image capture and classification without reliance on cloud connectivity. We detail the model training process using a curated dataset of annotated smear images, potential future hardware integration for field deployment, and performance benchmarks. Initial tests show that the Coral TPU-based solution achieves an accuracy of 92% in detecting P. falciparum parasites in thin-smear microscopy images, with processing times under 50 ms per identified RBC. This work illustrates the potential of edge AI devices to transform malaria diagnostics in low-resource settings through efficient, affordable, and scalable screening tools.
1. Introduction
Malaria in its many forms poses a significant global health problem due to its widespread prevalence, particularly in tropical and subtropical regions, and its potentially life-threatening impact, especially among children under five and pregnant women. Every year, there are an estimated 200 million cases [], leading to over a million deaths []. Previous research has found that out of the many parasites that cause malaria, Plasmodium falciparum has one of the highest infection and mortality rates []. Early and accurate diagnosis of malarial infections is critical for effective treatment and control, yet conventional diagnostic methods such as microscopy are often constrained by the need for skilled personnel, laboratory infrastructure, and time-consuming manual analysis. These limitations pose serious challenges for disease surveillance and timely intervention in resource-limited field settings. Recent advances in edge computing and artificial intelligence have opened new avenues for portable, automated diagnostic solutions. We propose that the Coral Tensor Processing Unit (TPU) offers a low-power, high-efficiency platform capable of running machine learning models directly on-device without the need for cloud connectivity. This makes it especially suited for real-time, point-of-care diagnostics in remote and under-served areas.
This paper presents a novel approach to field-based malaria diagnostics through the deployment of a Coral TPU-accelerated system for the screening of thin blood smears. By integrating image processing techniques with a lightweight convolutional neural network (CNN) optimized for the TPU, the proposed method enables rapid identification of P. falciparum parasites with minimal human oversight. While the proposed approach will still require a human operator to perform the final diagnosis, the screening performed by the AI model will greatly decrease the complexity of the task. This will not only reduce the time required for the human operator to perform the diagnosis, but will also reduce the amount of training required to operate the device.
2. Similar Work
Many methods for diagnosing malaria exist, such as PCR and rapid diagnostic testing, but to date, light microscopy remains the gold standard []. In addition to having an extremely high accuracy, microscopy also requires relatively few materials to perform. As a result, it is especially well suited to field diagnosis in locations without easy access to modern medical facilities []. Unfortunately, traditional microscopy also requires a highly trained human technician to perform the diagnosis, requires a significant amount of time, and—especially in cases where a large number of diagnoses must be performed—can lead to fatigue and incorrect results due to human error [].
To date, many researchers have proposed the use of computerized diagnostic algorithms in order to take advantage of the portability of light microscopy diagnosis while removing the human limitations of the technique [,]. Typically, these computational methods utilize CNNs, though other methods such as k-nearest neighbors and support vector machines have also been used []. While most of these computerized techniques are not as accurate as a trained human technician operating under ideal situations, they still do show very good accuracy and are capable of performing a virtually unlimited number of diagnoses without fatigue [,,,]. This makes computational approaches particularly well suited for use as a pre-screening system, where the algorithm will flag potentially positive samples for review by a trained human technician. In this way, the high accuracy of human diagnosis can be maintained while also greatly decreasing the workload on the human technician.
In order for these computational techniques to be functional in remote environments, it is important that they be able to operate on as little power as possible and without a connection to the internet. The majority of the existing approaches rely on smartphones to at least some degree, whether that be for data processing [,,] or only for image collection []. While the use of smartphones does mean that the systems are very easy to set up and use, they suffer from a relatively low processing power to power consumption ratio compared to more specialized devices. Another approach, seen in [], uses a Raspberry Pi in conjunction with a dedicated neural acceleration unit. This greatly increases the computational capabilities of the portable unit, but it also consumes more power and is slightly more expensive than the smartphones used in the other approaches.
While these approaches are significantly cheaper and more portable than a more conventional laboratory setup, we believe that the size, cost, and power consumption can be reduced even further by using hardware better suited to the task. As such, we propose the use of the Coral TPU, an extremely low-cost and high-efficiency coprocessor optimized for mobile computing. The Coral TPU has sufficient processing power to run complete the computerized diagnoses locally while only having a maximum power consumption of 2 watts. This makes it especially well suited to remote field work, where it can be powered entirely off of a small solar panel.
The authors of [] present a low-cost, portable microscope integrated with embedded AI for automated diagnosis of malaria in remote and resource-limited settings. Designed to overcome the challenges of conventional microscopy—such as high cost, reliance on skilled personnel, and limited accessibility—MAIScope combines an innovative bead-based microscope with a Raspberry Pi, camera, and touchscreen interface. Its software pipeline employs TensorFlow Lite models optimized for edge devices, using EfficientDet-Lite4 for detecting red blood cells and MobileNetV2 for classifying malaria-infected cells. The system operates offline, is powered by a portable battery, and fits within a compact 20 × 10 × 8 cm form factor. It achieves a classification accuracy of 89.9% which is acceptable but less than other models such as ResNet-50, Xception, DenseNet-121, VGG-16, and AlexNet models designed to classify malaria cells [].
In [], the authors present the development and validation of a low-cost, portable brightfield and fluorescence microscope designed to automate the quantification of malarial parasitemia in thin blood smears, with a focus on applicability in remote, resource-limited settings. The microscope captures paired brightfield and fluorescence images of SYBR Green-stained P. falciparum-infected red blood cells, enabling automated parasite-to-RBC ratio calculations. Comparative experiments using laboratory-cultured parasites showed that the portable system’s parasitemia measurements had a strong linear correlation (R2 = 0.939) with those obtained from a benchtop fluorescence microscope. The system is powered by a Jetson Nano which is added just for future AI integration. The system has not been tested on samples from actual patients. Jetson Nano depends on GPUs which consumes more energy than TPUs. Other low-cost processing units are more affordable such as the Coral TPU. In [], the authors present a promising AI-driven approach to malaria detection using YOLOv5 and Transformer models integrated with a CNN classifier. One of the key strengths of their proposed approach is its high diagnostic accuracy of up to 97%, comparable to that of professional microscopists, while also being suitable for use with smartphone-acquired images. This makes it especially beneficial for deployment in low-resource settings where expert microscopists and advanced equipment are unavailable. However, the system presented in [] has limitations, notably the dataset’s limited diversity, which may affect generalizability. Broader clinical validation across diverse populations and environments is needed to enhance robustness and applicability. Additionally, the use of a smartphone to capture and process the images alongside an appropriate digital microscope reduces the cost-effectiveness of the solution. Rosado et al in [,] present a smartphone-integrated diagnostic tool using SmartScope, a microscope developed by the authors to detect the presence of malaria parasites in Giemsa-stained thin blood smears. The primary advantage of this approach is its portability, cost-effectiveness, and ability to eliminate the need for chemical staining, making it highly suited for field diagnostics in low-resource settings. On the downside, the system’s accuracy heavily depends on sample quality and operator skill. Variations in smartphone camera quality and lighting conditions can also affect diagnostic consistency. The dataset used is very limited and required professionals to annotate it. The cost of the system could also be a factor due to the need for a smartphone and a microscope that requires a power source to move the motors and provide illumination. The microscope used in this work is also limited to Android phones, reducing the portability of the system. Pirnstill and Coté [] present a portable diagnostic system that utilizes a smartphone coupled with a polarized light microscope to detect malaria by identifying birefringent hemozoin crystals. A significant advantage of this approach is its potential for widespread deployment in resource-limited settings, as it eliminates the need for staining and high-end laboratory equipment. However, limitations include sensitivity issues at low parasite concentrations and the need for consistent sample preparation techniques. Additionally, variations in smartphone camera quality and environmental lighting can impact image quality and diagnostic accuracy. Although the use of a smartphone can help in the rapid deployment of the system, the cost of the smartphone and the need for a microscope makes this system less practical and costly. Yu et al. [] introduce an open-source Android application that assists in malaria diagnosis by analyzing thin and thick blood smears through smartphone-connected microscopy. One of its biggest strengths is its modular, extendable design, which integrates image acquisition, parasite detection via CNNs, and result visualization. making it highly suitable for deployment in resource-limited settings. However, the semi-automated nature requires manual slide navigation, and image capture quality may vary depending on user skill and phone hardware. Additionally, the initial hardware setup assumes access to microscopes and adapters.
There exists many works using smartphones for detecting the presence of malaria parasites such as Yang et al. [], Zhenfang et al. [], Zhao et al. [], Oliveira et al. [], and Cesario et al. []. Using a smartphone for detecting malaria parasites offers several key advantages, particularly in resource-limited settings. Smartphones are widely accessible, portable, and equipped with high-resolution cameras and substantial processing power, enabling effective image capture and on-device analysis of blood smear samples. When combined with inexpensive microscope adapters and AI-based diagnostic apps, smartphones can facilitate rapid and semi-automated malaria screening without the need for highly trained personnel. Despite its potential, using a smartphone for detecting malaria parasites has several disadvantages. The diagnostic accuracy can be affected by variations in camera quality, lighting conditions, and user handling, leading to inconsistent results. The semi-automated nature of most smartphone-based systems still requires manual slide preparation and navigation, which may limit throughput and introduce user-dependent variability. Additionally, smartphones may lack the computational resources needed for running complex AI models efficiently, especially in real-time. Dependence on peripheral hardware such as microscope adapters can also pose logistical challenges in remote areas.
3. System Design and Methodology
3.1. Proposed Hardware System Design
In the final proposed deployment, the system will consist of three main components. First, the microscopy image will be captured by a low-cost digital microscope and transferred to the microprocessor and Coral TPU for processing. The microprocessor will then perform image preprocessing to convert it to a format that is compatible with the AI models running on the Coral TPU. Next, the Coral TPU will detect the presence of RBCs in the processed microscopy image and classify them as either healthy or parasitized. Finally, the microprocessor will collect images of all RBCs that were classified as parasitized by the Coral TPU and display them to the human operator on a low-power display to perform the final diagnosis. A block diagram of this proposed system can be seen in Figure 1. The system will operate completely offline, and can be powered by any number of renewable energy sources such as solar. Additionally, the low complexity will make it easy to ruggedize the system and reduce the difficulty of any repairs. This makes the proposed system ideal for field deployments in remote areas and previously under-served malaria hot spots.
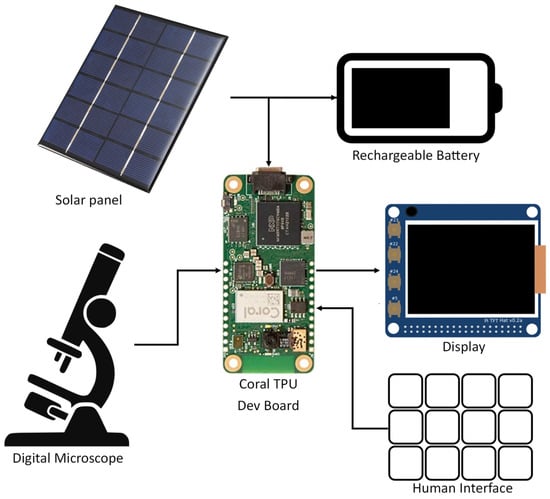
Figure 1.
Block Diagram of the Hardware Design of the Proposed System.
Of the components shown in Figure 1, the digital microscope, rechargeable batter, and solar panel (or other similar energy harvesting device) will be shared between all field diagnosis platforms such as those seen in Section 2. For a low-cost portable solution, we expect that these parts will cost between USD 200 and USD 300. Additionally, all field diagnosis platforms will require consumables in the form of gloves, wipes, needles, slides, stain, etc. These will incur a small but recurring operating cost. Costs unique to this proposed application will be the Coral Dev Board Micro, screen, interface, and a rugged housing to house the electronics. We estimate that these unique costs will add an additional USD 150 to USD 200, yielding a total up-front cost of under USD 500. Smartphone based applications such as those seen in [,,,] typically still use a digital microscope and energy harvesting system while also requiring a smartphone which will often have costs of over USD 300. Additionally, smartphones tend to be more susceptible to broken screen, water damage, overheating, and other environmental effects than a custom-designed ruggedize system. While the ubiquity of smartphones may mean that smartphone-based diagnosis systems will have better scalability than the system proposed in this paper, we believe that the reduced cost in the increased potential for ruggedization of the proposed system will make it better suited for field use should it show sufficiently good performance.
Due to the relatively low shelf life of thin smear blood samples and the ethical complexities surrounding their collection, we were unable to fully test this proposed system using actual samples. Instead, we relied on a curated dataset of thin smear microscopy images provided by the NIH and NLM [] to perform training and validation. We find that this dataset contains an acceptably large range of imaging conditions for testing purposes, including variations in staining, focus, and lighting. To perform these tests, we utilized a USB to serial adapted to emulate a digital microscope, allowing us to feed the sample images to the Coral dev board in a way that mimics the functionality of a digital microscope as accurately as possible. While testing with a full integration of the system in a field environment was not feasible for this work, the results of testing with the emulated system will still be sufficient to show the validity of the proposed approach.
3.2. Proposed Firmware Architecture
In this paper, we will be using Google’s Coral Edge TPU co-processor to perform the image classification tasks required to detect the presence of P. falciparum in blood samples. For simplicity we will use the Coral Dev Board Micro, obtained from Mouser Electronics. This dev board integrates the edge TPU, an ARM microprocessor, and all the required supporting components in a single package. This system provides a convenient platform to develop and test models for the Coral TPU without needing to worry about complex PCB design. As such, this paper will only need to be concerned with the models and firmware that will be running on the dev board.
The proposed detection system will operate in two main phases. First, a microscopy image will be loaded and split into chunks and then each chunk will be scaled down and transferred to the Coral TPU to be scanned for RBCs. This scanning will be performed using the re-trained object detection model, allowing for a large number of RBCs to be detected at once without needing to intereact with the entirety of the full-resolution image. The object detection model will also provide a first-round estimate of which RBCs might be infected by P. falciparum, allowing the second phase to analyze the cells that have the highest probability of parasitization first. Second, a cropped image of each individual cell detected in the first phase will be generated, and these cropped images will be sent to the Coral TPU for classification. This classification will be performed by one of the four image classification models previously mentioned, and cells will be analyzed in order of most to least likely to be parasitized as determined by the first object detection phase. Once a sufficient number of potentially parasitized cells have been detected, the scanning will be terminated and the sample will be flagged for human diagnosis. A flow chart of this software architecture can be seen in Figure 2.
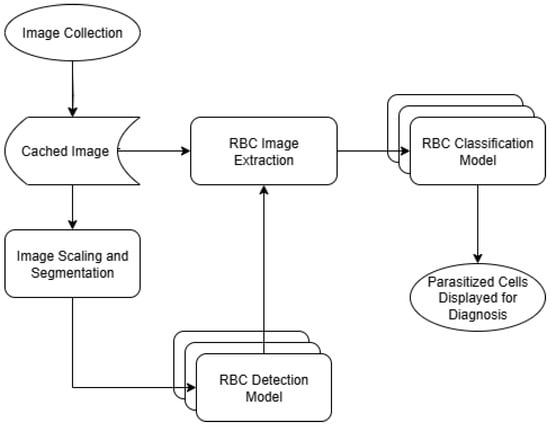
Figure 2.
Software flow chart.
It is our hope that this two-phase approach will help reduce the computational complexity of detecting parasitized cells. Since most of the microscopy images seen in the dataset are composed of mostly empty space, it would be computationally expensive to run object detection and classification models on the entirety of the full resolution image. Fortunately, it is possible to detect the presence of RBCs at a much lower resolution than is required to classify them as parasitized or healthy. Because of this, we are able to first find the location of RBCs with a lower resolution image, and then only use the high resolution image to check for the presence of P. falciparum where we know there is actually an RBC present.
Training data for the models was obtained from a dataset of microscopy images supplied by NIH and NLM []. This dataset contains several thousand RBCs, each annotated with an outline and whether or not they are healthy or parasitized. Prior to training, the dataset was augmented by applying a set of transformations to each image. Each microscopy image in the training dataset was rotated by 45 degrees, after which both the original and rotated image had a Gaussian blur applied. An example of images with these transformations applied can be seen in Figure 3. This dataset augmentation was only applied to the training data used for the RBC detection model, as the size of the RBC classification dataset proved to be large enough to yield reasonable performance in testing without the need for augmentation. By using these transformations, the effective size of the object detection dataset was increased by a factor of four and the recall rate of the trained model increased by approximately 20 percentage points.
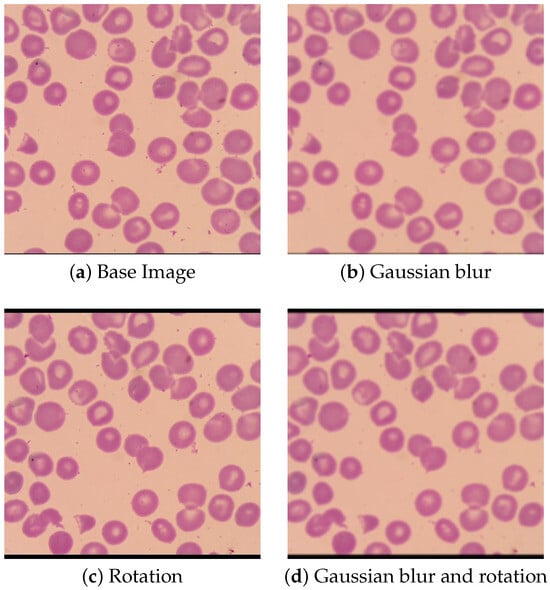
Figure 3.
Transformed Images.
Additionally, the supplied annotations containing the outline of each RBC were used to generate a rectangular bounding box around each individual RBC. A ten pixel margin was then applied to each RBC bounding box, after which a new set of images was generated of individual RBCs using these bounding boxes. Examples of these new images can be seen in Figure 4. The P. falciparum in the parasitized cells can be seen in these images as darker spots that accepted the Giemsa stain. Since the dataset contains so many more images of uninfected RBCs than parasitized RBCs—33,071 compared to 1142 respectively—only a limited number of the RBCs will be used in the training data. By reducing the number of uninfected RBCs to be closer to the number of parasitized RBCs present in the training data, it will be much easier to prevent overfitting resulting in false negatives. To accomplish this, 5% of the uninfected cells were randomly selected to be included in the training data while the remaining 95% were discarded. This random selection of uninfected RBCs was then manually vetted to insure that it comprises an accurate representation of the uninfected RBCs as a whole. After this pruning was applied, the final training data contained 1142 parasitized RBCs and 1620 uninfected RBCs. This dataset was then split into two segments, where 80% of the images will be used for training the RBC classification model and the remaining 20% being used for model validation.
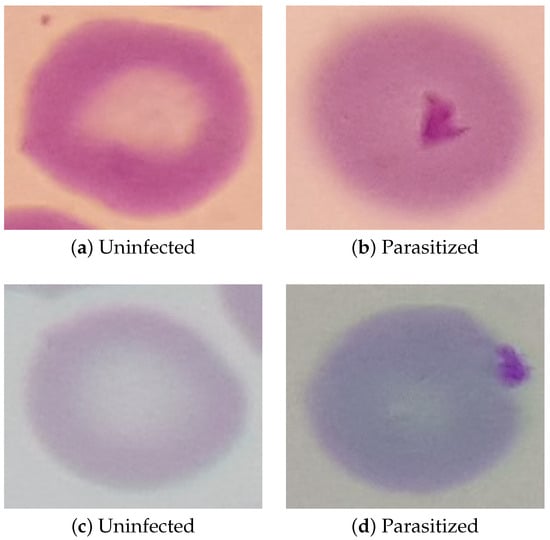
Figure 4.
Example Images of Individual RBCs.
3.3. Training and Validation Process
First, it is necessary to train a set of object detection and classification models that would be compatible with the Coral TPU. Because of the limited amount of training data available, it was decided that re-training existing object detection and classification models would be far more practical than attempting to train new models from scratch. This is in line with much of the existing research into detecting P. falciparum [,,], though some previous works did attempt to develop new models from scratch to various degrees of success []. Due to architectural limitations of the Coral TPU, only certain operations and data types are supported. As such, only a limited number of object detection and classification models are natively compatible with the Coral TPU, and those that are compatible require an extra quantization step in training to convert the model parameters to a datatype supported by the Coral TPU. With these limitations in mind, we selected SSD Mobilenet v2 as our object detection model. We then selected Mobilenet v1, Mobilenet v2, Inception v1, and Inception v2 as options for the image classification phase, allowing system performance to be compared between the four models. These models were chosen for their excellent compatibility with the capabilities of the Coral TPU, while still offering sufficient variety for this proof-of-concept study. While other potentially more performant models exist, such as EfficientNet or ResNet, they would require significant modifications to their architecture that are outside the scope of this proof-of-concept paper.
Similarly, we opted not to perform an in depth analysis of hyperparameter tuning as proper hyperparameter tuning with the quantized training employed in this paper would require prohibitively large amounts of time. Instead, the pre-tuned hyperparameters supplied alongside the quantized models optimized for use with the Coral TPU were used for training. While these pre-tuned hyperparameters will almost certainly not be the most optimum for any specific application, they should still yield a sufficiently high performance to be appropriate for use in a proof-of-concept work.
The image processing portions of this algorithm—i.e., the scaling and cropping of the original image—will be run on the ARM processor of the dev board micro. Meanwhile, the object detection and classification portions of the algorithm will be run on the Coral TPU and will utilize CNNs. This will allow us to make the most use of each part of the hardware and thus improve the processing efficiency.
The detection algorithm was trained using transfer learning with SSD Mobilenet v2 as a base. Several different classification models were then trained, also using transfer learning, using various popular image classification models as the base. For this paper, the base image classification models selected were EfficientNet-EdgeTpu, Inception V1, Inception V3, and MobileNet V2. Training was performed on a desktop system, and the resulting models were then compiled and transferred to the dev board for testing.
To test the models, images were transferred to the deb board using a USB to UART bridge, emulating an external microscopic camera attached to the dev board using the communication peripherals of the built-in ARM microprocessor.
4. Experimental Results
4.1. Cell Detection Phase
In our initial tests, we found that the performance of the MobileNet v2 object detection model dropped off rapidly as the number of cells in the microscopy image increased. At 200 cells—which is approximately the mean number of cells in the microscopy image dataset—we found that the recall rate often dropped well below 10%. In order to increase the recall to a usable rate, we split each image into a number of sub-sections and ran the object detection model on each sub-section individually. Increasing the number of sub-sections to be scanned by the object detection model in this way causes a proportional increase in required computations, so it is necessary to balance the number of sub-sections used with the resulting recall rate.
In our tests, we found that a 3 × 3 grid of sub-sections offered the best balance between computational load and recall. At this sub-section count, the recall rate of the re-trained MobileNet v2 model varied between 50 and 60% with a mean value of 57.4% when tested on the validation images. This recall rate included a proportional representation of both parasitized and healthy RBCs, meaning that neither population will be statistically under-represented in the detected cells. While relatively low, this recall rate still provides a large enough sample size reliably detecting the presence of P. falciparum. Microscopy images in the training datasets contain an average of approximately 200 RBCs, and positive microscopy images contain on average around 12 parasitzied RBCs. Given this expected number of parasitized cells and total population size in a positive microscopy image, we can calculate that the probability of there being no parasitized cells in the detection sample is below 1%. Thus, not accounting for additional uncertainties introduced by the image classification phase, negative results at this stage can be accepted with .
The processing time required for the Coral dev board to divide the microscopy image into nine sub-sections and the subsequent inference ranged from 70 to 80 ms with an average power consumption of 0.78 W. Thus, we find that the power-delay product of the first phase ranges from 55 to 65 mJ per microscopy image.
4.2. Cell Classification Phase
For cell classification, we are mainly interested in three performance metrics. Sensitivity and specificity measure the rate at which the model correctly classify parasitized and healthy RBCs respectively, while accuracy measures the overall rate of correct classifications. Since it will be impossible to achieve perfect accuracy with an AI model, it will often be necessary to balance between the sensitivity and specificity of the model. For our use case, the human operator will be able to reject any false positives reported by the model, but will never even see any false negatives. As such, it will be desirable to have as high of a sensitivity as possible, even at the cost of a slightly decreased specificity.
After training, the comparative performance of the models on the validation data was measured, the results of which are reported in Table 1 and Figure 5. The confusion matrices for all four models at a 50% threshold are shown in Figure 6. From these results, we find that the performance MobileNet v1 and Mobilenet v2 models was unsatisfactory, while the Inception v1 and Inception v2 models performed reasonably well. While the overall performance of the Inception v1 and Inception v2 models were roughly comparable, we found that the image processing latency and corresponding energy consumption of the Inception v1 model was roughly six times less than that of the Inception v2 model. As such we find that of the four models tested, Inception v1 is best suited to the task of RBC classification.

Table 1.
Performance of Classification Models.
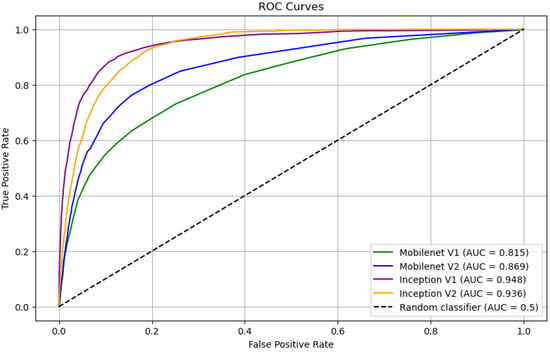
Figure 5.
ROC Curves of Classification Models.
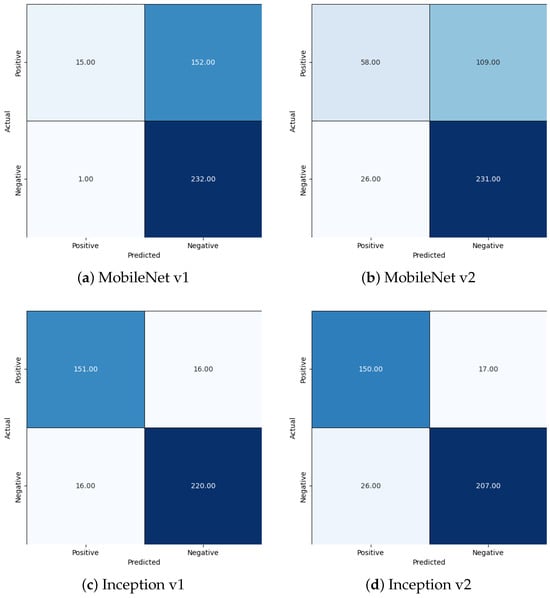
Figure 6.
Confusion Matrices.
While the performance of the models proposed in this work are slightly worse than that in the existing literature, such as in [], it is still high enough to be practical. A comparison of the performance of these models and those in the existing literature can be found in Table 2. Since is the first iteration of the design, it should be possible to make further improvements on the model performance in future works. Overall, we find that the small decrease in performance is an acceptable tradeoff for the decreased hardware cost and ruggedizability of the proposed system.

Table 2.
Comparison with Existing Solutions.
4.3. Full System Analysis
While the performance of the Inception v1 model reported in the previous section is sufficient for the proposed application, it still has a non-negligible amount of false positive and false negative results. Examples of these false positives and negatives can be seen in Figure 7 and Figure 8, respectively.
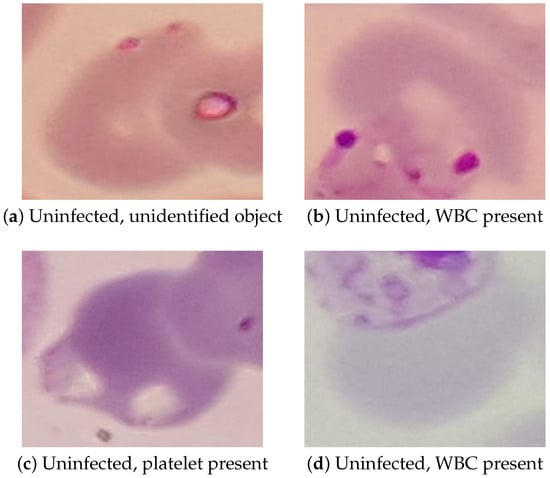
Figure 7.
Examples of False Positives Reported by Inception v1.
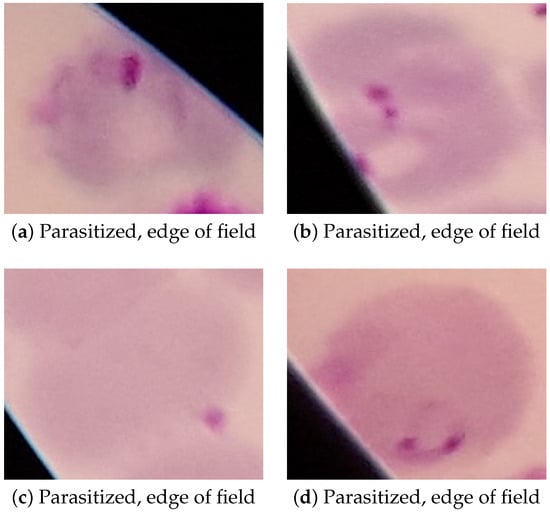
Figure 8.
Examples of False Negatives Reported by Inception v1.
In the false positive images, we can see that two of the false positives—Figure 7b,d—were caused by a white blood cell (WBC) overlapping with the RBC incorrectly classified as parasitized. Because WBCs take up the stain in a way that can look similar to a P. falciparum parasite, they can cause an incorrect classification when they appear in the edge of the cropped RBC image in this way. The other two false positives—Figure 7a,c—are caused by various small objects that also took up the stain in a way that looked similar to the P. falciparum parasites. In testing, platelets and cellular debris seemed to be the most common objects that caused mis-classification of uninfected cells, though other objects such as that seen in Figure 7a also occurred. In future work, false positives caused by WBCs could be prevented by also detecting WBCs in the cell detection phase and discarding any RBCs that overlap with a detected WBCs. Preventing false positives caused by the various small objects will be more difficult, most likely requiring more advanced image pre-processing or more complex models.
False negatives, on the other hand, almost exclusively occurred at the edge of the field of view of the microscope, as seen in Figure 8. While these false negatives could easily be prevented by simply not scanning cells at the edge of the field of view of the microscope, this approach would likely decrease the performance of the model as a whole due to the potential for it to discard parasitized cells that could have been detected as true positives. False negatives were also more likely to occur in microscopy images that had poor focus or showed higher amounts of chromatic aberration, both of which can be seen in all of the examples in Figure 8. This can be avoided in hardware by assuring that the microscope optics used are of acceptably high quality and that the microscope itself is in focus before capturing the image.
Since we are primarily concerned with preventing a false negative diagnosis, we must analyze the probability of no parasitized cells being detected and classified when the models are applied to a positive microscopy image. Given the number of RBCs per microscopy image and number of parasitized RBCs given in Section 4.1, we can easily model the probability of no parasitized cells being detected in a positive microscopy image. Through statistical analysis, we find this probability to be well below 1%. Thus, we can accept any negative results reported by the proposed system with a confidence of over 99%.
In our analysis, we find that while the proposed model performs well when extracting and classifying individual RBCs or determining that P. falciparum is not present in a given microscopy image, it is not suited to provide a full diagnosis of microscopy image as a whole. This is primarily due to the relatively low specificity of the Inception v1 model selected for use. Even though less than 7% of healthy cells are reported as false positives by the model, this is still enough to almost guarantee the presence of multiple false positives when classifying an entire population of cells. With the population sizes of the microscopy images from the dataset, the Inception v1 model detected an average of nine parasitized cells in uninfected samples and twelve parasitized cells in infected samples. The distribution of number of infected cells detected can be seen in Figure 9.
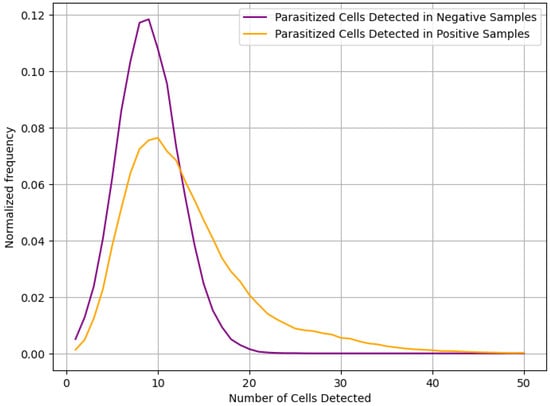
Figure 9.
Distribution of parasitized cells detected.
Unfortunately, due to the statistical similarity of the two distributions seen in Figure 9, it will not be possible for the system to provide overall diagnosis with any reasonable degree of sensitivity and specificity. Instead, we propose that the model be used to create a small set of RBC images that the model predicted were parasitized, along with the certainty of that prediction. Each image will then be displayed to a human operator, allowing the final diagnosis to be made. While this does mean that the system is not fully automated, it does reduce the number of RBCs to be scanned by the human operator from an average of 200 per sample to only around 10 per sample. This will greatly reduce the load on the human operator, increasing the speed at which diagnosis can be performed and decreasing errors due to fatigue mentioned in [].
Overall, we found that the total processing time was typically in the range of 1–2 s, measured from a microscopy image being sent to the Coral dev board to the RBCs classified as parasitized being displayed to the human operator. While this time could potentially be decreased, for example by running multiple RBC classification models in parallel, it is low enough that the human factors—e.g., loading the thin smear slide into the digital microscope and performing the final diagnosis of the RBCs classified as parasitized—will be the driving factor in the time required to make a diagnosis. As such, we find further system optimization in terms of processing time to be unnecessary.
5. Conclusions and Future Work
In this work, we presented a low-cost, low-power proof-of-concept device that can be used in a wide variety of environments to screen thin smear blood samples for the presence of the P. falciparum parasite. While the specificity of this iteration of the design was not high enough that it could make diagnosis completely autonomously, it was still able to act as a useful pre-screening before a final diagnosis was made by a human operator. We demonstrated that this pre-screening operation was able to reduce the number of cells that must be checked by the human operator by a factor of around 20, with a high enough sensitivity that we can accept a negative diagnosis with over 99% confidence. This simultaneously increases the number of samples that can be tested in a day while also decreasing the workload on the human operator.
As the power consumption and processing time of the proposed system was found to already be low enough for the application, the main avenue for improvements in future work will be improving the performance of the AI models. This could be done in a number of ways, such as a higher performance or fully-custom model, an in-depth analysis of hyperparameter tuning, training on a larger and more diverse dataset, or applying various image pre-processing techniques to the microscopy image. From our statistical analysis, we found that the most impactful performance metrics that can be targeted for improvements are the recall of the RBC detection model and the specificity of the RBC classification model.
Author Contributions
Conceptualization, O.O. and T.E.; methodology, O.O.; investigation, O.O.; writing—original draft preparation, O.O.; writing—review and editing, O.O. and T.E.; project administration, T.E. All authors have read and agreed to the published version of the manuscript.
Funding
This research received no external funding.
Data Availability Statement
The original data presented in this study are openly available from the Lister Hill National Center for Biomedical Communications at https://data.lhncbc.nlm.nih.gov/public/Malaria/NIH-NLM-ThinBloodSmearsPf/index.html or []. The hyperparameters, augmented datasets, and trained models used in this study are available upon reasonable request.
Conflicts of Interest
The authors declare no conflicts of interest.
References
- Cibulskis, R.E.; Alonso, P.; Aponte, J.; Aregawi, M.; Barrette, A.; Bergeron, L.; Fergus, C.A.; Knox, T.; Lynch, M.; Patouillard, E.; et al. Malaria: Global progress 2000–2015 and future challenges. Infect. Dis. Poverty 2016, 5, 61. [Google Scholar] [CrossRef]
- Murray, C.J.; Rosenfeld, L.C.; Lim, S.S.; Andrews, K.G.; Foreman, K.J.; Haring, D.; Fullman, N.; Naghavi, M.; Lozano, R.; Lopez, A.D. Global malaria mortality between 1980 and 2010: A systematic analysis. Lancet 2012, 379, 413–431. [Google Scholar] [CrossRef] [PubMed]
- Ross, A.; Maire, N.; Molineaux, L.; Smith, T. An epidemiologic model of severe morbidity and mortality caused by Plasmodium falciparum. Am. J. Trop. Med. Hyg. 2006, 75, 63–73. [Google Scholar] [CrossRef]
- Maturana, C.R.; de Oliveira, A.D.; Nadal, S.; Bilalli, B.; Serrat, F.Z.; Soley, M.E.; Igual, E.S.; Bosch, M.; Lluch, A.V.; Abelló, A.; et al. Advances and challenges in automated malaria diagnosis using digital microscopy imaging with artificial intelligence tools: A review. Front. Microbiol. 2022, 13, 1006659. [Google Scholar] [CrossRef]
- Fitri, L.E.; Widaningrum, T.; Endharti, A.T.; Prabowo, M.H.; Winaris, N.; Nugraha, R.Y.B. Malaria diagnostic update: From conventional to advanced method. J. Clin. Lab. Anal. 2022, 36, e24314. [Google Scholar] [CrossRef]
- Shambhu, S.; Koundal, D.; Das, P.; Hoang, V.T.; Tran-Trung, K.; Turabieh, H. Computational Methods for Automated Analysis of Malaria Parasite Using Blood Smear Images: Recent Advances. Comput. Intell. Neurosci. 2022, 2022, 3626726. [Google Scholar] [CrossRef]
- Hemachandran, K.; Alasiry, A.; Marzougui, M.; Ganie, S.M.; Pise, A.A.; Alouane, M.T.H.; Chola, C. Performance Analysis of Deep Learning Algorithms in Diagnosis of Malaria Disease. Diagnostics 2023, 13, 534. [Google Scholar] [CrossRef]
- Oktovianus, L.; Tikkhaviro, J.K.; Prasetyo, S.Y. Benchmarking CNN Models for Malaria Cell Detection. In Proceedings of the 2024 International Conference on Computer Engineering, Network, and Intelligent Multimedia (CENIM), Surabaya, Indonesia, 1–20 November 2024; pp. 1–6. [Google Scholar] [CrossRef]
- Hamid, M.M.A.; Mohamed, A.O.; Mohammed, F.O.; Elaagip, A.; Mustafa, S.A.; Elfaki, T.; Jebreel, W.M.A.; Albsheer, M.M.; Dittrich, S.; Owusu, E.D.A.; et al. Diagnostic accuracy of an automated microscope solution (miLab™) in detecting malaria parasites in symptomatic patients at point-of-care in Sudan: A case–control study. Malar. J. 2024, 23, 200. [Google Scholar] [CrossRef]
- Benachour, Y.; Flitti, F.; Khalid, H.M. Enhancing Malaria Detection Through Deep Learning: A Comparative Study of Convolutional Neural Networks. IEEE Access 2025, 13, 35452–35477. [Google Scholar] [CrossRef]
- Rosado, L.; da Costa, J.M.C.; Elias, D.; Cardoso, J.S. Automated Detection of Malaria Parasites on Thick Blood Smears via Mobile Devices. Procedia Comput. Sci. 2016, 90, 138–144. [Google Scholar] [CrossRef]
- Yang, F.; Poostchi, M.; Yu, H.; Zhou, Z.; Silamut, K.; Yu, J.; Maude, R.J.; Jaeger, S.; Antani, S. Deep Learning for Smartphone-Based Malaria Parasite Detection in Thick Blood Smears. IEEE J. Biomed. Health Inform. 2020, 24, 1427–1438. [Google Scholar] [CrossRef]
- Fuhad, K.M.F.; Tuba, J.F.; Sarker, M.R.A.; Momen, S.; Mohammed, N.; Rahman, T. Deep Learning Based Automatic Malaria Parasite Detection from Blood Smear and Its Smartphone Based Application. Diagnostics 2020, 10, 329. [Google Scholar] [CrossRef]
- Abdurahman, F.; Fante, K.A.; Aliy, M. Malaria parasite detection in thick blood smear microscopic images using modified YOLOV3 and YOLOV4 models. BMC Bioinform. 2021, 22, 112. [Google Scholar] [CrossRef]
- Bueno, G.; Sanchez-Vargas, L.; Diaz-Maroto, A.; Ruiz-Santaquiteria, J.; Blanco, M.; Salido, J.; Cristobal, G. Real-Time Edge Computing vs. GPU-Accelerated Pipelines for Low-Cost Microscopy Applications. Electronics 2025, 14, 930. [Google Scholar] [CrossRef]
- Sangameswaran, R. MAIScope: A low-cost portable microscope with built-in vision AI to automate microscopic diagnosis of diseases in remote rural settings. arXiv 2022, arXiv:2208.06114. [Google Scholar]
- Rajaraman, S.; Antani, S.K.; Poostchi, M.; Silamut, K.; Hossain, M.A.; Maude, R.J.; Jaeger, S.; Thoma, G.R. Pre-trained convolutional neural networks as feature extractors toward improved malaria parasite detection in thin blood smear images. PeerJ 2018, 6, e4568. [Google Scholar] [CrossRef]
- Gordon, P.D.; De Ville, C.; Sacchettini, J.C.; Coté, G.L. A portable brightfield and fluorescence microscope toward automated malarial parasitemia quantification in thin blood smears. PLoS ONE 2022, 17, e0266441. [Google Scholar] [CrossRef] [PubMed]
- Liu, R.; Liu, T.; Dan, T.; Yang, S.; Li, Y.; Luo, B.; Zhuang, Y.; Fan, X.; Zhang, X.; Cai, H.; et al. AIDMAN: An AI-based object detection system for malaria diagnosis from smartphone thin-blood-smear images. Patterns 2023, 4, 100806. [Google Scholar] [CrossRef] [PubMed]
- Rosado, L.; Da Costa, J.M.C.; Elias, D.; Cardoso, J.S. Mobile-Based Analysis of Malaria-Infected Thin Blood Smears: Automated Species and Life Cycle Stage Determination. Sensors 2017, 17, 2167. [Google Scholar] [CrossRef]
- Pirnstill, C.W.; Coté, G.L. Malaria Diagnosis Using a Mobile Phone Polarized Microscope. Sci. Rep. 2015, 5, 13368. [Google Scholar] [CrossRef] [PubMed]
- Yu, H.; Yang, F.; Rajaraman, S.; Ersoy, I.; Moallem, G.; Poostchi, M.; Palaniappan, K.; Antani, S.; Maude, R.J.; Jaeger, S. Malaria Screener: A smartphone application for automated malaria screening. BMC Infect. Dis. 2020, 20, 825. [Google Scholar] [CrossRef] [PubMed]
- Yu, Z.; Li, Y.; Deng, L.; Luo, B.; Wu, P.; Geng, D. A high-performance cell-phone based polarized microscope for malaria diagnosis. J. Biophotonics 2023, 16, e202200290. [Google Scholar] [CrossRef] [PubMed]
- Zhao, O.S.; Kolluri, N.; Anand, A.; Chu, N.; Bhavaraju, R.; Ojha, A.; Tiku, S.; Nguyen, D.; Chen, R.; Morales, A.; et al. Convolutional neural networks to automate the screening of malaria in low-resource countries. PeerJ 2020, 8, e9674. [Google Scholar] [CrossRef] [PubMed]
- Oliveira, A.D.; Prats, C.; Espasa, M.; Zarzuela Serrat, F.; Montañola Sales, C.; Silgado, A.; Codina, D.L.; Arruda, M.E.; i Prat, J.G.; Albuquerque, J. The Malaria System MicroApp: A New, Mobile Device-Based Tool for Malaria Diagnosis. JMIR Res. Protoc. 2017, 6, e70. [Google Scholar] [CrossRef]
- Cesario, M.; Lundon, M.; Luz, S.; Masoodian, M.; Rogers, B. Mobile support for diagnosis of communicable diseases in remote locations. In Proceedings of the 13th International Conference of the NZ Chapter of the ACM’s Special Interest Group on Human-Computer Interaction, Dunedin, New Zealand, 2–3 July 2012; pp. 25–28. [Google Scholar]
- Kassim, Y.M.; Palaniappan, K.; Yang, F.; Poostchi, M.; Palaniappan, N.; Maude, R.J.; Antani, S.; Jaeger, S. Clustering-Based Dual Deep Learning Architecture for Detecting Red Blood Cells in Malaria Diagnostic Smears. IEEE J. Biomed. Health Inform. 2020, 25, 1735–1746. [Google Scholar] [CrossRef]
Disclaimer/Publisher’s Note: The statements, opinions and data contained in all publications are solely those of the individual author(s) and contributor(s) and not of MDPI and/or the editor(s). MDPI and/or the editor(s) disclaim responsibility for any injury to people or property resulting from any ideas, methods, instructions or products referred to in the content. |
© 2025 by the authors. Licensee MDPI, Basel, Switzerland. This article is an open access article distributed under the terms and conditions of the Creative Commons Attribution (CC BY) license (https://creativecommons.org/licenses/by/4.0/).