Abstract
Accurate very short-term load forecasting (VSTLF) is critical to ensure a secure operation of power systems under increasing uncertainty due to renewables. This study proposes an eXtreme Gradient Boosting (XGBoost)-based VSTLF model that incorporates day-ahead load forecasts (DALF) results and load variation features. DALF results provide trend information for the target time, while load variation, the difference in historical electric load, captures residual patterns. The load reconstitution method is also adapted to mitigate the forecasting uncertainty caused by behind-the-meter (BTM) photovoltaic (PV) generation. Input features for the proposed VSTLF model are selected using Kendall’s tau correlation coefficient and a feature importance score to remove irrelevant variables. A case study with real data from the Korean power system confirms the proposed model’s high forecasting accuracy and robustness.
1. Introduction
Accurate electric load forecasting is an essential component to maintain a stable operation of power systems. Electric load forecasting is generally categorized by time horizon into long-, medium-, short-, and very short-term load forecasting (VSTLF) [1]. Among these, VSTLF, which forecasts electric load over the next few seconds to several hours, plays a crucial role in enabling real-time operational decisions, thereby supporting the reliable and secure management of power systems. As power systems shift from fossil-fuel-based generation to renewable energy sources to achieve carbon neutrality, the uncertainty in electric load forecasting continues to increase. Renewable resources such as solar and wind power are inherently weather-dependent and intermittent, which introduces higher levels of volatility into electric load patterns. Consequently, short-term load forecasting, typically referring to day-ahead load forecasting (DALF), is often inadequate in responding to such rapid fluctuations, as it targets electric load over several hours to days and is not designed to capture rapid, real-time changes. This challenge highlights the need for accurate VSTLF to ensure secure and resilient operation of power systems under high renewable energy penetration [2].
As machine learning and deep learning techniques have advanced, numerous researchers have focused on employing these models to improve the accuracy of load forecasting. Among machine learning models, eXtreme Gradient Boosting (XGBoost) [3], Categorical Boosting [4], Light Gradient Boosting Machine [4], and Support Vector Regression (SVR) [5] are widely employed for load forecasting. Beyond these, deep learning approaches often utilize architectures such as Deep Neural Networks (DNNs), Convolutional Neural Networks (CNNs) [6], Long Short-Term Memory (LSTM) [7], Gated Recurrent Unit (GRU) [8], and Transformer models [9]. While LSTM, GRU, and Transformer architectures have demonstrated strong performance in broader load forecasting applications, they are computationally intensive. In the context of VSTLF, where rapid generation of forecasts is critical for real-time operation, such computational burdens might hinder their practical deployment [2].
One of the key strategies to improve the accuracy of load forecasting is feature selection methods of the electric load curve using signal decomposition techniques. For example, Yang et al. [10] proposed a univariate load forecasting model that combines Ensemble Empirical Mode Decomposition (EEMD) with a dual-stage attention-based recurrent neural network (RNN) to improve multi-step forecasting accuracy. In [11], the authors proposed a VSTLF method that integrates k-means-based similar day clustering, EEMD, and long- and short-term time-series network. This work’s forecasting interval and horizon are 15 min and four hours, respectively. In [12], a hybrid model was proposed that combines variational mode decomposition (VMD) and LSTM with seasonal adjustment and error correction to address short-term load volatility. Junior et al. [13] proposed a hybrid machine learning approach combining Gradient Boosting Regression (GBR), XGBoost, k-Nearest Neighbors (k-NN), and SVR with signal decomposition techniques. The signal decomposition techniques use various seasonal and trend decomposition techniques such as loess, empirical mode decomposition, EEMD, complete ensemble empirical mode decomposition with adaptive noise, and empirical wavelet transform. Their model significantly improved VSTLF accuracy using real-world datasets from ONS and ISO-NE. However, these forecasting methods require high computational complexity in VSTLF and are also sensitive to noise. In addition, there is no standardized guideline to select the relevant decomposed components or to determine their effective combinations, resulting in inconsistent performance across datasets and heavy dependencies on empirical heuristics. Our previous work developed a VSTLF model using input features selected by Kendall’s tau correlation coefficient [14]. However, this model did not incorporate new input features, such as DALF results and load variation, to enhance accuracy.
Another approach to improve forecasting accuracy is a similar day selection method. Jiang et al. [15] proposed the neural-based similar days auto regression model, which enhances load forecasting interpretability using neural networks. This model selects similar days based on load profiles, temperature, humidity, wind speed, precipitation, day of the week, holiday indicator, and seasonal period. A short-term load forecasting method for holidays was proposed by modifying similar days’ load profiles based on differences in calendar, trend, weather, and behind-the-meter (BTM) photovoltaic (PV) factors [16]. Cheng et al. [17] proposed a short-term regional load forecasting method that selects similar days using random forest and a weighted eigenspace system. Then, this method applies VMD to decompose load signals and combines similar-day averaging with neural networks. In [18], the authors proposed an optimized day similarity metric that enhances short-term load forecasting accuracy. It selects the similar days using the particle swarm optimization algorithm. However, as the penetration of renewables increases, the electric load and external factors tend to have a nonlinear relationship. Therefore, finding good similar days using only historical calendar and meteorological data becomes a tricky problem.
To address the challenges of computational complexity and the nonlinearity between electric load and external factors, this paper proposes an XGBoost-based VSTLF model using DALF and load variation. The proposed model aims to forecast electric load for the next six hours at 15-min intervals. The proposed model effectively captures both the general trend and rapid fluctuations in electric load. In the case study, the proposed model is validated using real electric load data of the Korean power system and shows a good accuracy performance. The main contributions of this paper are summarized as follows:
- Because of the computational complexity, we use the XGBoost algorithm, which is an airy and fast machine learning algorithm. Also, it has a strong capability in modeling nonlinear relationships between input and output variables. This fast algorithm is suitable for the 15-minute-based VSTLF model.
- We use DALF results as input features of VSTLF to provide trend information that guides the model toward underlying load patterns. Because of the trend information, the proposed model produces a more robust result.
- To capture the rapid fluctuations of electric load, an additional input feature, i.e., load variation, is used. With this feature, the proposed model effectively learns the fluctuation patterns.
The remainder of this paper is structured as follows. Section 2 explains the techniques employed in this study. A detailed description of the proposed XGBoost-based VSTLF model is given in Section 3. Section 4 outlines the experimental setup and shows a comprehensive analysis of the proposed model, focusing on the effect of DALF and load variation. Finally, this work concludes in Section 5.
2. Background
This section briefly reviews the machine learning algorithms used in the proposed VSTLF framework, i.e., LSTM, XGBoost, and exponential smoothing algorithms. It also explains feature selection metrics, including Kendall’s tau correlation coefficient and XGBoost feature importance.
2.1. Forecasting Algorithms
Long Short-Term Memory (LSTM) [19]: It is one of the most famous RNN algorithms, which addresses the vanishing gradient problem in RNN. LSTM solves this problem by utilizing the cell state for long-term dependencies and employing input, forget, and output gates to regulate information update, retention, and discard, respectively. The overall LSTM cell architecture is shown in Figure 1. The definition of forget gate , input gate , and output gate at t are given as
where [], [], and [] denote the weight matrices [biases] of the forget, input, and output gates, respectively. Also, and stand for the input at t and the hidden state at , respectively. The forget gate regulates the proportion of information from the previous cell state to be retained. The input gate regulates how much of the new input is incorporated into the current cell state . The output gate controls which information from the cell state is emitted as the hidden state.
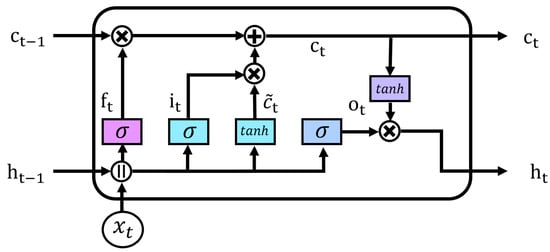
Figure 1.
LSTM cell architecture.
The current cell state and hidden state are obtained through the three gates. That is
where denotes the candidate cell state which is given as , where and are the weight matrices and bias of the cell state gate, respectively. The LSTM algorithm is used as the base model in the DALF stacking ensemble for the proposed VSTLF framework.
eXtreme Gradient Boosting (XGBoost) [20]: XGBoost is a tree-based machine learning algorithm that has evolved from the gradient boosting machine (GBM). It shows remarkable performance on regression and classification problems in diverse domains [21,22,23]. GBM trains multiple models sequentially, with the residuals of the previous model being trained in the next model to reduce the residuals. Although GBM shows strong predictive performance, its drawbacks are high computation time and a vulnerability to overfitting. XGBoost has been developed to address these limitations by incorporating parallel computation and overfitting control terms to the objective function.
The prediction function used in XGBoost is
where K, , , and denote the number of decision trees and k-th decision tree model, output variables, and input variables, respectively. The final prediction of XGBoost is obtained by aggregating the outputs of all decision tree models in XGBoost. The objective function of XGBoost is given as
where and represent the loss function and model complexity control function, respectively. The model complexity control function is formally defined as
where T is number of branches, w is vector score of each node, and and are penalty terms for model complexity. These terms prevent overfitting by regulating model complexity.
XGBoost uses a sequential training strategy, in which new models are incrementally added by learning from the residuals of previously trained models. The objective function at the r-th iteration , which is used in the training process of the decision tree, is defined as
where represents the prediction made by the ensemble of decision trees up to iteration .
To obtain a differentiable form of the objective function, Equation (9) is approximated by a second-order Taylor expansion as
where and denote the first and second derivatives of the loss function with respect to the prediction, respectively. Then, the optimal vector score in j-th leaf node, is obtained by . The optimal objective function value is obtained by substituting into Equation (10). As a result, and at the r-th iteration are
where , denote the sum of and in j-th leaf node, respectively.
Exponential smoothing (EXP) [24]: This is not a machine learning algorithm, but a time series-based statistical algorithm. EXP recursively updates the level by assigning exponentially greater weight to recent observations while exponentially diminishing the influence of older values. Its simple structure requires only minimal parameters, resulting in efficient computation and rapid adaptation. EXP also facilitates interpreting relationships with external factors from a statistical perspective.
The exponential smoothing calculation is shown as
where , , and denote the forecasting value at , the observation at t, and the smoothing parameter in [0,1], respectively. The EXP algorithm is used as the base model in the DALF stacking ensemble of the proposed VSTLF framework.
2.2. Feature Selection Metrics
Kendall’s Tau Correlation Coefficient [25]: This is a non-parametric statistical measure that evaluates the ordinal association between two variables. Unlike the Pearson correlation coefficient, Kendall’s tau correlation coefficient is capable of capturing non-linear relationships as well. It quantifies the degree of concordance in rank ordering between the variables and is defined as
where denotes the number of concordant pairs of observations in which the rankings of the two variables agree, and and n represent the number of discordant pairs and the total number of observations, respectively. The values of Kendall’s tau correlation coefficient range from −1 to 1. If the value is close to 1 [−1], it means a strong positive [negative] correlation, and if the value is close to 0, there is not much association between the two variables.
Feature Importance (FI) [26]: FI evaluates the association between two variables by measuring the reduction in the loss function in each split for the decision trees. FI analysis in XGBoost can be used to eliminate features with low relevance to the target variable. The FI score for a given feature is defined by (15).
where denotes the set of nodes in XGBoost decision trees using feature and represents the change in the objective function due to the j-th split involving . Accordingly, FI score indicates the degree to which the feature contributes to explaining the output variable. The loss reduction at each split is expressed as
where the subscripts L, R, P represent the loss reductions associated with the left child node, right child node, and the parent node before the split, respectively.
3. XGBoost-Based Very Short-Term Load Forecasting
This section describes the proposed XGBoost-based VSTLF model using DALF and load variation. The proposed model employs DALF to provide trend information on electric load over the forecasting horizon. This trend information allows the VSTLF model to capture complex load patterns effectively. However, the trend information is not enough to capture the sudden variation in load because load variation is becoming increasingly severe due to the growing presence of renewables and newly installed loads. To capture this variation, we propose to use load variations as additional residual information. These two features enable the model to learn both overall trends and fluctuations in load.
Figure 2 shows the overall flow of the proposed framework. At first, we gather all the relevant data to forecast electric load and preprocess the gathered data (Section 3.1). The proposed XGBoost-based VSTLF model selects proper input features using Kendall’s tau correlation and FI analysis (Section 3.2). The selected features and DALF result are used as the final input features to the VSTLF model (Section 3.3).
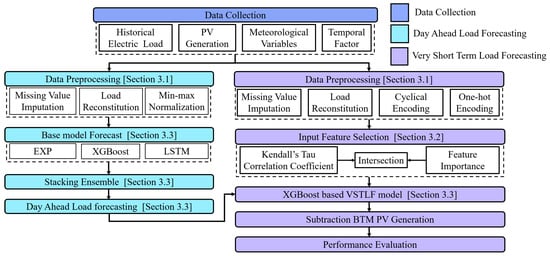
Figure 2.
Overall flow chart of the proposed VSTLF framework.
3.1. Data Preprocessing
We perform three data preprocessing schemes for the proposed VSTFL model, i.e., load reconstitution, normalization, and temporal feature preprocessing.
Load Reconstitution Method: Because of the uncertainty caused by the weather, the accuracy of electric load forecasting decreases. Moreover, BTM PV generation is not monitored in real time, so the accuracy performance is reduced further. To solve this issue, the load reconstitution method has been proposed to improve load forecasting accuracy [27,28].
Figure 3 shows the process of the load reconstitution method. This method consists of the following three steps:
- Step 1: The reconstituted load is defined by adding the estimated BTM PV generation to the historical electric load.
- Step 2: Load forecasting is performed using the reconstituted load data.
- Step 3: The final electric load forecasting is derived by subtracting the forecasted BTM PV generation from the forecasted load in Step 2.
This load reconstitution method shows a good forecasting performance because the reconstituted load removes the uncertainty raised by BTM PV generation. Therefore, in this work, the load reconstitution method is applied to mitigate the impact of BTM PV generation on VSTLF.
Normalization: Min-max normalization is applied to all input features, including electric load and meteorological variables in DALF, to ensure balanced information. Let x and represent an input value and its normalized value. Then, the min–max normalization is formally defined as
where and are the minimum and maximum values from the dataset, respectively. Note that min–max normalization is not omitted for VSTLF, because the main forecasting algorithm, XGBoost, is a tree-based model and inherently does not need feature scaling.
Preprocessing for Temporal Feature: Temporal features such as day-of-week and time-of-day require appropriate preprocessing due to their categorical nature. In this work, day-of-week is encoded using one-hot encoding to preserve the independence of each weekday and avoid ordinal bias. It is defined as where D, , and R denote the day of the week (DoW) on the forecasting day, the DoW clusters, and the number of DoW clusters, respectively. The DoW cluster denotes a group of days of the week that shows similar load characteristics. If the D is in a DoW cluster r, . Otherwise, .
Time-of-day is transformed using sine and cosine functions to reflect its periodic characteristic, i.e., cyclical encoding. That is
where t, P, and W denote forecasting execution time, the total number of time steps per day, and the window size, which corresponds to the forecasting horizon of VSTLF, respectively. Specifically, represents the preprocessed time-of-day feature corresponding to forecasting day D and forecasting execution time t.
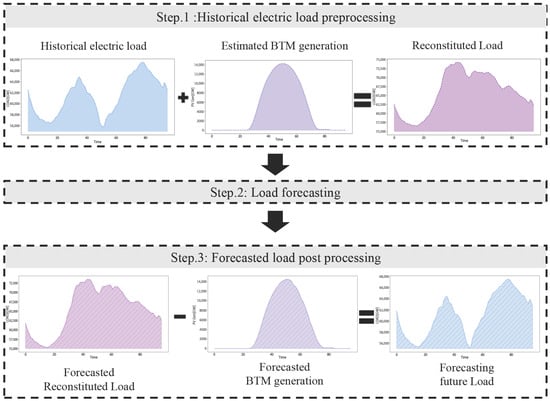
Figure 3.
Process of the load reconstitution method.
3.2. Input Feature Selection Using Kendall’s Tau Correlation Coefficient and Feature Importance
Because various external factors influence electric load, input features commonly used in load forecasting models include meteorological variables and historical load. A negative impact on forecasting accuracy may result from including some features with low electric load correlation. Therefore, selecting features is essential to improve forecasting performance. To this end, we analyze the nonlinear relationships between electric load and potential features using Kendall’s tau correlation coefficient and the FI score. Additionally, the temporal dependency of electric load is assessed through autocorrelation analysis, which complements the insights obtained from Kendall’s tau and FI. Based on this analysis, features with low correlation to electric load are excluded from the input feature. The process of selecting input variables is shown in Figure 4. We introduce a threshold value to filter the low correlation features for Kendall’s tau correlation coefficient and the FI score. The final input features are obtained by the intersection of the two outputs. The intersection is required to ensure the selected feature possesses a meaningful correlation with both metrics.
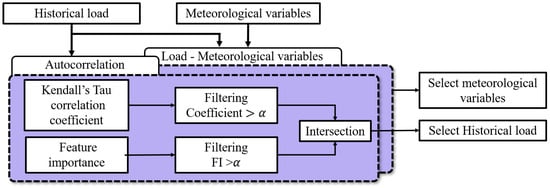
Figure 4.
Process of input feature selection.
3.3. Incorporating DALF Result and Load Variation
To improve forecasting accuracy, this work utilizes two processed values alongside the raw historical load and meteorological variables.
DALF Result for Trend Information: Previous load forecasting research primarily utilized calendar and weather features to identify similar days and integrate their load patterns as trend information. Due to the increasing integration of renewables, however, electric load for VSTLF is characterized by high volatility and rapid fluctuations. To enhance VSTLF accuracy, this study incorporates the DALF result as an input feature, which provides representative trend information.
Our work does not focus on building an accurate DALF model. Rather, we adopt an ensemble-based DALF model, which integrates three existing forecasting models, called DALF base models: EXP [29], XGBoost [27], and the LSTM model [30]. Each of the three models forecasts one day-ahead load, and their outputs are then ensembled via a stacking ensemble method [31].
Figure 5 shows the DALF procedure. Here, , , and represent the electric load, meteorological, and calendar variables, respectively. The three DALF base models use , , and from the past three days as input features, in addition to the and of Day D. The final forecast is generated through a stacking ensemble that combines the base models’ outputs with the target day’s information.
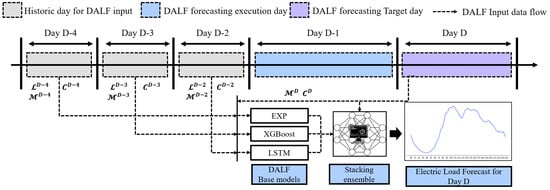
Figure 5.
DALF procedure as trend information for VSTLF.
Load Variation for Residual Information: The proposed VSTLF model also incorporates the variation of historical load to provide residual information that the DALF does not capture. The load variation is defined as
where represents the load observed at t on D − 1. To account for time-specific load variability, the proposed model calculates 15-minute load variations over a forecasting window of size W, drawing data from each corresponding historical time point. Figure 6 shows the meaning of load variation. The load variation is calculated using the previous day (D − 1) before the VSTLF forecasting execution day, corresponding to the same forecasting time horizon.
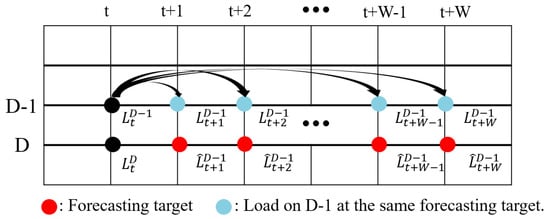
Figure 6.
An example of load variation calculation.
Figure 7 shows the overall flow of the proposed method. Here, , , and denote the set of day-ahead load forecasting with sliding window, the selected meteorological variables, and historical load, respectively. Also, represent the forecasted load over a window of size. The proposed VSTLF model follows a three-step procedure.
- Day-Ahead Load Forecasting (DALF): The DALF model is executed once on Day to generate the expected load pattern for Day D, i.e., the VSTLF execution day.
- VSTLF with DALF and Load Variation: For each VSTLF execution at t on D, the model outputs the future load by incorporating DALF result , load variation , historical loads , meteorological variables, and temporal factor , .
- Sliding Window Based VSTLF Execution: Using the constructed input, the model forecasts the next six hours of loads at 15-minute intervals. To achieve this, the sliding window size W is set to (hours) (15 min per hour). Accordingly, the VSTLF model runs every 15 min throughout the day, producing 96 forecasts daily.
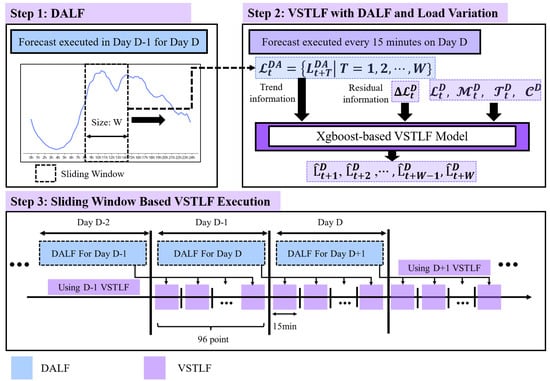
Figure 7.
Workflow of the proposed VSTLF model, integrating DALF with load variation.
4. Case Study
This section evaluates the VSTLF model’s performance, focusing on the mean and distribution of forecasting accuracy. All computations were performed on a system equipped with an Intel i7-14700F CPU, 32 GB RAM, and an NVIDIA GeForce RTX 3090 GPU.
4.1. Data Description
To evaluate the proposed VSTLF model, we use real electric load data and estimated BTM PV generation data provided by the Korea Power Exchange (KPX), the independent system operator (ISO) for the Korean power system. Both the load and BTM PV generation data were collected at 15-minute intervals from 2021 to 2023. The meteorological data used in case study include temperature (TA), humidity (HM), cloud cover (CATOT), wind speed (WS), solar irradiation (SI), and precipitation (PR) for the same periods as the electric load data.
Figure 8 and Figure 9 show the characteristics of the load in 2022, including seasonal, weekly, and hourly variations. As depicted in Figure 8a, the seasonal load pattern is a direct consequence of heating and cooling needs that vary with temperature. Loads in summer and winter are typically higher than those in spring and fall due to heating and cooling electricity demands. On the other hand, in spring and fall, loads remain relatively consistent despite temperature fluctuations as heating and cooling demand is inactive during these seasons. The analysis of the load–temperature relationship in Figure 8b clearly indicates that load sensitivity to temperature is lower during spring and autumn than during summer and winter. Figure 9a shows daily load patterns in a week. Due to the significant impact of industrial loads in Korea, weekday loads are generally higher than weekend loads. For the same reason, weekend loads are lower and show different patterns compared to weekdays. Monday early morning loads are typically lower than other weekdays due to the residual effect of reduced Sunday loads. Based on these observations, the days of the week are categorized into four groups—Monday, weekdays (Tuesday through Friday), Saturday, and Sunday; thus, we set the number of DoW clusters R to four. The categorization of days into four groups is a typical approach in the Korean power system [27,30,32]. Figure 9b shows the hourly distribution of load. During working hours (8 h–18 h), the load is typically larger and more volatile, increasing forecasting uncertainty.

Figure 8.
Yearly characteristics of load and temperature.

Figure 9.
Characteristic analysis on daily load.
4.2. Evaluation Metrics and Hyperparameter Tuning
To evaluate the accuracy performance of the proposed model, two metrics, Mean Absolute Percentage Error (MAPE) and Root Mean Square Error (RMSE), are employed. They are defined as
where , , and n denote the actual load, the predicted load, and the total number of data samples, respectively.
We configure the XGBoost-based VSTLF model through the careful selection of three key hyperparameters: max depth, subsample, and min child weight. The hyperparameters were determined using a sliding window cross-validation method [33], which preserves the temporal order of time series data by separating training and validation sets. In addition, this approach improves the generalization capability of the proposed model by repeatedly evaluating model performance over multiple sliding intervals. An annual prediction for 2022 was conducted using the sliding window cross-validation method, and the hyperparameter combination yielding the lowest average RMSE over the year was selected as the best-performing set. To avoid overfitting, we employed an early stopping technique based on the validation root mean square error (RMSE). For this process, the training and validation sets were derived from one year of historical data immediately preceding the forecasting date, with a 9:1 split ratio. The detailed hyperparameter configurations used in the case study are summarized in Table 1.

Table 1.
Hyperparameter configuration of the XGBoost-based VSTLF model.
4.3. Input Feature Selection Result
This section shows the results of Kendall’s tau correlation coefficient and the FI score for feature selection. Focusing on typical weekdays in 2022, the analysis explores the relationships between the target load and two key influencing factors: meteorological variables and historical load. Because the proposed model employs the load reconstitution method, the analysis is based on the reconstituted load, which aggregates the BTM PV generation and the electric load.
The results of the correlation analysis are shown in Figure 10 and Figure 11. Figure 10a and Figure 10b, respectively, present the FI score and Kendall’s tau correlation coefficient between the historical load during the six hours preceding the forecasting time and the target load over the subsequent six hours. Both the FI score and Kendall’s tau correlation coefficient consistently show the load 15 min before the forecasting execution time to have the strongest correlation with the upcoming six-hour load, i.e., FI score = 0.71 and Kendall’s tau correlation coefficient = 0.59. Unlike the FI score, the Kendall’s tau correlation coefficient exhibits a gradual decline with increasing time lag from the forecasting execution point.

Figure 10.
Correlation analysis result between the target load and historical load.

Figure 11.
Correlation analysis result between the target load and the meteorological variables.
Figure 11a,b show the correlation between meteorological variables and electric load. In both analyses, temperature is consistently identified as the meteorological variable with the strongest correlation to the reconstituted load, with an FI score of 0.88 and a Kendall’s tau correlation coefficient of 0.54. Solar irradiance, however, shows a weak correlation with the reconstituted load. These results indicate that the effect of BTM PV generation has been effectively mitigated in the reconstituted load.
We choose the filtering threshold as 0.5 because the features to select should have meaningful correlation results for both Kendall’s tau correlation coefficient and the FI score. The final input features were selected by intersecting features that satisfied both the FI and Kendall’s tau correlation thresholds. These features include the load measured 15 min before the forecasting execution time and temperature.
4.4. Performance Evaluation
This section evaluates the proposed XGBoost-based VSTLF model using DALF and load variation. Table 2 shows VSTLF accuracy results using DALF result and load variation . The DALF result is obtained by a stacking ensemble model that integrates three base models: EXP(DA-EXP), XGBoost(DA-XGB), and LSTM(DA-LSTM) as presented in Section 3.3. Both features contribute to improved accuracy individually, but the VSTLF model performs best when both are employed. These results indicate that both and serve as informative features for modeling the intricate characteristics of very short-term load patterns, thereby enhancing the model’s ability to anticipate rapid fluctuations in load.

Table 2.
Evaluation of and for MAPE (%) of VSTLF.
Table 3 shows the 6-hour-ahead forecasting performance for 2022 and 2023, comparing the proposed model with several benchmark models in terms of MAPE (%), RMSE (MW), and maximum MAPE (%). As a benchmark, the Kalman filter-based VSTLF (KF) model, currently employed by KPX, is included for comparison [34]. Other VSTLF models that incorporate separately generated by EXP, XGB, and LSTM are considered for an additional benchmark model. The proposed model (DA-ENB) shows the best performance, i.e., a MAPE of 0.94 % and an RMSE of 869.73 MW. In 2023, the DA-LSTM model shows slightly smaller MAPE (0.95 %) and RMSE (891.92 MW) than the ensemble-based proposed model, which has a MAPE of 0.97 % and RMSE of 898.32 MW. However, the performance difference is only marginal. Also, the proposed model shows a better performance in maximum MAPE of 16.04 % compared to other models.

Table 3.
Comparison of MAPE (%) and RMSE (MW) between benchmark models and the proposed model.
Figure 12 further shows the distribution of forecasting errors for each model. XGBoost models utilizing various DALF results show a lower mean and narrower error distribution than the Kalman filter-based VSTLF model. These findings confirm that consistently contributes to robust forecasting performance.
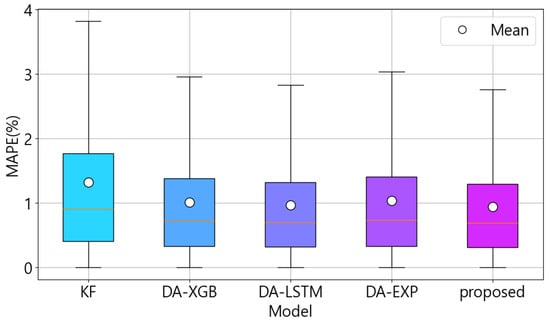
Figure 12.
Error distribution of VSTLF models.
Table 4 and Table 5 present the MAPE and standard deviation (SD) of the DALF and the corresponding VSTLF models, respectively. In Table 5, “w/o DALF” means a VSTLF model that does not use the DALF result, while the other models use corresponding DALF models. In Table 4, the ENB model shows the smallest DALF error with a MAPE of 1.32% and an SD of 1.21%. Similarly, in Table 5, the DA-ENB model achieves the smallest VSTLF error with a MAPE of 0.94% and an SD of 0.89%. However, “w/o DALF” shows smaller MAPE and SD than DA-EXP, DA-LSTM, and DA-XGB. This observation indicates that providing more accurate trend information from DALF contributes to higher accuracy and robustness in VSTLF.

Table 4.
DALF error distributions in terms of MAPE (%) and SD (%).

Table 5.
VSTLF error distributions in terms of MAPE (%) and SD (%).
Figure 13 shows the relationship between DALF error of ENB (x-axis) and VSTLF errors of DA-ENB and “w/o DALF” (y-axis). The solid line and shaded area represent the mean and the 25–75% quantile band, respectively. The results exhibit a clear upward trend, indicating that larger DALF errors are associated with larger VSTLF errors. This observation further supports the conclusion that providing more accurate trend information from DALF contributes to better accuracy and robustness in VSTLF.
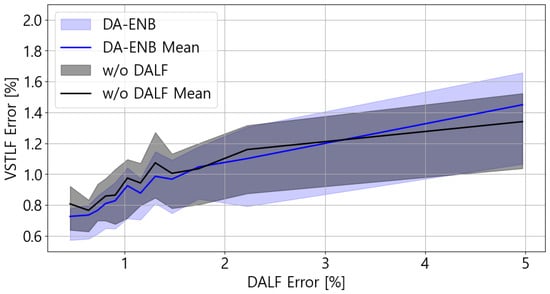
Figure 13.
Relationship between DALF error and VSTLF error.
Figure 14 shows the average 6-hour MAPE across different forecasting execution times of each model. VSTLF models using DALF results, including the proposed model, achieve notable improvements over the KF-based model, particularly during daytime hours when load variability is higher. These daytime hours are characterized by greater volatility in electric load due to industrial activity and BTM PV generation. The use of DALF results enables VSTLF models to capture these fluctuations efficiently.

Figure 14.
Error of VSTLF models at each forecasting execution time.
Table 6 shows the MAPE of VSTLF on days with abrupt PV generation changes in cloudy and sunny days. Figure 15 illustrates the PV generation patterns on these days. In both cases, an abrupt decrease in PV generation is observed during the afternoon period. Even these conditions, the proposed model shows the best forecasting accuracy compared with the benchmark models.

Table 6.
MAPE (%) of VSTLF under abrupt PV generation changes.

Figure 15.
Cloudy and sunny day PV generation patterns with abrupt changes.
Table 7 shows the MAPE of VSTLF on days with maximum and minimum temperatures during 2022 and 2023. Under these extreme temperature conditions, the proposed model achieves competitive forecasting accuracy compared with the benchmark models.

Table 7.
MAPE (%) of VSTLF under maximum and minimum temperatures (°C).
We also investigated the execution times of the algorithms. The proposed XGBoost model forecasts the result in approximately eight seconds, while deep learning models such as DNN and LSTM take more than four minutes. In Korea, VSTLF is performed at 15-min intervals, whereas PJM Interconnection (PJM) utilizes a 5-min forecasting frequency. Therefore, one of the important requirements for VSTLF is its execution time. The proposed XGBoost model’s rapid execution ensures it meets real-time requirements.
5. Conclusions
As the penetration of renewable energy sources increases in power systems, the uncertainty in load forecasting has become more significant. This challenge thus emphasizes the importance of very short-term load forecasting (VSTLF), whose more accurate and responsive forecasts are crucial for coping with rapid load fluctuations. This study proposes an XGBoost-based VSTLF model that employs day-ahead load forecasting (DALF) results and load variation as input features. The DALF model gives a general trend of the daily load pattern. It is constructed using a stacking ensemble of three base models: exponential smoothing (EXP), XGBoost, and long short-term memory (LSTM). Load variation offers residual information that complements trend data, proving crucial for models aiming to capture electric load volatility accurately and account for its fluctuations. We conducted a case study using real-world data from the Korean power system provided by Korea Power Exchange (KPX) for the years 2022 and 2023. The proposed model achieves a notable enhancement in forecasting accuracy compared with the KF benchmark model, yielding a reduction in MAPE from 1.31% to 0.94% and a decrease in RMSE from 1239.37 MW to 869.73 MW. It is confirmed that the proposed model can effectively handle the increasing variability caused by renewable generation by using the DALF result and load variation. Additionally, the results demonstrated improved robustness during high-variability periods, such as daytime hours. The proposed model is expected to contribute to a more stable power system and real-time market operation.
Although the proposed VSTLF model achieves competitive results, it also has certain limitations. To address these, our future work could focus on two directions. First, since the current model performance is affected by the prediction errors of the DALF model, future research will focus on developing VSTLF models that, while leveraging DALF for trend information, are less susceptible to its prediction errors, thereby improving robustness against trend estimation uncertainty. Second, to investigate the model’s generalizability, future work could apply the proposed model to power systems with diverse load profiles and renewable penetration levels.
Author Contributions
Software, K.-M.S. and S.-M.C.; Investigation, K.-M.S.; Writing—original draft, K.-M.S.; Writing—review & editing, K.-M.S., T.-G.K., K.-B.S. and S.-G.Y.; Supervision, S.-G.Y. All authors have read and agreed to the published version of the manuscript.
Funding
This research was funded by Korea Institute of Energy Technology Evaluation and Planning (KETEP) grant number RS-2024-00398166.
Data Availability Statement
The 15 min resolution load dataset and the source code developed for this study are not publicly available due to Korea Power Exchange (KPX) data-handling policies. Requests for access to the original dataset should be directed to KPX. A publicly accessible 1 h KPX load dataset is available at https://www.data.go.kr/data/15065266/fileData.do (accessed on 6 August 2025). Meteorological data were retrieved via the Korea Meteorological Administration API at https://apihub.kma.go.kr/ (accessed on 6 August 2025). Both websites are primarily provided in Korean.
Conflicts of Interest
The authors declare no conflicts of interest.
References
- Baur, L.; Ditschuneit, K.; Schambach, M.; Kaymakci, C.; Wollmann, T.; Sauer, A. Explainability and interpretability in electric load forecasting using machine learning techniques—A review. Energy AI 2024, 16, 100358. [Google Scholar] [CrossRef]
- Al Madani, M.R. Very Short-Term Load Forecast (VSTLF) Formulation for Network Control Systems: A Comprehensive Evaluation of Existing Algorithms for VSTLF; Mälardalen University: Västerås, Sweden, 2024. [Google Scholar]
- Zhao, X.; Li, Q.; Xue, W.; Zhao, Y.; Zhao, H.; Guo, S. Research on ultra-short-term load forecasting based on real-time electricity price and window-based XGBoost model. Energies 2022, 15, 7367. [Google Scholar] [CrossRef]
- Zhang, L.; Jánošík, D. Enhanced short-term load forecasting with hybrid machine learning models: CatBoost and XGBoost approaches. Expert Syst. Appl. 2024, 241, 122686. [Google Scholar] [CrossRef]
- Fan, G.F.; Yu, M.; Dong, S.Q.; Yeh, Y.H.; Hong, W.C. Forecasting short-term electricity load using hybrid support vector regression with grey catastrophe and random forest modeling. Util. Policy 2021, 73, 101294. [Google Scholar] [CrossRef]
- Tong, C.; Zhang, L.; Li, H.; Ding, Y. Temporal inception convolutional network based on multi-head attention for ultra-short-term load forecasting. IET Gener. Transm. Distrib. 2022, 16, 1680–1696. [Google Scholar] [CrossRef]
- Gou, Y.; Guo, C.; Qin, R. Ultra short term power load forecasting based on the fusion of Seq2Seq BiLSTM and multi head attention mechanism. PLoS ONE 2024, 19, e0299632. [Google Scholar] [CrossRef]
- Li, X.; Huang, Y.; Shi, Y. Ultra-short term power load prediction based on gated cycle neural network and XGBoost models. J. Phys. Conf. Ser. 2021, 2026, 012022. [Google Scholar] [CrossRef]
- Yang, Z.; Li, J.; Wang, H.; Liu, C. An informer model for very short-term power load forecasting. Energies 2025, 18, 1150. [Google Scholar] [CrossRef]
- Yang, F.; Fu, X.; Yang, Q.; Chu, Z. Decomposition strategy and attention-based long short-term memory network for multi-step ultra-short-term agricultural power load forecasting. Expert Syst. Appl. 2024, 238, 122226. [Google Scholar] [CrossRef]
- Zeng, W.; Li, J.; Sun, C.; Cao, L.; Tang, X.; Shu, S.; Zheng, J. Ultra short-term power load forecasting based on similar day clustering and ensemble empirical mode decomposition. Energies 2023, 16, 1989. [Google Scholar] [CrossRef]
- Lv, L.; Wu, Z.; Zhang, J.; Zhang, L.; Tan, Z.; Tian, Z. A VMD and LSTM based hybrid model of load forecasting for power grid security. IEEE Trans. Ind. Inform. 2021, 18, 6474–6482. [Google Scholar] [CrossRef]
- Junior, M.Y.; Freire, R.Z.; Seman, L.O.; Stefenon, S.F.; Mariani, V.C.; dos Santos Coelho, L. Optimized hybrid ensemble learning approaches applied to very short-term load forecasting. Int. J. Electr. Power Energy Syst. 2024, 155, 109579. [Google Scholar]
- Song, K.M.; Kim, T.G.; Song, K.B.; Son, H.G.; Song, M.H.; Yoon, S.G. Correlation analysis-based input feature selection for very short-term load forecasting. In Proceedings of the International Conference on Advanced Power System Automation and Protection (APAP), Jeju, Republic of Korea, 20–23 October 2025. To appear. [Google Scholar]
- Jiang, Z.; Zhang, L.; Ji, T. NSDAR: A neural network-based model for similar day screening and electric load forecasting. Appl. Energy 2023, 349, 121647. [Google Scholar] [CrossRef]
- Son, J.; Cha, J.; Kim, H.; Wi, Y.M. Day-ahead short-term load forecasting for holidays based on modification of similar days’ load profiles. IEEE Access 2022, 10, 17864–17880. [Google Scholar] [CrossRef]
- Cheng, Q.; Shi, J.; Cheng, S. Short-Term Load Forecasting Based on Similar Day Theory and BWO-VMD. Energies 2025, 18, 2358. [Google Scholar] [CrossRef]
- Janković, Z.; Selakov, A.; Bekut, D.; Đorđević, M. Day similarity metric model for short-term load forecasting supported by PSO and artificial neural network. Electr. Eng. 2021, 103, 2973–2988. [Google Scholar] [CrossRef]
- Hochreiter, S.; Schmidhuber, J. Long short-term memory. Neural Comput. 1997, 9, 1735–1780. [Google Scholar] [CrossRef]
- Chen, T.; Guestrin, C. Xgboost: A scalable tree boosting system. In Proceedings of the 22nd ACM SIGKDD International Conference on Knowledge Discovery and Data Mining, San Francisco, CA, USA, 13–17 August 2016; pp. 785–794. [Google Scholar]
- Qi, Z.; Feng, Y.; Wang, S.; Li, C. Enhancing hydropower generation Predictions: A comprehensive study of XGBoost and Support Vector Regression models with advanced optimization techniques. Ain Shams Eng. J. 2025, 16, 103206. [Google Scholar] [CrossRef]
- Wang, T.; Bian, Y.; Zhang, Y.; Hou, X. Classification of earthquakes, explosions and mining-induced earthquakes based on XGBoost algorithm. Comput. Geosci. 2023, 170, 105242. [Google Scholar] [CrossRef]
- Shahani, N.M.; Zheng, X.; Liu, C.; Hassan, F.U.; Li, P. Developing an XGBoost regression model for predicting young’s modulus of intact sedimentary rocks for the stability of surface and subsurface structures. Front. Earth Sci. 2021, 9, 761990. [Google Scholar] [CrossRef]
- Gardner, E.S., Jr. Exponential smoothing: The state of the art. J. Forecast. 1985, 4, 1–28. [Google Scholar] [CrossRef]
- Sen, P.K. Estimates of the regression coefficient based on Kendall’s tau. J. Am. Stat. Assoc. 1968, 63, 1379–1389. [Google Scholar] [CrossRef]
- Kim, D.; Lee, D.; Joo, S.K.; Wi, Y.M. Medium-Term Minimum Demand Forecasting Based on the Parallel LSTM-MLP Model. IEEE Access 2024, 12, 195319–195331. [Google Scholar] [CrossRef]
- Bae, D.J.; Kwon, B.S.; Song, K.B. XGBoost-based day-ahead load forecasting algorithm considering behind-the-meter solar PV generation. Energies 2021, 15, 128. [Google Scholar] [CrossRef]
- Stratman, A.; Hong, T.; Yi, M.; Zhao, D. Net Load Forecasting With Disaggregated Behind-the-Meter PV Generation. IEEE Trans. Ind. Appl. 2023, 59, 5341–5351. [Google Scholar] [CrossRef]
- Cho, S.M.; Kim, K.H.; Kim, T.G.; Yoon, S.G.; Song, K.B. Day-Ahead load Forecasting Algorithm in Spring Using Daily Temperature Sensitivity and Weights in Exponential Smoothing. J. Korean Inst. Illum. Electr. Install. Eng. 2025, 39, 128–135. [Google Scholar]
- Kwon, B.S.; Park, R.J.; Song, K.B. Short-term load forecasting based on deep neural networks using LSTM layer. J. Electr. Eng. Technol. 2020, 15, 1501–1509. [Google Scholar] [CrossRef]
- Kwon, B.S. Short-Term Load Forecasting Algorithm Blending of Statistical Method and Machine Learning. Ph.D. Thesis, Soongsil University, Seoul, Republic of Korea, 2022. [Google Scholar]
- Acquah, M.A.; Jin, Y.; Oh, B.C.; Son, Y.G.; Kim, S.Y. Spatiotemporal sequence-to-sequence clustering for electric load forecasting. IEEE Access 2023, 11, 5850–5863. [Google Scholar] [CrossRef]
- Aguilar Madrid, E.; Antonio, N. Short-term electricity load forecasting with machine learning. Information 2021, 12, 50. [Google Scholar] [CrossRef]
- Park, H.S. Development of Real-Time Load Forecasting Techniques and Online Load Forecasting Strategies; Technical report; Korea Power Exchange: Seoul, Republic of Korea, 2015. [Google Scholar]
Disclaimer/Publisher’s Note: The statements, opinions and data contained in all publications are solely those of the individual author(s) and contributor(s) and not of MDPI and/or the editor(s). MDPI and/or the editor(s) disclaim responsibility for any injury to people or property resulting from any ideas, methods, instructions or products referred to in the content. |
© 2025 by the authors. Licensee MDPI, Basel, Switzerland. This article is an open access article distributed under the terms and conditions of the Creative Commons Attribution (CC BY) license (https://creativecommons.org/licenses/by/4.0/).