Abstract
With the continuous increase in the proportion of distributed energy output in the distribution network and the limited equipment on the management side of the active distribution network, it is very important to give full play to the regulating role of the dispatchable potential of large-scale electric vehicles for the economic operation of the distribution network. To deal with this issue, this paper proposes an optimal dispatching model of the distribution network considering the combination of the dispatchable potential of electric vehicle clusters and demand response. Firstly, the active distribution network dispatching model with the demand response is introduced, and the equipment involved in the active distribution network dispatching is modeled. Secondly, the bidirectional long short-term memory network algorithm is used to process the historical data of electric vehicles to reduce the uncertainty of the model. Then, the shared energy-storage characteristics based on the dispatchable potential of electric vehicle clusters are fully explored and the effect of peak shaving and valley filling after the demand response is fully explored. This approach significantly reduces the network loss and operating cost of the active distribution network. Finally, the modified IEEE-33 bus test system is utilized for test analysis in the case analysis, and the test results show that the established active distribution network model can reduce the early construction cost of the system’s energy-storage equipment, improve the energy-utilization efficiency, and realize the economic operation of the active distribution network.
1. Introduction
With the continuous development of distributed generation (DG), the proportion of its participation in the active distribution network (ADN) as the power supply side is increasing, and the gradual increase in ADN power consumption leads to the increasing peak-to-valley difference in load at each node. At the same time, the uncertainty of DG output and the fluctuating changes of each node increase the risk and challenge of ADN optimization scheduling. The potential risks can be minimized by forecasting the output of DGs, and ADNs can incorporate the demand response (DR) and electric vehicle (EV) as regulation measures to reduce their own energy consumption risks [,,]. Therefore, the problem of considering DR and EV addition for AND optimal scheduling deserves further study.
DG is characterized by non-pollution, as well as flexible inputs, and has been widely used in ADN in recent years. Since the output of DG is affected by various factors, such as the geography and climate, it has strong uncertainty [,,]. More scholars have been working on the ADN planning problem with DG [,]. Literature [] establishes a distribution robust optimization model based on deep learning to deal with the uncertainty of DG output. In the literature [], a novel multi-agent collaborative reinforcement learning algorithm is proposed with automatic optimization, namely Dyna-DQL, to quickly achieve an optimal coordination solution for the multi-area distributed power grids. Literature [] deals with the reactive power planning problem under large-scale DG through dynamic voltage regulation using SVG equipment; literature [] analyzes the correlation between wind turbines and photovoltaic equipment, and a two-layer opportunity constraint model is established with the optimal tidal current as the optimization objective. However, it is worth noting that most of the above existing studies focus on the study of scheduling methods, ignoring the role of the DR and EV in smoothing DG.
The participation of the DR and EV in ADN economic scheduling has been explored in the literature. Literature [] dissected the correlation between DG access nodes and studied the optimal scheduling of users considering DR. Literature [] proposed an optimization model containing EV regulation and a DR potential assessment, which solved the ADN overload problem. Literature [] proposed an EV model under willingness-based dynamic adjustment of the DR, which effectively smoothed the fluctuation of new energy unit output in the ADN. Literature [] investigated a distributed photovoltaic and EV access to the distribution network model, which effectively reduced the load volatility of the ADN. Literature [] introduced the DR and solved it using the target cascade method, which effectively reduced the operating cost of the ADN. Literature [] investigated the impact of EV integration on the system and the optimization method of the distribution network. However, the aforementioned literature has only taken into account the charging and discharging effects of individual EVs. Individual EVs are prone to large errors due to the uncertainty of the charging and discharging time and the state of charge (SOC) when they arrive at the charging station, which in turn affects the optimal scheduling process of the ADN.
Most of the existing literature only considers the location of DG access and the simple impact on the ADN system after access and does not analyze it in depth. In addition, as to how to weaken the impact of DGs, existing literature mainly deals with it by adding energy storage as a scheme and does not deal with it from the uncertainty of the DGs’ own output. Meanwhile, EV, as an emerging energy-using unit, can also play the role in mobile energy storage, which can maximize the flexibility and reduce the cost compared with the traditional energy-storage components. In recent years, with the innovation and upgrading of vehicle-network interconnection technology, as well as the increasing number of EVs, it has become a feasible solution by scheduling the energy-storage characteristics of EVs. Literature [] establishes the peak-frequency-regulation-control strategy of the ADN and establishes the EV cluster dispatchable potential model for control. Literature [] fully exploits the EV cluster dispatchable potential and reduces the operation cost of the system by establishing the charging station bidding model. Literature [] regards the EV cluster dispatchable potential model as a gaming process of the energy storage devices participating in the ADN. However, most of the above-mentioned literature ignores the processing procedure of EV data and does not consider the influence of data uncertainty when analyzing the schedulable potential of EV clusters.
Recent studies primarily estimate electric vehicle charging demands through discrete choice models and numerical simulations. For instance, reference [] integrates a Mixed Logit discrete choice model with travel chain simulation to predict the city-level spatiotemporal distribution of EV charging demands, validating the approach using empirical traffic data from Turin to quantify behavioral variations across residential, workplace, and commercial zones. Reference [] proposes a tripartite coordination mechanism, combining data-driven modeling, DRL-based real-time decision-making, and dynamic menu incentives, to enhance the charging-demand-determination accuracy. However, these studies exhibit a limited focus on comprehensively integrating economic impacts, such as grid operational cost dynamics and end-user economic tradeoffs, despite incorporating incentive mechanisms like dynamic pricing menus.
Therefore, in order to adapt to the economic scheduling requirements of ADNs containing a high percentage of DGs, this paper firstly establishes an ADN scheduling model containing the DR. Secondly, the data of EVs are analyzed using the Convolutional Neural Network-Bidirectional Long Short-Term Memory (CNN-Bi-LSTM) algorithm. Compared to alternative approaches such as Graph Neural Networks (GNNs) and spatiotemporal Transformers, CNN-BiLSTM demonstrates the superior bidirectional capture of charging/discharging history, reduced prediction errors under contingency events, and lower scheduling latency. Following EV data analysis, a DR model is developed to participate in the scheduling process of ADNs together with the model of the schedulable potentials of the EV clusters. Finally, the reasonableness and the advantages of the scheme are validated in the case study analysis section.
The main contributions of this work can be summarized as follows:
- (1)
- A framework for the coordinated scheduling of the demand response and active distribution networks has been established, which has solved the problem of increased load peak–valley differences caused by a high proportion of distributed generation.
- (2)
- The CNN-BiLSTM algorithm is proposed to analyze the charging behavior of EVs, thereby solving the scheduling error problem caused by the uncertainty of an individual SOC.
- (3)
- Build an EV cluster schedulable potential model to replace traditional energy-storage devices and leverage the flexible cost-reduction advantages of mobile energy storage.
2. ADN Scheduling Model Formulation
The SOCR-based ADN model is presented in the literature []. In this paper, we add active management devices to reduce the impact of DG in the framework of traditional ADN, including (1) on-load tap changer (OLTC) devices to regulate node voltages; (2) reactive power regulation devices, including discrete reactive power compensators and continuous reactive power regulators; (3) DG and DR modeling; and (4) active regulation devices, including EV cluster-shared energy-storage devices.
2.1. Modeling of OLTC
OLTC mainly compensates for the voltage fluctuation in ADN and regulates the power. The voltage of OLTC-equipped nodes in the ADN varies as the OLTC ratio changes:
where is the node containing the OLTC device, is the voltage value of the node, and are the upper and lower limits of the node voltage, respectively, represents the adjustable OLTC ratio, and and are, respectively, the upper and lower limits of the OLTC ratio.
The variable ratio of OLTC can be further expressed as follows:
where denotes the gear position of OLTC; is a 0–1 variable. In the paper, the limit of , the number of OLTC gear changes, is considered, and additional constraints are needed [].
2.2. Continuous Reactive Power Compensation Device Modeling
The static VAR compensation (SVC) is used as a continuous reactive power compensation device, and the compensation power of the SVC device is as follows:
where is the reactive power of the SVC device; and are the upper and lower limits of reactive power compensation. It should be noted that in the paper, ; this is due to the fact that current reversal due to the addition of a high percentage of DG can cause over-voltage problems.
2.3. Mathematical Modeling of Distributed Generation and Demand Response in ADN
2.3.1. Modeling of Distributed Generation
In general, the existing DG models are classified into two categories according to whether reactive power is considered or not:
- (a)
- Active power-focused DG modeling: wind turbines and PV systems
DG modeling considering only active, including wind turbine and PV models:
where is the set of nodes containing DG, is the actual DG output of the node , and is the predicted DG output of the node .
- (b)
- Active and reactive power-integrated modeling of DG
In active-management-related research, the reactive power management of DGs has been started in the literature. According to whether the power factor is controllable or not, it is categorized into constant control and variable control:
where for the adjustable ratio value, which is the power factor ratio of active and reactive power converted, and for the allowable value of the adjustable ratio, for the reactive power of DG, and and for the allowable range of reactive power.
2.3.2. Modeling of Demand Response
The DR, as one of the ADN active management methods, mainly regulates the parameters such as reactive power and voltage by injecting power to the nodes, which can be expressed as follows []:
where and are the demand response of each node; and , are respectively, the upper and lower limits of the demand response; represents the user satisfaction of the demand response; and are the load demand of each node; and denotes the set of DR nodes in the ADN.
3. Modeling of Dispatchable Potential for Electric Vehicle Clusters
3.1. EV Data Processing and Analytics
Errors can be eliminated to a greater extent by clustering the EVs. However, the historical data bias of EVs is still one of the causes of the error. Therefore, the Convolutional Neural Networks (CNN) and Bi-directional Long Short-Term Memory (Bi-LSTM) are used here to process the historical data of EV clustering, and the CNN can effectively reflect the data characteristics through local connection and weight sharing. The initial data are processed to effectively respond to the data features. At the same time, the number of parameters in the training process is greatly reduced to facilitate the extraction of data features. The schematic diagram of the CNN process is shown in Figure 1.
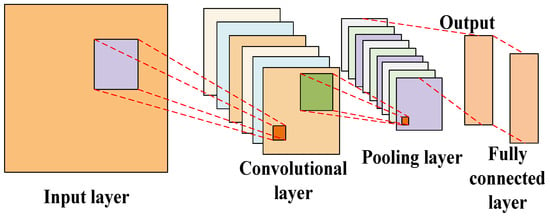
Figure 1.
The structure of the CNN.
The error can be eliminated more substantially by clustering the EVs. Compared with the conventional model-prediction methods such as LSTM and Bi-LSTM, CNN-BiLSTM can combine the advantages of the two to fully mine the data of EV clustering, which further improves the prediction accuracy of the data.
After collecting data, such as the EV’s entry and exit times, the SOC at the time of entry, the historical data can be divided into a training group and a test group. Firstly, the data of the training group are utilized to discover the intrinsic connection; secondly, the data of the test group are utilized to verify the accuracy. Compared with the traditional LSTM, Bi-LSTM adds the inverse LSTM process, which can better liaise the historical data with the future data. Details can be found in the literature [,,,]. The predicted historical data are used as the charging and discharging ranges and SOC variation ranges of the EV cluster shared energy-storage characteristics in the real-time phase, and Figure 2 shows the schematic diagram of the Bi-LSTM method.
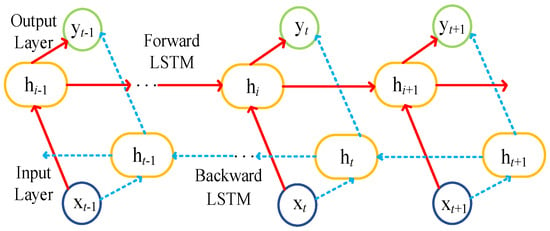
Figure 2.
Schematic diagram of Bi-LSTM.
Despite limitations such as high data sensitivity, substantial training costs, and weak dynamic adaptability, CNN-BiLSTM remains the predominant choice in academia and industry for spatiotemporal sequence prediction tasks due to its irreplaceable modeling capabilities. Critically, these limitations can be systematically mitigated through robust data governance, transfer learning techniques, and dynamic optimization mechanisms.
3.2. Modeling of Dispatchable Potential for Electric Vehicle Aggregations
Since the SOC and access time of individual EVs have large deviations, it is difficult to provide a stable energy supply, and a shared energy storage model based on the dispatchable potential of EV clusters is established here.
EV cluster dispatchable potential means, firstly, a reasonable range of values is obtained by processing historical data such as the initial SOC and access time of EVs. Secondly, the models of individual EVs are clustered into EV cluster models using the Minkowski sum theory. The constraints of the EV cluster dispatchable potential model are taken into account.
The EV is charged/discharged at the charging station based on the expected power and energy requirements on the UA side. The charge/discharge model of an individual EV is as follows:
where denotes the type of EV; and represent the charging and discharging power of the EV; and represent the upper and lower limits of EV charge and discharge power, respectively; and are the 0–1 variables of the charge-discharge process; and represents the state of charge (SOC) of the EV. and represent the charge/discharge efficiency of the EV; and represent the upper and lower limits of the EV’s expected electric power; and indicate the time when the EV arrives at and leaves the charging station, respectively.
Therefore, the shared energy-storage characteristics of EV clusters can be expressed as follows:
where , , and are, respectively, the SOC and charge/discharge power of the EV cluster, which participate in the scheduling process as decision-making variables. and are the allowable values of the charging/discharging power of the EV cluster; and are the upper and lower limits of the capacity of EV clusters; is the amount of change in the SOC of the EV cluster during the period.
The key differences between shared energy storage and traditional EV aggregation lie in ownership, control, and purpose: shared storage involves third-party-owned, centralized facilities (like large battery farms) providing grid services (peak shaving, frequency regulation); its charging/discharging is fully operator-controlled, unaffected by user needs. Conversely, EV aggregation pools decentralized, user-owned EV batteries (V2G) using incentives; it offers grid support only during idle times while meeting travel needs, making it less flexible/controllable due to user behavior and battery concerns. Essentially, shared storage is centralized and dedicated, while EV aggregation uses distributed and constrained resources.
- Optimization Objectives for Active Distribution Systems
The objective function of ADN is to minimize the dispatch cost, including the network loss cost , the DG abandonment cost , including the penalty cost of wind and light abandonment, the ADN’s power purchase cost from the main grid , and the ADN’s load difference cost . In general, it is specifically expressed as
- (1)
- Network loss costs
- (2)
- DG abandonment costs
- (3)
- Cost of buying power from the main grid
- (4)
- Load peak and valley costs
Finally, for convenience, the flowchart of economic optimization operation of the ADN is provided in Figure 3.
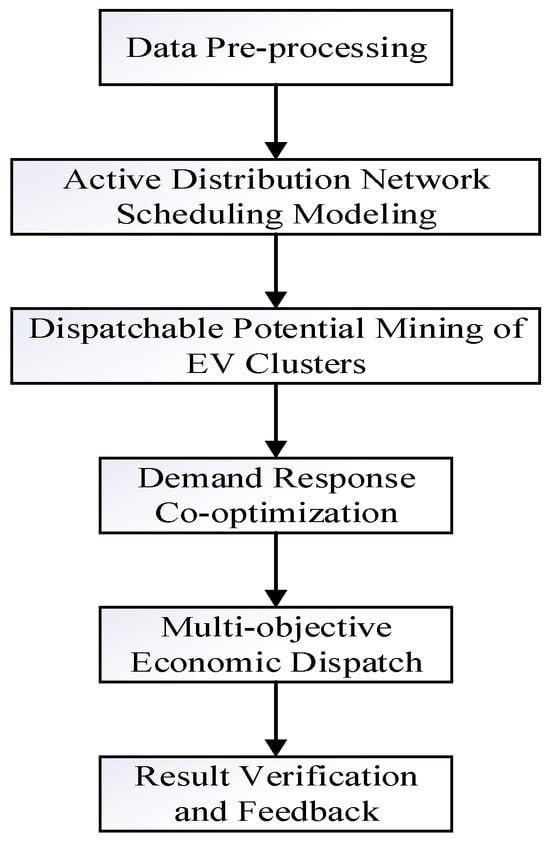
Figure 3.
Flowchart of economic optimization operation of ADN.
4. Experimental Analyses
In this paper, the above models are tested and analyzed using the improved IEEE-33 bus test system, which contains the node wiring diagrams of the OLTC, SVC, and EV cluster shared energy-storage device, as shown in Figure 4. Among them, the specific parameters of the OLTC and SVC models are shown in the literature []; the EV cluster shared energy-storage model is shown in the literature [].
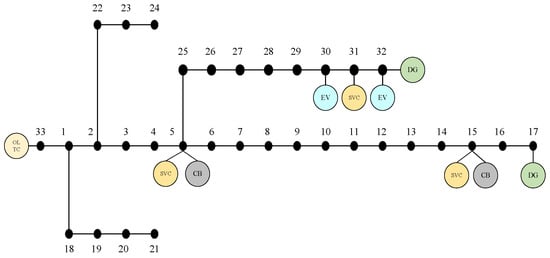
Figure 4.
Schematic diagram of modified IEEE-33 nodes.
In order to verify the effect of the DR model and EV shared energy-storage model introduced in this paper on the ADN, four sets of scenarios are set up for analysis based on MATLAB 2024a, and the four sets of scenarios are set up as follows:
- (1)
- Scenario 1: The standard model, without considering the DR with the EV cluster shared energy-storage model;
- (2)
- Scenario 2: Considering only the DR without the EV cluster shared energy-storage model;
- (3)
- Scenario 3: Considering the EV cluster shared energy-storage model;
- (4)
- Scenario 4: Considering the DR with the EV cluster shared energy-storage model.
The solution time, network loss, and power purchase cost for each of the four scenarios are shown in Table 1.

Table 1.
Analysis of network loss and cost in different scenarios.
By analyzing the results of the data in Table 1, it can be seen that the complexity of the system model increases, and its corresponding solution time also grows, and the solution time for solving in the relatively complex Scenario 4 meets the demand conditions for the scheduling and real-time optimization of the ADN in active operation. Meanwhile, comparing the network loss cost of Scenarios 1 and 3 with Scenarios 2 and 4, it can be seen that the network loss cost of the ADN can be substantially reduced after considering the addition of DR, which indicates that the system can reduce the peak–valley difference in the nodes through the introduction of the DR and, at the same time, further reduce the energy cost of the system. By analyzing the network loss and electricity cost of Scenario 2 and Scenario 4, it can be seen that after considering the EV cluster shared energy-storage characteristics, the network loss and power purchase cost of the ADN are reduced by 17.8% and 34.3% respectively, which indicates that the shared energy storage device can help to reduce the system’s cost and loss. In addition, the introduction of the EV cluster shared energy-storage device solves the problems of high up-front investment in the traditional energy-storage device and low utilization, which provides enough margin for subsequent system expansion and further optimization.
In the case analysis test, based on the sensitivity to network losses, voltage constraints, and geographical location, the wind turbine and PV unit are installed at nodes 32 and 17 (the wind power node is located at the end of the feeder line, with the greatest electrical distance. The photovoltaic nodes are close to commercial load centers, and the availability rate of rooftop photovoltaics is over 90%), respectively. The historical data of wind and solar output are predicted using the Frank Copula function, and the typical daily output curves of the two are extracted as shown in Figure 5 and Figure 6.
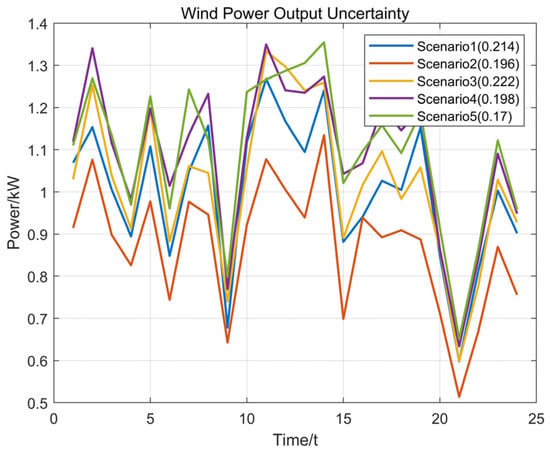
Figure 5.
Wind power output-reduction scenarios.
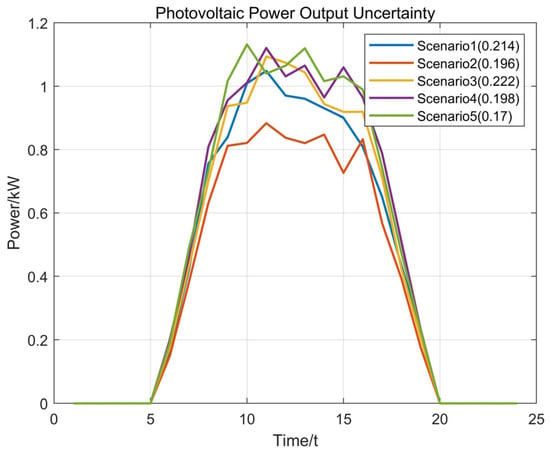
Figure 6.
PV output-reduction scenarios.
The data generated from the scenarios of wind turbine and PV are first processed. The DG output probability density curve obtained according to the Frank Copula function is shown in Figure 5 and Figure 6, according to the probability density function method of the DG scene generation after the 500 wind and solar complementary scenes and the generation of wind power and photovoltaic power generation scenarios for the reduction. Figure 5 depicts wind power scenarios: Scenario 1 (0% reduction, ideal output), Scenario 2 (10% reduction), Scenario 3 (20% reduction), Scenario 4 (30% reduction), and Scenario 5 (40% reduction). Figure 6 shows photovoltaic scenarios: Scenario 1 (0% reduction), Scenario 2 (10% reduction during partial periods), Scenario 3 (20% reduction full period), Scenario 4 (30% reduction peak hours), and Scenario 5 (40% reduction). In addition, to calculate the probability of each scenario, the power output power is expressed based on the youngest value.
Figure 7 shows the basic situation of active loads for Scenario 1 (without considering the DR with EV cluster shared energy storage) and Scenario 4 (considering DR with EV cluster shared energy storage). And it is compared with the turbine output scenario. The processing and comparison of DG in Figure 5, Figure 6 and Figure 7 shows that the results of DG scenario generation can generate the randomness and correlation of the DG unit output in the selected area more accurately. The DG data, after the above data processing, facilitate the overall planning of the ADN system at the early stage of construction, which further improves the operational reliability and economy of the ADN system.
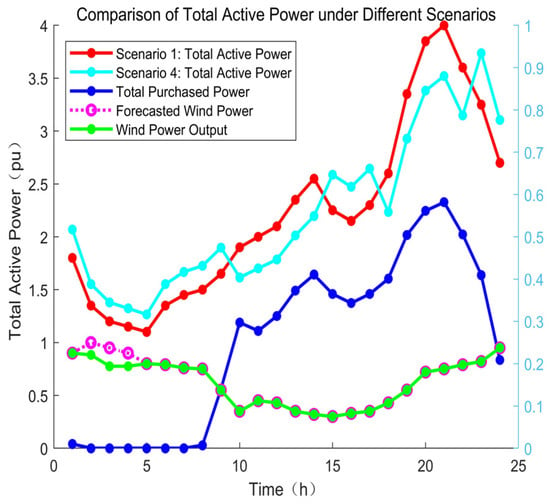
Figure 7.
Curves of active power output and load.
The total active power curves of ADN before and after DR participation, the predicted and actual turbine output curves, and the curves of the amount of power purchased by the ADN from the higher level are shown in Figure 7. From the data in Figure 7, it can be seen that compared with the scenario without the DR, the system further reduces the load spread of the ADN after the DR is added. The peak load drops from 4 MW to 3.52 MW after DR participation, and the peak-to-valley spread of the load decreases from 2.9 to 2.26 MW, with the peak-to-valley spread decreasing by 22%; analyzing the system from the 24 moments individually, the range of the maximum active load variability of the ADN decreases from 16% to 10%, and the active load change rate in most moments is in the range of 7% to 10%, which is due to the consideration of time-of-day tariffs and the actual situation of ADN power consumption, and the consideration of the power consumption satisfaction model in the DR model, which further constrains the change in ADN power consumption at a certain moment.
The node voltages of Scenario 1 and Scenario 4 are shown in Figure 8a,b. A comparative analysis of the node voltages of the two scenarios shows that the voltage stability of the ADN system in Scenario 4 is significantly improved by adding the DR, as well as the energy storage model with the EV cluster dispatchable potential. The degree of voltage offset of the system in Scenario 4 in the time period of 0:00–10:00 is significantly improved compared to Scenario 1. Taking node 7 as an example, the voltage deviation of node 7 in Scenario 4 is reduced by 25% compared to Scenario 1, which verifies the effectiveness of the proposed scheme.
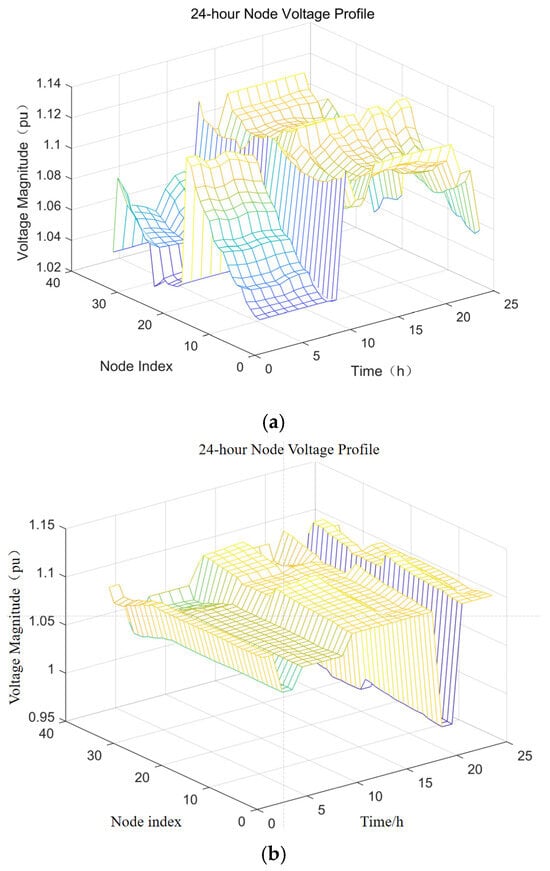
Figure 8.
Node voltage curves for different scenarios.
In addition, analyzing the node voltage characteristics for 24 h, it can be seen that the overall voltage of the ADN in Scenario 4 is lower compared to Scenario 1 in the 1:00–6:00 time period, which is due to the relatively low time-sharing tariffs provided by the external grid at this time, and the DR considers transferring loads from the time when the tariffs are high to the time period when the tariffs are low in order to reduce the overall cost of energy consumption, which reduces the voltage deviation.
As can be seen from Figure 9a,b, after mining and predicting the laws of the EV cluster historical data using the CNN-BiLSTM model, there is a higher accuracy improvement compared to the scenario without prediction and other basic algorithms such as CNN and BiLSTM, indicating that the CNN-BiLSTM model has a higher accuracy, and this prediction result meets the actual needs of ADN planning.
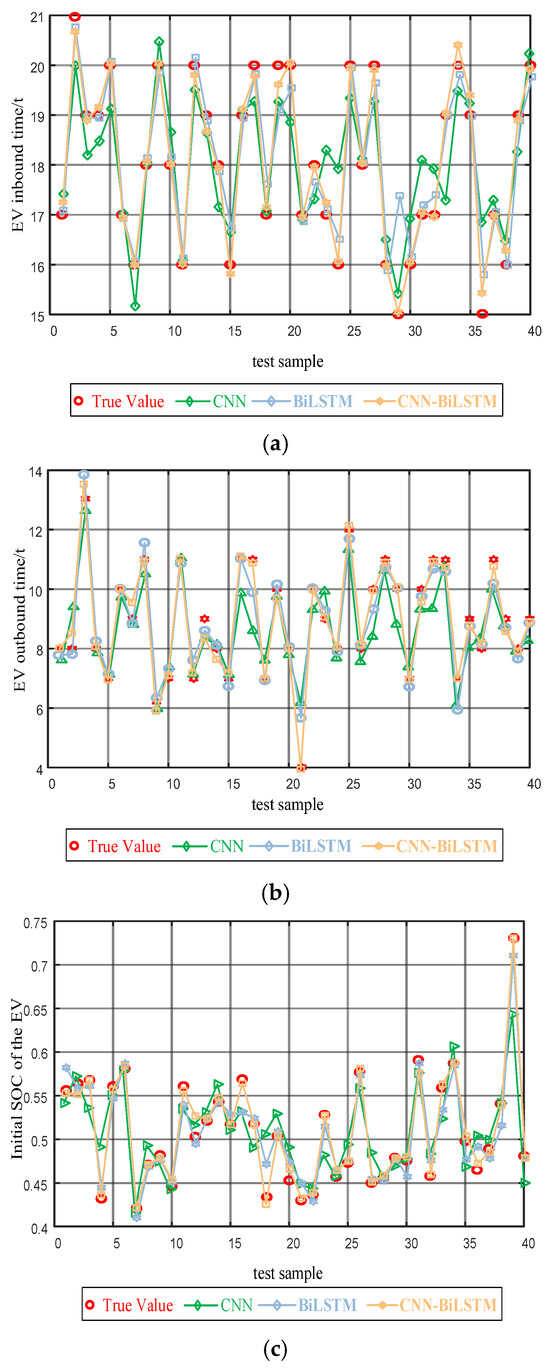
Figure 9.
Comparison of data from different algorithms.
To more intuitively illustrate the difference in prediction accuracy between CNN-BiLSTM and CNN/BiLSTM, the following formula’s root mean square error was calculated. The root mean square errors of the three prediction methods are shown in Table 2.
where represents the predicted value, and represents the actual value. N represents the total amount of data.

Table 2.
The root mean square error of different methods.
In order to further analyze the role of EV cluster shared energy storage and to further analyze the impact of EV cluster shared energy storage on the node voltage and economy, this paper analyzes the charging and discharging power versus storage capacity curves of the EV cluster shared energy-storage device assembled at node 32 in Scenario 4. It is assumed that four different charging stations are put into operation at the same time, and each charging station has a different EV type, which is in line with the actual operation and scheduling situation. The specific analysis results of the EV cluster shared energy-storage charging stations are shown in Figure 10.
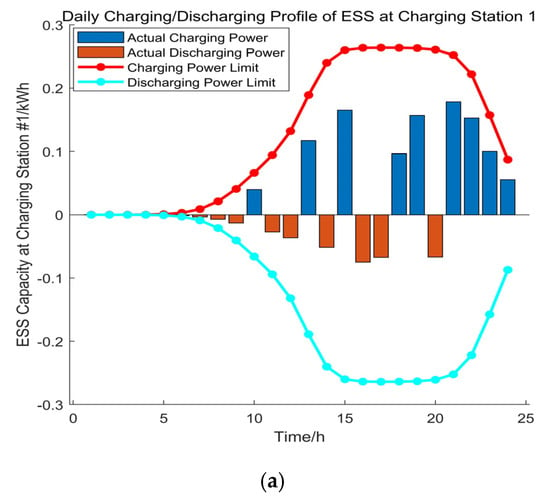
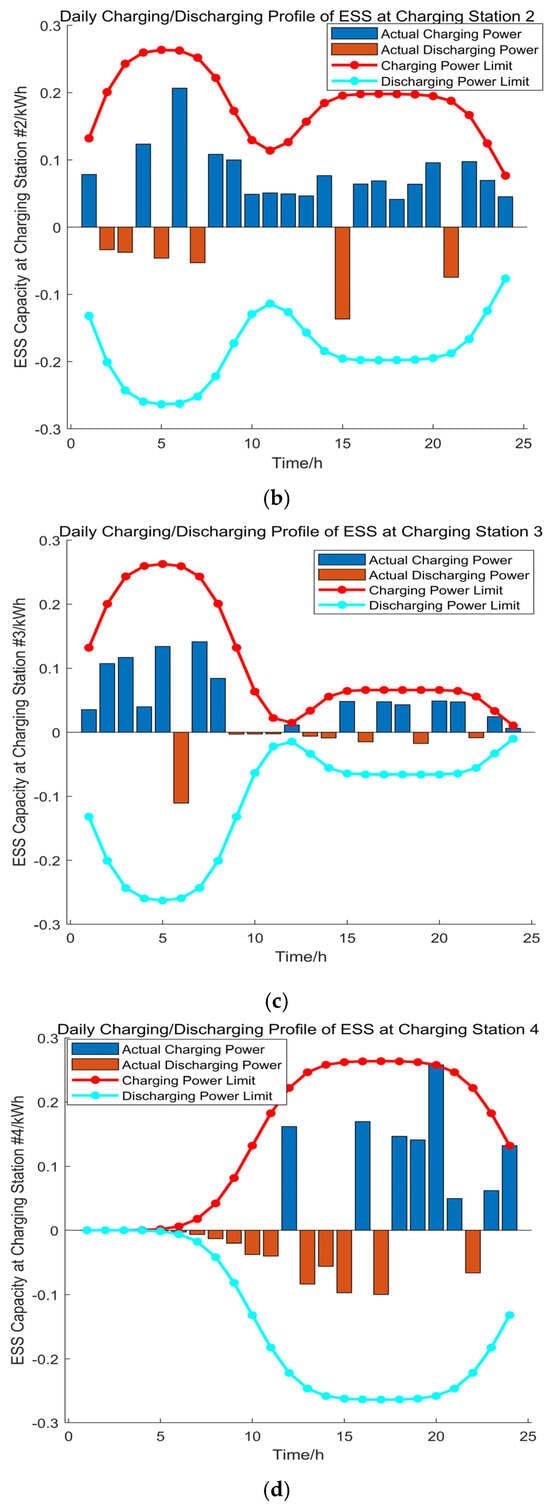
Figure 10.
Node 32 EV charging and discharging curves.
From the data analysis in Figure 10a–d, it can be seen that the EV cluster charging station chooses to charge during the time period of 1:00–6:00, when the time-sharing tariff is lower, and discharges during the time period of 7:00–11:00, when the time-sharing tariff is higher. This not only reduces its own energy cost but also consumes the abandoned wind and light in the system to avoid resource waste. At the same time, combined with the active power curve of Scenario 4 in Figure 7, it can be seen that in the time period of 18:00–22:00, when the ADN active power is higher, the charging operation of the EV charging station not only meets the EV’s power demand but also reduces the active load of the system to realize peak shaving and valley filling, realizing a win–win situation for both.
5. Conclusions
In this paper, we constructed a distribution-network-optimization operation model with the participation of scaled EVs, and for the problems of the high upfront investment in energy-storage equipment in the distribution network, we fully exploited the shared energy-storage characteristics of EV clusters and the demand response characteristics to reduce the network loss and load peak-to-valley difference in the system and realized the economic operation of the distribution network, and the main conclusions are as follows.
- (1)
- With the increasing penetration of DG in the ADN, considering multiple ADN active management devices and sharing energy storage with EV clusters through DR can largely reduce the system network loss and smooth the impact of DG on voltage, and the effectiveness of this paper’s scheme is verified by improving the ADN model of the IEEE-33 bus test system.
- (2)
- Considering that the DR model reduces the load difference of ADN in the peak and valley hours and the load peak and valley difference reduction reaches 22%, the further consideration of power consumption satisfaction in the DR model constrains the change in ADN power consumption.
- (3)
- The EV cluster shared energy-storage model not only lowers upfront storage construction costs and boosts utilization in ADNs but also absorbs excess system load while satisfying the EV demand, better supporting peak/valley operations.
The method validated based on the IEEE-33 bus test system retains considerable efficacy in larger-scale networks, though potentially confronting computational efficiency constraints, with its performance remaining comparable to the benchmark results obtained in this study.
The current study focuses exclusively on normal operating conditions of the ADN, as evidenced by the voltage stability improvements under standard load fluctuations (Figure 8) and EV scheduling behaviors under typical tariff policies (Figure 10). Significant performance deviations may occur in extreme scenarios.
Future work will establish an enhanced resilience-oriented framework to address these boundary conditions, including multiple emergency safety constraints and adaptive robustness indicators. Meanwhile, regarding the issues such as the communication delay in the cluster control of electric vehicles, we will also conduct further research.
Author Contributions
G.W. and H.L. (Haiyang Li) were responsible for methodology, simulation, and validation. G.W. conducted the analysis and wrote the paper. Conceptualization was handled by X.Y. and Y.W.; resource management by H.L. (Huayong Lu) and X.S.; data curation by J.R.; original draft preparation by G.W. and Y.W.; review and editing by Y.W.; visualization by G.W. and H.L. (Haiyang Li); supervision by Y.W.; project management by Y.W.; and funding acquisition by Y.W. All authors have read and agreed to the published version of the manuscript.
Funding
This work is supported by the State Grid Henan Electric Power Company Technology Project (5217C0240001).
Data Availability Statement
Data are contained within the article.
Conflicts of Interest
Guodong Wang, Huayong Lu, Xiao Yang and Haiyang Li were employed by the State Grid He-nan Electric Power Company, Xiao Song and Jiapeng Rong were employed by the State Grid Jiaozuo Electric Power Supply Company. The remaining authors declare that the research was conducted in the absence of any commercial or financial relationships that could be construed as a potential conflict of interest.
Nomenclature
| The voltage value of node j | |
| The adjustable OLTC ratio | |
| The reactive power of the SVC device | |
| The predicted DG output of the node | |
| The power factor ratio of active and reactive power converted | |
| The reactive power of DG | |
| The active power of the demand response at node j | |
| The reactive power of the demand response at node j | |
| The user satisfaction of demand response | |
| , | The load demand of each node |
| , | The charging and discharging power of the EV |
| , | The 0–1 variables of the charge-discharge process |
| The state of charge (SOC) of the EV | |
| , | The charge/discharge efficiency of EV |
| , | The time when the EV arrives at and leaves the charging station |
| The state of charge SOC of the EV cluster | |
| , | The charge/discharge power of the EV cluster |
| The amount of change in the SOC of the EV cluster during the period | |
| The unit cost of power abandonment | |
| , | The predicted and actual values of DG output |
| The unit cost of buying power | |
| The active power purchased and injected into the node | |
| The unit load peak–valley difference cost | |
| The set of nodes containing OLTC devices | |
| The set of nodes containing DG | |
| The set of DR nodes in ADN | |
| The set of substation nodes |
References
- Saxena, A.; Shankar, R. An interactive operating demand response approach for hybrid power systems integrating renewable energy sources. Prot. Control Mod. Power Syst. 2024, 9, 174–194. [Google Scholar] [CrossRef]
- Wang, X.; Kang, Q.; Guo, L.; Zhang, F.; Liang, Z.; Gao, J.; Wang, X.; Liu, W. Economic evaluation for 5G planning of a distribution network considering network coupling and important node identification. Prot. Control Mod. Power Syst. 2024, 9, 126–141. [Google Scholar] [CrossRef]
- Wu, S.; Wang, Q.; Chen, Q.; Yu, C.; Tang, Y. Cyber-physical integrated planning of distribution networks considering spatial-temporal flexible resources. Prot. Control Mod. Power Syst. 2024, 9, 142–156. [Google Scholar] [CrossRef]
- Zabin, R.; Haque, K.F.; Abdelgawad, A. A machine learning framework for short-term electrical load prediction. Electronics 2024, 13, 4521. [Google Scholar] [CrossRef]
- Liu, M.; Gao, Z.; Wang, Y.; Tian, C. Bad data repair for new energy stations in power system based on multi-model parallel integration approach. Electronics 2024, 13, 870. [Google Scholar] [CrossRef]
- Xia, S.; Zhang, C.; Li, Y.; Li, G.; Ma, L.; Zhou, N.; Zhu, Z.; Ma, H. GCN-LSTM based transient angle stability assessment method for future power systems considering spatial-temporal disturbance response characteristics. Prot. Control Mod. Power Syst. 2024, 9, 108–121. [Google Scholar] [CrossRef]
- Jiang, C.; Lin, Z.; Liu, C.; Chen, F.; Shao, Z. MADDPG-based active distribution network dynamic reconfiguration with renewable energy. Prot. Control Mod. Power Syst. 2024, 9, 143–155. [Google Scholar] [CrossRef]
- Xu, D.; Xu, J.; Qian, C.; Wu, Z.; Hu, Q. A pseudo-measurement modelling strategy for active distribution networks considering uncertainty of DGs. Prot. Control Mod. Power Syst. 2024, 9, 1–15. [Google Scholar] [CrossRef]
- Wei, Z.; Xu, H.; Chen, S.; Zhou, Y.; Sun, G. Distributional robust optimal dispatching method of DC distribution network based on deep learning. Electr. Power Autom. Equip. 2023, 43, 87–94. [Google Scholar]
- Zhao, W.; Zeng, T.; Liu, Z.; Xie, L.; Xi, L.; Ma, H. Automatic generation control in a distributed power grid based on multi-step reinforcement learning. Prot. Control Mod. Power Syst. 2024, 9, 39–50. [Google Scholar] [CrossRef]
- He, S.; Shao, Z.; Zheng, W.; Chen, F.; Li, Y. Bi-level uncertain reactive power planning of distribution network considering SVG dynamic voltage regulation strategy. Energy Storage Sci. Technol. 2023, 47, 5158–5168. [Google Scholar]
- Jia, Q.; Zhao, M.; Sun, L.; Du, G.; Fan, J.; Sun, H. Planning for grid-connection of distributed PVs considering the sequential feature and correlation in active distribution network. Proc. CSEE 2018, 38, 1719–1728. [Google Scholar]
- Zhang, X.; Duan, K.; Kang, B. Dual incentive optimal scheduling of microgrid considering flexible energy storage of electric vehicles. Adv. Technol. Electr. Eng. Energy 2023, 12, 2553–2564. [Google Scholar]
- Zhou, X.; Huang, X.; Zhang, Y.; Tang, Y.; Yao, L. Real-time scheduling and optimization model of electric vehicles based on fuzzy evaluation of demand response potential. Electr. Power Autom. Equip. 2022, 42, 30–37. [Google Scholar]
- Zhou, W.; Xu, C.; Yang, D.; Peng, F.; Guo, X. Research on demand response strategy of electric vehicles considering dynamic adjustment of willingness under P2P energy sharing. Proc. CSEE 2023, 43, 8217–8230. [Google Scholar]
- Yin, W.; Jia, L.; Ji, J. Energy optimal scheduling strategy considering V2G characteristics of electric vehicle. Energy 2024, 291, 91–101. [Google Scholar] [CrossRef]
- Yang, X.; Zhang, L.; Wu, L.; Leng, Z.; Liu, K.; Xu, Z. Economic optimal dispatch of an active distribution network with combined cooling, heating and power microgrids considering integrated demand response. Power Syst. Prot. Control 2022, 50, 19–28. [Google Scholar]
- Mitikiri, S.; Tiwari, Y.; Srinivas, V.; Pal, M. Regression based anomaly detection in electric vehicle state of charge fluctuations through analysis of electric vehicle charging infrastructure data. Sustain. Energy Grids Netw. 2025, 42, 91–98. [Google Scholar] [CrossRef]
- Gao, S.; Dai, R. Charging control strategy for electric vehicle cluster participating in frequency regulation ancillary service market. Autom. Electr. Power Syst. 2023, 47, 60–67. [Google Scholar]
- Zhan, X.; Yang, J.; Han, S.; Zhou, T.; Wu, F. Two-stage market bidding strategy of charging station considering schedulable potential capacity of electric vehicle. Autom. Electr. Power Syst. 2021, 45, 86–96. [Google Scholar]
- Zhang, P.; Xie, L.; Ma, R.; Lu, P.; Song, X. Multi-player two-stage low carbon optimal operation strategy considering electric vehicle cluster schedule ability. Power Syst. Technol. 2022, 46, 4809–4825. [Google Scholar]
- Lorenzo, S.; Deflorio, F. Estimation of charging demand for electric vehicles by discrete choice models and numerical simulations: Application to a case study in Turin. Green Energy Intell. Transp. 2023, 2, 100069. [Google Scholar] [CrossRef]
- Zheng, Y.; Miao, X.; Wang, H.; Li, X.; Hansen, T.M. Dynamic incentive pricing menu differentiated EV real-time charging schedule to increase renewable energy consumption: A deep reinforcement learning approach. IEEE Trans. Transp. Electrif. 2025, 99, 1. [Google Scholar] [CrossRef]
- Yang, L.; Wu, H.; Ding, M.; Bi, R. Short-term load forecasting in renewable energy grid based on bi-directional long short-term memory network considering feature selection. Autom. Electr. Power Syst. 2021, 45, 166–173. [Google Scholar]
- Zhu, X.; Sun, Y.; Yang, B.; Yang, J.; Wu, F. Calculation method of EV cluster’s schedulable potential capacity considering uncertainties and bounded rational energy consumption behaviors. Electr. Power Autom. Equip. 2022, 42, 245–254. [Google Scholar]
- Gao, H.; Liu, J.; Shen, X. Optimal power flow research in active distribution network and its application examples. Proc. CSEE 2017, 37, 1634–1644. [Google Scholar]
- Zhang, H.; Sun, H.; Kang, L.; Zhang, Y.; Wang, L.; Wang, K. Prediction of health level of multiform lithium sulfur batteries based on incremental capacity analysis and an improved LSTM. Prot. Control Mod. Power Syst. 2024, 9, 21–31. [Google Scholar] [CrossRef]
Disclaimer/Publisher’s Note: The statements, opinions and data contained in all publications are solely those of the individual author(s) and contributor(s) and not of MDPI and/or the editor(s). MDPI and/or the editor(s) disclaim responsibility for any injury to people or property resulting from any ideas, methods, instructions or products referred to in the content. |
© 2025 by the authors. Licensee MDPI, Basel, Switzerland. This article is an open access article distributed under the terms and conditions of the Creative Commons Attribution (CC BY) license (https://creativecommons.org/licenses/by/4.0/).