Abstract
In underwater communications for 6G, Doppler effects cause the coherent time to become similar to or shorter than the orthogonal frequency division multiplexing (OFDM) symbol length. Conventional time and frequency synchronization methods require additional training symbols for synchronization, which reduces the traffic data rate. This paper proposes the Zadoff–Chu sequence (ZCS) pilot-based OFDM for time and frequency synchronization. The proposed method transmits ZCS as a pilot for OFDM symbols and simultaneously transmits traffic data to increase the traffic data rate while estimating the CFO at each coherence time. For time–frequency synchronization, the correlation of the ZCS pilot is used to perform coarse and fine time and frequency synchronization in two stages. Since the traffic data cause interference with the correlation of ZCS pilots, we theoretically analyzed the relationship between the amount of traffic data and interference and verified it through computer simulations. The synchronization and BER performance of the proposed ZCS pilot-based OFDM were evaluated by conduction computer simulations and a practical ocean experiment. Compared to the methods of Ren, Yang, and Avrashi, the proposed method demonstrated a 6.3% to 14.3% increase in traffic data rate with similar BER performance and a 2 dB to 3.8 dB SNR gain for a 14.3% to 23.8% decrease in traffic data rate.
1. Introduction
One goal of 6G is to provide underwater wireless communications to global coverage [1]. Sound waves are considered the best carrier for underwater wireless communication [2,3,4]. Underwater acoustic (UWA) channels for 6G are characterized by frequency-selective fading due to the limited channel bandwidth, long transmission delay, and multipath [5]. Orthogonal frequency division multiplexing (OFDM) is robust to frequency-selective fading by dividing the available frequency band into multiple subcarriers with long symbol durations, ensuring that each subcarrier undergoes frequency-flat fading. Additionally, the OFDM achieves high spectral efficiency by allowing each subcarrier to transmit symbols independently, resulting in a higher transmission rate than single-carrier systems [6].
In a communication channel, the Doppler shift induces carrier frequency offset (CFO) in OFDM, which leads to inter-carrier interference (ICI), which breaks the orthogonality between subcarriers and degrades the bit error rate (BER) performance. In radio frequency (RF) channels, frequency synchronization is estimated within one received OFDM frame because the change in CFO is small [7,8,9,10,11,12]. However, in UWA channels, the acoustic signal has a slow propagation speed (1500 m/s) [13], and the bandwidth of the signal is large compared to the carrier frequency. Even in a low Doppler frequency shift, the OFDM symbol length is similar to or shorter than the coherent time, making it difficult to apply the frequency synchronization estimation algorithm developed for RF. Since OFDM symbols are modulated by inverse fast Fourier transform (IFFT), time synchronization is also required to locate the FFT window at the receiver. Therefore, time and frequency synchronizations are required for UWA OFDM systems.
Conventional time and frequency synchronization methods are mainly estimated by using training symbols [7,8,9,10,11,12]. The training symbol-based method synchronizes using training symbols with a repeated property. In [7], the training symbol was designed with a repetitive structure based on PN sequences, but the estimation error was large due to the plateau effect. The slicing process on the timing metric of [7] was proposed in [8], but it still suffered from poor frequency accuracy. To achieve the impulse characteristics of the timing metric, [7,9] redesigned the training symbol. However, [9] still had a large variance in timing estimation. In addition, other studies have used the Zadoff–Chu sequence (ZCS) [14] as training symbols [11,12]. Joint signal detection, timing synchronization, and the CFO estimation method were proposed in [11], which simplified the synchronization structure and improved the synchronization performance. In [12], the new training symbol was designed to improve the accuracy of CFO estimation. However, these methods increase the number of training symbols to estimate the CFO in underwater channels with relatively short coherence times, which reduces the traffic data rate.
To increase the traffic data rate, in this paper, we propose a ZCS pilot-based OFDM method for time and frequency synchronization in UWA OFDM systems. The proposed method used ZCS as a pilot for OFDM symbols while simultaneously transmitting traffic data to improve the traffic data rate. For time and frequency synchronization, Ren’s method [15], which is based on correlation, was used for time and frequency synchronization. The time synchronization was performed with two stages, coarse and fine, and the frequency synchronization iteratively estimated CFO two times using symmetric correlation. Since the traffic data cause interference with the correlation of ZCS pilots, we theoretically analyzed the relationship between the amount of traffic data and interference and verified it through computer simulations. We also conducted computer simulations to compare and analyze the synchronization and BER performance of the proposed ZCS pilot-based OFDM. In addition, we conducted a practical ocean experiment to evaluate the BER performance of the proposed method and compared them with the results obtained from the computer simulations, and the results showed the superior performance of the proposed method.
The main contributions of the paper can be summarized as follows:
- We proposed a novel ZCS pilot-based OFDM method for time and frequency synchronization. To increase traffic data rate, ZCS was used as a pilot for OFDM symbols while simultaneously transmitting the traffic data. The BER performance of the proposed method depends on the traffic data rate such as maintaining the BER performance while increasing the traffic data rate or increasing the BER performance while reducing the traffic data rate.
- We theoretically analyzed the interference caused by traffic data to the correlation of the ZCS pilot over changes in the traffic data rate. The correlation ratio was used to analyze the correlation performance, and we obtained the relationship between the traffic data rate and correlation performance through computer simulations.
- We validated the proposed method by conducting a computer simulation comparing the performance of the proposed method in terms of time synchronization, CFO estimation, and BER performance under varying traffic data rates.
- We conducted a practical ocean experiment to verify the simulation results. Compared with the conventional methods, which are those by Ren, Yang, and Avrashi, the proposed method demonstrated a 6.3% to 14.3% increase in the traffic data rate with a similar BER performance and a 2 dB to 3.8 dB SNR gain with a loss of 14.3% to 23.8% in the traffic data rate.
2. Related Work
Related works to increase the traffic data rate without transmitting additional training symbols were researched, and these methods can be classified into two categories. The first category, blind estimation, uses no additional training data. Instead, it relies on the statistical characteristics of the received OFDM data for time and frequency synchronization such as the cyclic prefix (CP) [16,17,18,19], null subcarrier [20,21], and virtual subcarrier [22,23]. The scheme proposed in [16] can estimate the CFO using the CP without requiring additional bandwidth. However, the performance of the estimator degrades as the frequency-selective fading increases. In [17], an CFO estimator was proposed by exploiting the correlation between CP and its data replica, but [17] required the CP to be longer than the channel delay spread and the exact channel order to be known. A simple pre-FFT synchronization algorithm for estimating the symbol timing offset (STO) and fractional CFO in a CP OFDM-based system was proposed in [18], but the CFO estimation performance degraded as the long channel delay spread. In the same year, [19] studied the CFO synchronization technology in OFDM, analyzed CFO in the time and frequency domains, and simulated the performance of CFO synchronization technology based on OFDM. In [20], a nonlinear least-square (LS) CFO estimation using the null subcarrier in the frequency domain was introduced. The concept in [20] was later adopted and extended in [21]. However, both methods required a grid search in the frequency domain, leading to a high computational burden on the modem. A blind CFO estimation method using virtual subcarriers for OFDM systems was proposed in [22], offering improved spectral efficiency with acceptable performance. Additionally, the two-stage approach proposed in [23] enhanced computational efficiency by replacing the frequency search with an iterative algorithm. However, an erroneous initial estimate of the CFO resulted in the failure to obtain an acceptable estimation performance. In addition, these conventional algorithms could not simultaneously perform coarse and fine time synchronization.
The second category of time and frequency synchronization is known as data-aided estimation. The most data-aided synchronization method without transmitting additional training symbols is a pilot symbol-based method, which is periodically transmitted. The pilot symbol-based method is the data-aided synchronization method without transmitting additional training symbols [24,25,26,27,28,29]. In [24], joint time and frequency synchronization using a conventional pilot and a carrier frequency pilot (CFP) was proposed to detect the CFO and the sampling position, but the traffic data rate was reduced because the pilot and CFP needed to be transmitted for every coherent time for CFO estimation. The joint time and frequency synchronization for the DFT-precoded UWA OFDM system was studied in [2], which matched the received pilot with the local copy and captured the effective multipath energy before the strongest path to improve channel estimation performance but only estimated and compensated for the Doppler scale effect and did not estimate the CFO. The joint estimation scheme for fine timing, Doppler scaling factor, and CFO based on the pilot symbol was proposed in [26], which was performed in a block-by-block fashion. However, the estimation scheme in [26] was only evaluated at low CFO environments. Based on identical pilots, two low-complexity CFO estimation schemes utilizing root finding and eigen decomposition were proposed in [27], but adopting identical pilots in OFDM systems usually leads to a high peak-to-average power ratio. The efficient CFO estimation using the phase of the eigenvector of a channel correlation matrix was proposed in [28]. In [28], CFO was estimated using three estimators based on the correlation matrix. The transmitter–receiver design enabling closed-form CFO estimation, based on [27] and [28], was proposed in [29]. This method estimated the time-varying CFO by using correlation and intervals between pulses, approximating the CFO with low-order polynomials. In [29], transmitting equi-power and equi-spaced pilot tones, which led to a simple carrier frequency offset estimator, were suggested, and the phases of the pilot tones were designed to keep the peak to average power low. However, [29] assumed a small pilot transmission relative to the amount of traffic data and relied on accurate timing synchronization.
In this paper, the proposed ZCS pilot-based OFDM for time and frequency synchronization increased the traffic data and improved the BER performance. The main improvements of the proposed method over previous synchronization methods are described below.
3. System Model
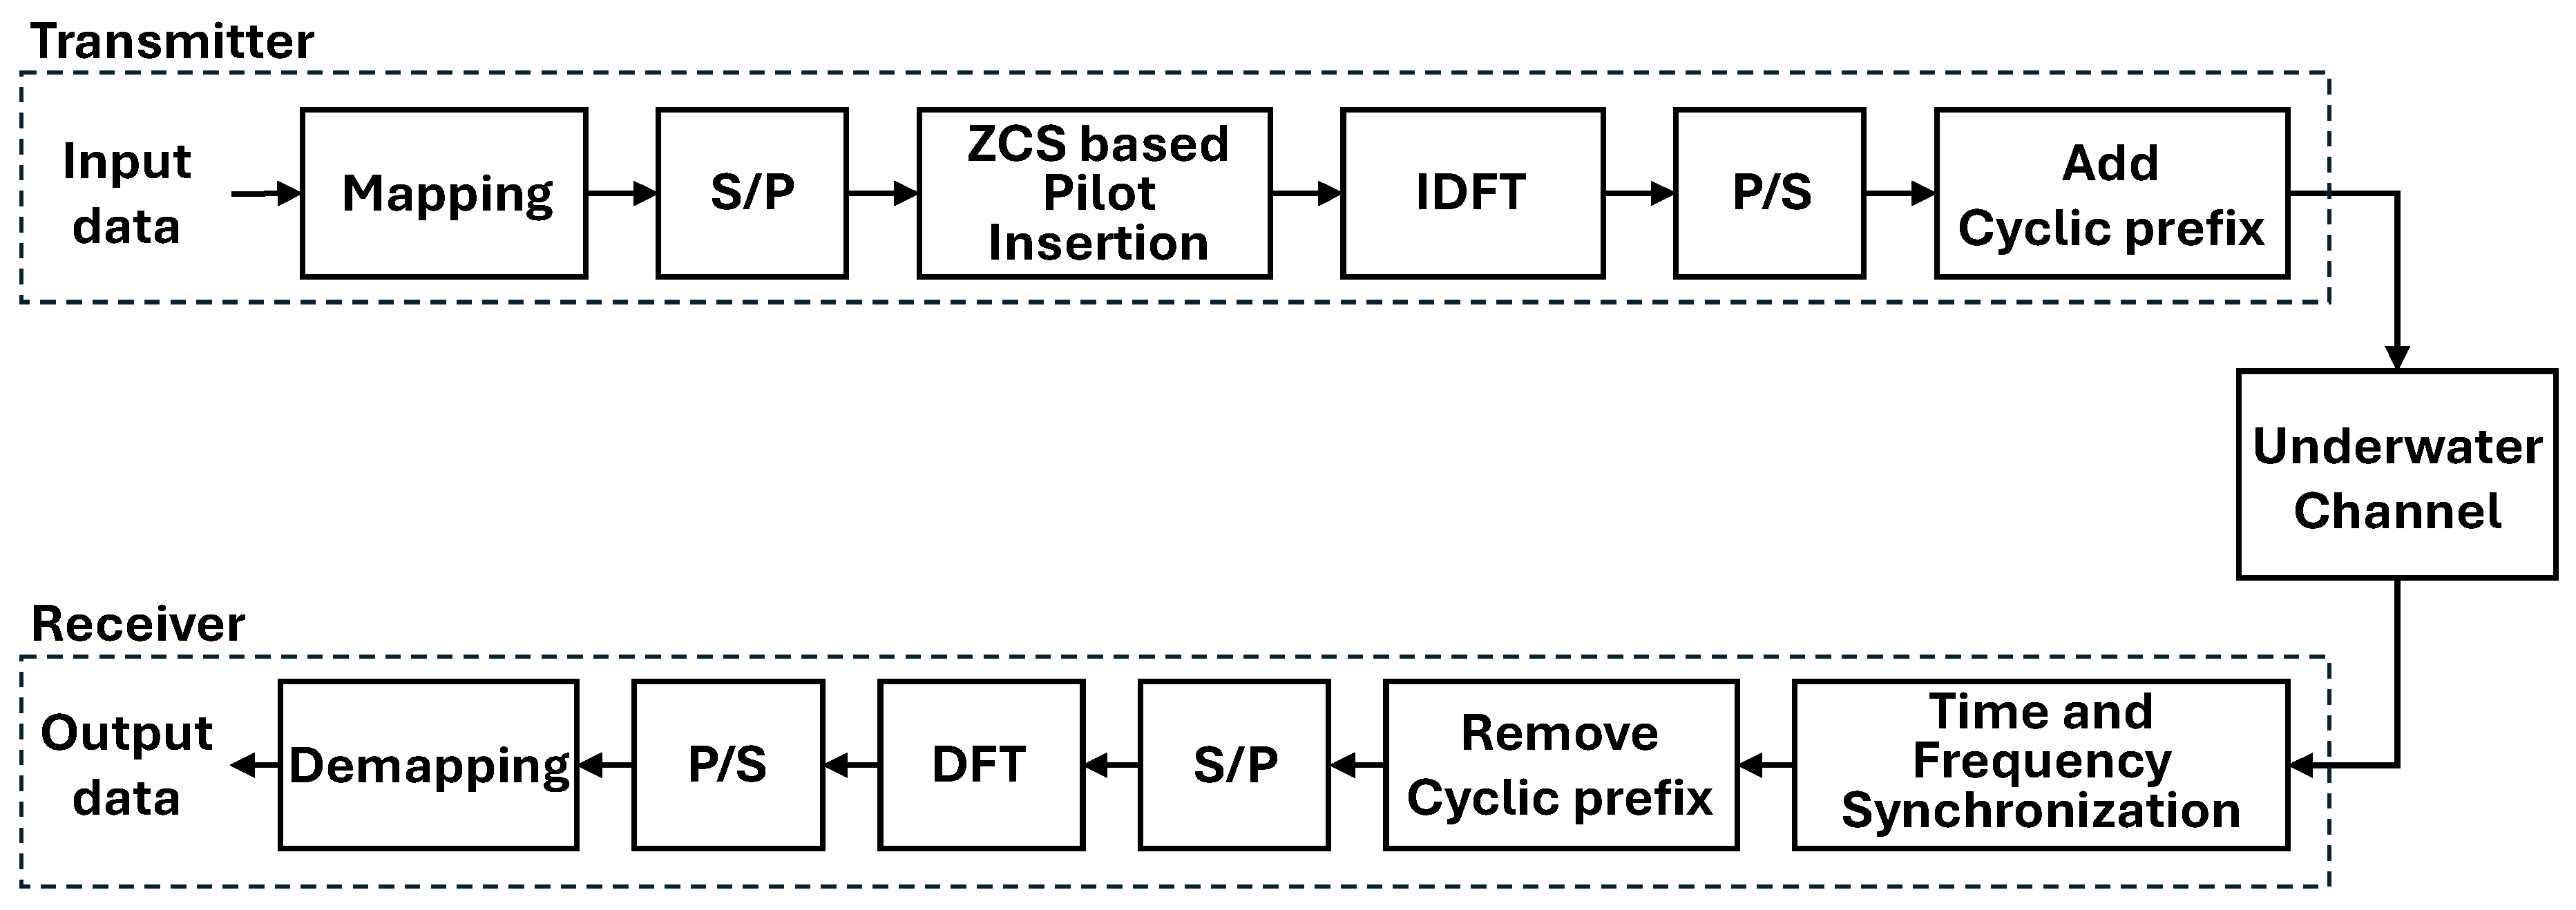
With the main purpose of increasing the traffic data rate, this study proposed a ZCS pilot-based OFDM method for time and frequency synchronization. At the same time, the interference caused by the traffic data of the correlation of ZCS has to be considered, which is an important factor that determines the time and frequency synchronization performance of the proposed method. To analyze the interference, we considered a general model of an OFDM system, which is shown in Figure 1.
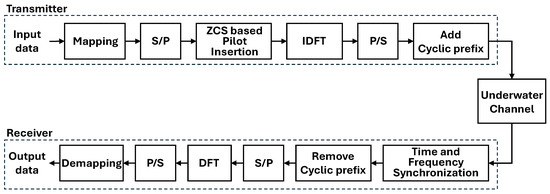
Figure 1.
Structure of the UWA OFDM system.
The UWA OFDM system divides the transmission bandwidth () into subchannels for signal transmission. In the mapping block, the transmitter maps the input data into a serial data stream in a phase-shift keying (PSK) constellation. In the serial-to-parallel (S/P) block, the serial data stream is converted to a parallel data stream by S/P transformation. In the inverse discrete Fourier transform (IDFT) block, -point IDFT is utilized for the OFDM modulation. When assuming ideal Nyquist pulse shaping, the transmitted discrete-time baseband OFDM signal is obtained by parallel-to-serial (P/S) transformation in the P/S block such as
where denotes the data of the th subcarrier of the OFDM symbol. The processing in the receiver blocks is mapped to the transmitter blocks. Each OFDM symbol consists of subcarriers, and the subcarrier spacing () is given as . If pilots for channel estimation are allocated to subcarriers out of the total subcarriers, the remaining subcarriers are used to transmit traffic data. The OFDM signal in Equation (1) can be represented as
where denotes the pilots of the -th subcarrier, denotes the traffic data bits of the -th subcarrier, and L is the guard interval length. As the guard interval contains CP, the total length of an OFDM symbol is .
The channel impulse response (CIR) of a time-varying UWA multipath channel can be represented as
where , , and denote the time delay, the time-varying amplitude of the th path, and the timing offset, respectively. Assume that the CP length () is greater than the maximum time delay to prevent inter-symbol-interference (ISI).
The OFDM signal transmitted from the transmitter undergoes the UWA multipath channel and was modeled with additional noise () at the receiver. If a Doppler frequency shift () occurs in the underwater acoustic channel, a normalized CFO () is defined as a ratio of the actual frequency offset to the subcarrier spacing (i.e., . If it is assumed that occurs in the received signal and causes ICI between the OFDM subcarriers, the received discrete-time baseband OFDM signal with can be expressed as
Since UWA communication channels have a long delay channel and low acoustic propagation speed, the coherence time is relatively short compared to the OFDM symbol length. Thus, OFDM symbols need to be transmitted within a coherent time for time and frequency synchronization. However, the transmission of additional OFDM symbols for synchronization of the time and frequency reduces the traffic data rate.
Therefore, this paper proposed a ZCS pilot-based OFDM that transmits a ZCS pilot for time–frequency synchronization and simultaneously transmits traffic data on the same OFDM symbol to increase the traffic data rate. Section 4 describes the ZCS pilot-based OFDM symbols and analyzes the correlation performance.
4. ZCS Pilot-Based OFDM
To increase the traffic data rate, the proposed method transmits the ZCS pilot and traffic data simultaneously, but the traffic data cause interference on the correlation of ZCS pilots. In this section, we derived the ZCS pilot-based OFDM symbol and theoretically analyze the relationship between the interference and the correlation of ZCS.
4.1. ZCS Pilot-Based OFDM Method
The proposed method transmits a ZCS-based pilot and traffic data simultaneously to increase the traffic data rate with similar BER performance for the continuously changing time–frequency synchronization in UWA OFDM communication. The ZCS () is one of the constant amplitude zero autocorrelation (CAZAC) sequences that possesses the polyphase code property, expressed as
where denotes the root index that is coprime with .
The proposed method allocates the ZCS pilot at the intervals of pilot spacing () along the frequency domain of OFDM symbol. The remaining subcarriers are allocated for traffic data, and the OFDM modulation is performed using IDFT to generate the OFDM symbol. When the ZCS-based pilot is modulated by IDFT, a repetition pattern in the OFDM symbol is formed along the frequency domain with pilot spacing. The IDFT of ZCS transforms the original ZCS into a new ZCS with phase shifts. Considering the IDFT of ZCS as a general ZCS in Equation (5) with even , the OFDM symbol in Equation (2) contains ZCS () and data () terms as follows:
where denotes .
4.2. Correlation Analysis
In this paper, we theoretically analyzed the impact of interference from traffic data on the correlation of ZCS pilots to derive the correlation performance according to the amount of traffic data.
Time and frequency synchronization is generally performed by calculating the correlation between the transmitted and received signals. Since the proposed method transmits ZCS pilots and traffic data simultaneously, the interference caused by the traffic data affects the performance of the correlation of ZCS. For simplicity, assuming the CP is removed, , and perfect timing. The cross-correlation between the received OFDM symbol in Equation (4) and the transmitted ZCS pilot-based OFDM symbol in Equation (6) can be given as,
where denotes the lag of cross-correlation and denotes the . In Equation (7), since the traffic data are treated as the interference and is defined as , thus Equation (7) can be rewritten as,
is substituted using Equation (5), and the correlation can be obtained as,
Cross-correlation-based synchronization is performed by finding the peak of the cross-correlation amplitude. Observe the correlation amplitude to analyze the relationship between correlation performance and interference caused by traffic data. The amplitude of Equation (9) can be expressed as
If we assume to be zero, the summation term in Equation (10) becomes zero, except for . However, if the traffic data are transmitted simultaneously with the ZCS pilot, the summation term in Equation (10) is non-zero, even in the case of , and the interference caused by traffic data degrade the correlation performance.
Therefore, in Equations (9) and (10), the interference term is linearly proportional to the decrease in . The magnitude of decreases by the reduction in the number of traffic data, resulting in a linear improvement in correlation performance proportional to the rate of decrease in .
5. Time Synchronization
Time synchronization in this paper was performed in two stages: coarse and fine synchronization. In general, coarse time synchronization in UWA communication is performed by cross-correlation of the received signals and transmitted signals, which is also adopted in this paper. The coarse synchronization time () was obtained by finding a time with a maximum value among cross-correlations in Equation (7), which is given by
Let be a time offset for a given coarse synchronization time . The fine time synchronization is obtained using the time metric in Ren’s method [15] to increase the precision of the estimated time. The fine time offset for is calculated as
Therefore, the fine synchronization time value is obtained as . The proposed method performs coarse and fine time synchronization first, followed by frequency synchronization, as described in the next section.
6. Frequency Synchronization Analysis
In this section, we derived the ZCS pilot-based CFO estimation and analyzed the interference caused by traffic data in the symmetric correlation of the ZCS pilot.
The CFO estimation is iteratively performed two times by symmetric correlation of repeated patterns of the ZCS pilot based on Ren’s method [15]. The CFO estimation by Ren’s method [19] is given as
where denotes the number of repetition patterns. The time and frequency synchronization in the ZCS pilot-based OFDM is summarized in Algorithm 1.
| Algorithm 1 Time and frequency synchronization in the ZCS pilot-based OFDM |
2: Initialize: as (5) as (6) as (4) as (7) as (11) |
| as (13) |
In the CFO estimation, as in Section 4, we focused on analyzing the interference caused by traffic data in the symmetric correlation of the ZCS pilot. To simplify the equation, we assumed that , , , and was a noiseless environment. Substituting the received OFDM symbol with Equations (4) and (6), Equation (13) can be rewritten as
In the CFO estimation, by treating the traffic data as the interference in the same way as in Equations (7) and (8), and is defined as . Then, the symmetric correlation in Equation (14) can be rewritten as
In Equation (15), the performance of CFO estimation is affected by the phase of . If is zero, then becomes zero, and the estimated CFO is the same as because it eliminates the interference caused by the traffic data.
Therefore, the interference caused by traffic data in symmetric correlation decreases proportionately to the reduction in , and the CFO estimation performance is proportional to the reduction in .
7. Computer Simulation and Results
In this section, we conducted computer simulations and a practical ocean experiment to evaluate the performance of the proposed method. The performance of the proposed method was compared with conventional methods including Ren’s method [15], Yang’s method [12], and Avrashi’s method [29]. The simulations evaluated the correlation, time synchronization, CFO estimation, and BER performance of the proposed ZCS pilots according to the traffic data rate.
The correlation performance of the proposed method was compared with the ZCS pilot without transmitting the traffic data based on the correlation ratio with respect to the traffic data rate. The time synchronization performance was evaluated by comparing the synchronization error with respect to the traffic data rate using the mean absolute error (MAE). The CFO estimation performance was evaluated using the mean square error (MSE) between the actual CFO and the estimated CFO. In addition, the CFO estimation performance was evaluated for different traffic data rates for a constant CFO and the time-varying CFO. Finally, the BER results according to the traffic data rate were also compared.
The UWA channel models for the simulation were generated by the BELLHOP ray tracing tool based on the sound speed profile (SSP). The channel delay profile of the UWA channel model for the simulation included five multipaths with a maximum excess delay (MED) of 13 ms, as shown in Figure 2a. The SSP was acquired at a maximum depth of 40 m in the West Sea of Korea, as shown in Figure 2b.
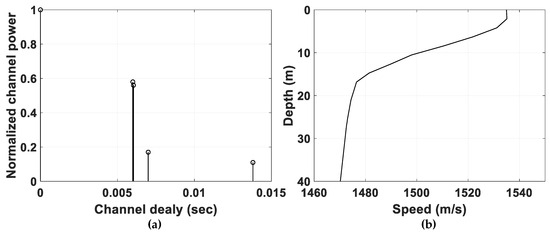
Figure 2.
The underwater channel for the simulation: (a) channel delay profile, (b) sound speed profile.
The Doppler shift frequency of the UWA channel model was set to 1.5 Hz, resulting in a coherent time of 282 ms, which was longer than the length of two OFDM symbols (250 ms). We specifically focused on comparing the performance variation due to interference caused by the traffic data rate. Therefore, we set a CP length longer than MED and an shorter than the coherence bandwidth to reduce other factors that could affect the performance sufficiently. Additionally, we set the to two to estimate the CFO while considering the coherence time.
The performance of the proposed method is mainly affected by the interference of traffic data. Since the interference is proportional to the traffic data rate, we fixed a set of OFDM parameters and compared the performance variations for the different traffic data rates. The OFDM parameters used in the simulations are shown in Table 1.

Table 1.
The OFDM parameters for the simulation.
The data frame consisted of 1024 carriers that were transmitted via the UWA channel. Figure 3 shows the data frame structure of the conventional methods and the proposed method.
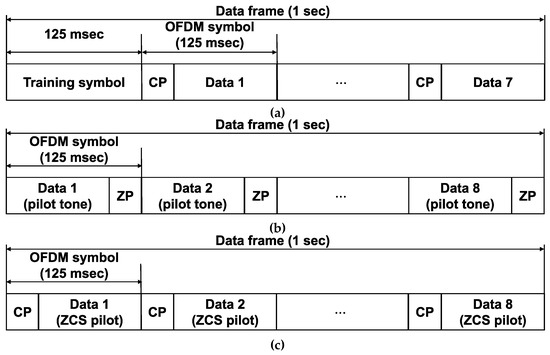
Figure 3.
The structure of the data frame: (a) Ren’s method [15] and Yang’s method [12], (b) Avrashi’s method [29], and (c) proposed method.
The data frame of Ren’s method [15] and Yang’s method [12] consisted of one training symbol and seven OFDM symbols, each with a length of 125 msec. On the other hand, the data frame of the proposed method and Avrashi’s method [29] consisted of eight zero-padded (ZP) OFDM symbols, each with a length of 125 ms and a total length of 1 s. In the proposed method, the traffic data were assigned to the OFDM symbols at every interval, and the traffic data were assigned to the remaining OFDM symbols. Figure 4 and Table 2 demonstrate the OFDM symbol structure and traffic data rate according to the and when was set to two, respectively.
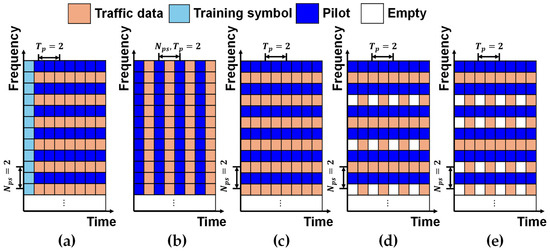
Figure 4.
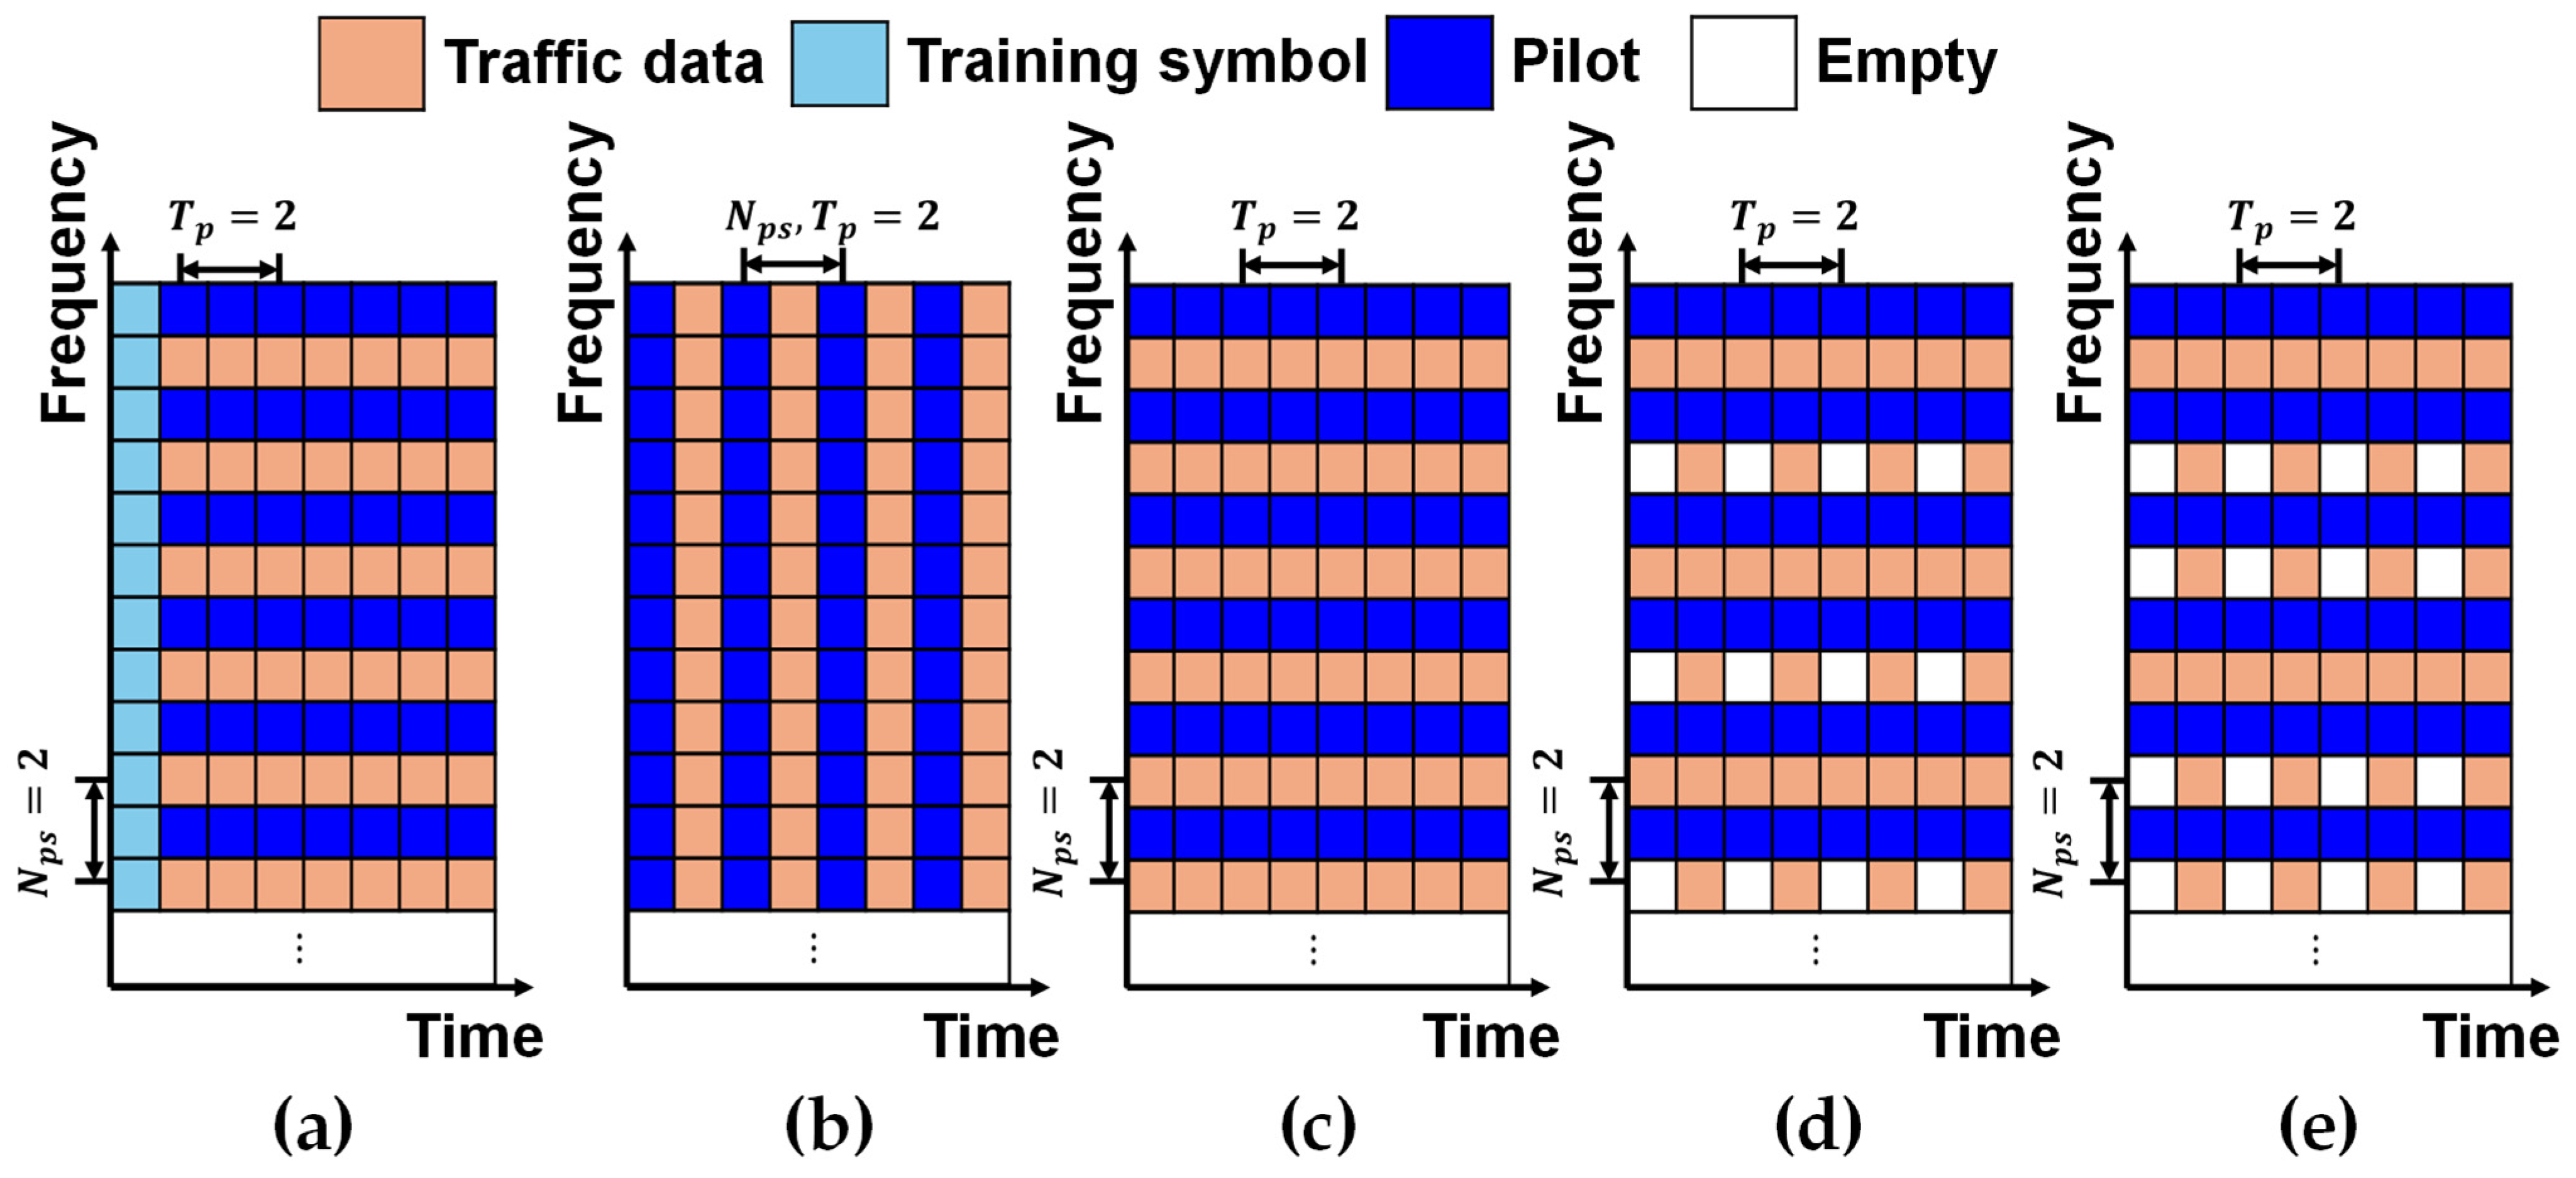
The OFDM symbol structure (): (a) Ren’s method [15] and Yang’s method [12], (b) Avrashi’s method [29], (c) proposed method (), (d) proposed method (), and (e) proposed method ().
Table 2.
Traffic data rate ().
As mentioned in Section 4, the correlation performance of the ZCS pilot is affected by the amount of traffic data. To analyze the effect of interference on the amount of traffic data, we compared the performance of three OFDM symbol structures of the proposed method with the most interference with the conventional methods. Figure 4 displays five different types of pilots and data allocations. Figure 4a depicts the OFDM symbol structure of Ren’s method [15] and Yang’s method [12]. The first OFDM symbol was used as a training symbol. Figure 4b describes the OFDM symbol structure of Avrashi’s method [29]. Equi-power and equi-spaced pilot tones were assigned to all OFDM symbols within the data frame. Figure 4c–e shows the OFDM symbol structures of the proposed method that allocated ZCS every interval on the frequency to all OFDM symbols as the pilot. It also shows the case of those allocated by traffic data, traffic data, and for each OFDM symbol at intervals, respectively. In all three symbol structures, the remaining subcarriers were allocated traffic data. In the case where was set to two in Figure 4, the CFO estimation was only performed on odd OFDM symbols and not even OFDM symbols.
In Table 2, and in represent the pilot spacing and traffic data ratio on the subcarriers of the proposed method, respectively. The in , , and indicates the pilot spacing on the subcarriers of the conventional methods.
7.1. Correlation Ratio of ZCS-Based Pilot
As analyzed in Section 4, the correlation performance of ZCS pilots is linearly inversely proportional to the number of traffic data allocated to the OFDM symbols. Let be the lag with a valid correlation value satisfying in Equation (10) and let be the lag with a correlation value due to interference. Then, the correlation ratio is defined as the ratio of of as follows,
where and denote the numbers of and , respectively.
Figure 5 shows the normalized correlation ratio at an SNR 0 dB environment.
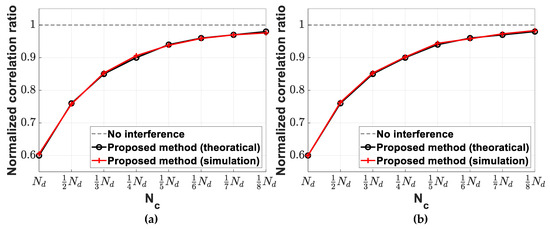
Figure 5.
Normalized correlation ratio at SNR 0 dB. (a) , (b) .
In Equations (9) and (10), is linearly proportional to the traffic data ratio. Therefore, the correlation ratio in Figure 5 was linearly increased in proportion to the reduction in traffic data allocated to the OFDM symbols. In Figure 5, the correlation performance of the proposed method where compared to the non-interference was 14.8% and 14.7% different when and , respectively. When was less than , the difference in correlation ratio between the proposed method and the non-interference became less than 10%. As decreased, the correlation ratio of the proposed method converged to one.
Therefore, as theoretically analyzed in Section 4, the correlation performance of the ZCS pilot was linearly proportional to the reduction in traffic data rate. In the subsequent simulation for performance evaluation, the proposed method was compared when was equal to or greater than .
7.2. Time Synchronization Performance
The time synchronization performance of the proposed method was compared with that of the conventional methods. Since the time synchronization method was not proposed for Avrashi’s method [29], a cross-correlation-based time synchronization was applied for comparison. Figure 6 and Table 3 show the MAE of time synchronization for the proposed and conventional methods.

Figure 6.
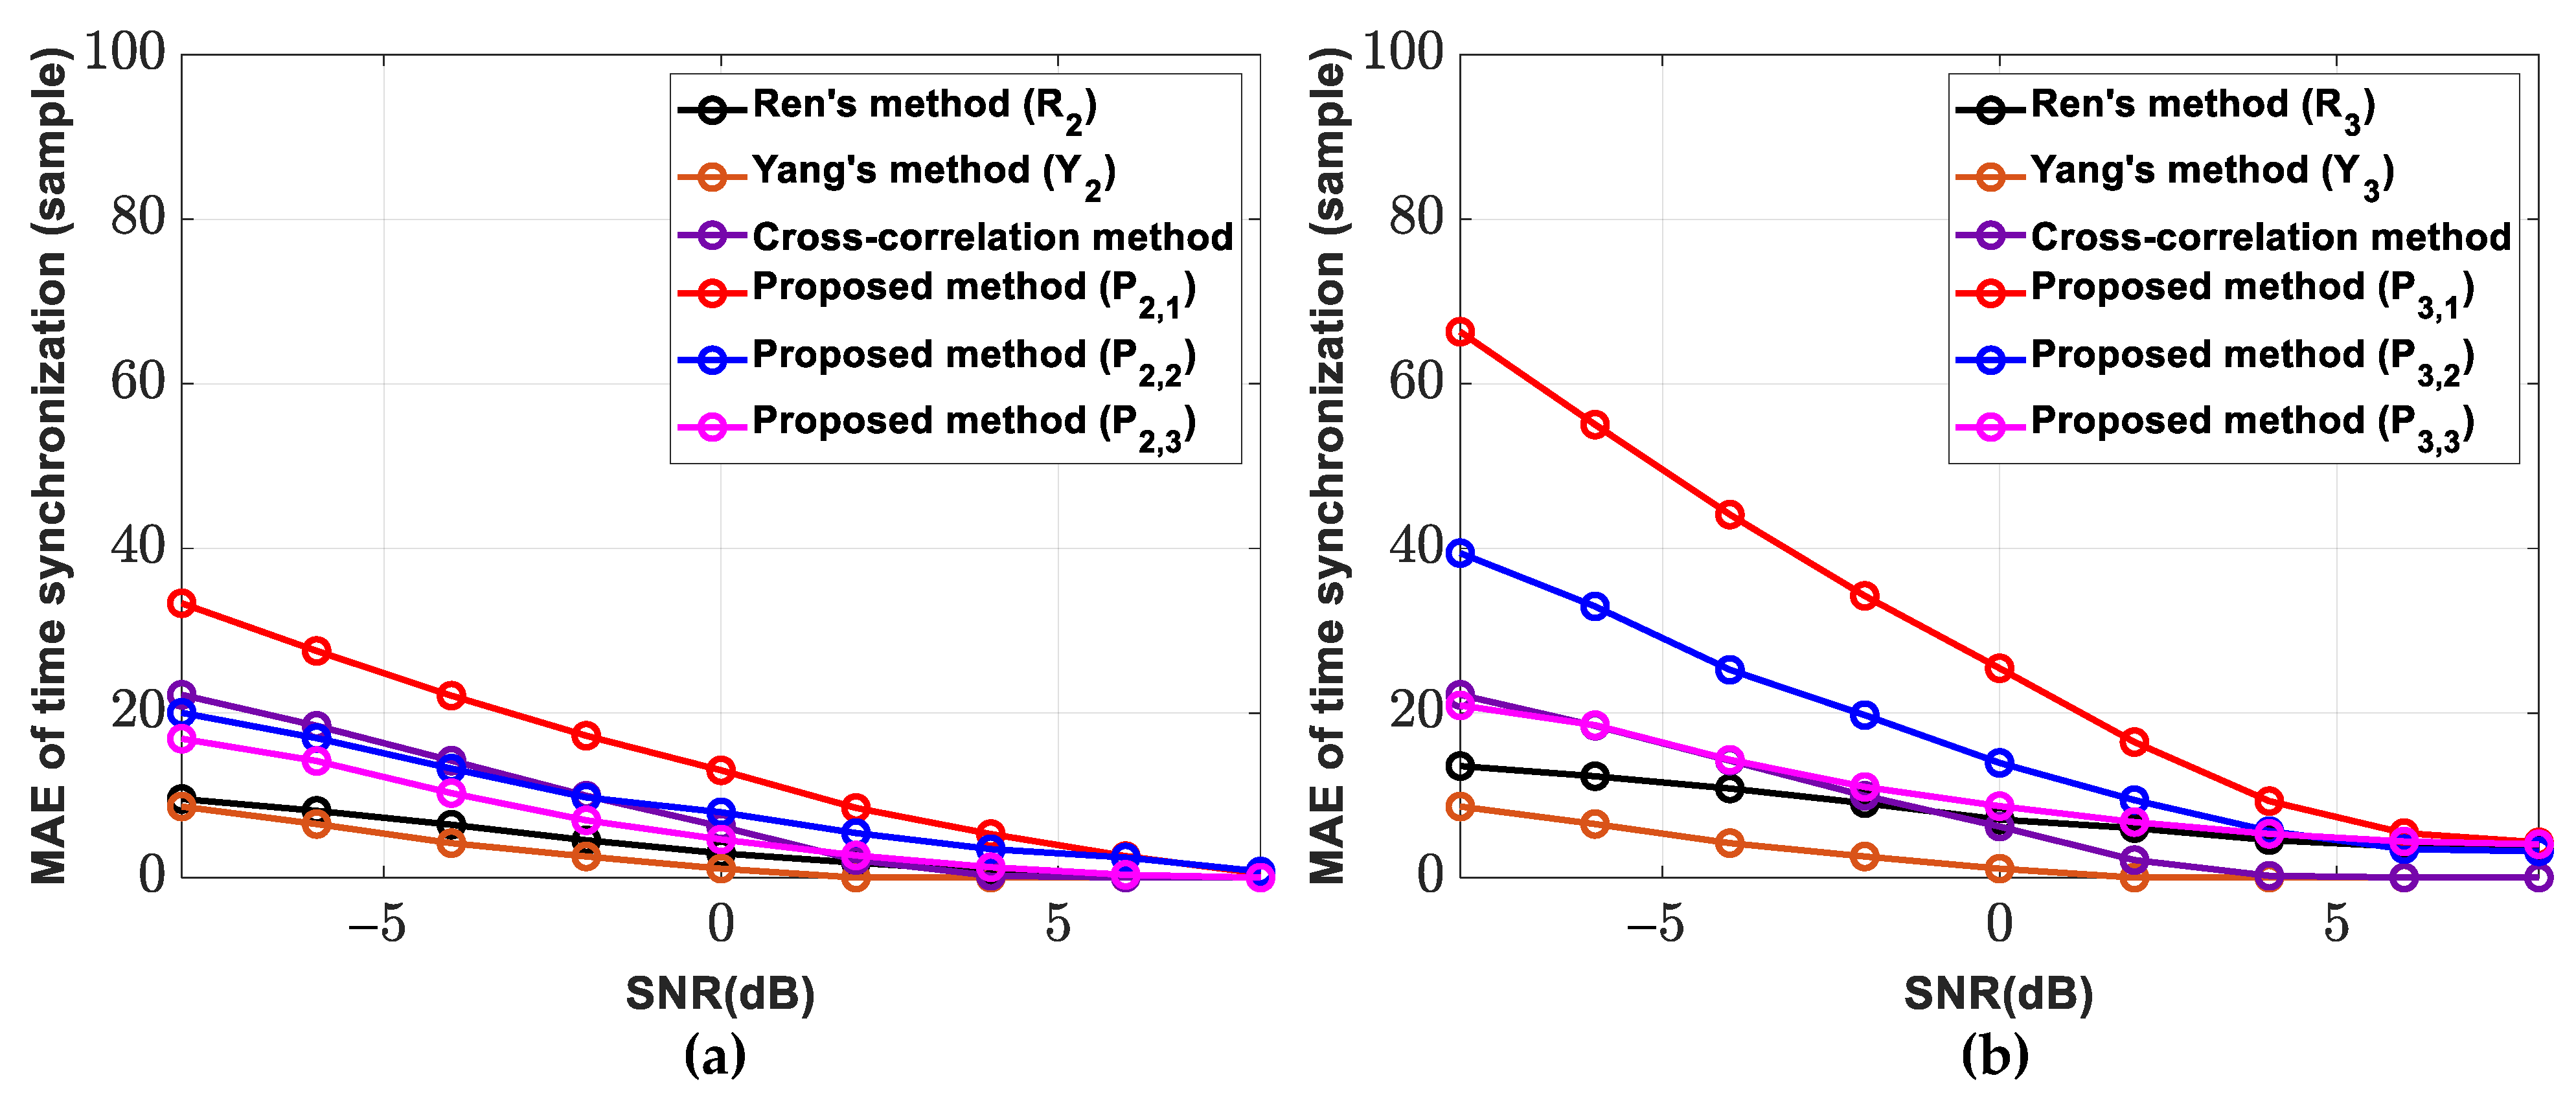
The timing synchronization performance. (a) , (b) .
Table 3.
The MAE of time synchronization @ SNR 0 dB.
In Figure 6 and Table 3, the MAEs of the proposed method showed larger errors compared to those of the conventional methods, since the proposed method had interference by the traffic data in the correlation in Equations (10) and (11). Comparing the MAE of the proposed method for different traffic data rates, the MAE decreased linearly as the traffic data rate decreased. In the cases of , and , the traffic data ratio was 100%, 50%, and 33.3%, respectively, and the MAEs of and decreased to 56.6% and 35.7% of , respectively. The MAE decreasing rates of were similar to those of .
The MAE of the timing error of the proposed method decreased linearly with the increase in the traffic data ratio. Thus, it can be inferred that reducing the amount of traffic data in the proposed method can make the time synchronization performance similar to that of conventional methods.
7.3. CFO Estimation Performance
The CFO estimation performance of the proposed method with various traffic data rates was compared with the conventional methods by MSE. Simulations were performed for both constant CFO and time-varying CFO cases to verify the performance of CFO estimation. Since CFO estimation was performed after the timing synchronization, each method performed CFO estimation with the timing error in Figure 6.
7.3.1. CFO Estimation with Constant CFO
In the CFO estimation performance comparison concerning the traffic data rate, it was assumed that all of the OFDM symbols within the data frame underwent the same CFO. Figure 7 and Table 4 show the MSEs of CFO estimation with respect to the traffic data rate.
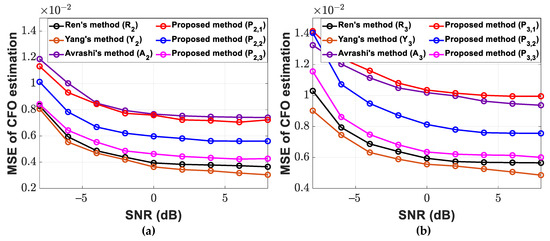
Figure 7.
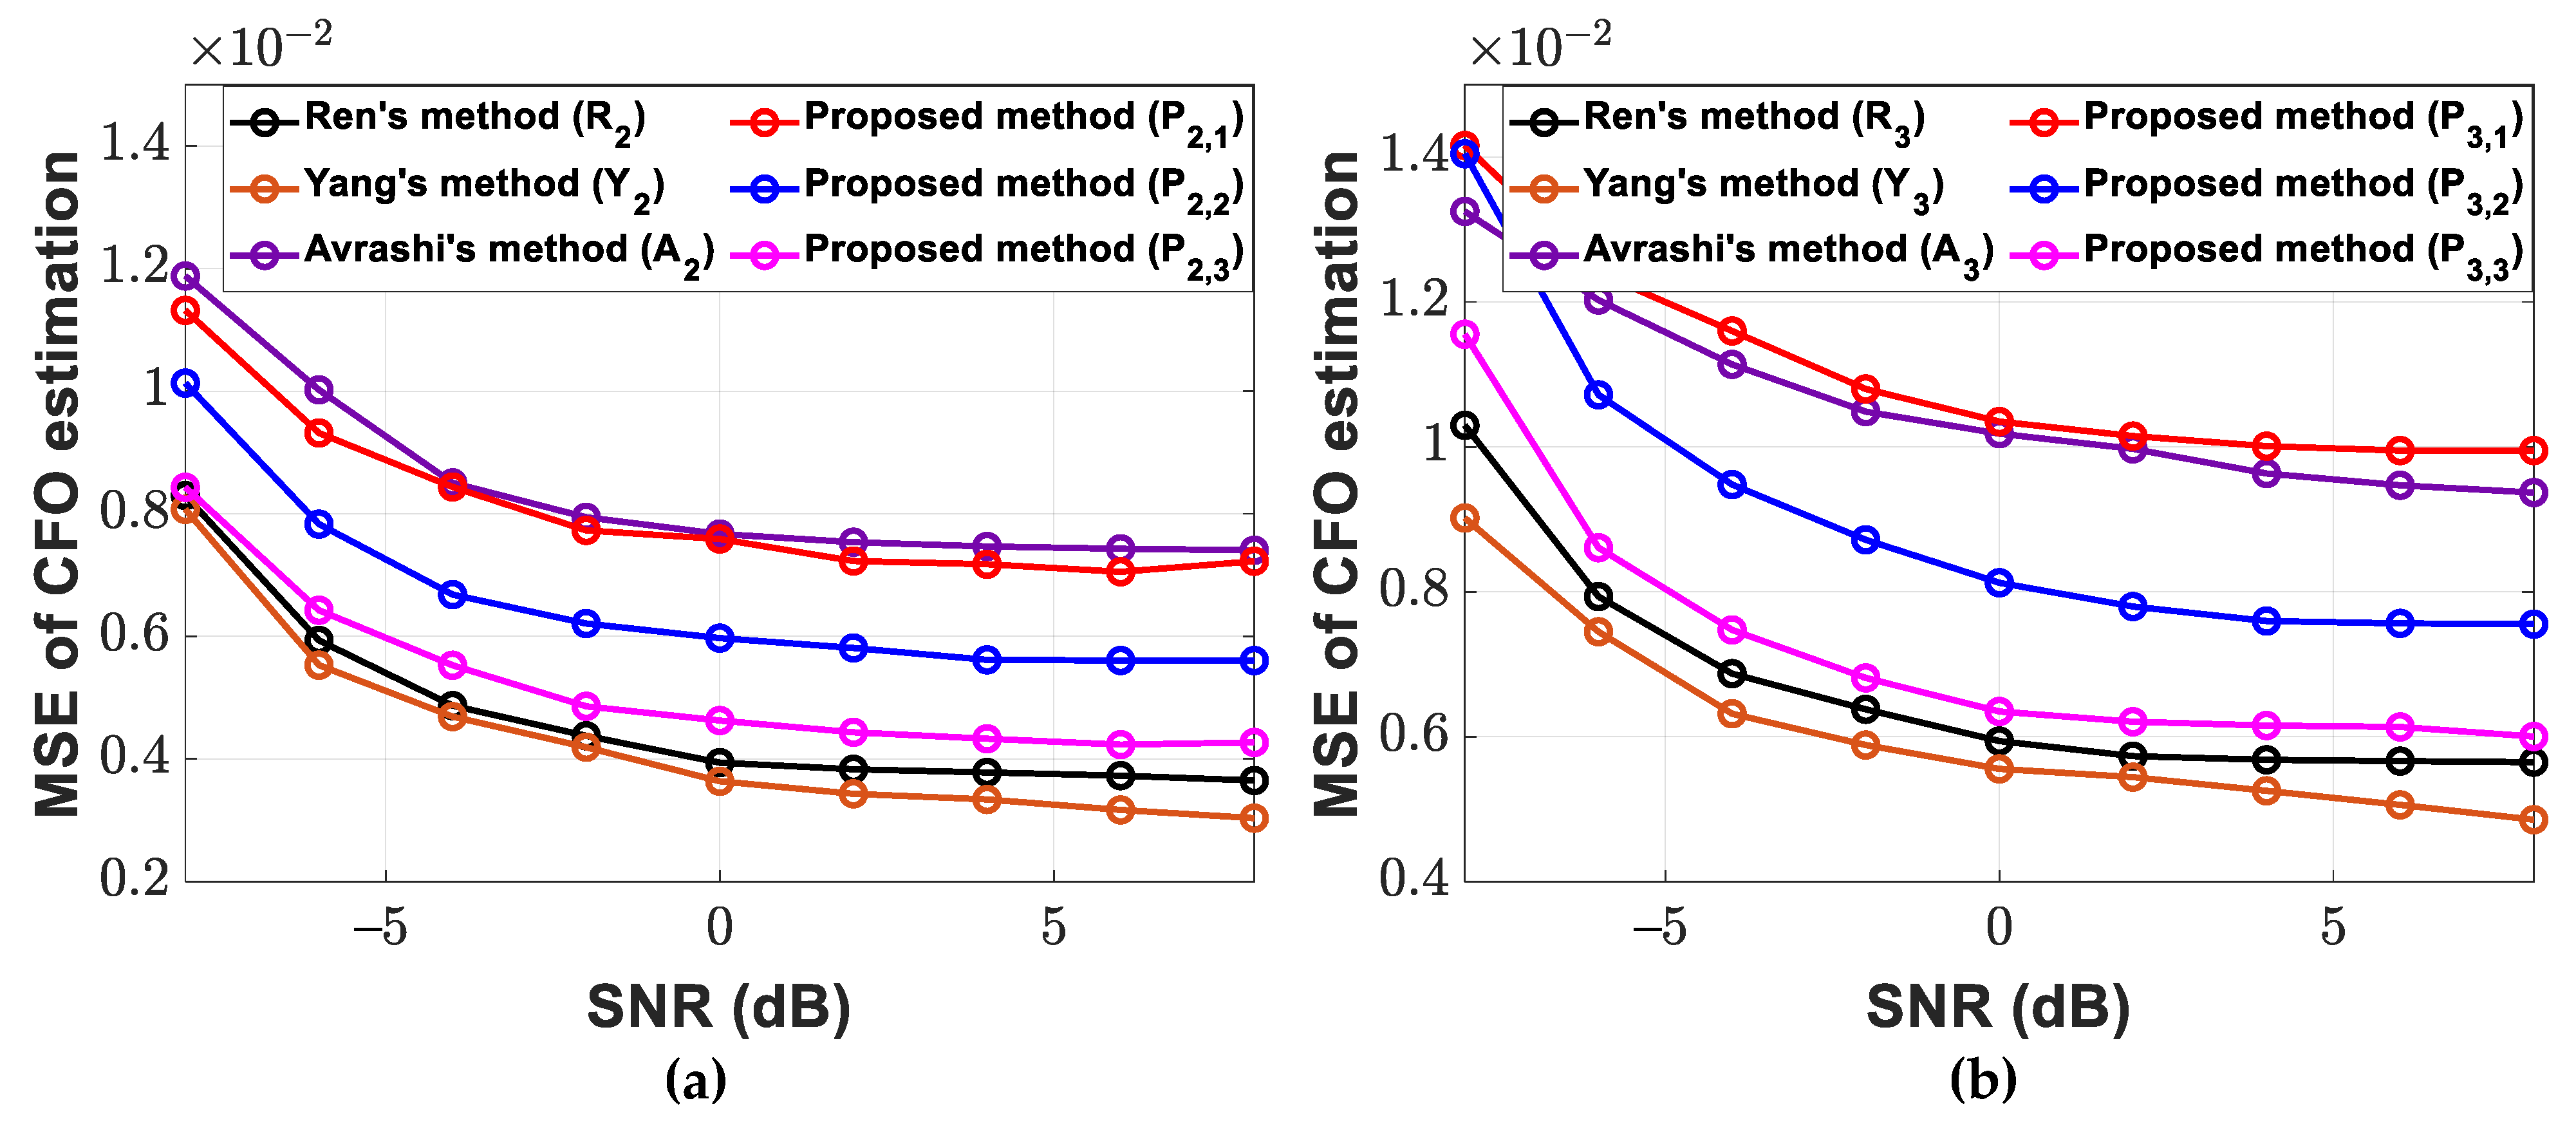
The MSE of CFO estimation according to the traffic data rate. (a) , (b) .
Table 4.
The MSE of CFO estimation with constant CFO @ SNR 0 dB.
Figure 7 and Table 4 illustrate that the MSEs of the proposed method were higher or similar to the conventional methods. This is because the proposed method was affected by the interference of the traffic data in the CFO estimation in Equation (15). When reducing the amount of traffic data, the CFO estimation performance increased compared to Avrashi’s method [29], and the performance difference between Ren’s method [15] and Yang’s method [12] decreased. When the traffic data ratio of , , and was 100%, 50%, and 33.3%, respectively, and the MSEs of and decreased to 77.6% and 60.5% of , respectively. The MSE reduction rates for were comparable to those observed for . A comparison of the MSEs of the proposed method across different traffic data rates showed a decrease in MSE as the traffic data rate increased.
The MSE of the CFO estimation of the proposed method decreased in proportion to the decrease in the traffic data rate, as shown in Section 6. Therefore, reducing the amount of traffic data in the proposed method can improve the CFO estimation performance.
7.3.2. CFO Estimation with Time-Varying CFO
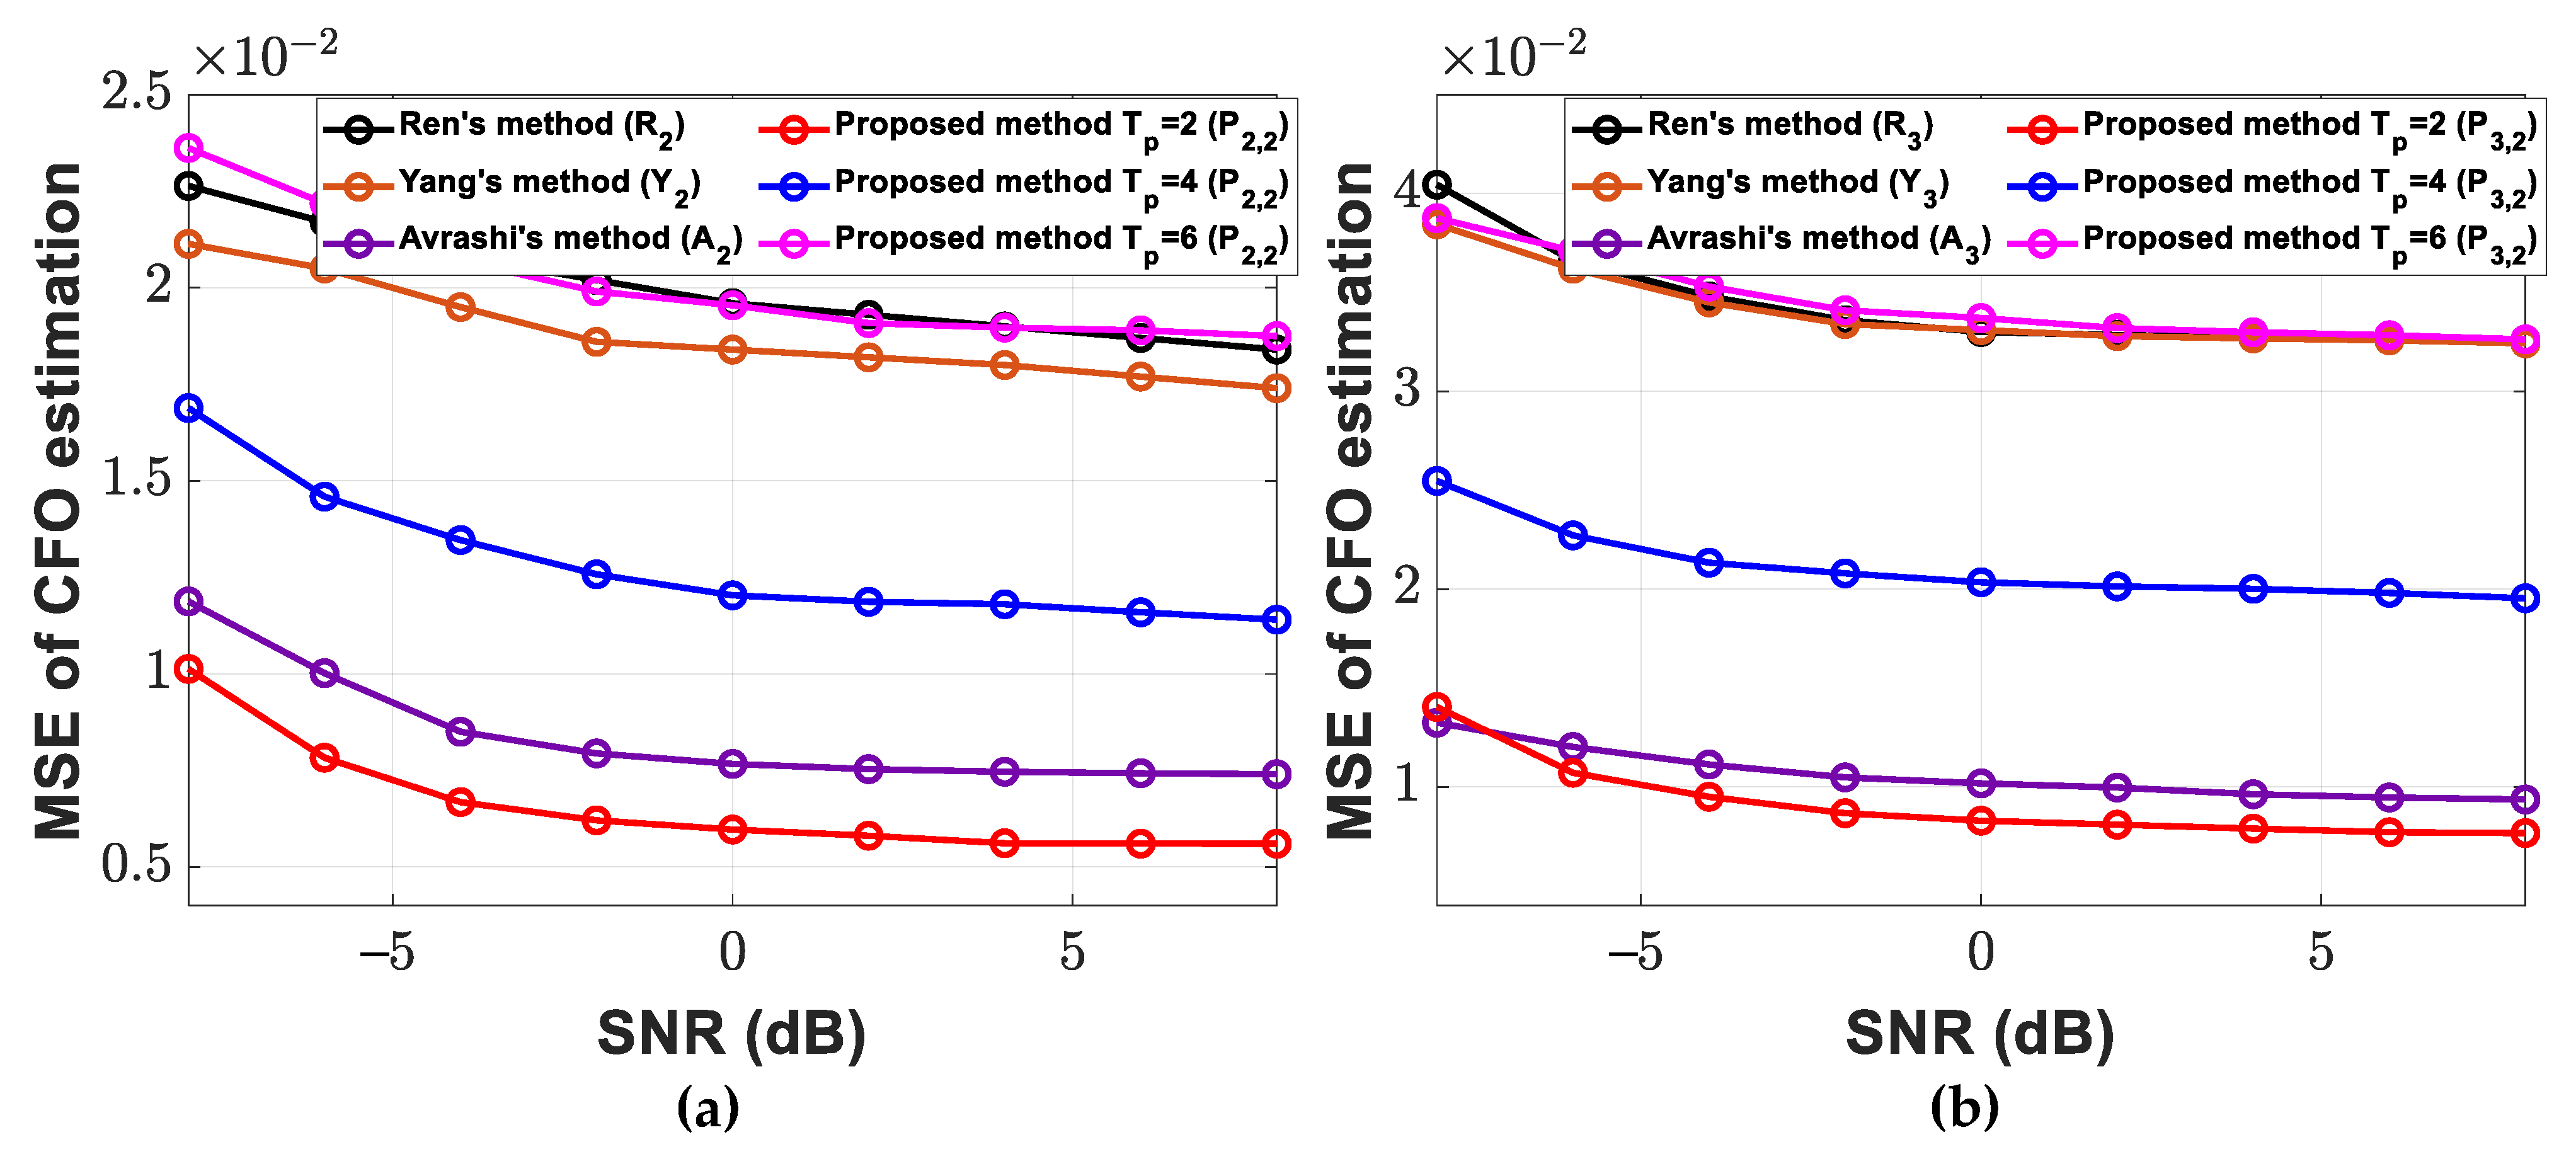
To evaluate the impact of the CFO estimation error when the CFO estimation period exceeded a coherent time (e.g., 4 and 6), we compared the MSE of the CFO estimation of the proposed method and the conventional methods for the time-varying CFO. This scenario is common in practical ocean environments. For the simulation comparing the CFO estimation performance with time-varying CFO, was set to two, four, and six, respectively. Figure 8 and Table 5 show the MSEs of CFO estimation according to 4, and 6 for and .
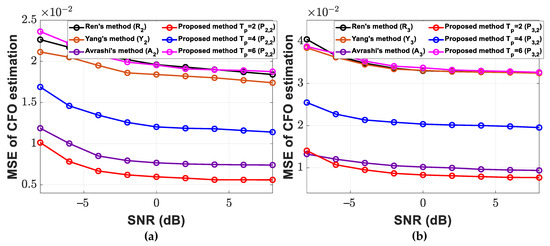
Figure 8.
The MSE of CFO estimation according to . (a) , (b) .
Table 5.
The MSE of CFO estimation with time-varying CFO @ SNR 0 dB.
In Figure 8a, when , compared to Yang’s method [12] of , the MSE of the decreased by 67.9% for , by 35.3% for , and increased by 0.1% for . In Figure 8b, when , compared to Yang’s method [12] of , the MSE for of the proposed method decreased by 75.2% for , by 38.5% for , and increased by 0.02% for . Since the proposed method estimates the CFO at each coherent time and the case of showed the lowest MSE, was used to analyze the BER performance.
Ren’s method [15] and Yang’s method [12] only transmit the first OFDM symbol of the data frame as the training symbol, which led to poor estimation performance for time-varying CFO. On the other hand, the proposed method and Avrashi’s method [29] estimated the time-varying CFO with similar MSEs of the CFO estimation. Therefore, we verified that the proposed method estimated the time-varying CFO when the OFDM symbol interval transmitting the ZCS pilot was less than or equal to the coherence time.
7.4. BER Performance
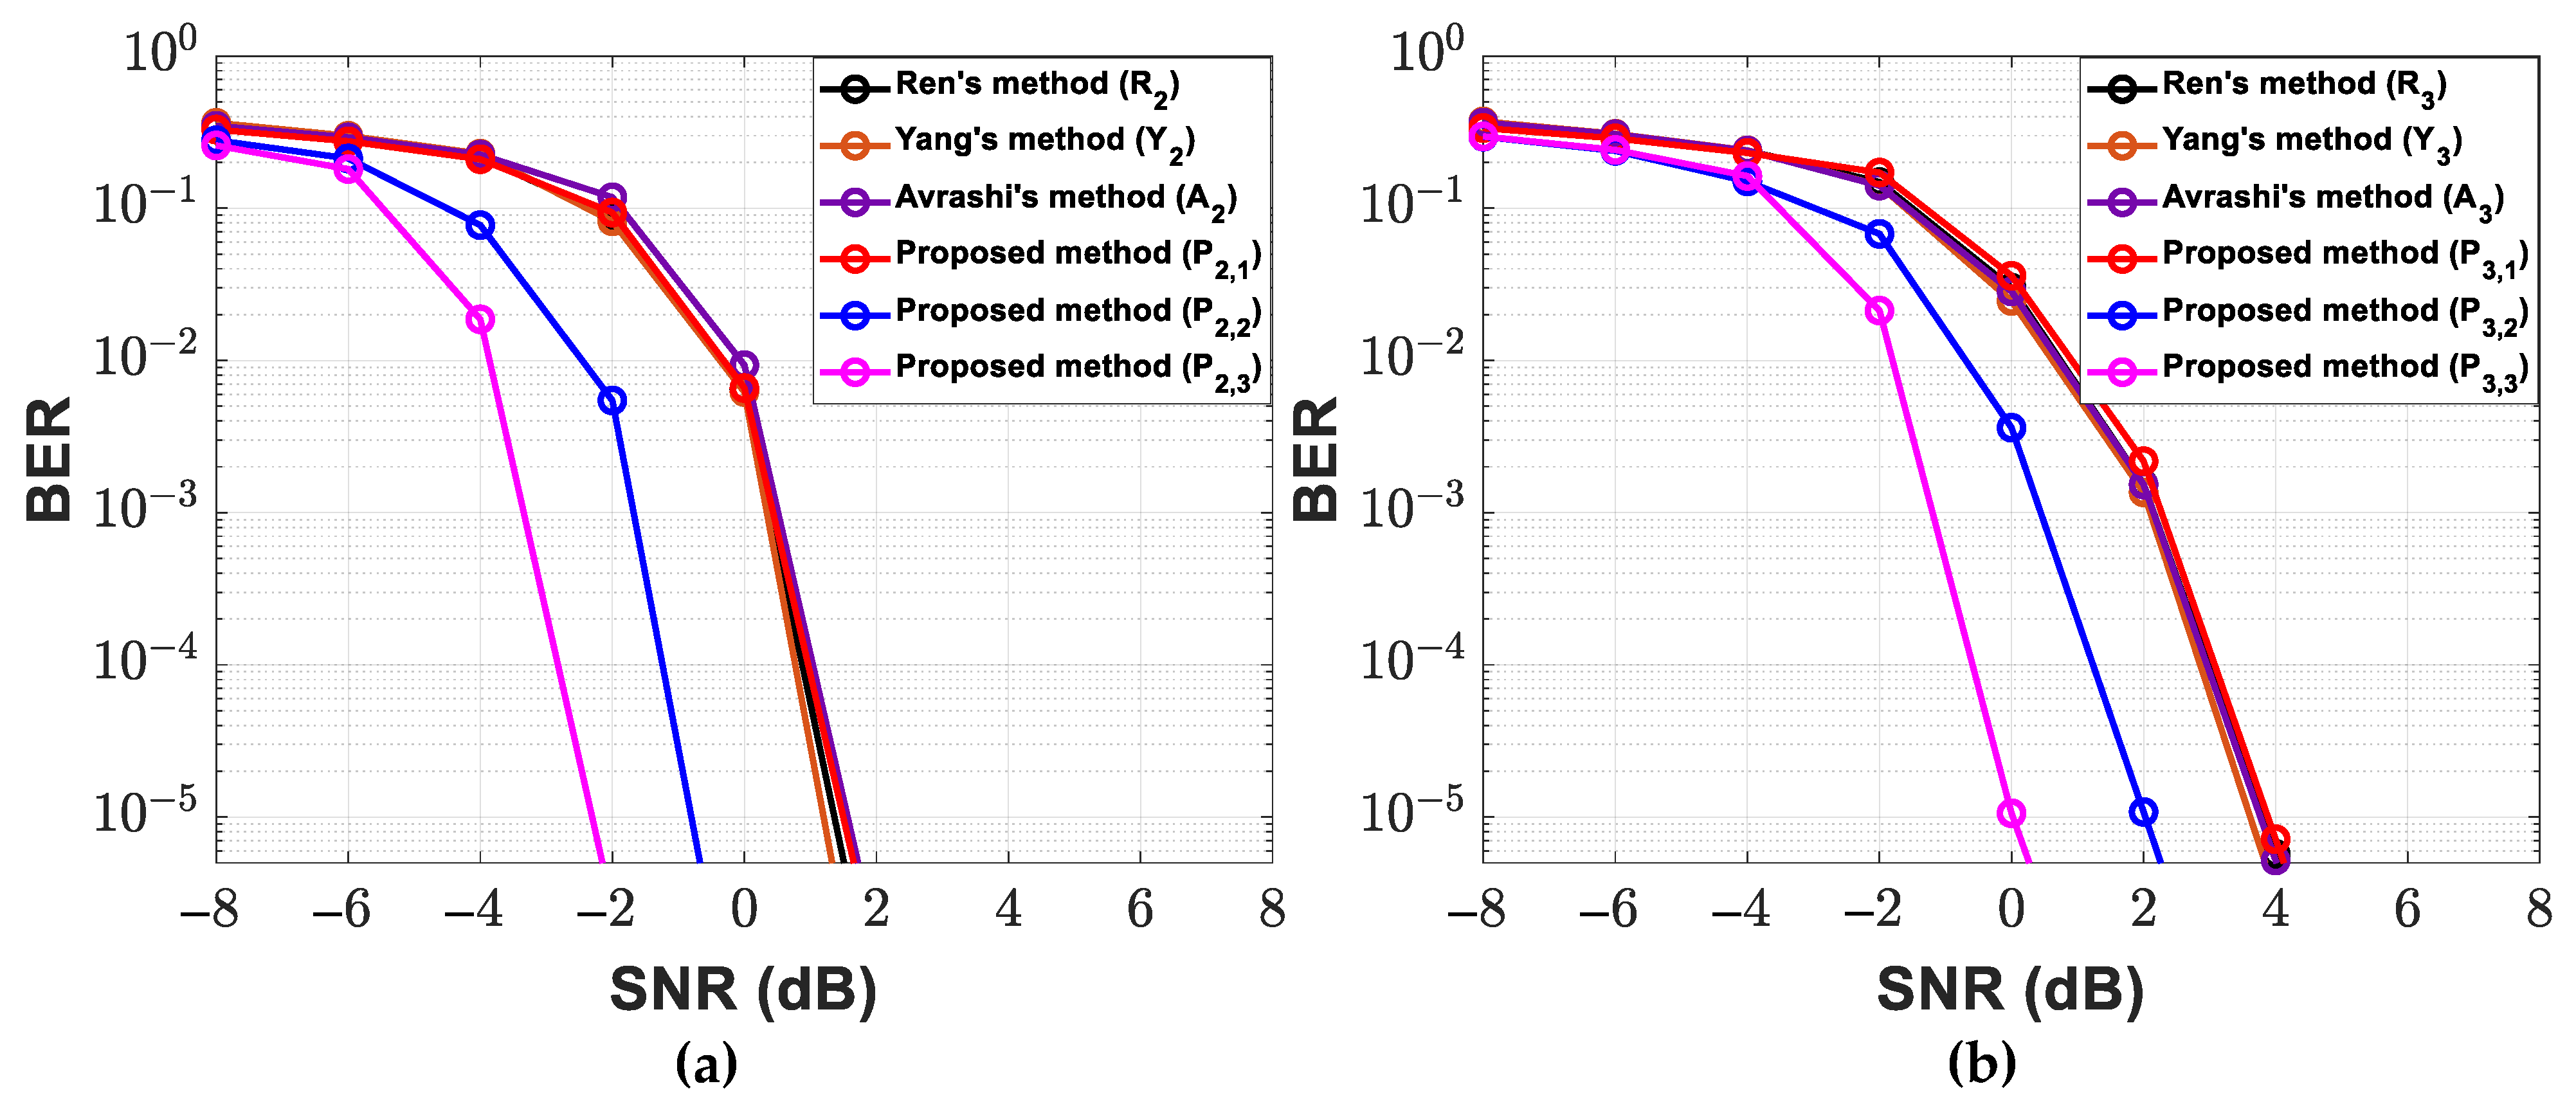
Since the proposed method estimates the CFO at each coherent time and the case of showed the lowest MSE, was used to analyze the BER performance. The BER performance according to the traffic data rate of the proposed method was compared with that of the conventional methods. Figure 9 shows the BER results according to the traffic data rate.
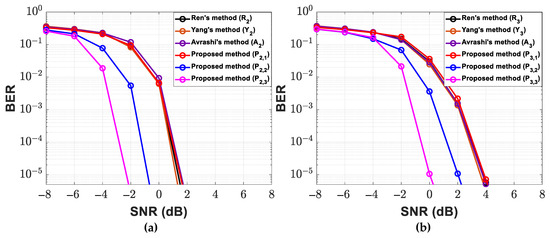
Figure 9.
The BER result according to the traffic data rate. (a) , (b) .
In Figure 9, the BER performances for the proposed methods of were similar to that of the conventional methods, and , while the proposed method achieved a 14.3% improvement in traffic data rate. Additionally, the was similar to that of the conventional method , while the proposed method achieved a 6.3% improvement in the traffic data rate. On the other hand, the traffic data rates for the proposed methods , were smaller than that of the conventional methods with 14.3% and 23.8%, respectively, while the proposed method obtained a 2 dB and 3.8 dB SNR gain in BER performance, respectively. The BER performance of was similar to .
Thus, the proposed method showed an improved traffic data rate when the BER performance was similar, and an improved BER performance when the traffic data rate was less than the conventional methods.
8. Experiment Results
The practical ocean experiment was conducted on 4 December 2023, at a location 6.42 km east of Jisepo Port in the South Sea, South Korea to verify the BER performance of the proposed method. Figure 10 and Figure 11 depict the experimental location, configuration, and the measured SSP.
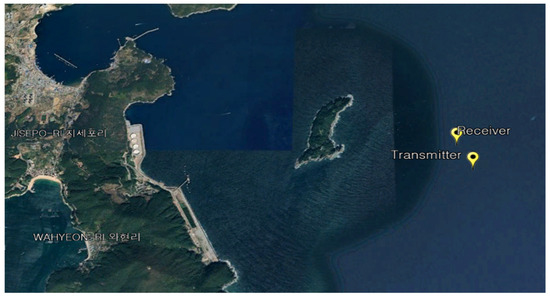
Figure 10.
Location of the ocean experiment.
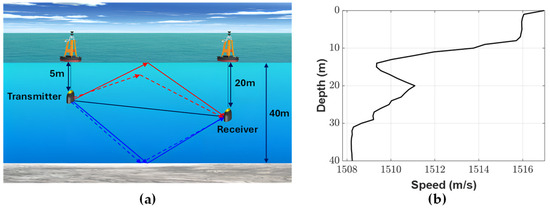
Figure 11.
Ocean experiment: (a) configuration, (b) measured SSP.
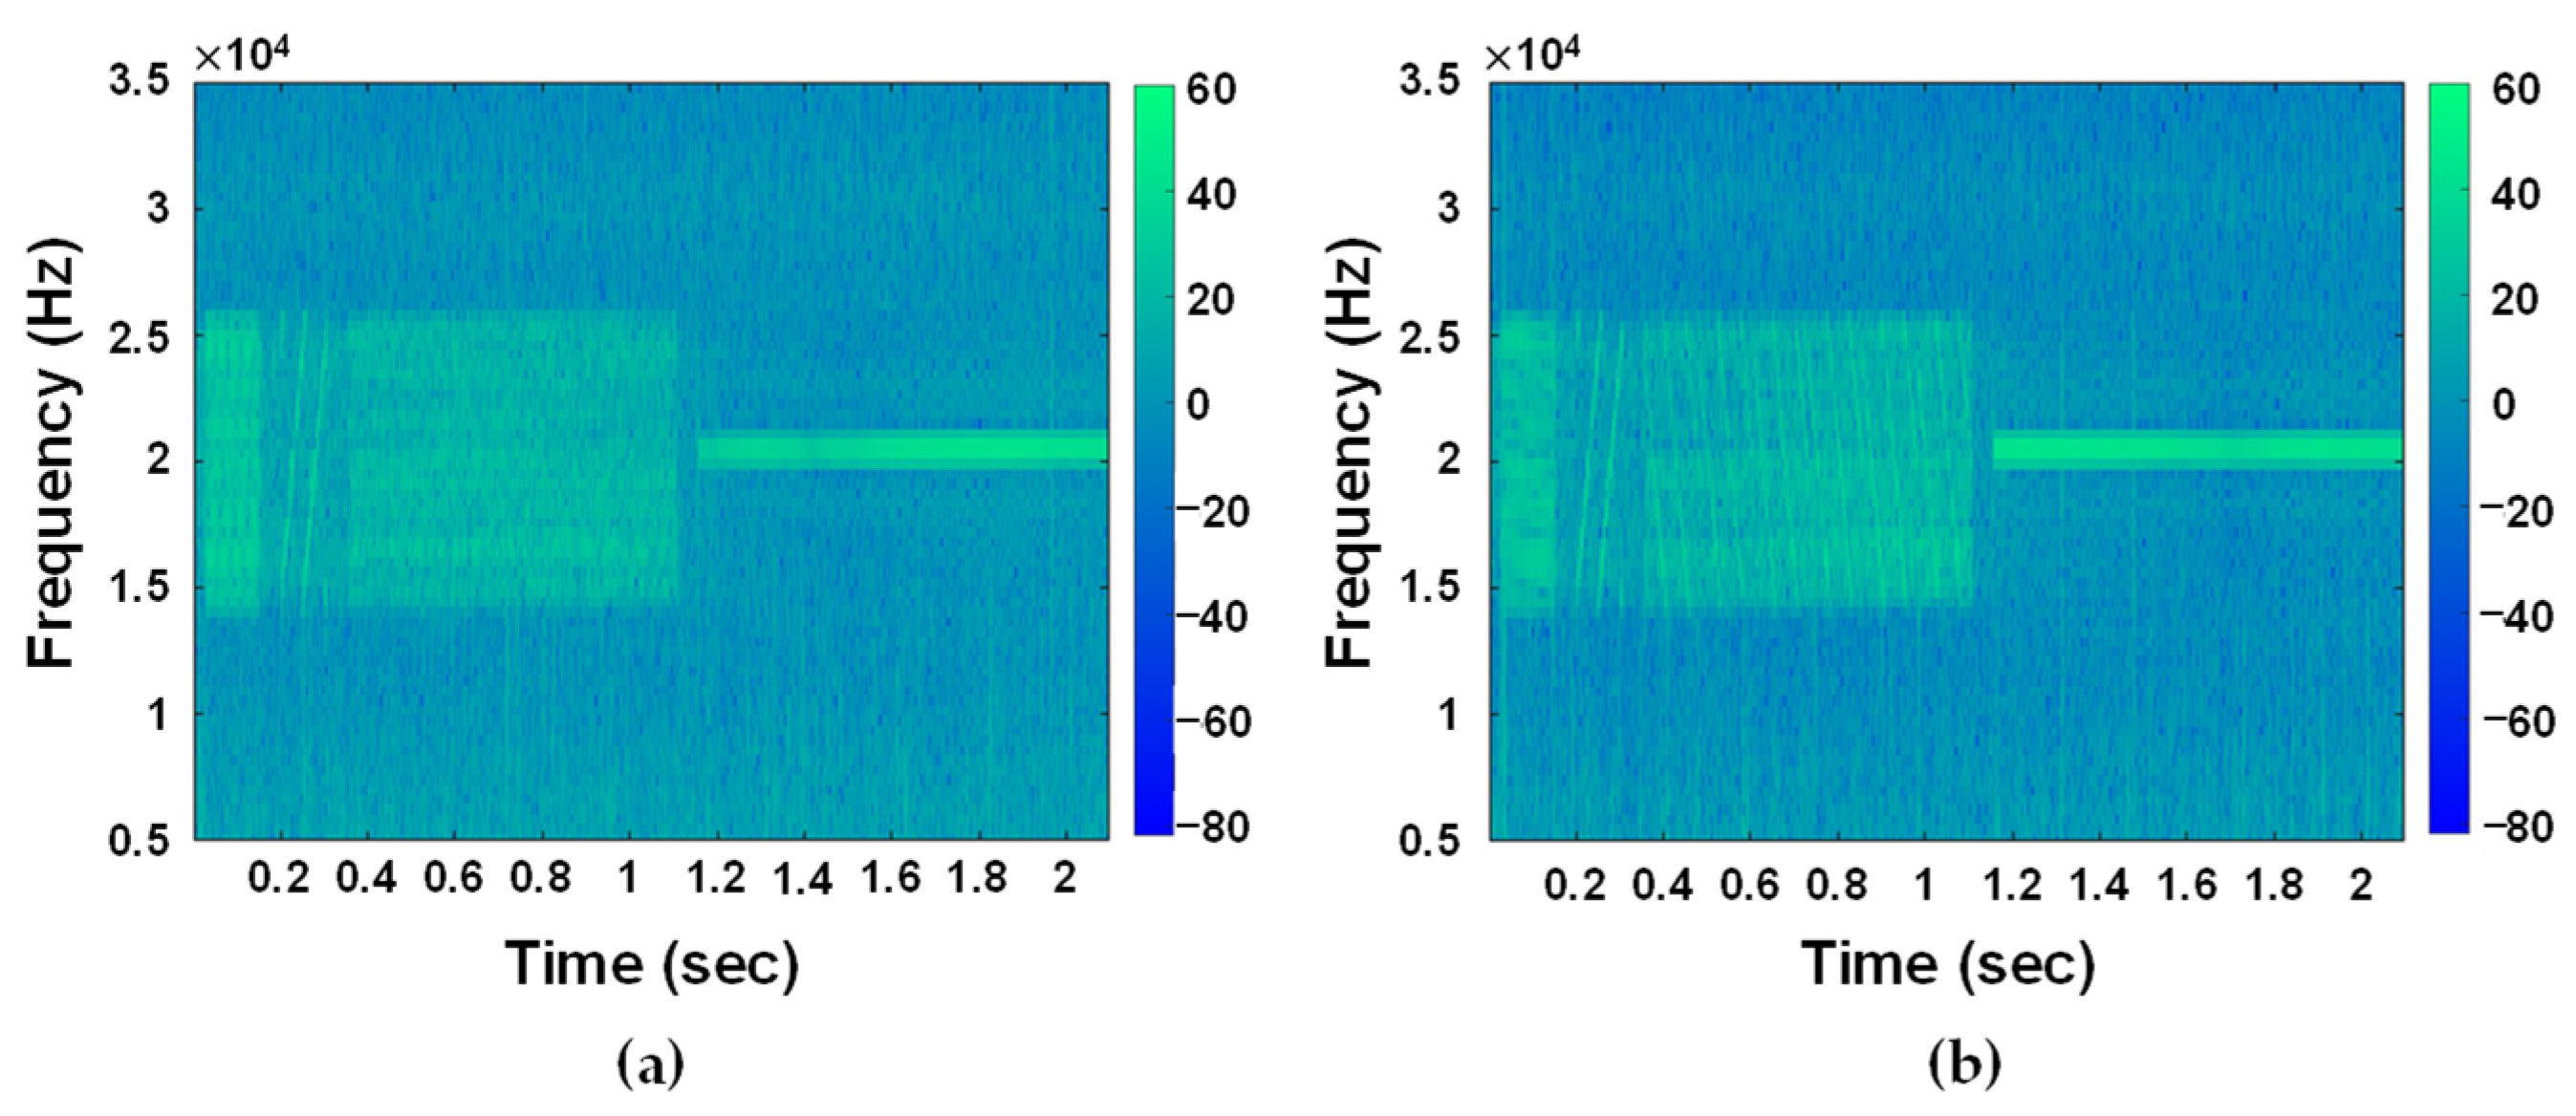
The water depth at the experimental site was 40 m. The transmitter was deployed at a depth of 5 m from the sea surface and used a Neptune-D17BB with a frequency range of 14 kHz to 26 kHz. The receiver was deployed at a depth of 20 m from the sea surface and used a TC4032. The SSP was measured manually by lowering it to the seafloor using a Valeport miniSVP. The wind was 5.3 m/s to the southwest, the temperature was 27.4 °C, and the water temperature was about 28.5 °C. The parameters for the OFDM signals used in the ocean experiment were the same as those listed in Table 1. The additional ZCS and a single tone were transmitted for frame detection and Doppler shift frequency estimation, respectively. Figure 12 shows the spectrogram of the received signal.
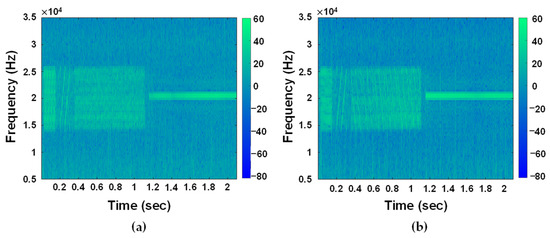
Figure 12.
Spectrogram of received signals. (a) Conventional method, (b) proposed method.
The estimated SNR and estimated maximum Doppler frequency of the data frames received from the practical ocean experiment are shown in Figure 13.
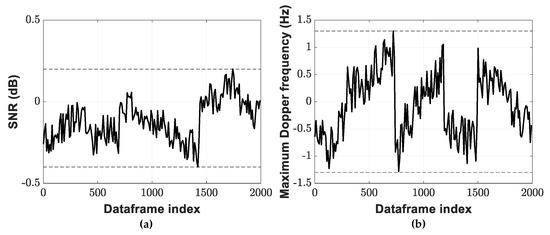
Figure 13.
Ocean experiment parameter. (a) Estimated SNR, (b) estimated maximum Doppler frequency.
The estimated SNR ranges of the ocean experiment were from about −0.4 to 0.2 dB. In the practical ocean experiment, the flow of water caused a variation in transmitter and receiver positions, and the Doppler shift frequency was estimated to vary, as shown in Figure 13b. The estimated maximum Doppler shift frequency was 1.3 Hz, resulting in a coherent time of 325.4 ms, which exceeded the length of two OFDM symbols of 250 ms. Table 6 and Table 7 show the traffic data rate, the MSE of the CFO estimation, and the BER of the maritime experiment results for and
Table 6.
Ocean experiment results ().
Table 7.
Ocean experiment results ().
The MSEs and BERs of the practical ocean experimental results in Table 6 and Table 7 were similar to those at the SNR of 0 dB by the simulation results in Figure 7 and Figure 9. In Table 6, when the traffic data rate of the conventional method was 3570 with the BER of 0.0064, the proposed method with the greater traffic data rate of 4080 showed a similar BER of 0.0065. On the other hand, when the traffic data rate decreased by 3060, the BER decreased by 0, which improved the BER performance.
Therefore, similar to the simulation result, the ocean experiment results showed an improved traffic data rate when the BER performance was similar, and an improved BER performance when the traffic data rate was less than the conventional methods.
9. Conclusions
This paper proposed a novel ZCS pilot-based OFDM method for time and frequency synchronization to improve the BER performance and traffic data rate in UWA OFDM systems. The proposed method utilized the ZCS as the pilot and transmitted pilot and traffic data simultaneously to improve the traffic data rate while estimating the CFO at each coherence time. The relationship between the interference and correlation performance of ZCS depending on the amount of traffic data was analyzed theoretically and verified by simulation. The computer simulation evaluated the time synchronization performance, CFO estimation performance, and BER performance of the proposed method according to the traffic data rate. Compared to the conventional methods, the BER performance of the proposed method showed a 6.3% to 14.3% increase in traffic data rate for a similar BER performance and a 2 dB to 3.8 dB SNR gain with a 14.3% to 23.8% traffic data rate decrease. Therefore, the proposed ZCS pilot-based OFDM method demonstrated improved traffic data rates when the BER performance was similar, and an improved BER performance when the traffic data rate was lower than that of the conventional method.
Author Contributions
Conceptualization, S.S.; Methodology, S.S.; Software, S.S.; Validation, S.S.; Formal analysis, S.S.; Investigation, S.S.; Resources, S.S.; Data curation, S.S., Y.K., and M.K.; Writing—original draft preparation, S.S.; Writing—review and editing, J.C.; Visualization, S.S; Supervision, J.C.; Project administration, S.S and J.C. All authors have read and agreed to the published version of the manuscript.
Funding
This work was supported by the INHA UNIVERSITY Research Grant (2024).
Data Availability Statement
Data are contained within the article.
Conflicts of Interest
The authors declare no conflicts of interest.
References
- Ahammed, T.B.; Patgiri, R.; Nayak, S. A vision of the artificial intelligence for 6G communication. ICT Express 2023, 9, 197–210. [Google Scholar] [CrossRef]
- Guo, J.; Guo, T.; Li, M.; Wu, T.; Lin, H. Underwater-Acoustic-OFDM Channel Estimation Based on Deep Learning and Data Augmentation. Electronics 2024, 13, 689. [Google Scholar] [CrossRef]
- Su, X.; Ullah, I.; Liu, X.; Choi, D. A review of underwater localization techniques, algorithms, and challenges. J. Sens. 2020, 2020, 6403161. [Google Scholar] [CrossRef]
- Ullah, I.; Chen, J.; Su, X.; Esposito, C.; Choi, C. Localization and detection of targets in underwater wireless sensor using distance and angle based algorithms. IEEE Access 2019, 7, 45693–45704. [Google Scholar] [CrossRef]
- Kim, Y.C.; Seol, S.H.; Chung, J.H.; Lee, H.J. CRGAN-based turbo code interleaver for underwater acoustic communications. ICT Express 2024, 10, 498–506. [Google Scholar] [CrossRef]
- Stojanovic, M. Recent advances in high-speed underwater acoustic communications. IEEE J. Ocean. Eng. 1996, 21, 125–136. [Google Scholar] [CrossRef]
- Schmidl, T.M.; Cox, D.C. Robust frequency and timing synchronization for OFDM. IEEE Trans. Commun. 1997, 45, 1613–1621. [Google Scholar] [CrossRef]
- Minn, H.; Bhargava, V.; Letaief, K. A robust timing and frequency synchronization for OFDM systems. IEEE Trans. Wirel. Commun. 2003, 2, 822–839. [Google Scholar] [CrossRef]
- Park, H.; Cheon, H.; Kang, C.; Hong, D. A novel timing estimation method for OFDM systems. IEEE Commun. Lett. 2003, 7, 239–241. [Google Scholar] [CrossRef]
- Morelli, M.; Mengali, U. An improved frequency offset estimator for OFDM applications. IEEE Commun. Lett. 1999, 3, 75–77. [Google Scholar] [CrossRef]
- Peng, G.; Li, R.; He, Y.; Han, Z. Timing and frequency synchronization using CAZAC sequences for OFDM systems. Sensors 2023, 23, 3168. [Google Scholar] [CrossRef] [PubMed]
- Yang, C.; Wang, L.; Peng, C.; Zhang, S.; Cui, Y.; Ma, C. A robust time-frequency Synchronization method for underwater acoustic OFDM communication systems. IEEE Access 2024, 12, 21908–21920. [Google Scholar] [CrossRef]
- Seol, S.H.; Ahn, J.M.; Lee, H.J.; Kim, Y.C.; Chung, J.H. SSP based underwater CIR estimation with S-BiFPN. ICT Express 2022, 8, 44–49. [Google Scholar] [CrossRef]
- Chu, D. Polyphase codes with good periodic correlation properties (Correps.). IEEE Trans. Inf. Theory 1972, 18, 531–532. [Google Scholar] [CrossRef]
- Hsieh, M.-H.; Wei, C.-H. A low-complexity frame synchronization and frequency offset compensation scheme for OFDM systems over fading channels. IEEE Trans. Veh. Technol. 1999, 48, 1596–1609. [Google Scholar] [CrossRef]
- Ma, X.; Giannakis, G.B.; Barbarossa, S. Non-data-aided frequency-offset and channel estimation in OFDM and related block transmissions. In Proceedings of the ICC 2001, Helsinki, Finland, 11–14 June 2001; Volume 6, pp. 1866–1870. [Google Scholar]
- Jung, Y.A.; Byun, S.B.; Shin, H.J.; Han, D.C.; Cho, S.H.; Lee, S.H. Frequency and symbol timing offset estimation method for CP-OFDM based system. In Proceedings of the ICTC 2021, Jeju Island, Republic of Korea, 20–22 October 2021; pp. 599–601. [Google Scholar]
- Yuan, L.; Mu, P.; Zhou, A. Carrier frequency offset-based OFDM synchronization technology. In Proceedings of the AEECA 2-22, Dalian, China, 20–21 August 2022; pp. 30–33. [Google Scholar]
- Li, B.; Zhou, S.; Stojanovic, M.; Freitag, L.; Willett, P. Multicarrier communication over underwater acoustic channels with nonuniform Doppler shifts. IEEE J. Ocean. Eng. 2008, 33, 198–209. [Google Scholar]
- Abdelkareem, A.E.; Sharif, B.S.; Tsimenidis, C.C. Adaptive time varying Doppler shift compensation algorithm for OFDM-based underwater acoustic communication systems. Ad Hoc Netw. 2016, 45, 104–119. [Google Scholar] [CrossRef]
- Meng, Y.; Zhang, W.; Stüber, G.L.; Wang, W. Blind fast CFO estimation and performance analysis of OFDM. IEEE Trans. Veh. Technol. 2020, 69, 11501–11514. [Google Scholar] [CrossRef]
- Li, S.S.; Phoong, S.-M. Blind estimation of multiple carrier frequency offset in OFDMA uplink system employing virtual carriers. IEEE Access 2020, 8, 2915–2923. [Google Scholar] [CrossRef]
- Khuong, N.Q.; Du, H.N.; Luu, N.-M.; Huy, N.V.; Duc, N.V. Joint time and frequency synchronization for OFDM systems over underwater acoustic channels. In Proceedings of the ATC 2023, Da Nang, Vietnam, 19–21 October 2023; pp. 6–11. [Google Scholar]
- Wang, Z.; Zhang, H.; Wang, Z.; Xie, Z.; Zhou, W. Application of a time-frequency synchronization method in DFT-precoded underwater acoustic OFDM system. In Proceedings of the ICCC 2021, Chengdu, China, 10–13 December 2021; pp. 335–339. [Google Scholar]
- Wang, Y.; Tao, J.; Ma, L.; Jiang, M.; Chen, W. Joint time and frequency synchronization for OFDM underwater acoustic communications. In Proceedings of the ICCC Workshops 2021, Xiamen, China, 28–30 July 2021; pp. 272–277. [Google Scholar]
- Amar, A.; Avrashi, G.; Stojanovic, M. Low complexity residual Doppler shift estimation for underwater acoustic multicarrier communication. IEEE Trans. Signal Process. 2017, 65, 2063–2076. [Google Scholar] [CrossRef]
- Avrashi, G.; Amar, A.; Stojanovic, M.; Cohen, I. Eigenvalue decomposition based estimators of carrier frequency offset in multicarrier underwater acoustic communication. In Proceedings of the ICASSP 2017, New Orleans, LA, USA, 5–9 March 2017; pp. 3534–3538. [Google Scholar]
- Avrashi, G.; Amar, A.; Cohen, I. Time-varying carrier frequency offset estimation in OFDM underwater acoustic communication. Singal Process. 2022, 190, 108299. [Google Scholar] [CrossRef]
- Ren, G.; Chang, Y.; Zhang, H.; Zhang, H. Synchronization method based on a new constant envelop preamble for OFDM systems. IEEE Trans. Broadcast. 2005, 51, 139–143. [Google Scholar] [CrossRef]


Disclaimer/Publisher’s Note: The statements, opinions and data contained in all publications are solely those of the individual author(s) and contributor(s) and not of MDPI and/or the editor(s). MDPI and/or the editor(s) disclaim responsibility for any injury to people or property resulting from any ideas, methods, instructions or products referred to in the content. |
© 2024 by the authors. Licensee MDPI, Basel, Switzerland. This article is an open access article distributed under the terms and conditions of the Creative Commons Attribution (CC BY) license (https://creativecommons.org/licenses/by/4.0/).