Abstract
The deployment of 5G technology has drawn attention to different computer-based scenarios. It is useful in the context of Smart Cities, the Internet of Things (IoT), and Edge Computing, among other systems. With the high number of connected vehicles, providing network security solutions for the Internet of Vehicles (IoV) is not a trivial process due to its decentralized management structure and heterogeneous characteristics (e.g., connection time, and high-frequency changes in network topology due to high mobility, among others). Machine learning (ML) algorithms have the potential to extract patterns to cover security requirements better and to detect/classify malicious behavior in a network. Based on this, in this work we propose an Intrusion Detection System (IDS) for detecting Flooding attacks in vehicular scenarios. We also simulate 5G-enabled vehicular scenarios using the Network Simulator 3 (NS-3). We generate four datasets considering different numbers of nodes, attackers, and mobility patterns extracted from Simulation of Urban MObility (SUMO). Furthermore, our conducted tests show that the proposed IDS achieved F1 scores of 1.00 and 0.98 using decision trees and random forests, respectively. This means that it was able to properly classify the Flooding attack in the 5G vehicular environment considered.
1. Introduction
The efforts of industry and academia to find solutions to urban traffic problems (such as traffic congestion, cargo theft, and optimized public transportation, among others) have allowed vehicles to become more than just transportation machines [1]. Modern vehicles are equipped with novel communication devices (e.g., wireless antenna and cellular technology) that make it possible to communicate with surrounding vehicles, send and receive messages, and access remote applications through an Internet connection. Regarding cellular technology, vehicles commonly use 4G/LTE (Long Term Evolution) or 5G (fifth-generation mobile network). Some studies have already considered the forthcoming 6G [2] in the vehicular context.
The vehicular network, initially referenced as Vehicular Ad hoc Network (VANET), has evolved into the Internet of Vehicles (IoV) [3] as a result of its integration with other technologies, namely the Internet of Things (IoT) [4]. Furthermore, IoV has different types of communication: Vehicle to Vehicle (V2V), Vehicle to Infrastructure (V2I), Vehicle to Sensor (V2S), Vehicle to Roadside Unit (V2R), Vehicle to Pedestrian (V2P), and Vehicle to Everything (V2X) [5]. They have called attention to the security requirements, since each communication type can require different layers of security mechanisms. Figure 1 shows an overview of the different kinds of vehicular communications, where other technologies can also be integrated, namely, cloud and edge computing [6].
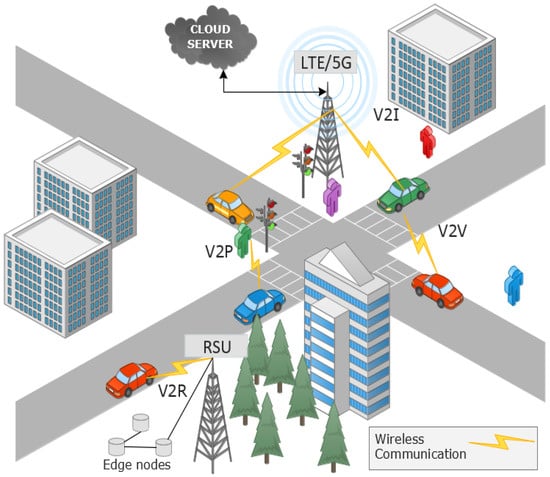
Figure 1.
An example of a vehicular network environment.
Although vehicles have fewer computing resources (e.g., processing power or storage) than traditional computers, they have caught the attention of malicious users who can adapt the methodology of computer-based attacks (e.g., Denial-of-Service (DoS) [7], Sybil [8], Jamming [9], Fuzzy [10], Spoofing [11], and Eavesdropping [12], among others) to vehicular networks. In addition, vehicular networks have the potential to generate valuable data from their users (e.g., tracking vehicles’ routes, Global Position System (GPS) coordinates, vehicles’ identity, or most visited places) that can also be valuable for malicious users. On the other hand, providing/adapting network security tools for IoV is not a trivial task due to its characteristics, which cannot be ignored, such as rapid network topology change, nodes with high mobility, and small connection duration.
Machine Learning (ML) algorithms have been explored to maximize the potential of identifying malicious users and network security breaches. However, in the IoV context, the use of ML-based solutions faces a crucial challenge: finding publicly available network datasets. The ML model would be trained with data extracted from real vehicular testbed in an ideal model-building process scenario. However, generating datasets with real data is challenging because public sources are not widely available. Nonetheless, there are well-known vehicular network simulators that are publicly available to create private and public datasets such as Network Simulator 3 (NS-3) [13] and Veins [14].
Network security tools use different strategies for identifying malicious activities, where ML algorithms can help them to increase the detection rate. An Intrusion Detection System (IDS) is a good example of a security tool that merges its functionalities with ML algorithms. For this purpose, the right choice of vehicular network datasets represents an important step in correctly labelling malicious behaviors in such a vehicular scenario.
Availability is one of the third pillars of data and information security. The other two are confidentiality and integrity. As aforementioned, some attacks can cause network disruption, especially the Flooding attack. By performing this attack, malicious vehicles can stop legitimate messages from reaching their destination on the network. Furthermore, this attack can also lengthen the time for receiving useful messages, such as those sent by vehicular safety applications requiring low latency. Based on this problem, in our work we developed an IDS that uses ML algorithms to detect the Flooding attack in 5G-enabled vehicular networks.
Our contributions are the following:
- We propose four new labelled datasets of 5G-enabled vehicular networks with 16 features, which have Flooding attack characteristics.
- We build a decision tree model that outperforms (e.g., accuracy, precision, recall, and F1) some works that use more complex ML algorithms.
The remainder of the work is organized as follows. Section 2 presents the background and related work. In Section 3, we present the vehicular scenarios used to generate our datasets. Section 4 presents our experimental setup and Section 5 reports the obtained results. Finally, Section 6 concludes the paper.
2. Background and Related Work
Conducting cyber-attacks on vehicular networks can compromise the entire communication structure between vehicles, by interrupting vehicles from receiving safety messages or by consuming network resources such as bandwidth, hence putting human lives at risk [15]. The lack of security mechanisms for vehicles can cause chaos in a city, where stopping 20% of the vehicles during heavy traffic would be enough for this disaster to occur [16]. Different studies have been conducted by the scientific community bearing in mind the seriousness of this threat [17,18]. The dynamic nature of these networks presents characteristics that cannot be ignored, such as high mobility, the number of vehicles in a given area, and connection time [19].
Attacks on in-vehicle communications, such as espionage, injection, bus-off, and DoS attacks, aim to cause Engine Control Unit (ECU) malfunctions [20]. The ECU provides different services for passengers, such as entertainment, system information, import of multimedia content, etc. For instance, an attack of espionage occurs when an attacker can access the vehicle’s messages, where through the Controller Area Network (CAN) patterns are identified in the legitimate messages exchanged. Since CAN messages are not authenticated, the injection attack enables attackers to access the vehicle through On-Board Diagnostic II (OBD-II), ECU ports, or entertainment services, allowing the injection of malicious messages into the network or devices. The bus-off attack aims to turn off the ECU by continuously sending bits causing the ECU error counter to increase.
There are three types of IDS: network-based (Network-based Intrusion Detection System, NIDS), host-based (Host-based Intrusion Detection System, HIDS), and hybrid [21,22]. NIDS aims to monitor the network on which the devices are connected. HIDS seeks to detect anomalies that may occur in the device in which the IDS was configured. Moreover, the hybrid approach combines the characteristics of the other two. However, an IDS that applies ML techniques uses datasets generated with data from real or simulated networks to train the anomaly classifier [23].
Although vehicles can use different communication technologies to share information (e.g., Wi-Fi), they mainly use the IEEE 802.11p communication standard. However, as vehicular applications become more robust, there is a need for new technologies that enable low delay and high throughput, such as 5G technology. As highlighted in [24], applying 5G technology in vehicular scenarios can expand the integration of systems that use 3G, 4G, Wi-Fi, ZigBee, and Bluetooth. In addition, vehicular safety applications demand messages with low latency. For example, a collision avoidance application can avoid an accident by receiving timely messages before the driver reacts to the behavior of an adversary vehicle.
Deep Learning (DL) has revolutionized how ML optimizes information processing, enabling it to be used in different areas of knowledge. Tangade et al. [25] applied DL in vehicular networks, highlighting the possibility of increasing reliability, reducing latency, and detecting security problems.
The particularities of an inter-vehicle network can directly affect the accuracy of building an ML model. For example, each vehicular environment has its own heterogeneous characteristics (e.g., number of nodes, network topology, and available resources) that can influence how the ML model will react to the behavior of the entire network.
Seeking to provide public datasets, Gonçalves et al. [26] generated different datasets for IoV, where they performed DoS and Fabrication attacks (i.e., false acceleration, speed, and direction data). Aiming to validate the generated datasets, they proposed a hierarchical IDS that uses ML algorithms [27] to identify malicious behaviors in the network. Each generated dataset has a total of 18 columns/features, including the attack class label [26].
In the context of Smart cities and electric vehicles, Aloqaily et al. [28] proposed the identification of Probing, User to Root (U2R), Remote to User (R2U), and DoS attacks in Connected Vehicular Network (CVN) using an IDS. The strategy used consisted of grouping vehicles into clusters [29], for which the algorithm selects a cluster head (CH) that is responsible for communicating with the trusted third parties (TTP) that are not available in the cluster. They use deep belief network (DBN) and decision tree (DT) algorithms for identifying and classifying anomalies. In the proposed IDS, the authors use a hybrid dataset (network data from NS-3 and NSL-KDD dataset) as input. For the classification of anomalous or normal behavior, the network data packets are processed by the DBN algorithm, which aims to reduce unnecessary network data packets. Finally, the DT algorithm classifies network packets into anomalies or legitimate packets. Additionally, it is pointed out that the NS-3 network data are only used to add normal traffic to the dataset. Apart from the work done, both datasets have the same format. It is important to highlight that NSL-KDD does not use vehicular network data. As already mentioned, vehicular networks have their own characteristics that should not be ignored. Finally, it is not mentioned which features the hybrid dataset has and how important each feature is after DT classification.
Privacy issues in vehicular networks should be addressed at different levels of the vehicular network architecture, since the attacker can harm users in different ways, such as spreading false information, receiving and collecting/processing unauthorized data, and so forth. For example, the Sybil attack can create different identities, and each identity can simulate a vehicle on the road. For example, a legitimate vehicle may not receive an important message about the road conditions in this case. Liang et al. [30] proposed an IDS for identifying False Information and Sybil attacks. The proposed tool was used in two scenarios for data collection (conducting training) and testing. The first scenario did not contain anomalies, and the second one did, to perform the training of the anomaly detection algorithm. The detection algorithm used is called growing hierarchical self-organizing map (GHSOM), which is a neural network.
Garip et al. [31] presented the first adaptive botnet detection mechanism, called SHIELDNET. For the proposed solution, they simulate different scenarios in the Veins tool, which includes the Simulation of Urban MObility (SUMO) and OMNeT simulators, and ML algorithms to identify botnets on the network.
Adhikary et al. [32] proposed a hybrid algorithm to detect distributed DoS (DDoS) attacks in VANETs, where their solution combines support vector machine (SVM) kernels, namely, AnovaDot and RBFDot. Their simulation has a total of 5 RSUs and 1000 vehicles, where the vehicles are displaced every 100 to 500 ms. To evaluate their solution, they also generated a dataset with two classes, 0 (normal behavior) and 1 (victim or DDoS attacker). First, they evaluated the accuracy for each RSU considering only AnovaDot, RBFDot and the Hybrid algorithm. Second, they also considered Gini coefficient, Kolmogorov–Smirnov (which measures the empirical distance between two sample datasets), Hand Measure (which is an alternative performance measure for Area Under Curve—AUC), and Minimum Error rate.
As a proposed solution to the black-hole attack in vehicles with the auto-driving system, Alheeti et al. [33] developed an IDS that uses neural networks and fuzzified data to identify and correct the problem. For the simulation of message exchange between different vehicles and between vehicles and RSUs, the NS2 simulator was used, which had as input the data generated by SUMO and MObilty VEhicles (MOVE) [34] simulators. A statistical approach was also used to extract relevant information in the tracing files generated by the NS2, called Proportional Overlapping Scores (POS).
Kosmanos et al. [35] developed an IDS to identify spoofing attacks in electric vehicles. In addition to using ML, they also employ Position Verification using Relative Speed (PVRS) to optimize the results obtained. An attacker performs some actions on the vehicle or network through the spoofing attack, such as data theft, sending false information, and sending false GPS information (i.e., GPS spoofing).
Polat et al. [36] proposed an IDS solution to detect DDoS on Software-defined network (SDN)-based VANET, where SDN is already the main activator of 5G. To detect the DDoS attack, they used the stacked sparse autoencoder (SSAE) + Softmax classifier deep network model.
In addition, Otoum et al. [37] developed a transfer-learning-driven intrusion detection for IoV, where they used deep neural networks and Convolutional Neural Network (CNN) in two datasets, namely, CICIDS2017 and CSE-CIC-IDS2018. Their solution aims to classify DoS, DDoS, Botnet, Brute-force, Infiltration, Web Attacks, and Port Scan attacks. Table 1 summarizes the related work and our proposed IDS, where we emphasize that ours is the only approach that uses 5G technology.

Table 1.
Summary of related work.
The related work described above lacks discussion on non-trivial issues in ML, such as data distribution and how the data are balanced among classes. These are important themes, since poorly distributed and/or unbalanced datasets can pose serious difficulties to proper model training and consequent performance. Furthermore, most of the related work also seems to completely disregard the usefulness of the simplest and most interpretable ML models, such as decision trees, and how proper parameter settings can improve the quality of the models when regarded through different metrics. As the reader will see in Section 4 and Section 5, in our work we explore the parameterization of simple ML algorithms, combine different datasets in order to improve data distribution, and evaluate the results using different metrics that are robust to unbalanced data.
3. Simulated Scenarios
The proposed scenarios are simulated in a virtual machine running Ubuntu 20.04.5 LTS with Intel (R) Core (TM) i5-8300H, four cores at 2.3 GHz, and 8 GB RAM. The simulation parameters are listed in Table 2. We use the NS-3 network simulator, which is open-source. We used the 5G-LENA module, i.e., a GPLv2 New Radio (NR) network [38], called nr, that also allows to simulate 4G and 5G networks and V2X-based 5G communication. The simulator allows simulating some network actors, such as remote hosts that can connect to Packet Gateway and Service Gateway through a link and send it to gNodeB, and user equipment (i.e., vehicles). Additionally, the nr module is described as a “hard fork” of the millimeter-wave (mmWave) simulator [38], which enables simulating the physical (PHY) layer and medium access control (MAC), mmWave channel [39], propagation, beamforming [40], and antenna models.
Table 2.
Simulation settings.
Furthermore, seeking to generate heterogeneous data, we used SUMO, as it permits the modeling of intermodal traffic systems, to generate four different maps. Each map can have a different number of nodes and a different coverage area. The four maps simulate some regions of Lisbon, Portugal (see Figure 2).
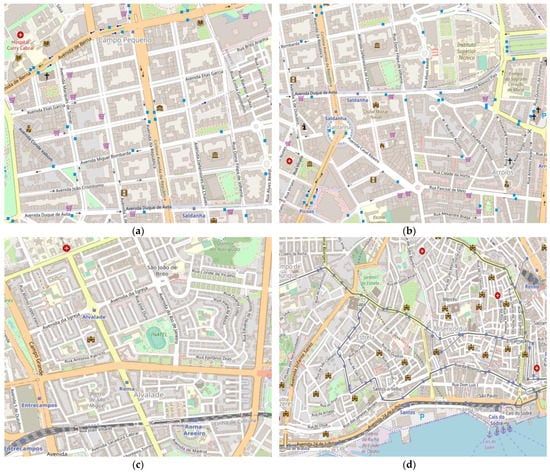
Figure 2.
Selected areas in Lisbon. (a) Campo Pequeno region; (b) Saldanha region; (c) Alvalade region; and (d) Cais do Sodré region.
The simulations are designed as follows:
- All vehicles are equipped with 5G technology, where SUMO is used to generate mobility.
- There are two distinct groups of vehicles: senders and receivers.
- Message exchange between vehicles is made via the multicast address (i.e., 225.0.0.0).
As previously stated, vehicles are separated into two groups (i.e., senders and receivers) and we generated four maps:
- the first map has a total of 45 vehicles, where 10 are senders (from this total, two vehicles are attackers) and 35 receivers;
- the second map also has 45 vehicles, where 10 are senders (from this total, four vehicles are attackers) and 35 receivers;
- the third map has a total of 70 vehicles, where 15 are senders (from this total, seven are attackers) and 55 receivers;
- finally, the fourth map has 100 vehicles, where 19 are senders (from this total, nine vehicles are attackers) and 81 receivers.
In addition, each simulation lasts a total of 230 s. However, to enable more mobility/movement of the vehicles, they exchange packets at second 170.
Additionally, all datasets have the following features:
- timeSec—this feature indicates the simulation time at which a packet is sent or received. In our dataset, we are considering only metrics of received packets;
- txRx—a tag to indicate whether a packet was sent (tx) or received (rx);
- nodeId—refers to the receiver node ID;
- imsi—is the International Mobile Subscriber Identity, which is an identifier assigned with the SIM (Subscriber Identity Module) card;
- srcIp—the IP address of a sender node;
- dstIp—the IP address of a receiver node;
- packetSizeBytes—it refers to the packet size in bytes. Each sender node uses a different size to increase randomness;
- srcPort—refers to the port where the sender nodes are sending the packets;
- dstPort—refers to the port where the receiver nodes are receiving the packets;
- pktSeqNum—refers to the sequence of transmitted packets;
- delay—the difference between the reception time of a packet and its sending time;
- jitter—it uses the RFC 1889 [41] format;
- coord_x—is the “x” coordinate on the map generated in SUMO;
- coord_y—is the “y” coordinate on the map generated in SUMO;
- speed—is the speed of the vehicle in meters per second;
- isAttack—is the class of benign (class 0) packet or malign (class 1) packet.
Table 3 shows the total of rows and class distributions on each dataset.
Table 3.
The number of rows and class distributions on each dataset.
4. Experimental Setup
Our experiments are divided into two parts: first, we use one of the simplest learning methods available, e.g., decision trees, to explore different combinations of our datasets while obtaining preliminary baseline results; then, we explore other, more complex learning methods, namely the ensemble method of random forests and the neural network method multilayer perceptron. We use scikit-learn (version 1.1.1) [42] for all our experiments.
We name our four datasets according to the number of attackers simulated in each, specifically 2, 4, 7, and 9. In the first experiment, we train classifiers in each of them and then test these classifiers on the remaining three datasets. We measure the F1 score separately for each test set and obtain the F1 score for a larger test set that joins the three sets. We prefer the F1 score to the accuracy since some datasets are unbalanced (see Table 3). For choosing the decision tree depth, we perform a grid search with 10-fold cross-validation on the depths {2, 3, 4, 5, 6, 7, 8, 9, 10, 15, 20, 25, 30, 35, 40, 45, 50, 55}. This means that the training set is split into ten parts, and ten different models are trained for each tree depth, each using nine parts for training and one part for validation, and the best tree depth is then chosen based on the different F1 scores obtained. From all the features included in the datasets (see Section 3), we use: nodeId, imsi, pktSizeBytes, dstPort, delay, jitter, coord_x, coord_y, and speed. The remaining ones were not used because they caused overfitting. In the second experiment, we use a mix of two datasets to train and then test on the remaining two separately and joined. The third experiment uses a mix of three datasets for training and the remaining one for testing. In these experiments, the tree depth is not chosen with regular k-fold cross-validation, but rather with what scikit-learn calls GroupKFold cross-validation. In the latter, each group is the set of samples from each dataset and the same group cannot coexist in both training and validation parts. Table 4 presents the tested parameters in all algorithms.
Table 4.
Summary of tested parameters.
In the second part of our experimental setup, we use random forests and multilayer perceptron. The training data is always composed of three datasets, with the remaining one used for testing. The same GroupKFold cross-validation strategy is used for a grid search. With random forests, the search includes tree depths within the values {2, 3, 4, 5, 6, 7, 8, 9, 10} and the number of trees within the values {10, 20, 30, 40, 50}. Regarding the multilayer perceptron, the search includes batch size within {32, 64}, hidden layers and neurons within {(10,2), (20,2)}, optimizer between stochastic gradient-based optimizer (“adam”) and stochastic gradient descent (“sgd”), and the activation function between the hyperbolic tangent function (“tanh”) and the rectified linear unit function (“relu”).
5. Results
Following the experimental setup, first we report a complete set of results obtained with decision trees using different combinations of our datasets, and then we report the main results obtained using other learning methods. Finally, we compare our results to others that reported the same metrics in similar work.
5.1. Exploring Data
Table 5 reports the results obtained by training on a single dataset and then testing on the other three. As described above (see Experimental Setup), the training and validation folds for choosing tree depth belong to the same dataset. The reported test F1 scores refer to the three F1 scores measured separately for each dataset and the F1 score measured on the dataset that joins these three (between parenthesis). The first case reported is when training on dataset 2, which generalizes very well to datasets 4 and 7, and a bit less to dataset 9. Training on dataset 4 generalizes better for datasets 7 and 9 than for dataset 2, and always worse than the values obtained in the first case; on the joined dataset, the F1 is almost 9% less than the score obtained in the first case. Training on dataset 7 generalizes better for dataset 9, and then for dataset 4 and finally dataset 2, with these values being generally worse than those obtained in the second case; on the joined dataset, 5.6% less. Finally, training on dataset 9 generalizes well for all other datasets, only 1.5% less than the first case on the joined dataset. It is worth remarking that: (1) larger training datasets (see Table 3) tend to provide better generalization ability; (2) generalization seems to be easier for datasets where the number of attackers is closer but not less than the number of attackers in the training dataset; (3) the trees become smaller as the number of attackers grows; (4) lack of Precision is the main culprit for the worst results. Another thing to notice is the high dispersion of F1 values obtained by the same classifier on different test sets (e.g., between 0.75 and 0.97 by the classifier trained on dataset 4), which renders its predictions highly unreliable.
Table 5.
Results using one dataset as training data.
Table 6 reports the results obtained by training on a mix of two datasets and then testing on the other two. In this case, the training and validation folds for choosing tree depth come from different datasets. The immediate difference we can observe is that the decision trees are now extremely shallow. This means that the characteristics of the two training datasets are substantially different, and deeper trees obtained for one dataset do not generalize well on the other. However, these small trees can do a good job. Their results show much less dispersion, with all F1 values between 0.95 and 0.99 (except the classifier trained on datasets 4 + 7 when tested on dataset 9). Therefore, they are much more reliable.
Table 6.
Results using two datasets as training data.
Table 7 reports the results obtained by training on a mix of three datasets and testing on the remaining one. Moreover, here the trees are very shallow (always depth 3) and the results are very good (all scores between 0.95 and 0.999, rounded to 1.00 in the table). Dataset 9 is the one where generalization is most difficult.
Table 7.
Results using three datasets as training data.
In order to draw some conclusions, Figure 3 rearranges the previous results in the following way. We collect several results for each test dataset presented in the previous tables. For example, for dataset 2, we look at the results obtained when training with dataset 4 (0.75), training with dataset 7 (0.77) and training with dataset 9 (0.96), and average these into a single value (0.83) that represents the F1 obtained in test dataset 2 when the training was done using only one dataset. We then look at the results obtained when training with the mixes of two datasets (in this case, 4 + 7, 4 + 9, 7 + 9) and again calculate the average (0.96). Finally, we examine the result obtained when training with a mix of three datasets (0.98). These three averages are the first three bars of the plot, referring to test dataset 2. To complete the plot, we do the same for the other test datasets (i.e., 4, 7, 9).
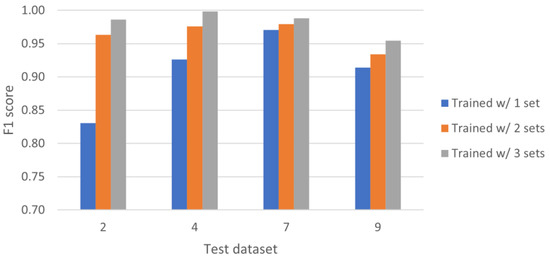
Figure 3.
Results per test dataset, using one, two and three sets for training.
Looking at Figure 3, it becomes obvious that training with two datasets is better than training with only one, and training with three datasets is even better than training with two. The increasing diversity in the training data results in a better generalization ability on the test set. This is observed in all test sets, but the effect is more dramatic for those with fewer attackers. Furthermore, we now clearly observe that generalization is more difficult on test set 9 than, for example, on test set 7. This can be explained due to the number of rows in both datasets (see Table 3). For example, set 7 has, proportionally, almost 12% more records from attackers than set 9. Finally, Figure 4 and Figure 5 show receiver operating characteristic (ROC) curves and confusion matrices, respectively, for each experiment presented in Table 7 (using three datasets for training).
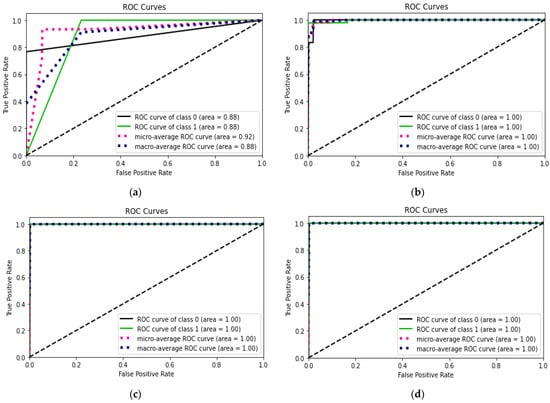
Figure 4.
ROC curves for each experiment in Table 7. (a) Training with datasets 2 + 4 + 7 and test with dataset 9; (b) Training with datasets 2 + 4 + 9 and test with dataset 7; (c) Training with datasets 2 + 7 + 9 and test with dataset 4; and (d) Training with datasets 4 + 7 + 9 and test with dataset 2.
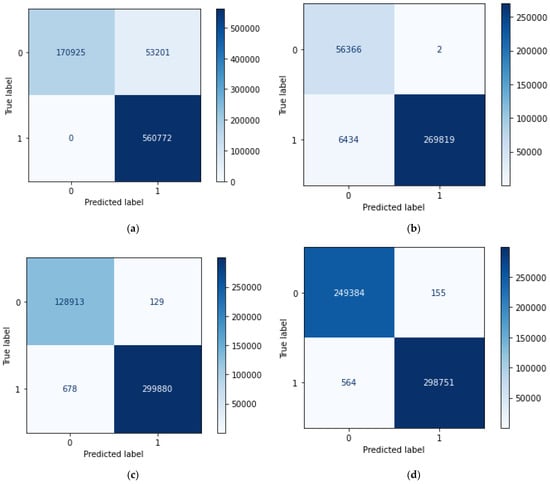
Figure 5.
Confusion matrix for each experiment in Table 7. (a) Training with datasets 2 + 4 + 7 and test with dataset 9; (b) Training with datasets 2 + 4 + 9 and test with dataset 7; (c) Training with datasets 2 + 7 + 9 and test with dataset 4; and (d) Training with datasets 4 + 7 + 9 and test with dataset 2.
5.2. Exploring Methods
To compare the previous results with those obtained with different learning algorithms, here we report the performance of random forests and the multilayer perceptron when trained with the mix of three datasets. Table 8 shows the results of random forests, including the chosen hyperparameters. When trained with the joined datasets 2 + 4 + 7, a random forest with 30 trees of maximum depth 5 achieves an F1 score of 0.97, which is 2.1% higher than the result of decision trees (0.95). When using dataset 2 + 4 + 9 for training, a larger random forest of 50 trees with a maximum depth of 7 achieves 0.98, which is the same score obtained by a decision tree in the previous results. In the remaining two cases, both random forests achieve 0.97, which is lower than the 1.00 and 0.98 achieved by the respective decision trees in the previous results.
Table 8.
Results of random forests using three datasets as training data.
Given the reported results, there seems to be no advantage in using random forests instead of decision trees. However, these results present less variance than those obtained by decision trees. Therefore, we can argue that a random forest model may be more reliable than a decision tree for a diverse range of test sets.
Regarding the multilayer perceptron, the results obtained are worse than those achieved by either decision trees or random forests. Table 9 reports the results as well as the chosen hyperparameters returned by grid search. Whereas decision trees previously obtained results between 0.95 and 1.00, and random forests obtained results between 0.97 and 0.98, the multilayer perceptron ranged from 0.70 on test dataset 2 to 0.90 on test dataset 7, with the remaining tests resulting in 0.82 and 0.83. Since a high Recall score was always obtained, the problem is lack of Precision.
Table 9.
Results of multilayer perceptron using three datasets as training data.
5.3. Comparison with Similar Work
Seeking to compare our results to what was reported by others in similar work, here we show a comparison with [36,37], the two works reporting the same metrics. Going back to Table 7, by averaging all the rows for each metric we obtain accuracy 0.97, precision 0.96, recall 0.98, and F1 0.97. For [36], we average the results reported for the four variants presented, obtaining accuracy 0.95, and precision, recall, and F1 all equal to 0.94. For [37], we average the reported results for the two datasets used and for the two methods used, obtaining accuracy 0.98, precision 0.94, recall 0.89, and F1 0.90. Figure 6 shows these values in a comparative plot. It should be noted that ours and both other works use unbalanced datasets. However, the other works highlight the accuracy achieved, which is well known to be an unreliable metric for unbalanced data. As visible in the plot, except for accuracy our results are the best, despite using much simpler methods.
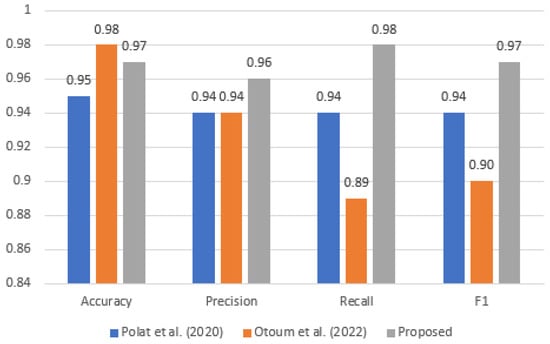
Figure 6.
Comparison of our average metrics with [36,37].
6. Conclusions
We have generated four vehicular network datasets by performing simulations in NS-3 using 5G communication technology. Each dataset consisted of a different scenario with a different number of sender and receiver vehicles. In each dataset, a Flooding attack was simulated with a different number of attackers. The generated datasets were extensively combined and tested to report reliable accuracy, precision, recall, and F1 scores on classifying Flooding behavior in the simulated scenarios. We used different machine learning algorithms such as decision trees, random forests and multilayer perceptron, and compared their performance. The first conclusion of our study is that data diversity on the training set is important, as the more diversity it contains the better the generalization is achieved on the test data. The second conclusion is that complex learning methods do not necessarily provide better results than simple methods such as decision trees. Nevertheless, while the multilayer perceptron performed poorly, the random forests performed at the same level as decision trees, with the advantage of being more consistent across different test sets.
As future work, we will generate more complex data from different attacks and scenarios, e.g., false information and back-hole attacks, and platooning scenarios. We will also explore other ensemble methods such as extreme gradient boosting (XGBoost).
Author Contributions
Conceptualization, B.S., N.M. and S.S.; Methodology, B.S., N.M. and S.S.; Software, B.S.; Validation, B.S., N.M. and S.S.; Formal Analysis, B.S.; Investigation, B.S.; Data Curation, B.S. and S.S.; Writing—Original Draft Preparation, B.S.; Writing—Review and Editing, B.S., N.M. and S.S.; Supervision, N.M. and S.S.; Funding Acquisition, N.M. All authors have read and agreed to the published version of the manuscript.
Funding
This work was supported by H2020-MSCA-RISE under grant No. 101006411; and by Fundação para a Ciência e a Tecnologia (FCT), Portugal, through doctoral grant SFRH/BD/151413/2021 under the MIT Portugal Program, and through funding of the LASIGE Research Unit (UIDB/00408/2020 and UIDP/00408/2020).
Data Availability Statement
The four generated datasets can be found in the following repository: https://github.com/BrenoMelo/Datasets-5G-enabled-Vehicular-Networks (accessed on 3 April 2023).
Conflicts of Interest
The authors declare no conflict of interest.
References
- Magaia, N.; Ferreira, P.; Pereira, P.R.; Muhammad, K.; Del Ser, J.; De Albuquerque, V.H.C. Group’n Route: An Edge Learning-Based Clustering and Efficient Routing Scheme Leveraging Social Strength for the Internet of Vehicles. IEEE Trans. Intell. Transp. Syst. 2022, 23, 19589–19601. [Google Scholar] [CrossRef]
- Zhou, X.; Liang, W.; She, J.; Yan, Z.; Wang, K. Two-Layer Federated Learning with Heterogeneous Model Aggregation for 6G Supported Internet of Vehicles. IEEE Trans. Veh. Technol. 2021, 70, 5308–5317. [Google Scholar] [CrossRef]
- Shen, X.; Fantacci, R.; Chen, S. Internet of Vehicles. Proc. IEEE 2020, 108, 242–245. [Google Scholar] [CrossRef]
- Lin, Z.; Lin, M.; De Cola, T.; Wang, J.B.; Zhu, W.P.; Cheng, J. Supporting IoT with rate-splitting multiple access in satellite and aerial-integrated networks. IEEE Internet Things J. 2021, 8, 11123–11134. [Google Scholar] [CrossRef]
- Silva, L.; Magaia, N.; Sousa, B.; Kobusińska, A.; Casimiro, A.; Mavromoustakis, C.X.; Mastorakis, G.; De Albuquerque, V.H. Computing Paradigms in Emerging Vehicular Environments: A Review. IEEE/CAA J. Autom. Sin. 2021, 8, 491–511. [Google Scholar] [CrossRef]
- Magaia, N.; Mastorakis, G.; Mavromoustakis, C.; Pallis, E.; Markakis, E.K. (Eds.) Intelligent Technologies for Internet of Vehicles; Springer: Berlin/Heidelberg, Germany, 2021. [Google Scholar] [CrossRef]
- Yang, L.; Moubayed, A.; Hamieh, I.; Shami, A. Tree-based intelligent intrusion detection system in internet of vehicles. In Proceedings of the 2019 IEEE Global Communications Conference (GLOBECOM), Waikoloa, HI, USA, 9–13 December 2019. [Google Scholar] [CrossRef]
- Park, S.; Aslam, B.; Turgut, D.; Zou, C.C. Defense against sybil attack in vehicular ad hoc network based on roadside unit support. In Proceedings of the MILCOM 2009–2009 IEEE Military Communications Conference, Boston, MA, USA, 18–21 October 2009. [Google Scholar] [CrossRef]
- Sharma, S.; Kaushik, B. A survey on internet of vehicles: Applications, security issues & solutions. Veh. Commun. 2019, 20, 100182. [Google Scholar] [CrossRef]
- Ahmed, I.; Ahmad, A.; Jeon, G. Deep Learning-based Intrusion Detection System for Internet of Vehicles. IEEE Consum. Electron. Mag. 2021, 12, 117–123. [Google Scholar] [CrossRef]
- Fraiji, Y.; Azzouz, L.B.; Trojet, W.; Saidane, L.A. Cyber security issues of Internet of electric vehicles. In Proceedings of the 2018 IEEE Wireless Communications and Networking Conference (WCNC), Barcelona, Spain, 15–18 April 2018; pp. 1–6. [Google Scholar] [CrossRef]
- Lin, Z.; Lin, M.; Champagne, B.; Zhu, W.P.; Al-Dhahir, N. Secure beamforming for cognitive satellite terrestrial networks with unknown eavesdroppers. IEEE Syst. J. 2021, 15, 2186–2189. [Google Scholar] [CrossRef]
- ns-3. A Discrete-Event Network Simulator for Internet Systems. Available online: https://www.nsnam.org (accessed on 1 February 2023).
- Veins. Available online: https://veins.car2x.org (accessed on 1 February 2023).
- Magaia, N.; Sheng, Z. ReFIoV: A novel reputation framework for information-centric vehicular applications. IEEE Trans. Veh. Technol. 2019, 68, 1810–1823. [Google Scholar] [CrossRef]
- ‘Hackers’ Podem Usar Automóveis para Paralisar uma Cidade. Available online: https://www.motor24.pt/noticias/hackers-podem-usar-automoveis-para-paralisar-uma-cidade/666001 (accessed on 22 November 2022).
- Sharma, T.P.; Sharma, A.K. Heterogeneous-internet of vehicles (Het-IoV) in twenty-first century: A comprehensive study. In Handbook of Computer Networks and Cyber Security: Principles and Paradigms; Springer: Cham, Switzerland, 2019; pp. 555–584. [Google Scholar] [CrossRef]
- Puri, V.; Kumar, R.; Van Le, C.; Sharma, R.; Priyadarshini, I. A Vital Role of Blockchain Technology Toward Internet of Vehicles. In Handbook of Computer Networks and Cyber Security: Principles and Paradigms; Academic Press: Cambridge, MA, USA, 2020; pp. 407–416. [Google Scholar] [CrossRef]
- Liu, K.; Xu, X.; Chen, M.; Liu, B.; Wu, L.; Lee, V.C.S. A Hierarchical architecture for the future internet of vehicles. IEEE Commun. Mag. 2019, 57, 41–47. [Google Scholar] [CrossRef]
- El-Rewini, Z.; Sadatsharan, K.; Selvaraj, D.F.; Plathottam, S.J.; Ranganathan, P. Cybersecurity challenges in vehicular communications. Veh. Commun. 2020, 23, 100214. [Google Scholar] [CrossRef]
- Dupont, G.; Den Hartog, J.; Etalle, S.; Lekidis, A. A survey of network intrusion detection systems for controller area network. In Proceedings of the 2019 IEEE International Conference on Vehicular Electronics and Safety (ICVES), Cairo, Egypt, 4–6 September 2019. [Google Scholar] [CrossRef]
- Zaidi, K.; Milojevic, M.B.; Rakocevic, V.; Nallanathan, A.; Rajarajan, M. Host-Based Intrusion Detection for VANETs: A Statistical Approach to Rogue Node Detection. IEEE Trans. Veh. Technol. 2016, 65, 6703–6714. [Google Scholar] [CrossRef]
- Belenko, V.; Krundyshev, V.; Kalinin, M. Synthetic datasets generation for intrusion detection in VANET. In SIN’18: Proceedings of the 11th International Conference on Security of Information and Networks, Cardiff, UK, 10–12 September 2018; Association for Computing Machinery: New York, NY, USA, 2018. [Google Scholar] [CrossRef]
- Shah, S.A.A.; Ahmed, E.; Imran, M.; Zeadally, S. 5G for Vehicular Communications. IEEE Commun. Mag. 2018, 56, 111–117. [Google Scholar] [CrossRef]
- Tangade, S.; Manvi, S.S.; Hassan, S. A deep learning based driver classification and trust computation in VANETs. In Proceedings of the 2019 IEEE 90th Vehicular Technology Conference (VTC2019-Fall), Honolulu, HI, USA, 22–25 September 2019. [Google Scholar] [CrossRef]
- Gonçalves, F.; Ribeiro, B.; Gama, O.; Santos, J.; Costa, A.; Dias, B.; Nicolau, M.J.; Macedo, J.; Santos, A. Synthesizing Datasets with Security Threats for Vehicular Ad-Hoc Networks. In Proceedings of the GLOBECOM 2020—2020 IEEE Global Communications Conference, Taipei, Taiwan, 7–11 December 2020; Volume 2020. [Google Scholar] [CrossRef]
- Goncalves, F.; MacEdo, J.; Santos, A. Intelligent Hierarchical Intrusion Detection System for VANETs. In Proceedings of the 2021 13th International Congress on Ultra Modern Telecommunications and Control Systems and Workshops (ICUMT), Brno, Czech Republic, 25–27 October 2021; Volume 2021, pp. 50–59. [Google Scholar] [CrossRef]
- Aloqaily, M.; Otoum, S.; Al Ridhawi, I.; Jararweh, Y. An intrusion detection system for connected vehicles in smart cities. Ad Hoc Networks 2019, 90, 101842. [Google Scholar] [CrossRef]
- Zhang, D.; Gong, C.; Zhang, T.; Zhang, J.; Piao, M. A new algorithm of clustering AODV based on edge computing strategy in IOV. Wirel. Netw. 2021, 27, 2891–2908. [Google Scholar] [CrossRef]
- Liang, J.; Chen, J.; Zhu, Y.; Yu, R. A novel Intrusion Detection System for Vehicular Ad Hoc Networks (VANETs) based on differences of traffic flow and position. Appl. Soft Comput. 2019, 75, 712–727. [Google Scholar] [CrossRef]
- Garip, M.T.; Lin, J.; Reiher, P.; Gerla, M. SHIELDNET: An Adaptive Detection Mechanism against Vehicular Botnets in VANETs. In Proceedings of the 2019 IEEE Vehicular Networking Conference (VNC), Los Angeles, CA, USA, 4–6 December 2019; Volume 2019. [Google Scholar] [CrossRef]
- Adhikary, K.; Bhushan, S.; Kumar, S.; Dutta, K. Hybrid Algorithm to Detect DDoS Attacks in VANETs. Wirel. Pers. Commun. 2020, 114, 3613–3634. [Google Scholar] [CrossRef]
- Alheeti, K.M.A.; Gruebler, A.; McDonald-Maier, K.D. An Intrusion Detection System against Black Hole Attacks on the Communication Network of Self-Driving Cars. In Proceedings of the 2015 Sixth International Conference on Emerging Security Technologies (EST), Braunschweig, Germany, 3–5 September 2015; pp. 86–91. [Google Scholar] [CrossRef]
- Rapid Generation of Realistic Simulation for VANET. Available online: https://lens.csie.ncku.edu.tw/index.php/research-projects/past/18-rapid-vanet (accessed on 3 January 2023).
- Kosmanos, D.; Pappas, A.; Maglaras, L.; Moschoyiannis, S.; Aparicio-Navarro, F.J.; Argyriou, A.; Janicke, H. A novel Intrusion Detection System against spoofing attacks in connected Electric Vehicles. Array 2020, 5, 100013. [Google Scholar] [CrossRef]
- Polat, H.; Turkoglu, M.; Polat, O. Deep network approach with stacked sparse autoencoders in detection of DDoS attacks on SDN-based VANET. IET Commun. 2020, 14, 4089–4100. [Google Scholar] [CrossRef]
- Otoum, Y.; Wan, Y.; Nayak, A. Transfer Learning-Driven Intrusion Detection for Internet of Vehicles (IoV). In Proceedings of the 2022 International Wireless Communications and Mobile Computing (IWCMC), Dubrovnik, Croatia, 30 May–3 June 2022; pp. 342–347. [Google Scholar] [CrossRef]
- 5G-LENA Module. 5G LENA. Available online: https://5g-lena.cttc.es (accessed on 4 January 2023).
- Lin, Z.; Lin, M.; Champagne, B.; Zhu, W.P.; Al-Dhahir, N. Secrecy-energy efficient hybrid beamforming for satellite-terrestrial integrated networks. IEEE Trans. Commun. 2021, 69, 6345–6360. [Google Scholar] [CrossRef]
- Lin, Z.; Lin, M.; Huang, Q.Q.; Zhao, B.; Gu, C.W.; Xu, B. Secure beamforming algorithm in satellite-terrestrial integrated networks with energy efficiency maximization criterion. Acta Electron. Sin. 2022, 50, 124–134. [Google Scholar] [CrossRef]
- IETF. RFC 1889—RTP: A Transport Protocol for Real-Time Applications. Available online: https://datatracker.ietf.org/doc/html/rfc1889 (accessed on 26 February 2023).
- Scikit-Learn: Machine Learning in Python. Available online: https://scikit-learn.org/stable/index.html (accessed on 26 February 2023).
Disclaimer/Publisher’s Note: The statements, opinions and data contained in all publications are solely those of the individual author(s) and contributor(s) and not of MDPI and/or the editor(s). MDPI and/or the editor(s) disclaim responsibility for any injury to people or property resulting from any ideas, methods, instructions or products referred to in the content. |
© 2023 by the authors. Licensee MDPI, Basel, Switzerland. This article is an open access article distributed under the terms and conditions of the Creative Commons Attribution (CC BY) license (https://creativecommons.org/licenses/by/4.0/).