Abstract
Currently, a significant amount of interest is focused on research in the field of Human Activity Recognition (HAR) as a result of the wide variety of its practical uses in real-world applications, such as biometric user identification, health monitoring of the elderly, and surveillance by authorities. The widespread use of wearable sensor devices and the Internet of Things (IoT) has led the topic of HAR to become a significant subject in areas of mobile and ubiquitous computing. In recent years, the most widely-used inference and problem-solving approach in the HAR system has been deep learning. Nevertheless, major challenges exist with regard to the application of HAR for problems in biometric user identification in which various human behaviors can be regarded as types of biometric qualities and used for identifying people. In this research study, a novel framework for multi-class wearable user identification, with a basis in the recognition of human behavior through the use of deep learning models, is presented. In order to obtain advanced information regarding users during the performance of various activities, sensory data from tri-axial gyroscopes and tri-axial accelerometers of the wearable devices are applied. Additionally, a set of experiments were shown to validate this work, and the proposed framework’s effectiveness was demonstrated. The results for the two basic models, namely, the Convolutional Neural Network (CNN) and the Long Short-Term Memory (LSTM) deep learning, showed that the highest accuracy for all users was 91.77% and 92.43%, respectively. With regard to the biometric user identification, these are both acceptable levels.
1. Introduction
Among researchers in both academia and industry whose goal is the advancement of ubiquitous computing and human computer interaction, one of the most widely-discussed research topics has become Human Activity Recognition (HAR) [1]. Presently, the number of research studies conducted on HAR is rapidly increasing because sensors are more widely available, costs and power consumption have decreased, and because of data and technological advances in machine learning algorithms. Artificial Intelligence (AI), and the Internet of Things (IoT) can now be live-streamed [2,3]. The progress in HAR has facilitated practical applications in various real-world fields, including the healthcare industry, the detection of crime and violence, sports science, and tactical military applications. It is clear that the wide range of situations to which HAR is applicable provides proof that the field has strong potential to improve our quality of life [4]. Mathematical models, based on human activity data, allow the recognition of a variety of human activities, for example, running, sitting, sleeping, standing, and walking. HAR systems can be classified into two major groups, namely video-based systems and sensor-based systems. In video-based HAR systems, cameras are used for recording images or videos for the recognition of the behaviors of people, whereas on-body and ambient sensors are utilized by the sensor-based HAR systems for capturing the details of people’s motions and to record their activity data. Due to the issue of privacy raised by the installation of cameras in participants’ personal spaces, the applications for the monitoring of daily activities are dominated by the sensor-based systems. Moreover, another advantage of sensors is their pervasiveness. As a result of the expansive presence of smart devices with various sensors, it is possible to embed the sensors in portable devices, such as goggles, phones, and watches, as well as non-portable objects, like, cars, furniture, and walls. These days, sensors are widely-embedded in our environment, recording information about human motion, unnoticed and without interruption.
Numerous challenges in HAR exist, for example, biometric user identification can utilize HAR recognition methods for capturing the individual behavioral patterns of people, such as motion capture signatures [5,6], as biometrics is a science in which the potential for the identification of an individual, based on their personal characteristics for the prevention of accessing a device without authorization, is studied [7]. Presently, the basis of biometric identification primarily involves the physiological properties of a person. However, strong concerns regarding privacy and HAR are posed by these physiological characteristics, which could be viewed as a feasible alternative, functioning merely as a mechanism for behavioral biometrics [8,9].
To address the issues mentioned above, there have been proposals for several machine-learning techniques, with the principle one being learning to recognize an individual through their behavioral patterns for various activities during interaction with wearable devices. In this study, 12 Activities of Daily Living (ADL) were included. In general, for capturing the data of users in real time while performing their various activities, two types of wearable sensors (accelerometer and gyroscope) are employed. This study also utilized two open datasets for HAR in which data are pre-processed and implemented by two separate deep learning techniques, namely, Convolution Neural Network (CNN) and Long Short-Term Memory (LSTM), in order to use activity patterns to identify various users.
This work’s main contribution is to propose a framework for a novel multi-class wearable user identification system, based on HAR, utilizing an ensemble classifier for a deep learning model. In contrast to previous studies, the research mainly aims at identifying the activity and user identification with the hierarchical ensemble of classifiers to improve comprehensive performance.
The structure of this paper is as follows: Section 2 presents a concise description of related studies. Section 3 contributes the proposed detailed description of the multi-class wearable user identification framework. Section 4 presents and discusses a detailed investigation of the experimental results. Section 5 summarizes the research findings and provides research suggestions for future studies.
2. Related Research
This study is primarily concerned with HAR and deep learning. Therefore, recent advances in these two areas are briefly reviewed first.
2.1. Human Activity Recognition via Machine Learning and Deep Learning
The time series classification tasks are the main challenges in using HAR, which is when the person’s movements are predicted by the use of sensory data. This normally involves accurately engineering features from the raw data by employing deep domain expertise and signal processing methods with the aim of fitting one of the models of machine learning. In recent studies, the capacity of deep learning models, including CNN and LSTM neural networks, to automatically extract meaningful attributes from the given raw sensor data and achieve the most advanced results, has been shown.
Research to study activity in the field of HAR has been conducted since the 1990s [10,11]. The collection and detection of real-life activities, performed by a group or single person for an understanding of the environmental context surrounding humans, is the focus of HAR. Nowadays, due to its potential to assist with revolutionizing the ways that people can interact with computers, HAR is regarded as a promising area in the field of human-computer interaction [12,13].
There are five main tasks performed by HAR, as shown in Figure 1a, namely recognition of basic activities [14], recognition of daily activities [15], recognition of unusual events [16], identification of biometric subjects [17], and prediction of energy expenditures [18]. As illustrated in Figure 1b, various sensors are employed for the performance of these tasks, such as video cameras, circumstantial sensors that measure temperature, relative humidity, light, pressure, and wearable sensors. In general, built-in smartphone sensors, or sensors embedded in wearable devices, are the main types of wearable sensors.
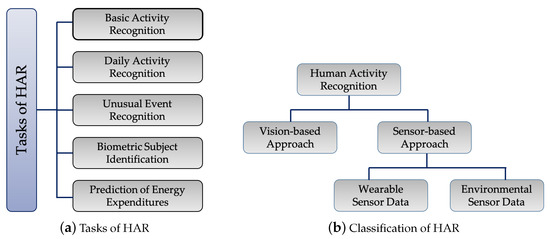
Figure 1.
Human Activity Recognition (HAR): (a) Tasks of HAR and (b) classification of HAR.
Rich and unique sets of information, unable to be obtained through the use of other kinds of sensors, can be provided by cameras. However, continuous monitoring of a subject’s activities is required by camera-based methods, which means that huge amounts of computational resources and storage space are needed. Moreover, being continuously observed by cameras may make some people feel uncomfortable [19]. One example of this type of indoor camera-based system for monitoring human activity is described in [20], which allows for continuous monitoring and intelligent processing of the video. An additional function of utilizing camera sensors is to provide human activity recognition systems with the “ground truth”, i.e. checking the results of machine learning for accuracy against the real world.
It is possible to track and record the interaction of a user with the environment by using environmental sensors. One example of this is in the experimental context of [21], in which the objects employed in the test environment were fitted with wireless Bluetooth acceleration and gyroscope sensors that record the use of these objects. In addition, arrays of wired microphones were placed within the room for the recording of ambient sound. Moreover, reed switches were installed on drawers, doors, and shelves to detect usage and provide ground truth. In contrast, the disadvantage of circumstantial sensors is their limited use for specific situations and building designs, which results in the HAR system not being general. Thus, even a well-designed and built HAR system may not be easily implemented in a different ambient environment. Finally, the cost of deploying these sensors is relatively expensive.
The sensors that can be worn on a user’s body can identify the physical states and characteristics of that person’s activities and include Inertial Measurement Unit (IMU) sensors (accelerometers and gyroscopes) and GPS, as well as magnetic field sensors, all of which are commonly-employed in applications for activity recognition. In some previous research, one or more accelerometers were attached to various positions of the subjects’ bodies for recognition of human activity. A wearable sensor network designed for detection of human activity was presented by Dong and Biawas [22]. In a similar study, wearable tri-axial accelerometers were used for activity detection by Curone et al. [23].
Since recent breakthroughs in deep learning have been achieved in numerous areas of machine learning applications and due to the inherently multi-class nature of deep learning models, the review of the literature began by briefly summarizing deep learning for human activity recognition. In 2011, 56 papers using deep learning models were surveyed by Wang et al. [24].
These papers included deep neural networks, convolutional and recurrent neural networks, autoencoders, and restricted Boltzmann machines, and were used for conducting sensor-based HAR. The results indicated that no single model was found that surpasses all others in all situations, and the model selection based on the scheme of the application was recommended. Four papers were identified [25,26,27,28] as being modern deep learning for HAR, based on comparing the Opportunity [29], Skoda [30], and the UCI HAR, which are the three HAR benchmark datasets (University of California, Irvine), in addition to smartphone datasets [31] which all comprise of data obtained from the participants wearing several IMUs.
2.2. Biometric User Identification Using HAR
The possibility of using the sensors and accessories of smartphones to record a number of behavioral qualities, for example, gait recognition, touch dynamics, and keystroke dynamics has been demonstrated by recent research. These qualities are referred to as behavioral biometrics and can be utilized for the implicit and continuous verification and identification of users through smartphones. These systems for identification, developed through the use of the behavioral biometric characteristics identified above, are categorized as continuous or active authentication systems.
There are two categories of biometric identification systems, as follows:
- Those based on features that are static, including physical characteristics, such as the face, fingerprints, iris of the eye, etc. This type of biological signal is usually collected by researchers in a spatial frequency domain;
- Those that include dynamic features, such as behavioral characteristics, including Electrocardiographic (ECG) signals, keystrokes, voice, etc. This type of biological signal is normally collected by researchers in a time-frequency domain [32].
In recent research, many studies have applied HAR as the solution to the challenges encountered in biometric identification. The gait authentication, using a wearable accelerometer, was proposed by Ailisto et al. [33], and individual steps were identified by analysis of acceleration data which were normalized and aligned with the template. Following this, the application of cross-correlation was conducted for the measurement of similarity, which indicated a 6.4% EER (Energy Efficiency Ratio). J48 and neural network classifiers were used for the classification of multiple sensor data gathered from the act of going upstairs and downstairs, jogging, and walking of 36 participants in the work of Kwapisz [34]. The generation of 43 attributes for each axis and attribute-type included the average value of acceleration, absolute difference and resultant acceleration, standard deviation, binned distribution, and time between peaks. Identification of the person walking was achieved with an 82.1%–92.9% positive authentication rate. A time frequency spectrogram model, called SVM, and a cyclo-stationary model were used by Juefei-Xu et al. [35] for collecting data from 36 participants. The highest results indicated verification rates of 99.4% and 96.8% for normal and fast-walking, respectively, based on the data from both the accelerometer and the gyroscope. A Probability Distribution Function (PDF) of the derived attributes was proposed by Robertas et al. [17], and offline data from the USC HAR dataset was used for testing. The result for the grand mean accuracy was 72.02% however, if only walking-related activities, such as forward, right, and left walking, were considered, 94.44% was determined as the mean accuracy.
3. Proposed Methodology
3.1. Proposed Framework
The proposed framework for the biometric user identification with activity data, extracted from wearable sensors, is discussed in this section. Figure 2 presents the overall identification process. The framework has four main stages, namely data collection, data pre-processing, model training by deep learning, and user identification. These stages require a classification system. The following are the details of each stage of the biometric user identification process proposed in the present study.
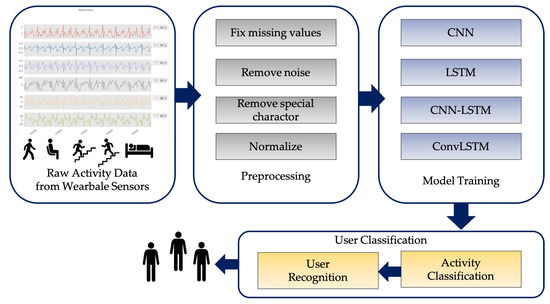
Figure 2.
The proposed framework of biometric user identification using activity data.
3.1.1. Datasets
The data collection utilized two opened human activity datasets commonly used in human activity research fields, as follows:
- The UCI Human Activity Recognition Dataset (UCI HAR) [31] is the first dataset recorded using embedded tri-axial sensors of accelerometer and gyroscope in a smartphone (Samsung Galaxy S II) on the waist of 30 subjects performing six daily activities;
- The USC Human Activity Dataset (USC HAD) [36] is the second dataset recorded using MotionNode device-embedded tri-axial sensors of magnetometer, accelerometer, and gyroscope. The research sampling rate was 100 Hz. The dataset comprises activity data recorded with 14 subjects, including seven male and seven female subjects, aged between 21–49, performing 12 activities.
In Figure 3, the activity data from UCI HAR and USC HAD dataset are sampled and presented.
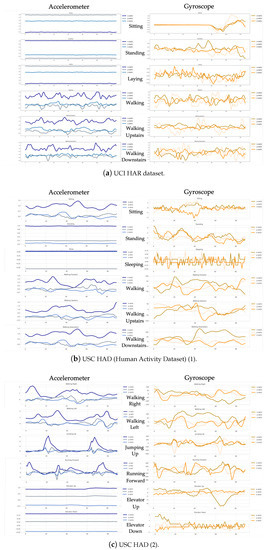
Figure 3.
Samples of activity data from UCI HAR and USC HAD: (a) UCI HAR dataset, (b) USC HAD (1), and (c) USC HAD (2).
3.1.2. Data Pre-Processing
At the data pre-processing stage, the data recorded by the wearable sensors are cleaned and normalized in order to obtain a dataset that is consistent and appropriate for training an identification model. All of the incomplete and outlier data values are removed in this process, as follows:
- Missing values of sensor data are fixed by the imputation technique with the linear interpolation method;
- Noises are removed. The sensor data used in this work were pre-processed for noise reduction with a median filter and a 3rd order low-pass Butterworth filter with a 20 Hz cutoff frequency. This rate is sufficient for capturing human body motion since 99% of its energy is contained below 15 Hz [31];
- Special characters are removed;
- A normalization process is used to transform each sensor data with mean and standard derivation [37].
To perform a linear transformation of the raw sensory data, a Min-Max technique is used in this study for the normalization process. Eventual input for the process of feature extraction and model training is the dataset that is cleaned and normalized. According to the process, the data is split in order to train the classifier. The second set is used as a test set for evaluating the operation of the trained classifier.
3.1.3. Model Training by Deep Learning Technique
By directly using the accelerometer and gyroscope data, the classification step cannot be completed. Firstly, it is needed to conduct feature extraction for pre-processing the data. As a result, the various feature types are extracted from the raw data provided by the sensors. Appropriate feature groups are built in order to improve the efficiency of the machine learning model. Four deep learning models (CNN, LSTM, CNN-LSTM, and ConvLSTM) were selected for the user classification in this study, that includes the feature extraction process.
(1) CNN Model
CNN (Convolution Neural Network) is a network with a structure comprising several layers. Its architecture has two principal components, the first of which is a fully-connected network, while the other consists of numerous convolution and sampling layers. These layers play the role of feature extraction, while the fully-connected network is necessary in order to learn the classification weights. The typical CNN comprises the following three layers, and their respective explanations:
- Convolutional layer,
- Pooling layer, and
- Fully-connected layer.
In the convolutional layer, there are filters which aim to carry out the extraction of local features, known as the feature map, by using the input data, otherwise known as the sensory data. One filter is needed to calculate each single feature map. In order to create a feature map, it is necessary to slide the filter over the input data to calculate the dot product. The process is known as the convolution operation. In the feature map, each neuron is linked directly to a small proportion of the input data, known as the receptive field, which has a size equal to that of the filter. The weightings for each of the neurons in one feature map are shared, since this reduces the number of parameters and allows for more efficient calculation. This also makes it possible to detect and identify specific patterns, no matter where they are located in the input. The feature map generated will be of a size which is determined by the filter size and stride number.
The CNN architecture in this case makes use of a pair of consecutive blocks, each of which comprises a convolutional layer with ReLU activation and a max-pooling layer. Each of the convolutional kernels independently carries out a 1D convolution during the course of the time dimension for each sensor channel. This process can be observed in Figure 4, and the summary of hyperparameters for CNN networks is shown in Table 1.
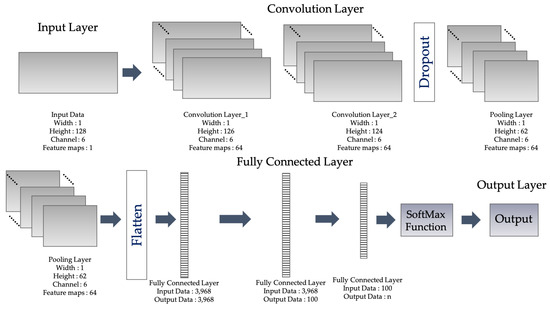
Figure 4.
The architecture of CNN (Convolution Neural Network).

Table 1.
The summary of hyperparameters for CNN networks proposed in this work.
(2) LSTM Model
At present, one deep learning type which has attracted much interest is Long Short-Term Memory (LSTM). This approach has shown excellent results when applied to complex problems, including the translation of languages, text generation, and the automatic captioning of images. LSTM networks are a kind of RNN (Recurrent Neural Network), designed to be applied to address sequence problems. In the context of a standard feedforward MLP network, the introduction of an RNN can be considered similar to adding further loops to the architecture. The LSTM computational units are the memory cells, or memory blocks, which are often simply referred to as cells. Neuron is the well-known term used for computational units and is so commonly-used in the context of MLPs that it has now come to be used frequently to describe LSTM memory cells. These cells contain both weights and gates, with the gates playing the key role in the work of the memory cell. The gates are weighted functions which control the flow of information inside the cells. Three types of gates exist, as follows:
where:
- Forget gate : Selects the information which is to be eliminated from the cell;
- Input gate : Selects the input values which are to be used in updating the memory state;
- Input modulation gate : Manipulates the preeminent input to the memory cell;
- Output gate : Selects the output on the basis of the input and the cell memory;
- Internal state : Manipulates the constitutional recurrence of cell;
- Hidden state : Manipulates the data from the preceding data case inward the context window.
LSTM cells are similar to neurons in that they are arranged in layers, as can be observed in Figure 5, whereby the output from each of the cells is then passed onto the next cell within the layer, and then onwards to the next network layer. When the final layer is reached, the output is passed further to the dense and softmax layers in order to address the problem of classification. Hyperparameters for LSTM networks are detailed in Table 2.
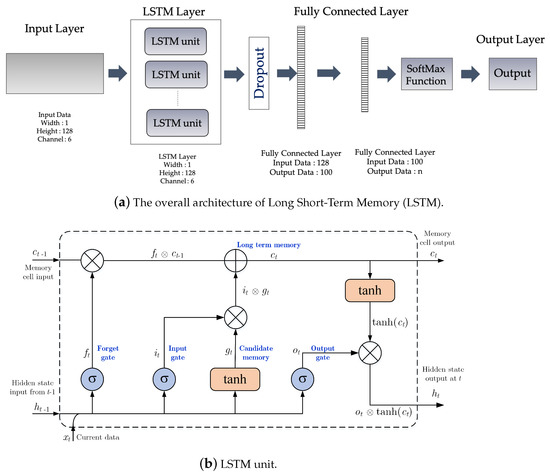
Figure 5.
The LSTM architecture: (a) The overall architecture of LSTM and (b) LSTM Unit.
Table 2.
The summary of hyperparameters for LSTM networks proposed in this work.
(3) CNN-LSTM Model
When faced with one-dimensional sequence data, for instance univariate time series data, CNN is highly effective when required to extract and earn the features of those data. Furthermore, it is possible to employ the CNN model in hybrid form, combined with a backend of LSTM, in which CNN has the role of interpreting the input sub-sequences which can then be passed in sequence to the LSTM model for further interpretation. The hybrid is known as the CNN-LSTM model and its architecture makes use of CNN layers to extract the features from the input data, whereupon the LSTM component provides the sequence prediction aspect. The CNN-LSTM model is able to read the sub-sequences derived from the main sequence in the form of blocks by, initially, extracting the principal features from each of the blocks before LSTM interprets those features. Figure 6 and Table 3 present the CNN-LSTM architecture and their hyperparameters, respectively.
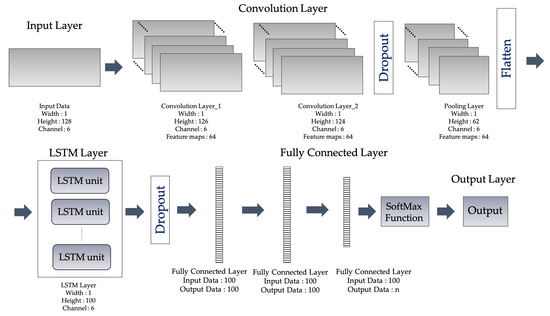
Figure 6.
The architecture of CNN-LSTM.
Table 3.
The summary of hyperparameters for CNN-LSTM networks proposed in this work.
(4) ConvLSTM Model
One particular kind of LSTM model is ConvLSTM, in which each of the LSTM units contains the convolutional input-reading component as shown in Figure 7. This ConvLSTM model was created to read spatial-temporal data in two dimensions, but with adjustments, it can also be employed in the context of forecasting for univariate time series. One additional function of this CNN-LSTM concept is that the CNN convolutions can be carried out as a component of the LSTM. ConvLSTM replaces matrix multiplication with convolution operation at each gate in the LSTM unit. By doing so, it captures underlying spatial features by convolution operations in multiple-dimensional data. The ConvLSTM differs from the CNN-LSTM in the following ways:
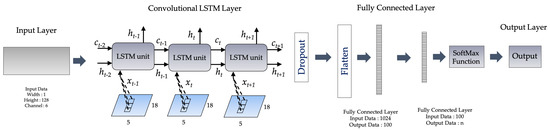
Figure 7.
The architecture of ConvLSTM.
- For CNN-LSTM, the convolution structure is applied as the first layer, and sequentially, an LSTM layer is applied as the second layer;
- For the number of input dimensions, as LSTM input data is one-dimensional, it is not suitable for spatial sequential data. ConvLSTM is designed for 3D data as its input.
The summary of hyperparameters for ConvLSTM networks in this work is presented in Table 4.
Table 4.
The summary of hyperparameters for ConvLSTM networks proposed in this work.
3.1.4. User Identification
In this study, in the stage of user identification, different deep learning classifiers are implemented. An Activity Classifier (AC) is able to characterize the identity of the activities from the given sensory data, as follows:
- A User Classifier (UC) is able to characterize the user from the human activities data;
- An Ensemble Classifier (EC) obtained as the combination of the one AC to detect the activity and UC classifiers to identify the user from sensory data.
The vital architecture of the ensemble classifier is depicted in Figure 8. The ensemble classifier EC consists of two layers, as follows:
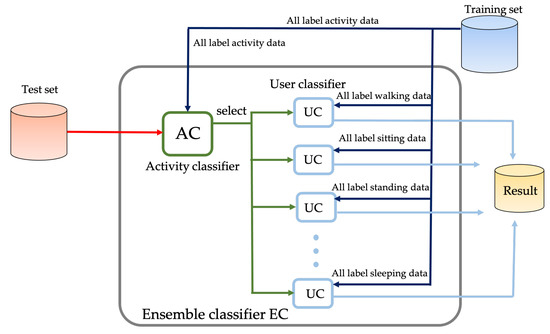
Figure 8.
The architecture of the ensemble classifier Ensemble Classifier (EC).
- First layer: The activity classification is operated through the AC;
- Second layer: The UC is used to perform the user identification.
4. Experiments and Results
To evaluate the achievement of the proposed approach for the biometric user identification based on HAR, a set of performed experiments is described in this section.
4.1. Data Analysis
Two datasets that are commonly-used in HAR are utilized to assess the performance of the proposed method, as follows:
- First Dataset—The UCI Human Activity Recognition Dataset (UCI HAR), recorded with an embedded accelerometer and gyroscope in a smartphone (Samsung Galaxy S II) on the waists of 30 subjects. The recorded data are tri-axial linear acceleration and tri-axial angular velocity at a constant rate, with a sampling rate of 50 Hz. The subjects were instructed according to the protocol of six selected activities, namely, Standing (St), Sitting (Si), Lying (Sl), Walking Forward (WF), Walking Upstairs (WU), and Walking Downstairs (WD);
- Second Dataset—The USC Human Activity Dataset (USC HAD), recorded with a MotionNode device-embedded tri-axial accelerometer and gyroscope sensors at a sampling rate of 100 Hz. The dataset has activity data recorded with 14 subjects performing 12 activities and five trials each. The activities are ones with the most elemental movements, as follows: Walking Forward (WF), Walking Left (WL), Walking Right (WF), Walking Upstairs (WU), Walking Downstairs (WD), Running Forward (WF), Jumping Up (JU), Sitting (Si), Standing (St), Sleeping (Sl), Elevating Up (EU), and Elevating Down (ED).
Table 5 shows a summary of these two datasets. Activities and their descriptions of both datasets are shown in Table 6. An abbreviation of each activity is defined, as shown in Table 7. The table also presents the proportion of activity samples in each dataset.
Table 5.
Activities and their summary.
Table 6.
Activities and their descriptions.
Table 7.
The sample number of each activity on each dataset.
4.2. Hardware and Software Setup
In this study, research experiments were conducted on a machine using an Intel i5-8400 CPU, 16 GB of RAM, and Nvidia RTX2070 GPU. The experiments work in a Python programming language environment and Keras API, as detailed below:
- TensorFlow (version 2.2.0);
- Python (version 3.6.8);
- Keras (version 2.3.1).
4.3. Experimental Setup
The objective topic of the evaluation is to assess the effectiveness of the proposed classifiers (AC, UC, and EC) by observing the identity of a wearable user carrying a wearable device, while performing activities. According to the described objectives, the following experiments are conducted:
- Activity classifier (AC), with both UCI HAR and USC HAD datasets, is used to perform activity identification in each dataset;
- The UC is used to perform user identification of each activity;
- The EC is used to present user identification, regardless of activity.
All experiments are used to evaluate four deep learning techniques, as described in Section 3, namely, CNN, LSTM, CNN-LSTM, and ConvLSTM deep learning model.
4.4. Evaluation Metrics
To determine the performance of the proposed approach, four evaluation metrics are calculated for the classification results, as follows:
- Accuracy (A) is a description of systematic errors. This metric is the ratio of the sum of true positives (TP) and true negatives (TN) to the total number of records;
- Precision (P) is the proportion of the example belonging to the class of a specific category. It is the ratio of the number of relevant retrieved records (TP) to the total number of irrelevant retrieved records;
- Recall (R) is the proportion of examples allowed to the class of a specific category. It is calculated as the ratio of the number of retrieved relevant records (TP) to the total number of relevant records;
- F1-score (F1) is an evaluation of the test’s accuracy calculated as a weighted average of the precision and recall.
For this multi-classification complication, the calculation steps of the evaluation metrics are shown in the Evaluation Measurement Algorithm 1 below.
4.5. Results and Discussion
The major metrics (i.e., the accuracy, precision, recall, and F1-score) are utilized in order to assess the achievement of the classifiers. The classifier AC objective distinguishes the activity among six possible activities (WF, WU, WD, Si, St, and Sl) from the UCI HAR dataset, and 12 activities (WF, WL, WR, WU, WD, RF, JU, Si, St, Sl, EU, and ED) from the USC HAD dataset. The activities are categorized into two types, as follows:
- Static Activities: In this environment; sitting, standing, and sleeping activities are considered, where people are stable with respect to the sensor setup in the situation;
- Dynamic Activities: In this environment, walking, jumping up, and running forward are considered, where people are moving continually with respect to the sensor.
| Algorithm 1: Evaluation Measurement |
|
In Table 8, these activities are divided into dynamic and static activities.
Table 8.
Two categories of activities from the UCI HAR and USC HAD dataset.
To achieve our research goal, two different classifiers (AC and UC) are implemented as a pre-processing step of the hierarchical ensemble classifier proposed as the main architecture and illustrated in Figure 8. The ensemble classifier EC consists of two layers. In the first layer, the activity identification is performed by the AC classifier. Then the UC classifier is used to perform biometric user identification.
In the pre-processing step of finding the AC classifier, the percentage of accuracy is about 91.235% by ConvLSTM using the UCI HAR dataset. For the USC HAD dataset, the percentage of accuracy is about 87.773% by CNN-LSTM. The related metrics are presented in Table 9.
Table 9.
An experimental result of activity identification of the user classifier Activity Classifier (AC).
From Table 9, the results of activity identification report good classification results with a high average accuracy. In particular, it is interesting to observe that both activity dataset (UCI HAR and USC HAD) are well classified by the CNN-LSTM deep learning model. However, these experimental results are not state-of-the-art results [38,39].
If an activity of a user has been settled, user classifier separation for each activity can be applied for user identification with both datasets. After that, the data from one reaction are applied for training and testing only. In this case, the data are split into 70% and 30% for training and testing purposes, respectively.
The mean percentage of accuracy is 92.444% for dynamic activities by the CNN-LSTM deep learning model, using the UCI HAR dataset. The worst result provided by all static activities (sitting, standing, and sleeping) has the highest mean percentage of accuracy, 62.785%, by the LSTM model. Nonetheless, the highest mean accuracy of 92.444% is acceptable, if only the top three walking-related activities (walking forward, walking upstairs, and walking downstairs) are considered. The related results are shown in Table 10 and Figure 9.
Table 10.
An experimental result of user identification of the User Classifier (UC) using the UCI HAR dataset.
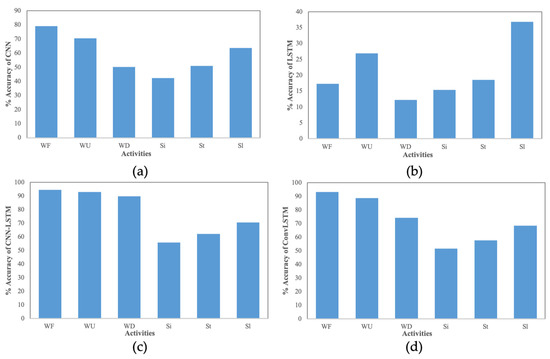
Figure 9.
Percentages of testing accuracy values of UCI HAR dataset by each deep learning model (a) CNN, (b) LSTM, (c) CNN-LSTM, and (d) ConvLSTM.
For the USC HAD dataset, the ConvLSTM model provides the highest average accuracy, 87.178%, for the dynamic activity and the CNN-LSTM model provides the highest average accuracy, 78.698%, for static activity. However, if one considers only the top three activities of walking (walking forward, walking left, and walking right), the highest mean accuracy is 95.858% by CNN-LSTM. Other evaluated metrics of the UC is present in Table 11 and Figure 10.
Table 11.
An experimental result of user identification of the UC using the USC HAD dataset.
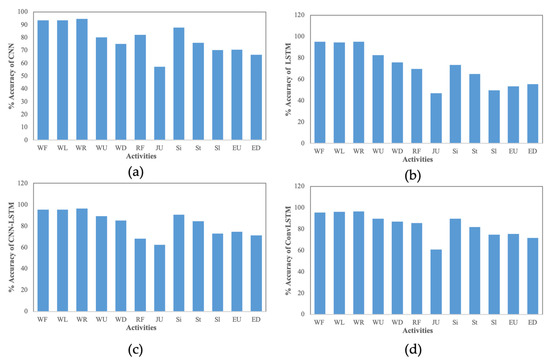
Figure 10.
Percentages of testing accuracy values of USC HAD dataset by each deep learning model (a) CNN, (b) LSTM, (c) CNN-LSTM, and (d) ConvLSTM.
4.6. Additional Experiment
To solve the problem of user identification, we set up an additional experiment to evaluate the performance of ensemble classifiers for UCI HAR and USC HAD datasets, selected only with walking-related activity data. Based on the previous experiment’s results, we selected the CNN-LSTM deep learning model for the AC and UC as illustrated in Figure 11.
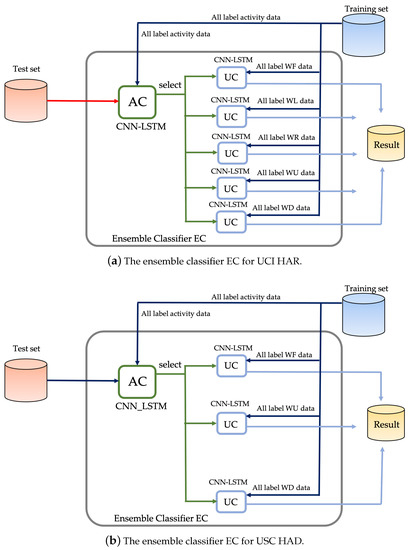
Figure 11.
The architecture of the ensemble classifier EC for (a) UCI HAR and (b) USC HAD.
The results show that the proposed ensemble method provides a high percentage of accuracy values, as shown in Table 12. By using walking-related activity data (walking forward, walking upstairs, and walking downstairs) from the UCI HAR dataset, the proposed ensemble method gives an accuracy of 91.776%. With a similar result, the proposed ensemble method gives an accuracy of 92.432% by using the USC HAD dataset, selecting only walking-related activity data (walking forward, walking left, walking right, walking upstairs, and walking downstairs).
Table 12.
An experimental result of user identification using walking-related activity data.
4.7. Comparison with Previous Works
The proposed ensemble classifier, based on the deep learning model is compared with existing models trained by the same dataset (USC HAD). Previous studies [17] use statistical and heuristic gait attributes on the application, called the random projection method. The proposed method of previous work was tested with three walking-related activities (walking forward, walking left, and walking right) from the USC HAD dataset. The comparative results are summarized in Table 13. The proposed ensemble classifier outperforms the random projection method.
Table 13.
Performance of comparison results.
5. Conclusions
Biometric technology provides advanced and highly difficult to duplicate security techniques by which a person’s individual identity can be confirmed. In this article, an ensemble method for biometric user identification, with a basis on the recognition of human activity by employing wearable sensors, was presented. As a result of the continuous utilization of accelerometers and gyroscopes by users of wearable devices, there is a remarkable potential for the improvement of identification of users in the analysis of human activity.
The ensemble method that is proposed was developed using experiments involving four specific deep learning models, selected to enhance user identification efficiency. Two basic models, namely, the Convolutional Neural Network (CNN) and the Long-Short Term Memory (LSTM) neural network, from the four models of deep learning (CNN, LSTM, CNN-LSTM, and ConvLSTM) were adopted. Offline data from the UCI HAR and USC HAD datasets were used in the testing of the proposed method. With regard to the results concerned with user identification, the findings for the two models indicated high accuracy levels for all users, at 91.78% and 92.43%, respectively. Moreover, the finding model for USC HAD demonstrated acceptable levels with the highest accuracy of walking-related activities for all users at 95.86%, when compared with the previous research work.
The implementing of biometric user identification based on mobile platforms and the conducting of real-time experiments with subjects, will be included in future research work.
Author Contributions
Conceptualization and model analysis, S.M.; resource and data curation, A.J.; methodology and validation, S.M.; data visualization and graphic improvement, A.J.; discussion and final editing, S.M.; writing-review and editing, S.M.; funding acquisition, S.M. and A.J. All authors have read and agreed to the published version of the manuscript.
Funding
This research was funded by the University of Phayao (grant number: FF64-UoE008) and King Mongkut’s University of Technology, North Bangkok (grant number: KMUTNB-BasicR-64-33-2).
Conflicts of Interest
The authors declare no conflict of interest.
References
- Slim, S.O.; Atia, A.; Elfattah, M.M.; Mostafa, M.S.M. Survey on Human Activity Recognition based on Acceleration Data. Int. J. Adv. Comput. Sci. Appl. 2019, 10, 84–98. [Google Scholar] [CrossRef]
- Issarny, V.; Sacchetti, D.; Tartanoglu, F.; Sailhan, F.; Chibout, R.; Levy, N.; Talamona, A. Developing Ambient Intelligence Systems: A Solution based on Web Services. Autom. Softw. Eng. 2005, 12, 101–137. [Google Scholar] [CrossRef]
- Mekruksavanich, S.; Jitpattanakul, A.; Youplao, P.; Yupapin, P. Enhanced Hand-Oriented Activity Recognition Based on Smartwatch Sensor Data Using LSTMs. Symmetry 2020, 12, 1570. [Google Scholar] [CrossRef]
- Osmani, V.; Balasubramaniam, S.; Botvich, D. Human Activity Recognition in Pervasive Health-Care: Supporting Efficient Remote Collaboration. J. Netw. Comput. Appl. 2008, 31, 628–655. [Google Scholar] [CrossRef]
- Ehatisham-ul Haq, M.; Azam, M.A.; Loo, J.; Shuang, K.; Islam, S.; Naeem, U.; Amin, Y. Authentication of Smartphone Users Based on Activity Recognition and Mobile Sensing. Sensors 2017, 17, 2043. [Google Scholar] [CrossRef] [PubMed]
- Mekruksavanich, S.; Jitpattanakul, A. Smartwatch-based Human Activity Recognition Using Hybrid LSTM Network. In Proceedings of the 2020 IEEE Sensors, Rotterdam, The Netherlands, 25–28 October 2020; pp. 1–4. [Google Scholar] [CrossRef]
- Drosou, A.; Ioannidis, D.; Moustakas, K.; Tzovaras, D. Spatiotemporal analysis of human activities for biometric authentication. Comput. Vis. Image Underst. 2012, 116, 411–421. [Google Scholar] [CrossRef]
- Mahfouz, A.; Mahmoud, T.M.; Eldin, A.S. A Survey on Behavioral Biometric Authentication on Smartphones. arXiv 2018, arXiv:1801.09308. [Google Scholar] [CrossRef]
- Mekruksavanich, S.; Jitpattanakul, A. Convolutional Neural Network and Data Augmentation for Behavioral-Based Biometric User Identification. In ICT Systems and Sustainability; Tuba, M., Akashe, S., Joshi, A., Eds.; Springer: Singapore, 2021; pp. 753–761. [Google Scholar]
- Lara, O.; Labrador, M. A Survey on Human Activity Recognition Using Wearable Sensors. IEEE Commun. Surv. Tutor. 2013, 15, 1192–1209. [Google Scholar] [CrossRef]
- Hnoohom, N.; Mekruksavanich, S.; Jitpattanakul, A. Human Activity Recognition Using Triaxial Acceleration Data from Smartphone and Ensemble Learning. In Proceedings of the 2017 13th International Conference on Signal-Image Technology Internet-Based Systems (SITIS), Jaipur, India, 4–7 December 2017; pp. 408–412. [Google Scholar] [CrossRef]
- Chrungoo, A.; Manimaran, S.S.; Ravindran, B. Activity Recognition for Natural Human Robot Interaction. In Social Robotics; Beetz, M., Johnston, B., Williams, M.A., Eds.; Springer International Publishing: Cham, Switzerland, 2014; pp. 84–94. [Google Scholar]
- Gehrig, D.; Krauthausen, P.; Rybok, L.; Kuehne, H.; Hanebeck, U.D.; Schultz, T.; Stiefelhagen, R. Combined Intention, Activity, and Motion Recognition for a Humanoid Household Robot. In Proceedings of the IEEE/RSJ International Conference on Intelligent Robots and Systems (IROS 2011), San Francisco, CA, USA, 25–30 September 2011. [Google Scholar]
- Yousefi, B.; Loo, C.K. Biologically-Inspired Computational Neural Mechanism for Human Action/activity Recognition: A Review. Electronics 2019, 8, 1169. [Google Scholar] [CrossRef]
- Mekruksavanich, S.; Jitpattanakul, A. Exercise Activity Recognition with Surface Electromyography Sensor using Machine Learning Approach. In Proceedings of the 2020 Joint International Conference on Digital Arts, Media and Technology with ECTI Northern Section Conference on Electrical, Electronics, Computer and Telecommunications Engineering (ECTI DAMT and NCON), Pattaya, Thailand, 11–14 March 2020; pp. 75–78. [Google Scholar] [CrossRef]
- Tripathi, R.K.; Jalal, A.S.; Agrawal, S.C. Suspicious Human Activity Recognition: A Review. Artif. Intell. Rev. 2018, 50, 283–339. [Google Scholar] [CrossRef]
- Damaševičius, R.; Maskeliūnas, R.; Venčkauskas, A.; Woźniak, M. Smartphone User Identity Verification Using Gait Characteristics. Symmetry 2016, 8, 100. [Google Scholar] [CrossRef]
- Rault, T.; Bouabdallah, A.; Challal, Y.; Marin, F. A Survey of Energy-Efficient Context Recognition Systems Using Wearable Sensors for Healthcare Applications. Pervasive Mob. Comput. 2017, 37, 23–44. [Google Scholar] [CrossRef]
- Fookes, C.; Denman, S.; Lakemond, R.; Ryan, D.; Sridharan, S.; Piccardi, M. Semi-supervised intelligent surveillance system for secure environments. In Proceedings of the 2010 IEEE International Symposium on Industrial Electronics, Bari, Italy, 4–7 July 2010; pp. 2815–2820. [Google Scholar]
- Zhou, Z.; Chen, X.; Chung, Y.C.; He, Z.; Han, T.; Keller, J. Activity Analysis, Summarization, and Visualization for Indoor Human Activity Monitoring. IEEE Trans. Circuits Syst. Video Technol. 2008, 18, 1489–1498. [Google Scholar] [CrossRef]
- Zhan, Y.; Miura, S.; Nishimura, J.; Kuroda, T. Human Activity Recognition from Environmental Background Sounds for Wireless Sensor Networks. In Proceedings of the 2007 IEEE International Conference on Networking, Sensing and Control, London, UK, 15–17 April 2007; pp. 307–312. [Google Scholar]
- Dong, B.; Biswas, S. Wearable Networked Sensing for Human Mobility and Activity Analytics: A Systems Study. In Proceedings of the 2012 Fourth International Conference on Communication Systems and Networks (COMSNETS 2012), Bangalore, India, 3–7 January 2012; Volume 2012, pp. 1–6. [Google Scholar] [CrossRef]
- Curone, D.; Bertolotti, G.M.; Cristiani, A.; Secco, E.L.; Magenes, G. A Real-Time and Self-Calibrating Algorithm Based on Triaxial Accelerometer Signals for the Detection of Human Posture and Activity. IEEE Trans. Inf. Technol. Biomed. 2010, 14, 1098–1105. [Google Scholar] [CrossRef] [PubMed]
- Wang, J.; Chen, Y.; Hao, S.; Peng, X.; Hu, L. Deep learning for sensor-based activity recognition: A survey. Pattern Recognit. Lett. 2019, 119, 3–11. [Google Scholar] [CrossRef]
- Jiang, W.; Yin, Z. Human Activity Recognition Using Wearable Sensors by Deep Convolutional Neural Networks. In Proceedings of the 23rd ACM International Conference on Multimedia (MM ’15), Brisbane, Australia, 26–30 October 2015; Association for Computing Machinery: New York, NY, USA, 2015; pp. 1307–1310. [Google Scholar] [CrossRef]
- Zhang, L.; Wu, X.; Luo, D. Recognizing Human Activities from Raw Accelerometer Data Using Deep Neural Networks. In Proceedings of the 2015 IEEE 14th International Conference on Machine Learning and Applications (ICMLA), Miami, FL, USA, 9–11 December 2015; pp. 865–870. [Google Scholar]
- Ordóñez, F.; Roggen, D. Deep Convolutional and LSTM Recurrent Neural Networks for Multimodal Wearable Activity Recognition. Sensors 2016, 16, 115. [Google Scholar] [CrossRef]
- Hammerla, N.Y.; Halloran, S.; Plötz, T. Deep, Convolutional, and Recurrent Models for Human Activity Recognition Using Wearables. In Proceedings of the Twenty-Fifth International Joint Conference on Artificial Intelligence (IJCAI’16), New York, NY, USA, 9–15 July 2016; AAAI Press: Menlo Park, CA, USA, 2016; pp. 1533–1540. [Google Scholar]
- Chavarriaga, R.; Sagha, H.; Calatroni, A.; Digumarti, S.T.; Tröster, G.; Millán, J.d.R.; Roggen, D. The Opportunity challenge: A benchmark database for on-body sensor-based activity recognition. Pattern Recognit. Lett. 2013, 34, 2033–2042. [Google Scholar] [CrossRef]
- Plötz, T.; Hammerla, N.Y.; Olivier, P. Feature Learning for Activity Recognition in Ubiquitous Computing. In Proceedings of the Twenty-Second International Joint Conference on Artificial Intelligence (IJCAI’11), Barcelona, Spain, 16–22 July 2011; AAAI Press: Menlo Park, CA, USA, 2011; Volume 2, pp. 1729–1734. [Google Scholar]
- Anguita, D.; Ghio, A.; Oneto, L.; Parra, X.; Reyes-Ortiz, J. A Public Domain Dataset for Human Activity Recognition using Smartphones. In Proceedings of the ESANN 2013 Proceedings, European Symposium on Artificial Neural Networks, Computational Intelligence and Machine Learning, Bruges, Belgium, 24–26 April 2013. [Google Scholar]
- Kataria, A.N.; Adhyaru, D.M.; Sharma, A.K.; Zaveri, T.H. A survey of automated biometric authentication techniques. In Proceedings of the 2013 Nirma University International Conference on Engineering (NUiCONE), Ahmedabad, India, 28–30 November 2013; pp. 1–6. [Google Scholar]
- Ailisto, H.J.; Lindholm, M.; Mantyjarvi, J.; Vildjiounaite, E.; Makela, S.M. Identifying people from gait pattern with accelerometers. In Biometric Technology for Human Identification II; Jain, A.K., Ratha, N.K., Eds.; International Society for Optics and Photonics, SPIE: Bellingham, WA, USA, 2005; Volume 5779, pp. 7–14. [Google Scholar] [CrossRef]
- Kwapisz, J.R.; Weiss, G.M.; Moore, S.A. Cell phone-based biometric identification. In Proceedings of the 2010 Fourth IEEE International Conference on Biometrics: Theory, Applications and Systems (BTAS), Washington, DC, USA, 27–29 September 2010; pp. 1–7. [Google Scholar]
- Juefei-Xu, F.; Bhagavatula, C.; Jaech, A.; Prasad, U.; Savvides, M. Gait-ID on the move: Pace independent human identification using cell phone accelerometer dynamics. In Proceedings of the 2012 IEEE Fifth International Conference on Biometrics: Theory, Applications and Systems (BTAS), Arlington, VA, USA, 23–27 September 2012; pp. 8–15. [Google Scholar]
- Zhang, M.; Sawchuk, A. USC-HAD: A daily activity dataset for ubiquitous activity recognition using wearable sensors. In Proceedings of the 2012 ACM Conference on Ubiquitous Computing, Pittsburgh, PA, USA, 5–8 September 2012; pp. 1036–1043. [Google Scholar] [CrossRef]
- Pires, I.M.; Hussain, F.; Garcia, N.M.; Zdravevski, E. Improving Human Activity Monitoring by Imputation of Missing Sensory Data: Experimental Study. Future Internet 2020, 12, 155. [Google Scholar] [CrossRef]
- Xia, K.; Huang, J.; Wang, H. LSTM-CNN Architecture for Human Activity Recognition. IEEE Access 2020, 8, 56855–56866. [Google Scholar] [CrossRef]
- Cho, H.; Yoon, S.M. Divide and Conquer-Based 1D CNN Human Activity Recognition Using Test Data Sharpening. Sensors 2018, 18, 1055. [Google Scholar] [CrossRef]
Publisher’s Note: MDPI stays neutral with regard to jurisdictional claims in published maps and institutional affiliations. |
© 2021 by the authors. Licensee MDPI, Basel, Switzerland. This article is an open access article distributed under the terms and conditions of the Creative Commons Attribution (CC BY) license (http://creativecommons.org/licenses/by/4.0/).