1. Introduction
Nowadays, the electric power service is an extremely important factor for society’s development [
1,
2]. In this sense, the relation between generation and demand energy is an aspect that must be analyzed to determine trends and, thus, propose actions to improve the general performance of the electrical network [
3]. In particular, the best scenario is when energy demand is lower than energy generation, which promotes the energy export process, while the worst-case scenario is when energy demand is higher than energy generation, which causes the need to start the energy importation process. The last-mentioned occurs when there is a deficit in energy generation considering both conventional and renewable energy generation systems. Additionally, the last has an important effect on the ecological footprint [
4,
5]. On many occasions, this deficit is sought to be reduced through energy generation at a massive level, that is, the implementation of a few high power plants (power term can be used interchangeably with energy term). However, this conventional option still presents various trade-offs and challenges, e.g., power generation is carried out far from the end-user, which is why the energy costs are high, in addition to various technical problems [
6,
7,
8].
An option to reduce the energy deficit in a region is to implement Active Buildings (ABs), which can be considered as domestic, commercial, and industrial buildings [
9,
10]. In general terms, an Active Building has six fundamental principles such as (1) bioclimatic architecture (related to the Passivhaus standard), (2) energy-efficient systems with performance monitoring, (3) on-site renewable energy generation, (4) energy storage, (5) electric vehicle integration, and (6) smartly managed integration with micro-grids and national energy networks [
11,
12,
13]. On the other hand, even though Active Buildings can be self-sufficient, they are not designed to operate in an isolated way. In fact, they use their ability to generate and store energy to exchange or trade with other buildings, the national grid, or electric vehicles [
14,
15]. The aforementioned promote that energy communities are more resilient to sudden changes in energy supply or demand [
16,
17]. Additionally, ABs promote electrical grid stability, reduce greenhouse gas emissions, decarbonize the economy, among others [
18,
19].
Additionally, the Active Building concept is related to the Positive Energy Building (PEB) term. Particularly, PEBs produce more energy from renewable energy sources than the energy demand necessary to achieve a certain comfort level and supply energy to internal electrical loads, but it does not consider all the elements mentioned that define an AB. In this sense, there are many types of PEBs, e.g., a Zero Energy Footprint Building, All-Energy Positive Building, Positive Energy Building, Net Zero Energy Building, and nearby Zero Energy Building [
20,
21,
22].
In a certain way, the Passivhaus standard can be used for the design of an Active Building, both for new buildings and energy-rehabilitated buildings [
23,
24]. In particular, the Passivhaus standard stipulates, initially, some parameters related to thermal loads, energy demands, airtightness, and renewable primary energy generation that can support the Active Building concept [
25]. Although the Passivhaus standard does not formally take into account the electric vehicle integration principle that the Active Building concept does consider. Furthermore, the Passivhaus standard promotes the Energy Positive Building concept for the Passivhaus Plus and Premium standard levels. A relevant aspect of the Passivhaus standard is that it promotes the Zero-energy community concept while making the buildings more comfortable, reliable, affordable to build and operate, and sustainable for different climates [
26,
27,
28,
29,
30]. Moreover, as an alternative to reduce the energy deficit in the electrical network, Distributed Energy Resources (DERs) projects have been developed using renewable and conventional energy [
31,
32,
33]. However, in most cases, distributed generation does not imply the existence of Active Buildings, i.e., electricity generated through renewable or conventional energy sources is transferred to the public or private electricity grid, but it is not intended to meet any requirements related to the Active Building concept. In addition to the aforementioned relation, it is not common to have distributed generation projects based on Active Building and standard Passivhaus concepts. Additionally, to the best of our knowledge, performance results of buildings, or building projects, have not been reported that consider, at the same time, the concepts of distributed generation, the Passivhaus standard, and Active Building.
The rest of this manuscript is organized as follows: In
Section 2, the contextual and theoretical backgrounds are explained. In particular,
Section 2.1 describes the National Electrical System of Mexico.
Section 2.2 shows the Passivhaus standard criteria. Next,
Section 3 presents the methodology for energy rehabilitation buildings, emphasizing the positive contribution of energy.
Section 4 shows the positive energy building analysis. Next,
Section 5 describes the electrical network and the performance regarding the import–export energy.
Section 6 presents a brief discussion about the results and implications. Finally, conclusions and recommendations are given in
Section 7.
2. Contextual Background
In this section, the National Electricity System (NES) of Mexico is described in a general way, emphasizing the relation between generation and demand energy. Moreover, the criteria used by the Passivhaus standard in its three different levels (i.e., Classic, Plus, and Premium) is shown, to clarify the positive energy contribution of buildings to the public electricity grid based on the Passivhaus standard.
2.1. Description and Problems of the National Electrical System
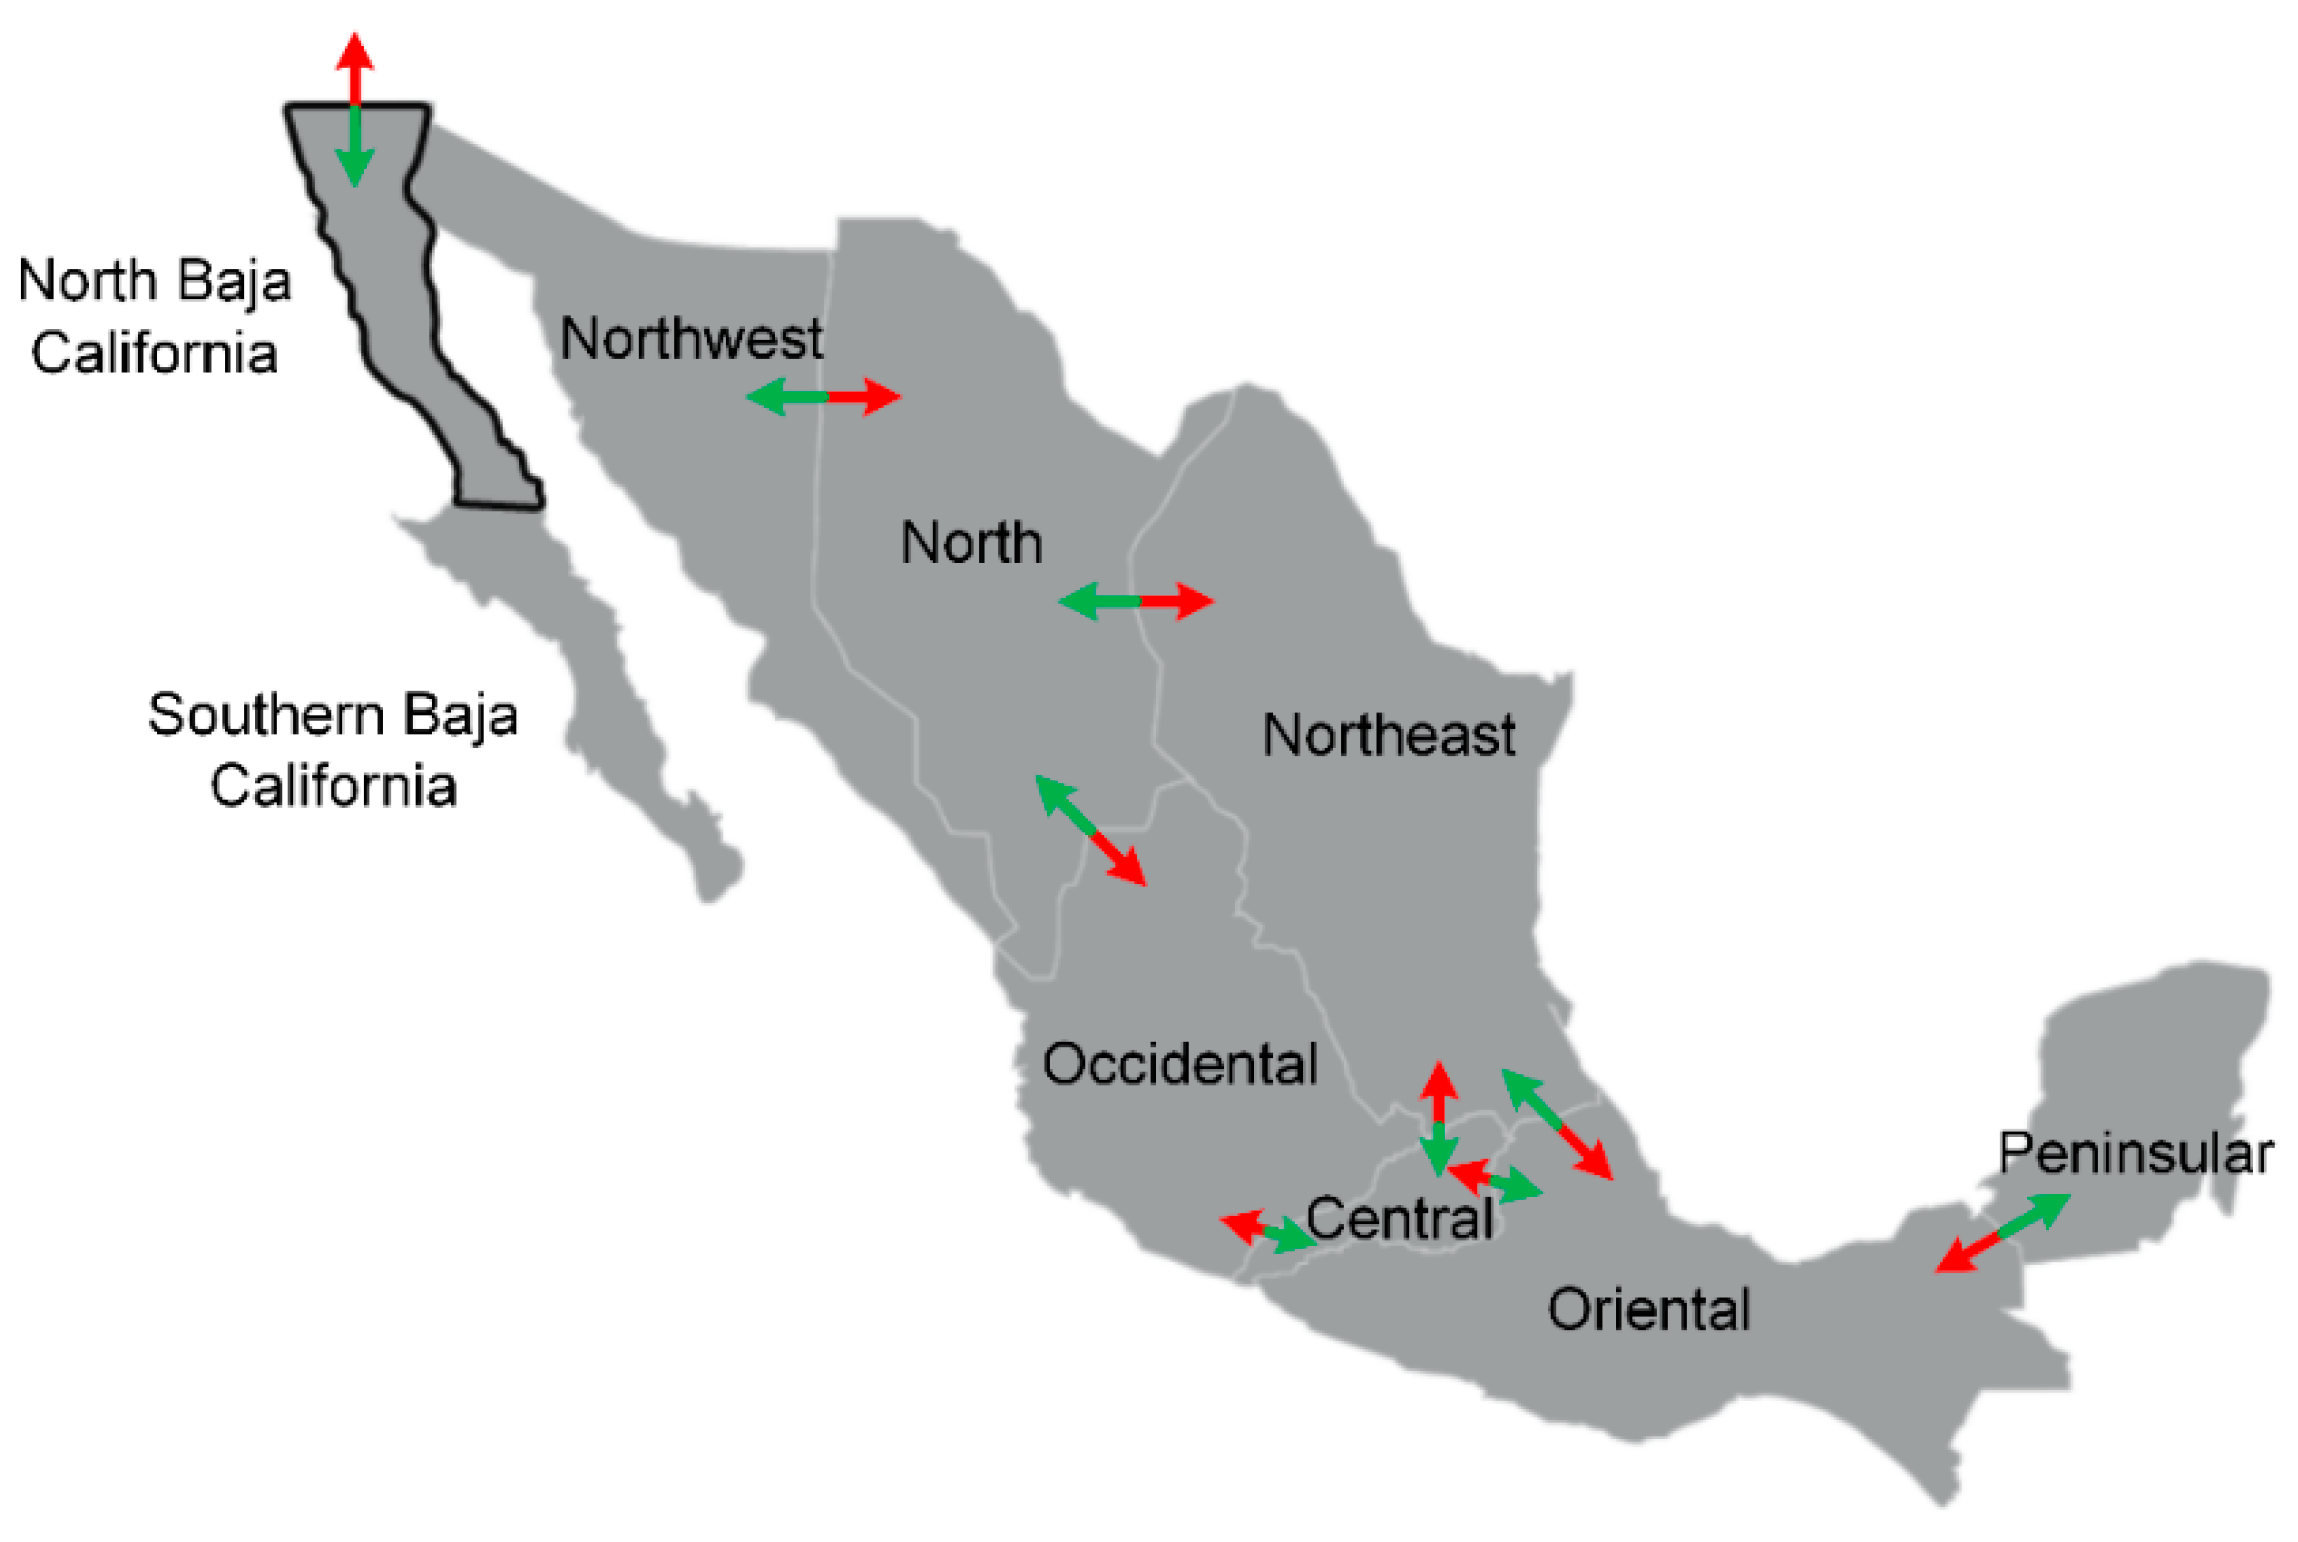
The National Electric System is the public electricity grid that provides electric power service to all locations of Mexico, both to the public and private sectors. In particular, the NES is organized in nine regions, which are: North Baja California, Southern Baja California, Northwest, North, Northeast, Occidental, Central, Oriental, and Peninsular.
Figure 1 shows the distribution of the regions across the country. However, the NES has some particularities that make energy management complex in some regions. For example, both North Baja California and Southern Baja California regions are electrically isolated, that is, there are no electrical connections with other regions. In the same sense, the remaining regions are interconnected, which is why there is an energy exchange process between them.
Indeed, in the North Baja California region, being isolated, energy imports (from the United State of America, and up to 600 MW) are carried out to a greater extent, and energy exports to a much lesser extent.
Table 1 shows the overall analysis for each region that composes the NES. In particular, net energy generation, net energy demand, and net energy exchange parameters were analyzed for each region. Thus, there are regions in which the net generation and net demand are similar; therefore, the net exchange is low, e.g., the North region. Regarding the Southern Baja California and North Baja California regions, because they are isolated regions, the deficit and surplus energy is self-managed. However, some regions have a net generation greater than the net demand. This implies that they export energy to other regions, e.g., Northeast and Oriental regions, exporting up to ≈3798 MW and ≈3605 MW, respectively. On the other hand, some regions have a net generation less than the net demand, so they must import energy, for example, North Baja California, Central, and other regions. It is important to mention that, generally, the NES is based on centralized power generation and, to a lesser extent, on distributed power generation, i.e., distributed power generation only represents ≈4% of the installed power capacity. Therefore, the net generation at a national level is ≈80 GW.
2.2. Passivhaus Standard Criteria
The Passivhaus standard can be applied to new buildings as well as existing buildings. In the last case, some criteria were slightly modified. In general, the standard was based on five key points, such as (1) the building having adequate thermal insulation, (2) the uses of high-performance windows, (3) thermal-bridge free on the building envelopment, (4) high airtightness, and (5) comfort ventilation with high heat recovery. Considering the aforementioned parameters, a Passivhaus building reduces its energy consumption up to 90%, while the remaining 10% of energy can be generated by various thermal sources, as well as in situ renewable energy generation. According to the public information of Passivhaus standard, there are three certification levels to which a new and conventional building can apply for. The first is the Classic level, which requires a Renewable Primary Energy (RPE) demand of ≤60 kWh/m2y, but in situ Renewable Energy Generation (REG) is not required. Later, the Plus and Premium levels stipulate a reduction in the RPE demand (≤45 kWh/m2y and ≤30 kWh/m2y, respectively), and an increase in the REG (≥60 kWh/m2y and ≥120 kWh/m2y, respectively). The above implies that the Plus and Premium levels can support the development of building projects related to the diverse Positive Energy Building types (e.g., Zero Energy Footprint Building, All-Energy Positive Building, Positive Energy Building, Net Zero Energy Building, and nearby Zero Energy Building). Thus, the Classic level has an inadequate Energy Positive Building (EPB) contribution, that is, −60 kWh/m2y., while the Plus and Premium levels have +15 kWh/m2y and +90 kWh/m2y, respectively. In addition to the criteria mentioned, the Passivhaus standard considers the reduction in heating and cooling demands, heating and cooling loads, and a well-defined airtightness limit. However, the required value for these parameters is the same for all levels of the standard, i.e., Classic, Plus, and Premium.
3. Energy Rehabilitation of Building
To reduce the overall energy demand of a building, and meet the Energy Positive Building requirements, it is necessary to carry out an energy rehabilitation process for the building (see
Figure 2). Otherwise, the requirement for energy generation and supply to the electricity grid could be an unsustainable process, since the energy demand is also high. In particular, based on the Passivhaus standard criteria according to each level, certain limits must be met to improve energy efficiency, as shown in
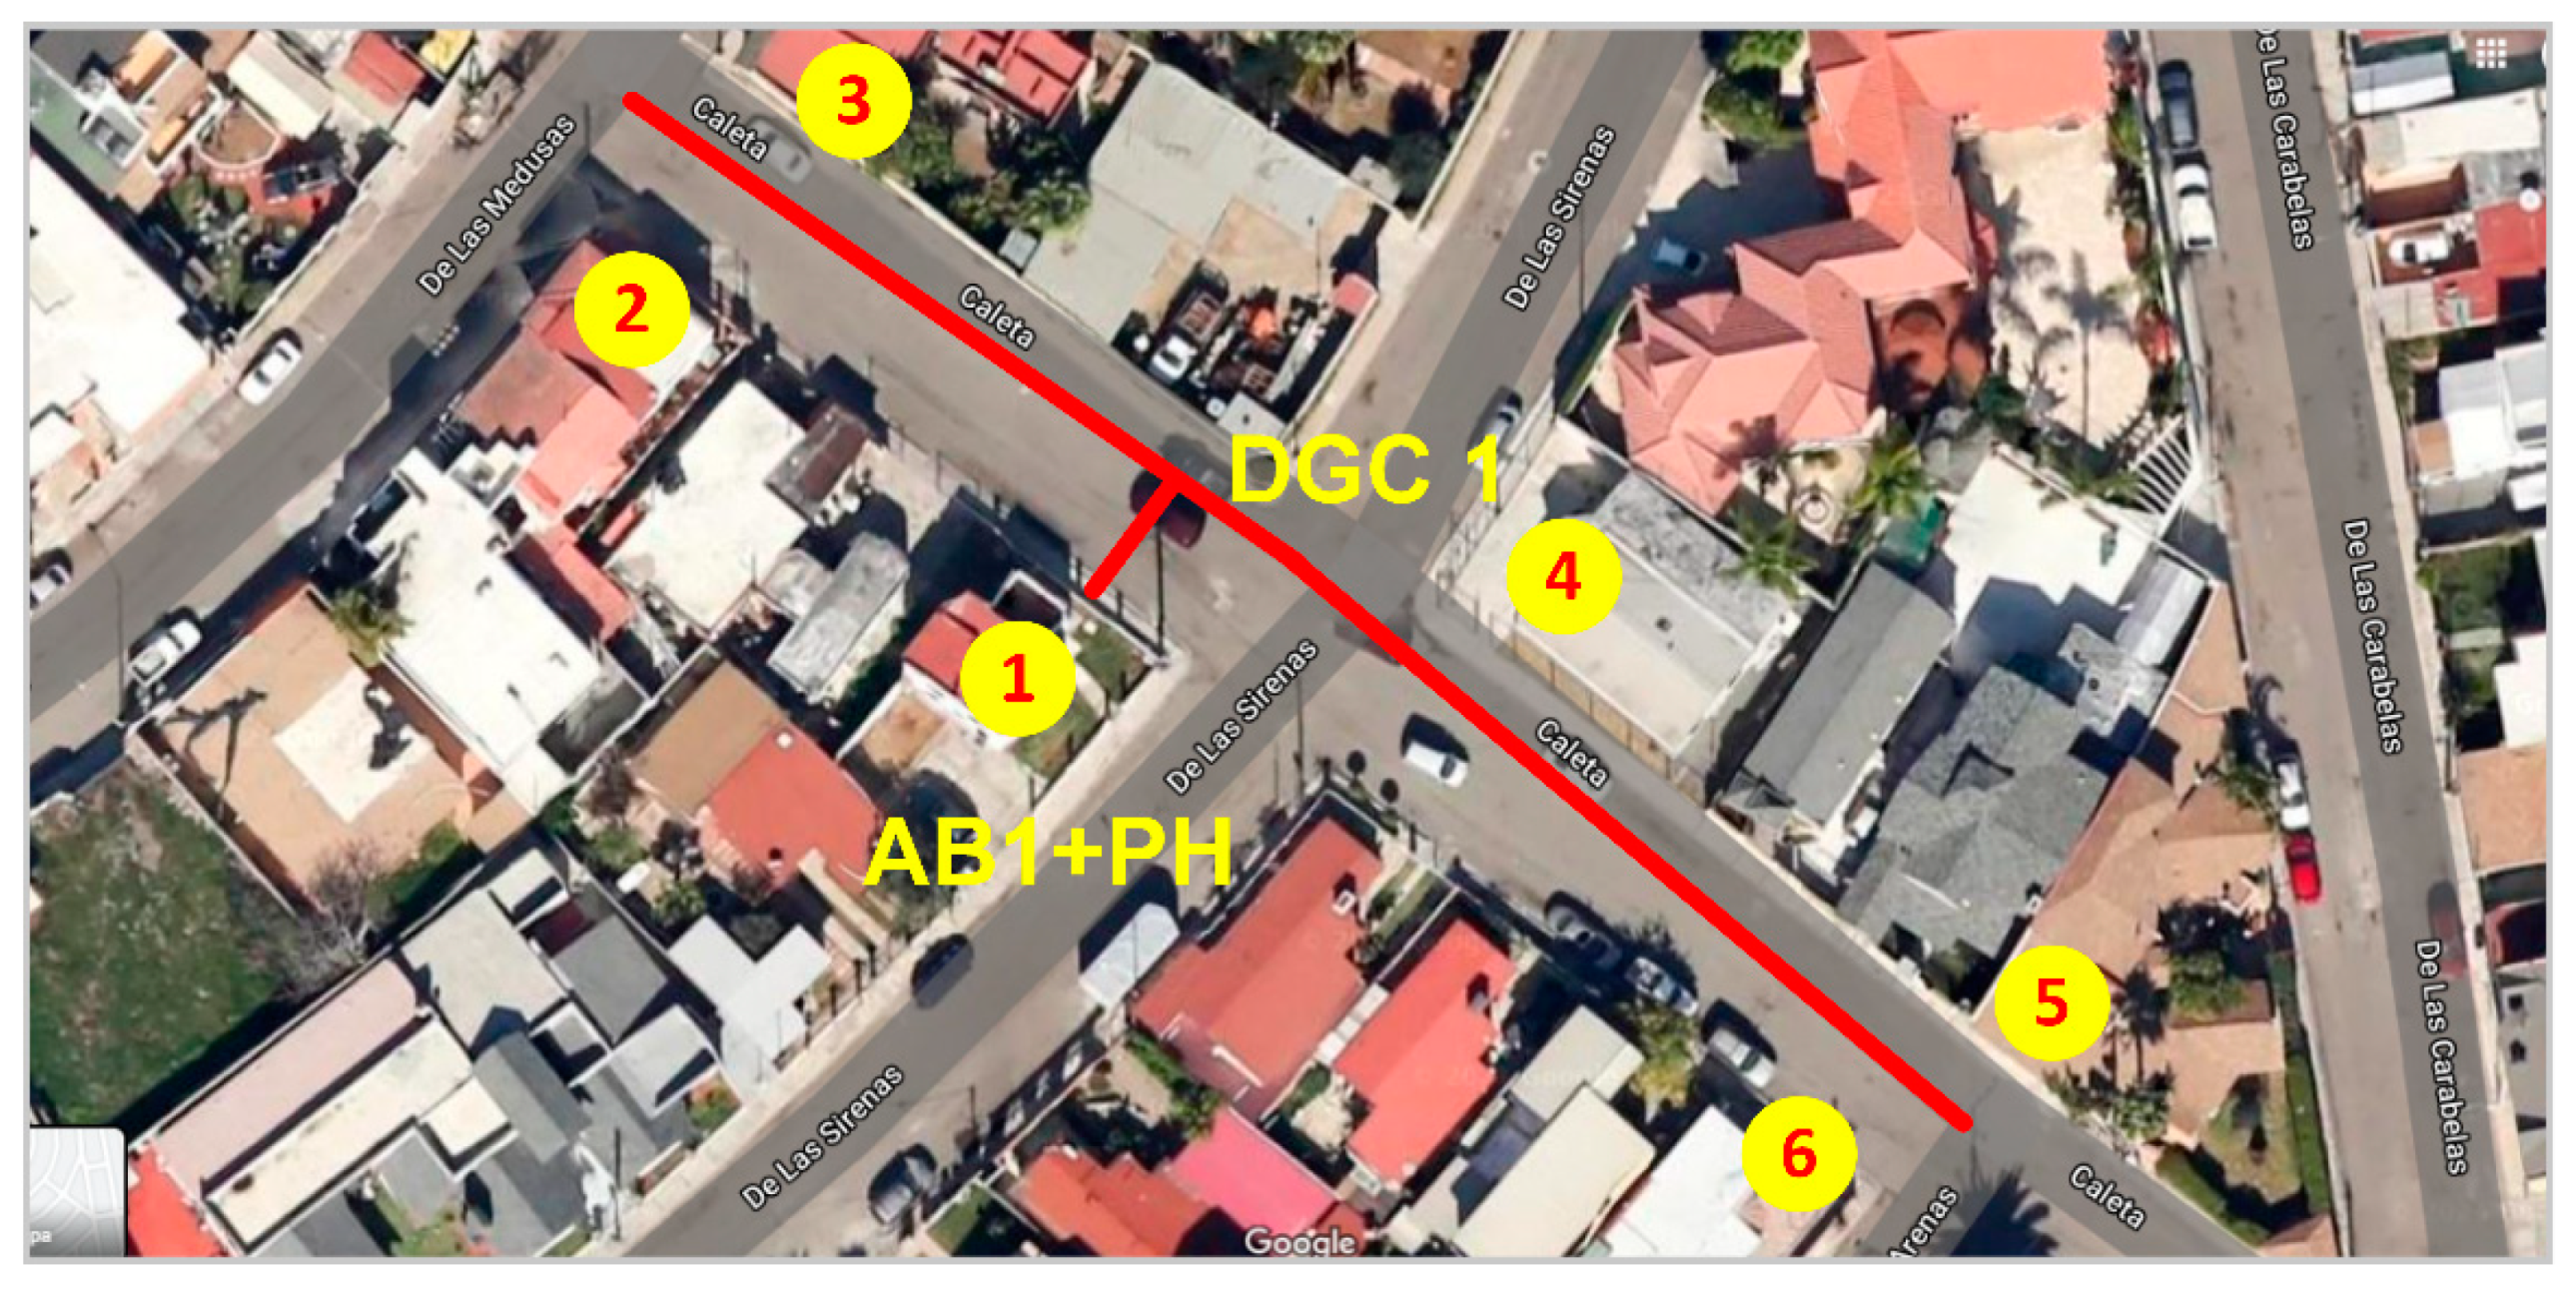
Table 2. In our case, 18 buildings (represented by yellow circles in
Figure 3 and
Figure 4) were analyzed based on their location as part of the proposal, i.e., they were buildings close to each other and were all connected to DGCs. However, an already-built building was selected to show the energy rehabilitation results according to the
Premium level of the Passivhaus standard considering the particular weather conditions. This was because the
Premium level is the one that requires a lower RPE demand and a higher REG; therefore, the value of EPB would increase.
Table 3 shows each criterion that was considered for the energy rehabilitation of the chosen building (AB1 + PH/DGC 1; similar results were obtained for the other ABs + PH). Since the detailed explanation of the Passivhaus methodology is not the scope of this manuscript, only some important findings and highlights are mentioned. For example, the heating demand parameter was ≈18 kWh/m
2y and, after the energy rehabilitation, it was ≈14 kWh/m
2y. The airtightness was the worst evaluated parameter, with a value of ≈1.6 r/h (air changes required per hour) and, after the energetic rehabilitation, ≈0.58 r/h was obtained (although the Passivhaus standard allows up to one air change required per hour for rehabilitated buildings). Additionally, the EPB parameter was poorly evaluated, with ≈−25 kWh/m
2y, because the building did not have power generation with renewable sources, but it did have an energy demand. However, after energy rehabilitation, the parameter was ≈+96.3 kWh/m
2y, since the REG parameter, ≈121.3 kWh/m
2y, was already considered, utilizing a hybrid energy renewable system, i.e., using a photovoltaic and wind system previously analyzed considering the viability of the infrastructure required to harness in an urban setting.
It is significant to mention that to obtain the results shown in
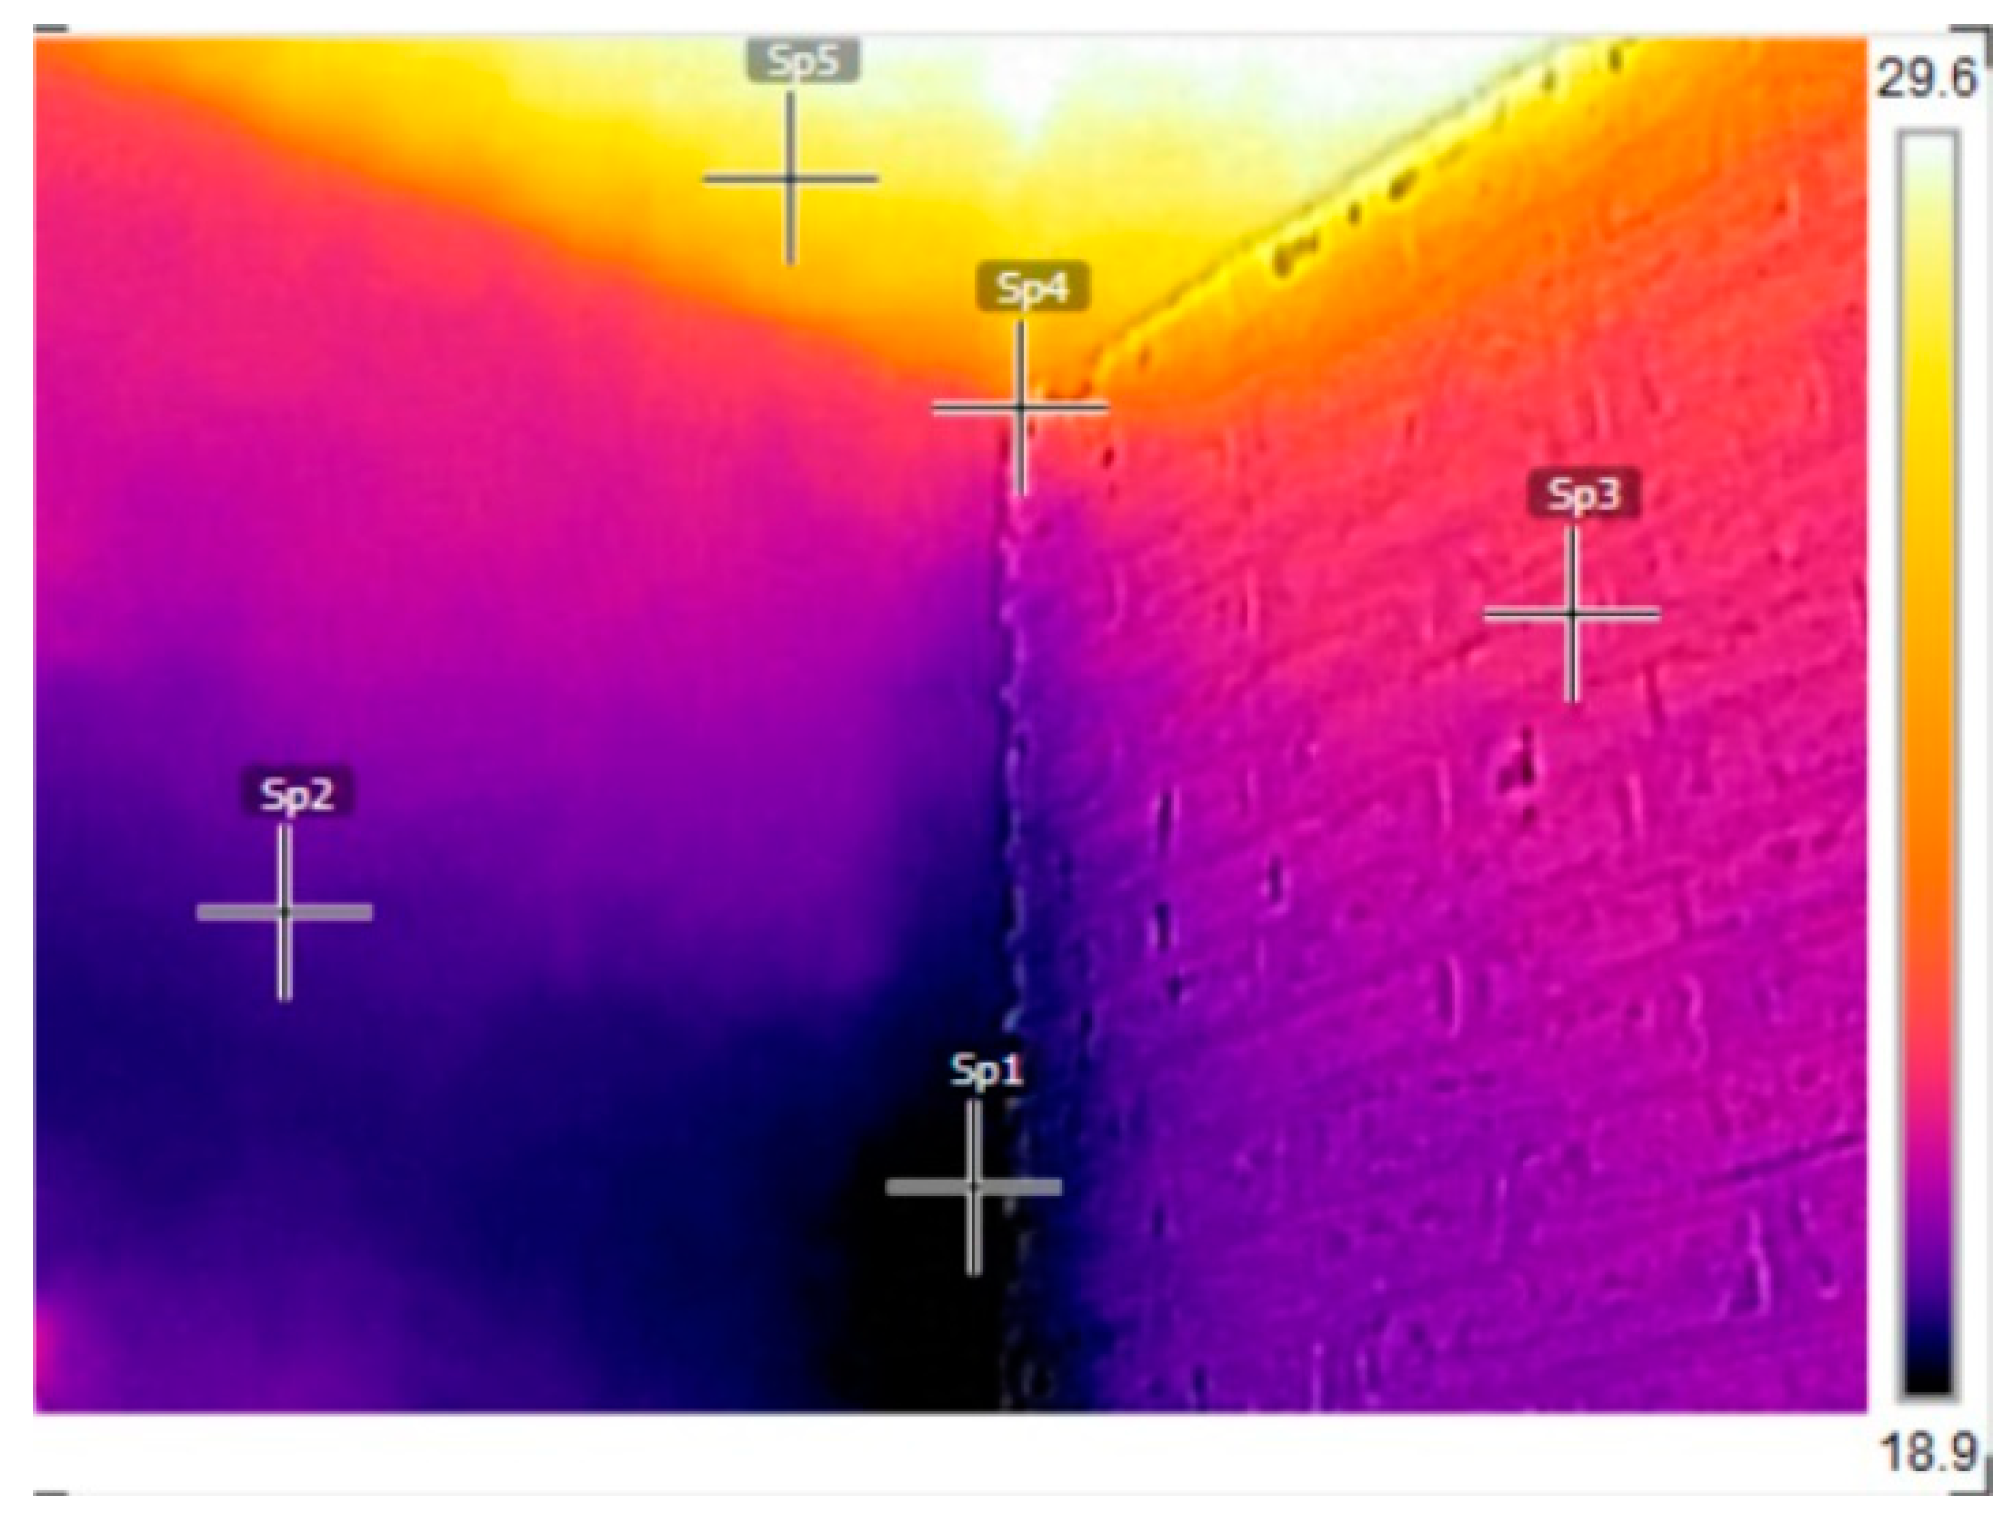
Table 3, many energy rehabilitation actions and tests were carried out, such as the Blower Test Door, analysis of thermal bridges in the building envelope, and operable elements (e.g., windows and doors), among others. For example,
Figure 2 shows that the roof of the building (AB1+PH/DGC 1) had a maximum temperature of 29.5 °C, while the walls had a minimum temperature of 18.9 °C, during the peak summer day. This implies the existence of thermal bridges and increases in the thermal load due to the roof.
4. Positive Energy Building Analysis
Until now, the energy rehabilitation of several buildings was considered with the objective that they meet all the Passivhaus standard criteria at the
Premium level, and, in this way, satisfy some Active Building criteria. Next, the energy contribution of these buildings in conjunction with the distributed generation network was analyzed.
Figure 3 shows the geographical representation of the three Distributed Generation Circuits (DGC) that were analyzed, as well as the Active Buildings that complied with the Passivhaus standard corresponding to each circuit. To clarify the idea of this manuscript,
Figure 4 shows the DGC 1 and the Active Building (AB1) that were used for the results shown in
Section 3.
Table 4 shows technical details regarding the distributed generation circuits. In particular, all circuits had the same voltage level, 13.8 kV, because they were on the Low Voltage (LV) network. Furthermore, the net generation limit and recommended integration capacity were 4000 kW and 2235 kW, respectively. The foregoing implied that, for each distributed generation circuit, it was possible to connect various Active Buildings that met the Passivhaus criteria at the
Premium level to generate up to 4000 kW. Considering that there were three distributed generation circuits (DGC1, DGC2, and DGC3), the net generation limit was 12 MW, although the overall recommended integration capacity was 6705 MW. On the other hand, the overall installed power capacity was 2.3 MW, distributed in each of the distributed generation circuits, i.e., 650 kW, 900 kW, and 750 kW for DGC1, DGC2, and DGC3, respectively.
Table 5 shows the results of all Active Buildings that met the Passivhaus criteria for each distributed generation circuit. As can be seen, each DGC had integrated six Active Buildings, and the REG parameter required by the Passivhaus criterion was analyzed. For example, the AB1 + PH of DGC 1 had an installed power capacity of 100 kW in a land area of 200 m
2. Considering 4.5 peak sun hours, the REG real value was ≈821.25 kWh/m
2y, which met the criteria of the Passivhaus standard (i.e., ≥120 kWh/m
2y). In this way, all the Active Buildings of the DGCs met the criteria for generating renewable energy.
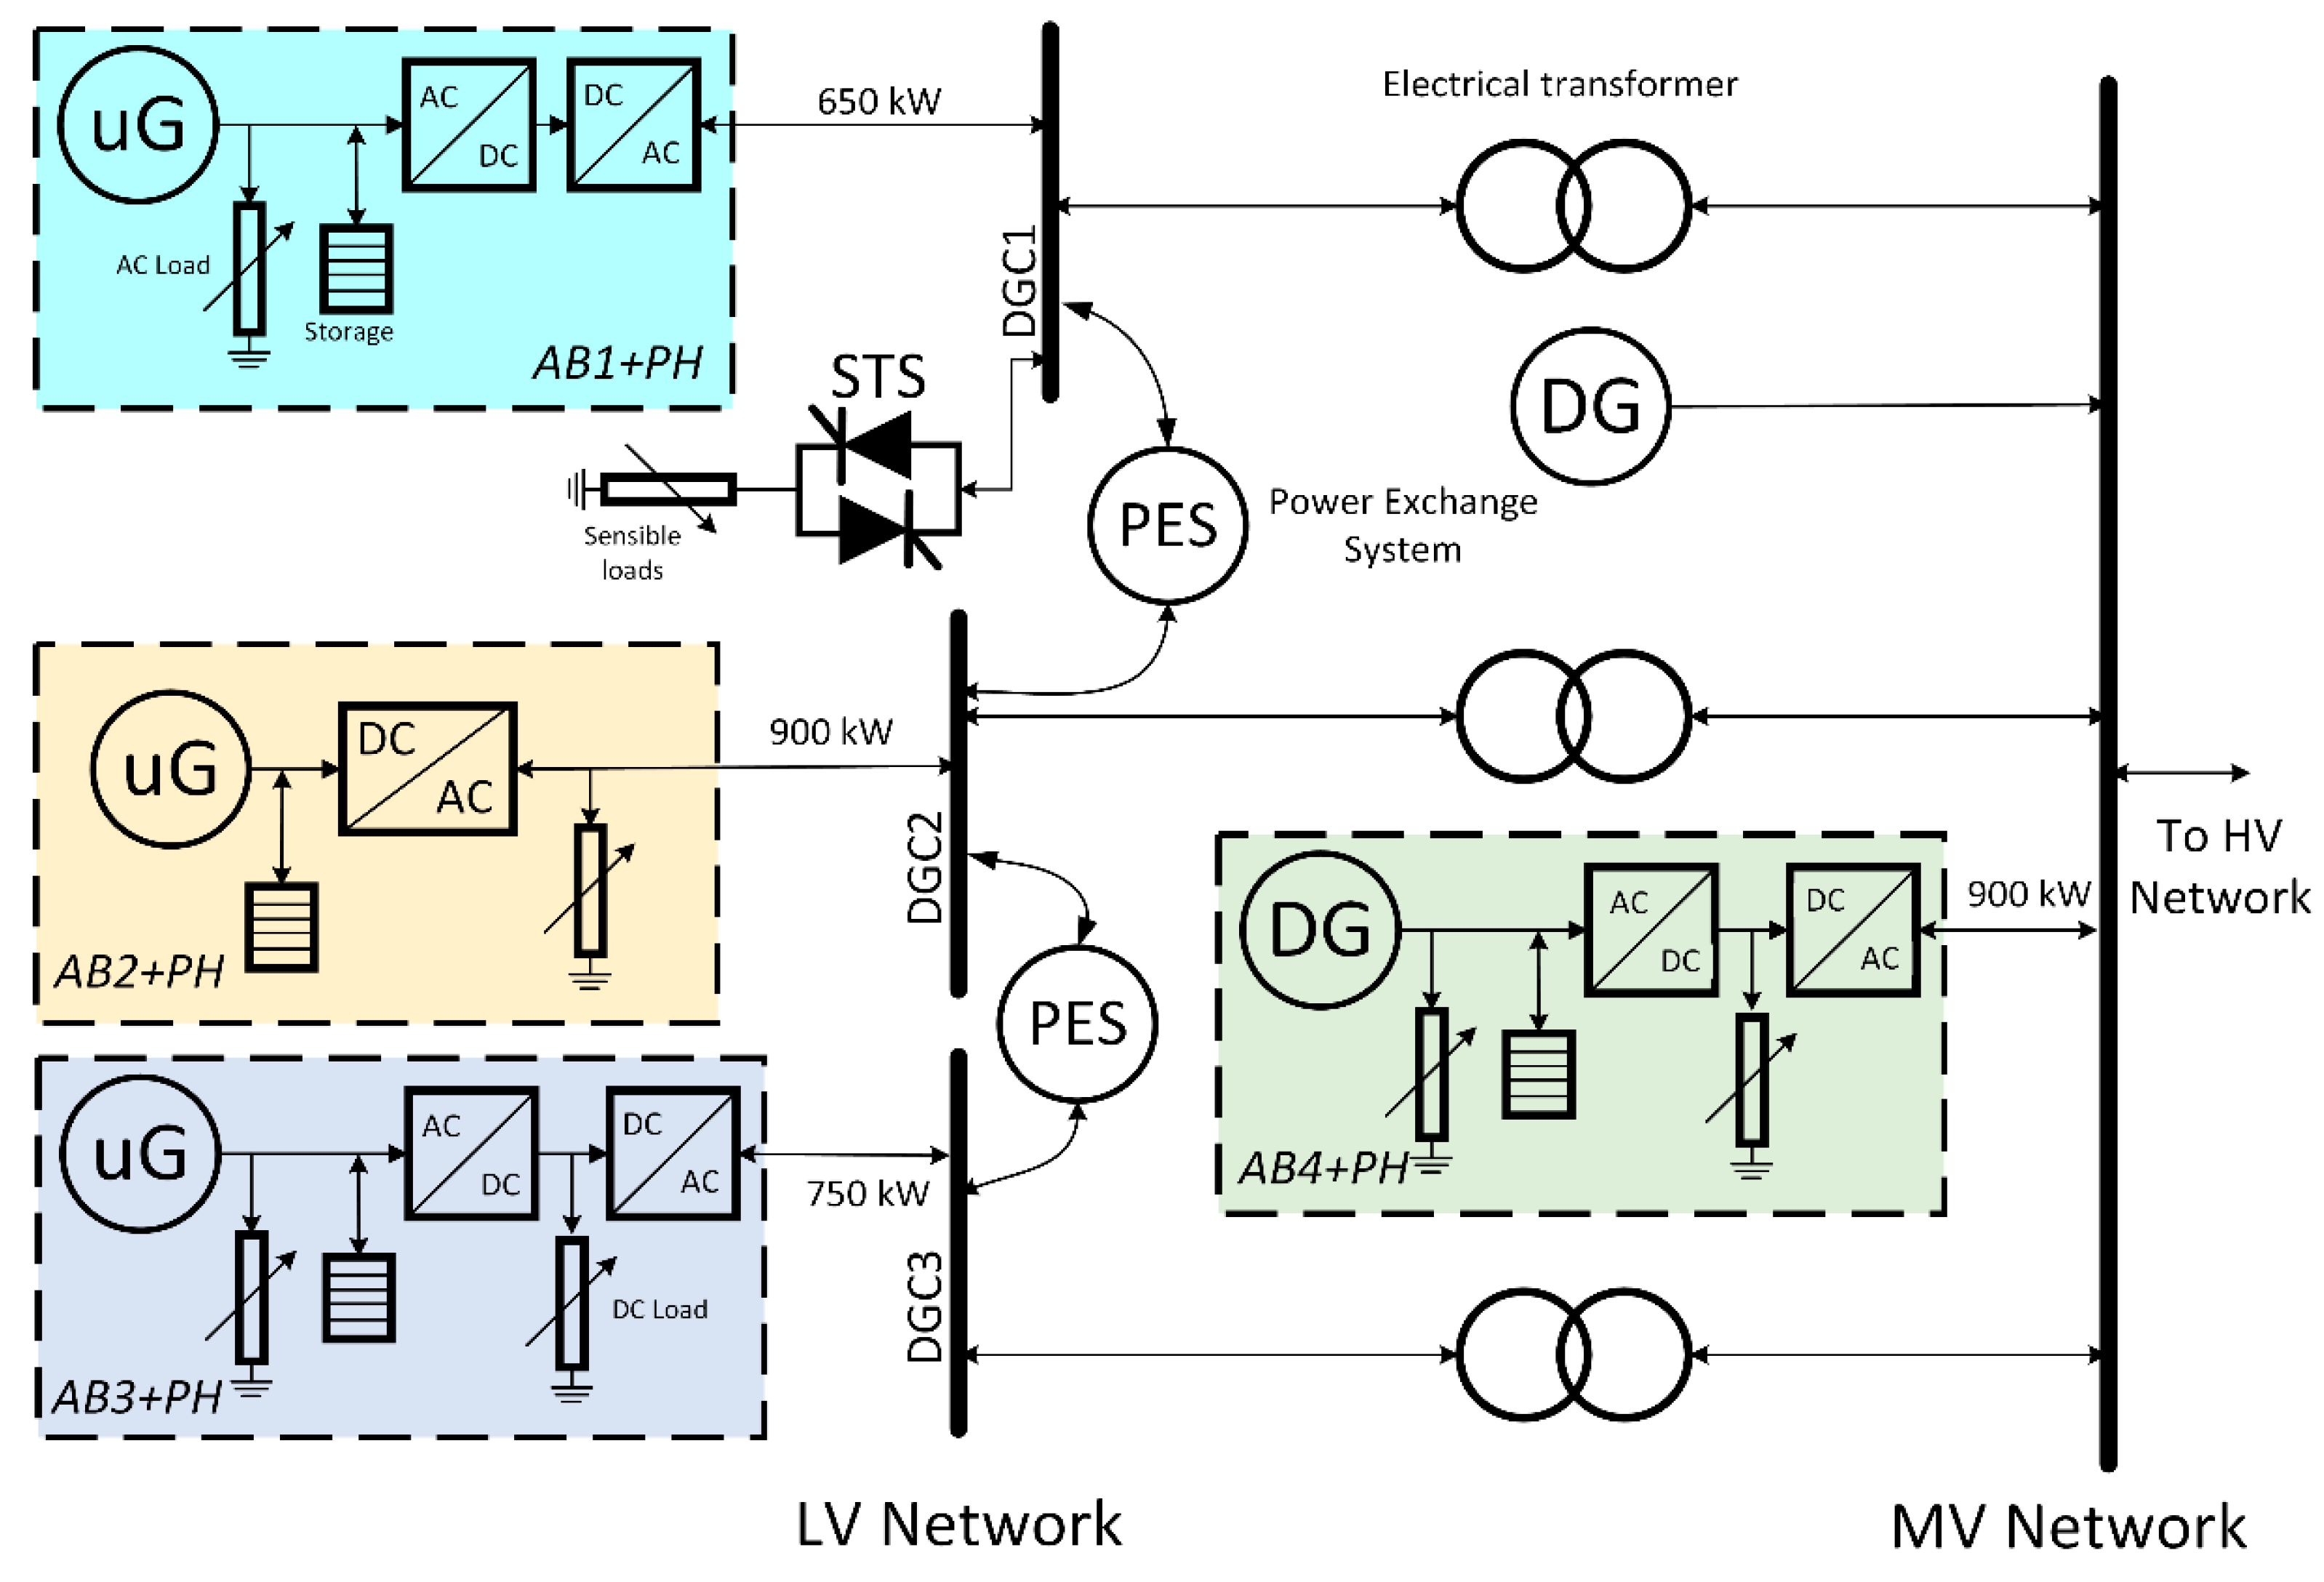
5. Power Network Analysis
Figure 5 shows the proposed electrical network considering the distributed generation circuits already installed, as well as the addition of Active Buildings that met the criteria of the Passivhaus standard at the
Premium level. In general, the Figure shows the three distributed generation circuits (i.e., DGC1, DGC2, and DGC3) that exchanged power through a Power Exchange System (PES) according to the electrical load’s behavior and performance. For instance, the DGC1 shows Active Buildings that met the Passivhaus criteria (ABs + PH), which had an AC distributed micro-generation (uG) system to feed electrical AC loads, as well as an Energy Storage System (ESS). It is important to clarify that each DGC had six Active Buildings that met the Passivhaus criteria, but
Figure 5 only shows the schematic of one Active Building per distributed generation circuit. Additionally, the electrical connection of each AB was different. For example, the ABs + PH of the DGC 1 had a specific configuration, which was already mentioned, while the ABs + PH of the DGC 2 had a micro-generation system in DC. In addition, the ABs + PH of DGC 3 were similar to the ABs + PH of DGC 1, but they had DC loads.
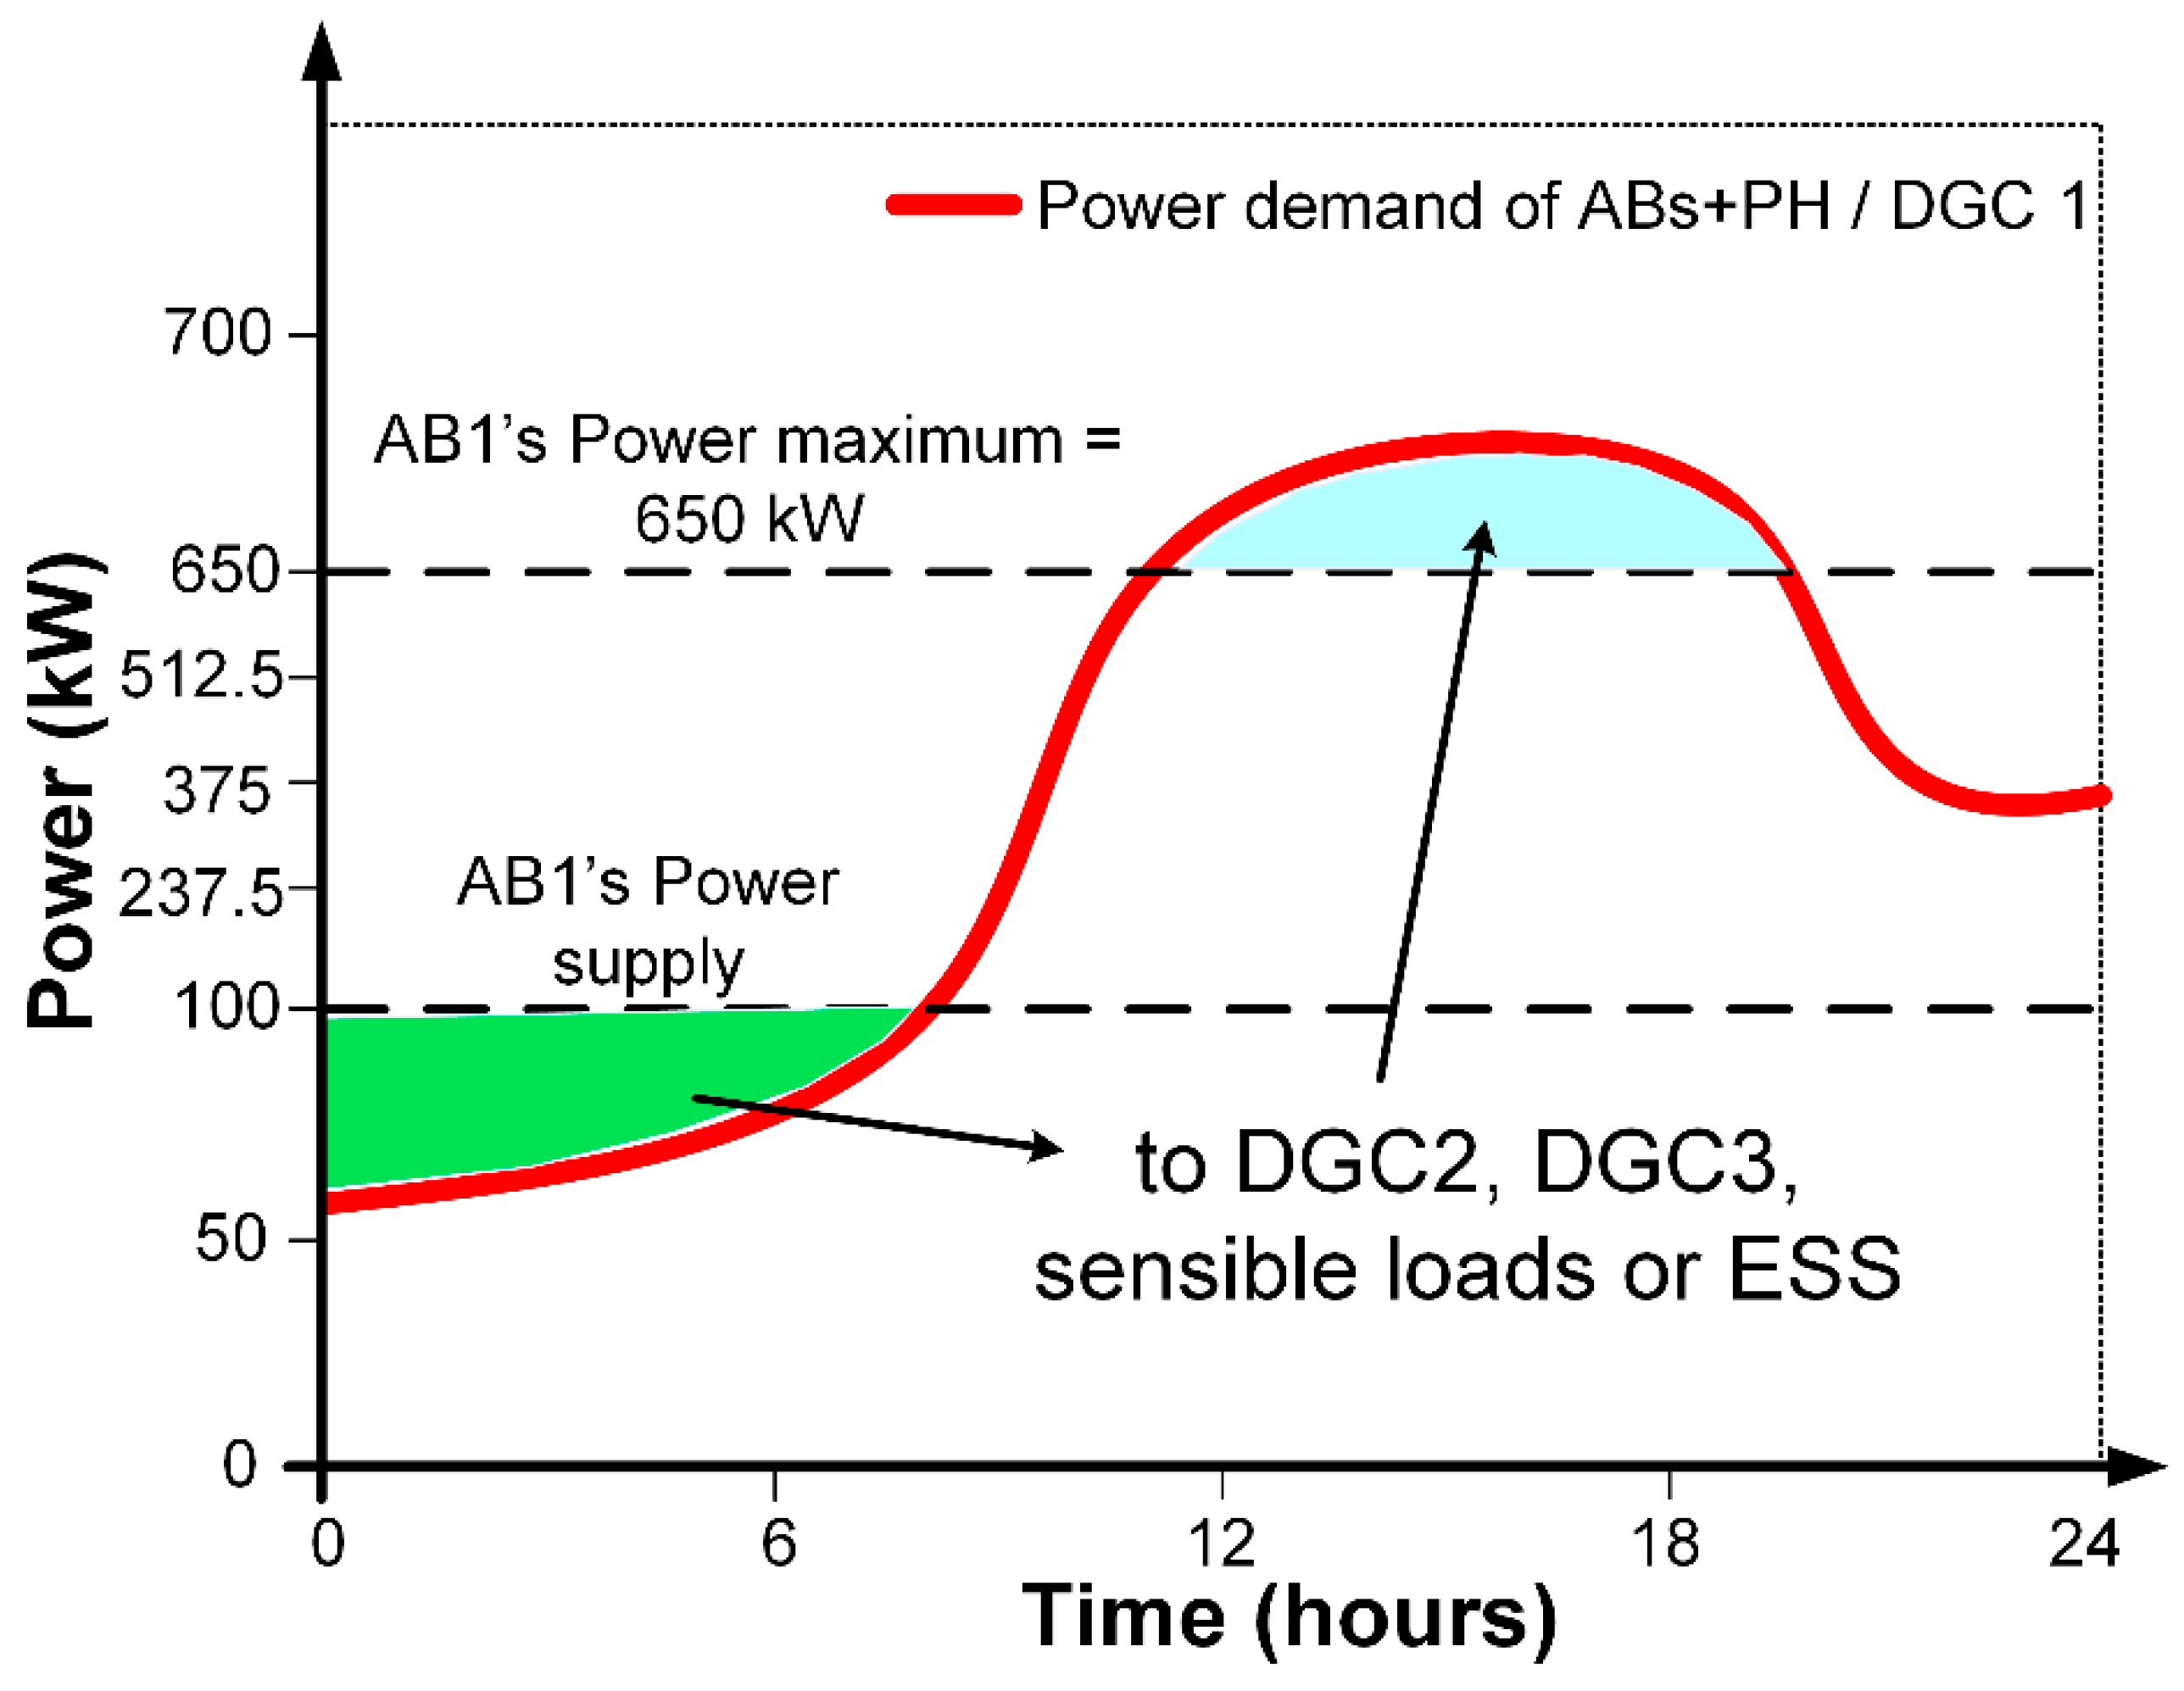
As
Table 4 showed, the DGC1 had an installed power of 650 kW, which was generated by the ABs + PH. Once ABs + PH met their energy needs, the remaining energy was supplied to the DGC1 for use by other domestic users (conventional buildings and loads) or sensitive public and private loads (e.g., automated systems and processes, digital systems, variable frequency motor drives, programmable logic controllers, computer numerical control equipment, public and private consumer electronics, among others) which used a Static Transfer Switch (STS). The other distributed generation circuits (DGC2 and DGC3) had similar structures regarding Active Buildings (ABs + PH). Although there were slight differences in terms of the electrical loads used and distributed microgeneration technology, i.e., some technologies generate electricity in AC or DC, all distributed generation circuits were part of the Low-Voltage (LV) electrical network. As mentioned, the DGCs were located on the LV Network, but they were also connected to the Medium Voltage (MV) Network through power electrical transformers. In turn, the MV Network had higher power distributed generation (DG) systems as well as other ABs + PH schemes that provide power to the MV Network. However, the analysis of Active Buildings connected to the MV network was not part of the proposal of this manuscript.
Considering that the distributed generation circuits and their main components have been described, it is relevant to describe the PES between distributed generation circuits as a fundamental part of the ABs scheme as a service provider in the electricity network.
Figure 6 shows a general analysis of the energy exchange process. For example, if the energy generated by the ABs + PH is greater than the energy demand of the loads in the DGC1, then the process implies that the remaining energy must: (1) be stored, (2) exchange the energy with the other distributed generation circuits, or, finally (3) export from the LV network, that is, transmit it to the Medium Voltage (MV) network. The other case is when the power demand of the ABs + PH or DGC1 is higher than the power generation of the ABs + PH. In this scenario, the energy exchange process implies an energy import, either from the other distributed generation circuits or from the MV Network.
Figure 7 shows the power demands performance emulation of DGC1 and DGC2 during 24 h of an arbitrary day (electricity demand was constantly changing and depended on several factors). As shown, when there was an energy excess (i.e., an export energy possibility), the PES managed the transfer of the excess energy to another distributed generation circuit (i.e., a circuit that needed an energy import). For example, DGC2 transmitted ≈250 kW to DGC1 for a specified period (≈5 h). Afterward, the power generation and demand conditions changed in each DGC, so that DGC1 now transferred ≈125 kW to DGC2 for ≈10 h. In general, such an analysis could also be performed for DGC2 and DGC3.
Next, the energy exchange process of the three distributed generation circuits was analyzed in a 24 h period on another arbitrary day. The reason for the analysis carried out on different days was to obtain the most varied energy performances possible to improve the complete performance of the electrical network and the Active Buildings that met the Passivhaus criteria.
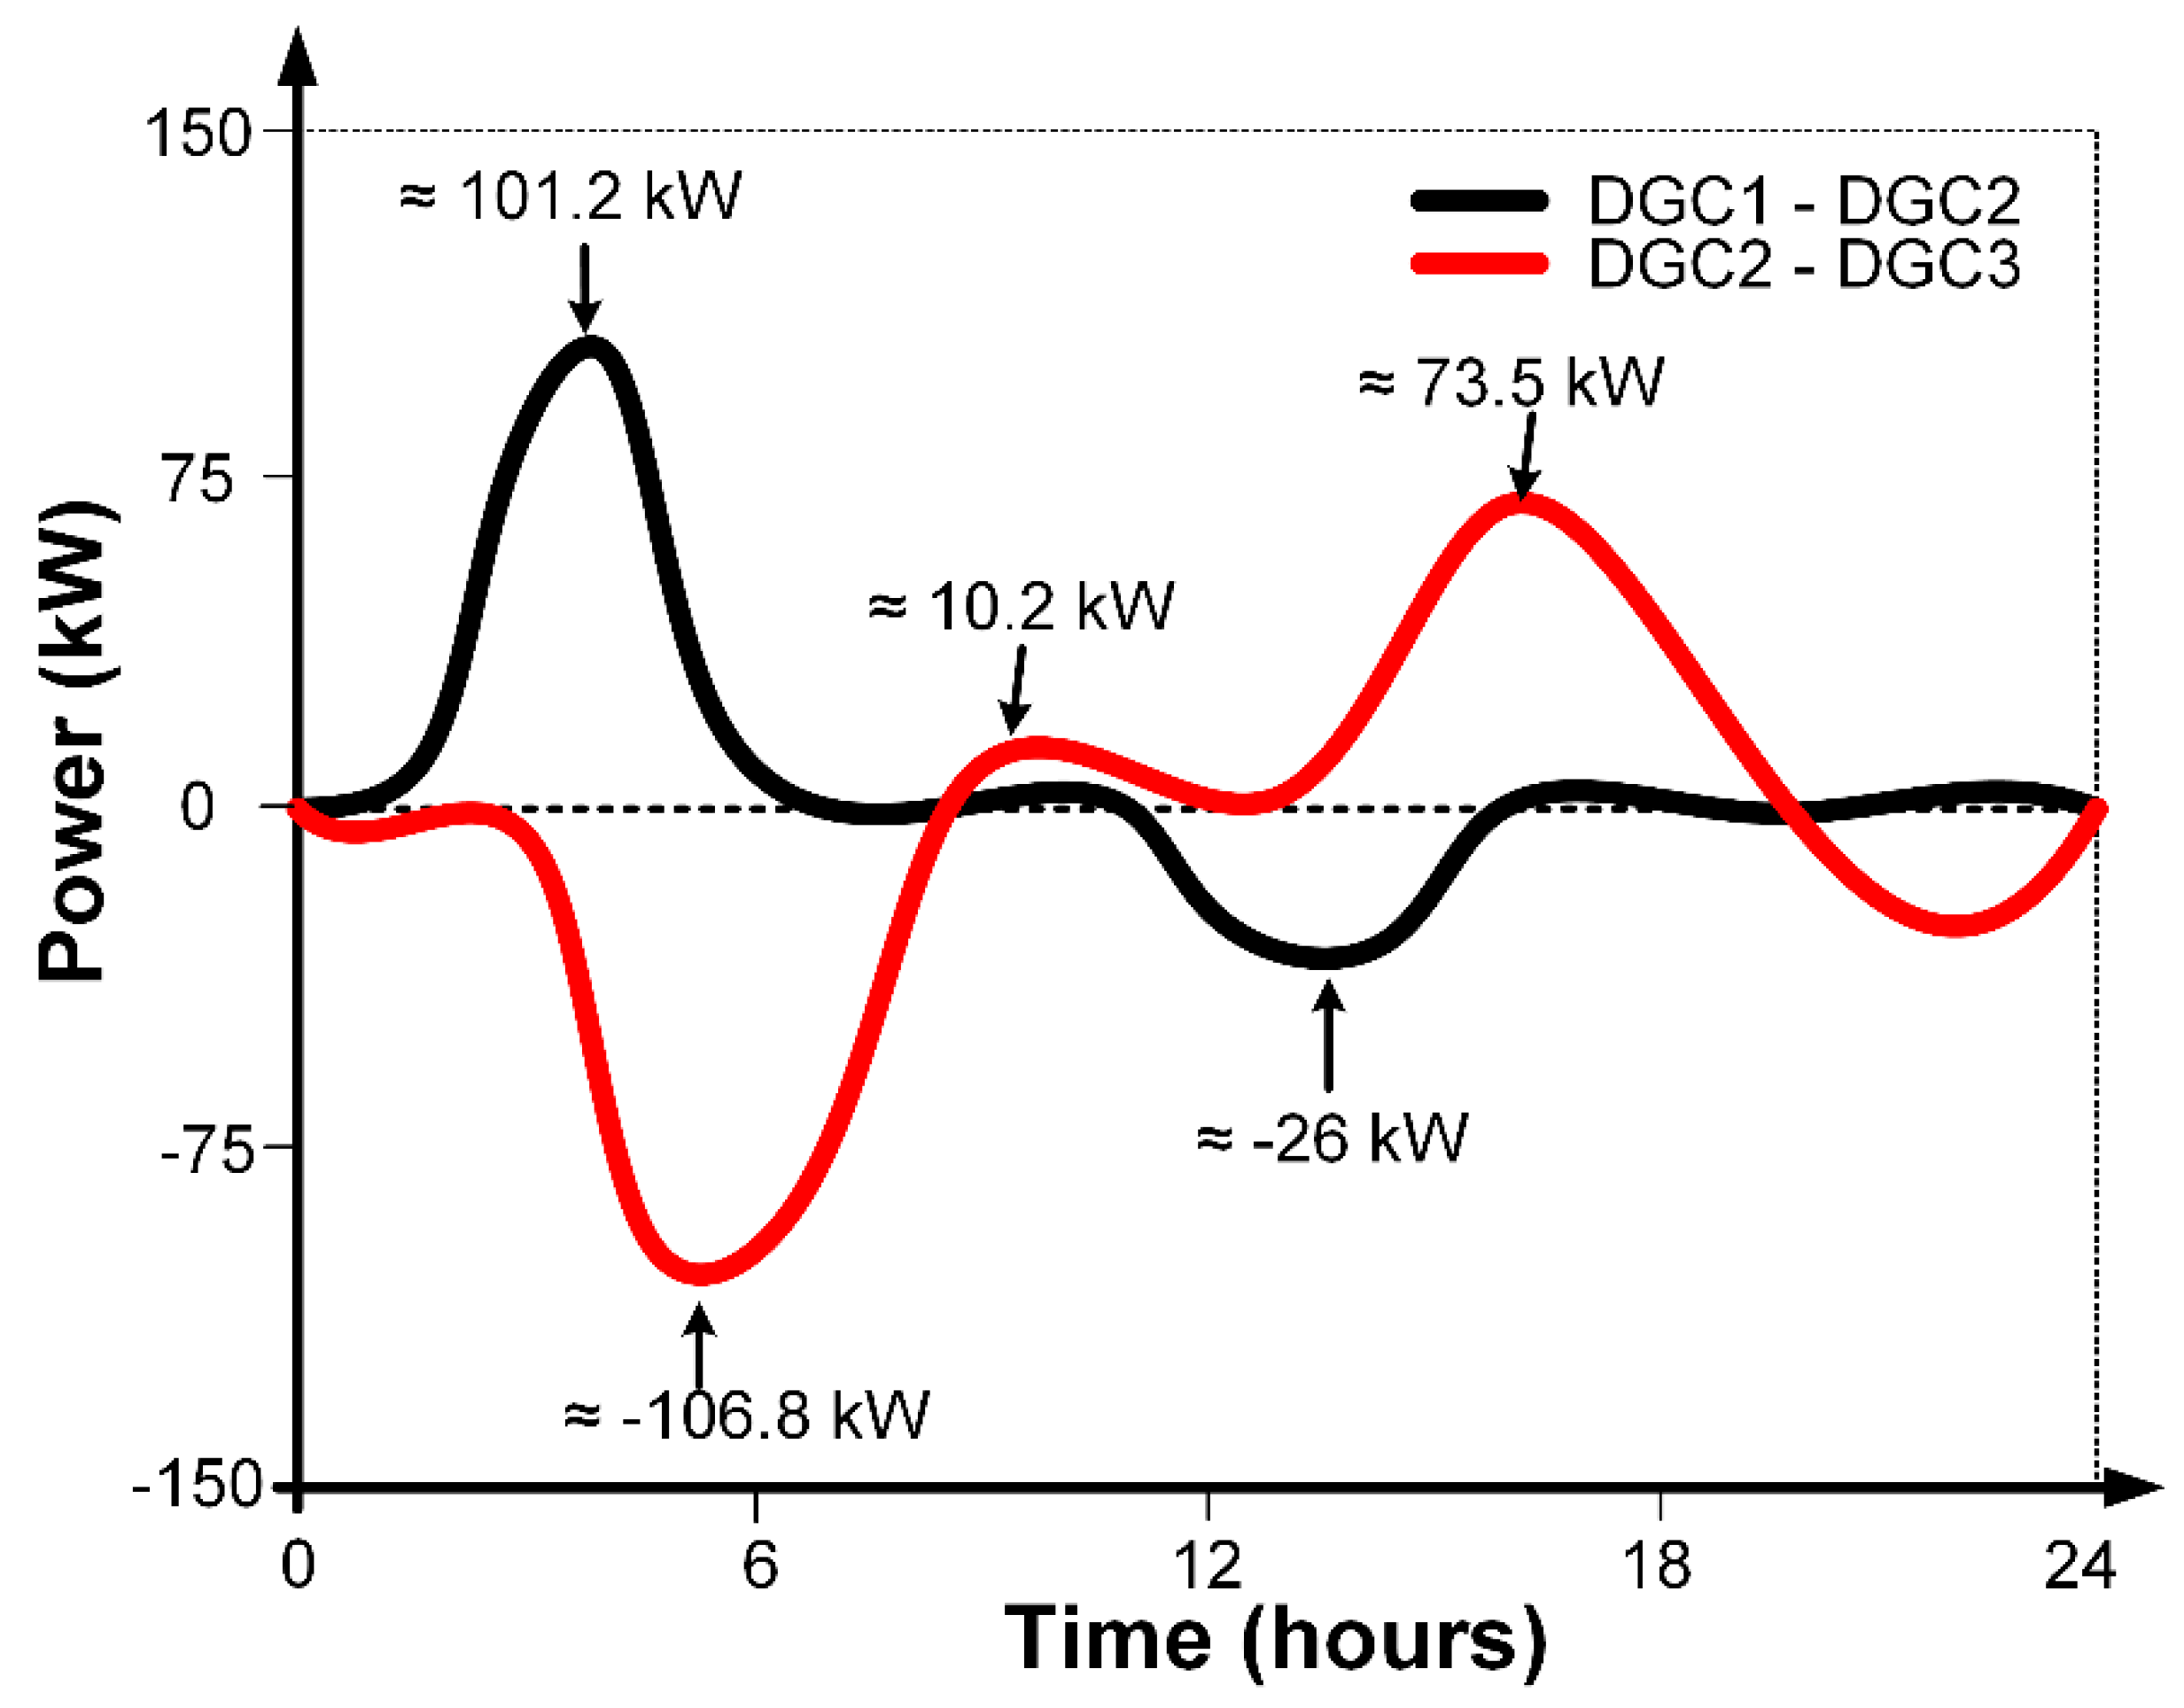
Figure 8 shows the power transferred between the three distributed generation circuits. In this matter, it was appreciated that the DGC1 transferred up to ≈101.2 kW to the DGC2 (at approximately 04:10 h), while the DGC2 transferred up to ≈26 kW (at approximately 13:20 h) to the DGC1. To clarify, the negative sign in the amount of energy transferred between DGCs means that the transfer order was the reverse of that shown on the labels in
Figure 8. For example, for the black solid line, a negative sign means an energy transfer from DGC2 to DGC 1. In the case of the energy exchange relationship between DGC2 and DGC3, it can be seen that DGC2 transferred up to ≈73.5 kW to DGC3, while DGC3 transferred up to ≈106.8 kW, at approximately ≈17:30 h and ≈05:30 h, respectively. Additionally,
Figure 8 shows that in the period from ≈08:00 to ≈12:00 h, the energy exchange between DGCs was minimal (less than ≈9.7 kW). Sometimes, there was no energy exchange (e.g., at approximately 8:15 h for DGC1–DGC2). Likewise, the transfer of energy from DGC1 to DGC2 was minimal from ≈15:30 h. An important aspect to mention was that the energy contribution of the public utility electricity grid was not analyzed, that is, the import–export relation concerning the public utility grid. Nonetheless, the results of energy exchange within the proposed network were adequate. Afterward, the energy exchange towards the MV Network of all the ABs + PH that composes the Distributed Generation Circuits was analyzed. In our case, the MV Network had a capacity of 30 MW, with a low voltage of 13.8 kV, and a high voltage of 115 kV, the latter for the interconnection of the High Voltage (HV) Network.
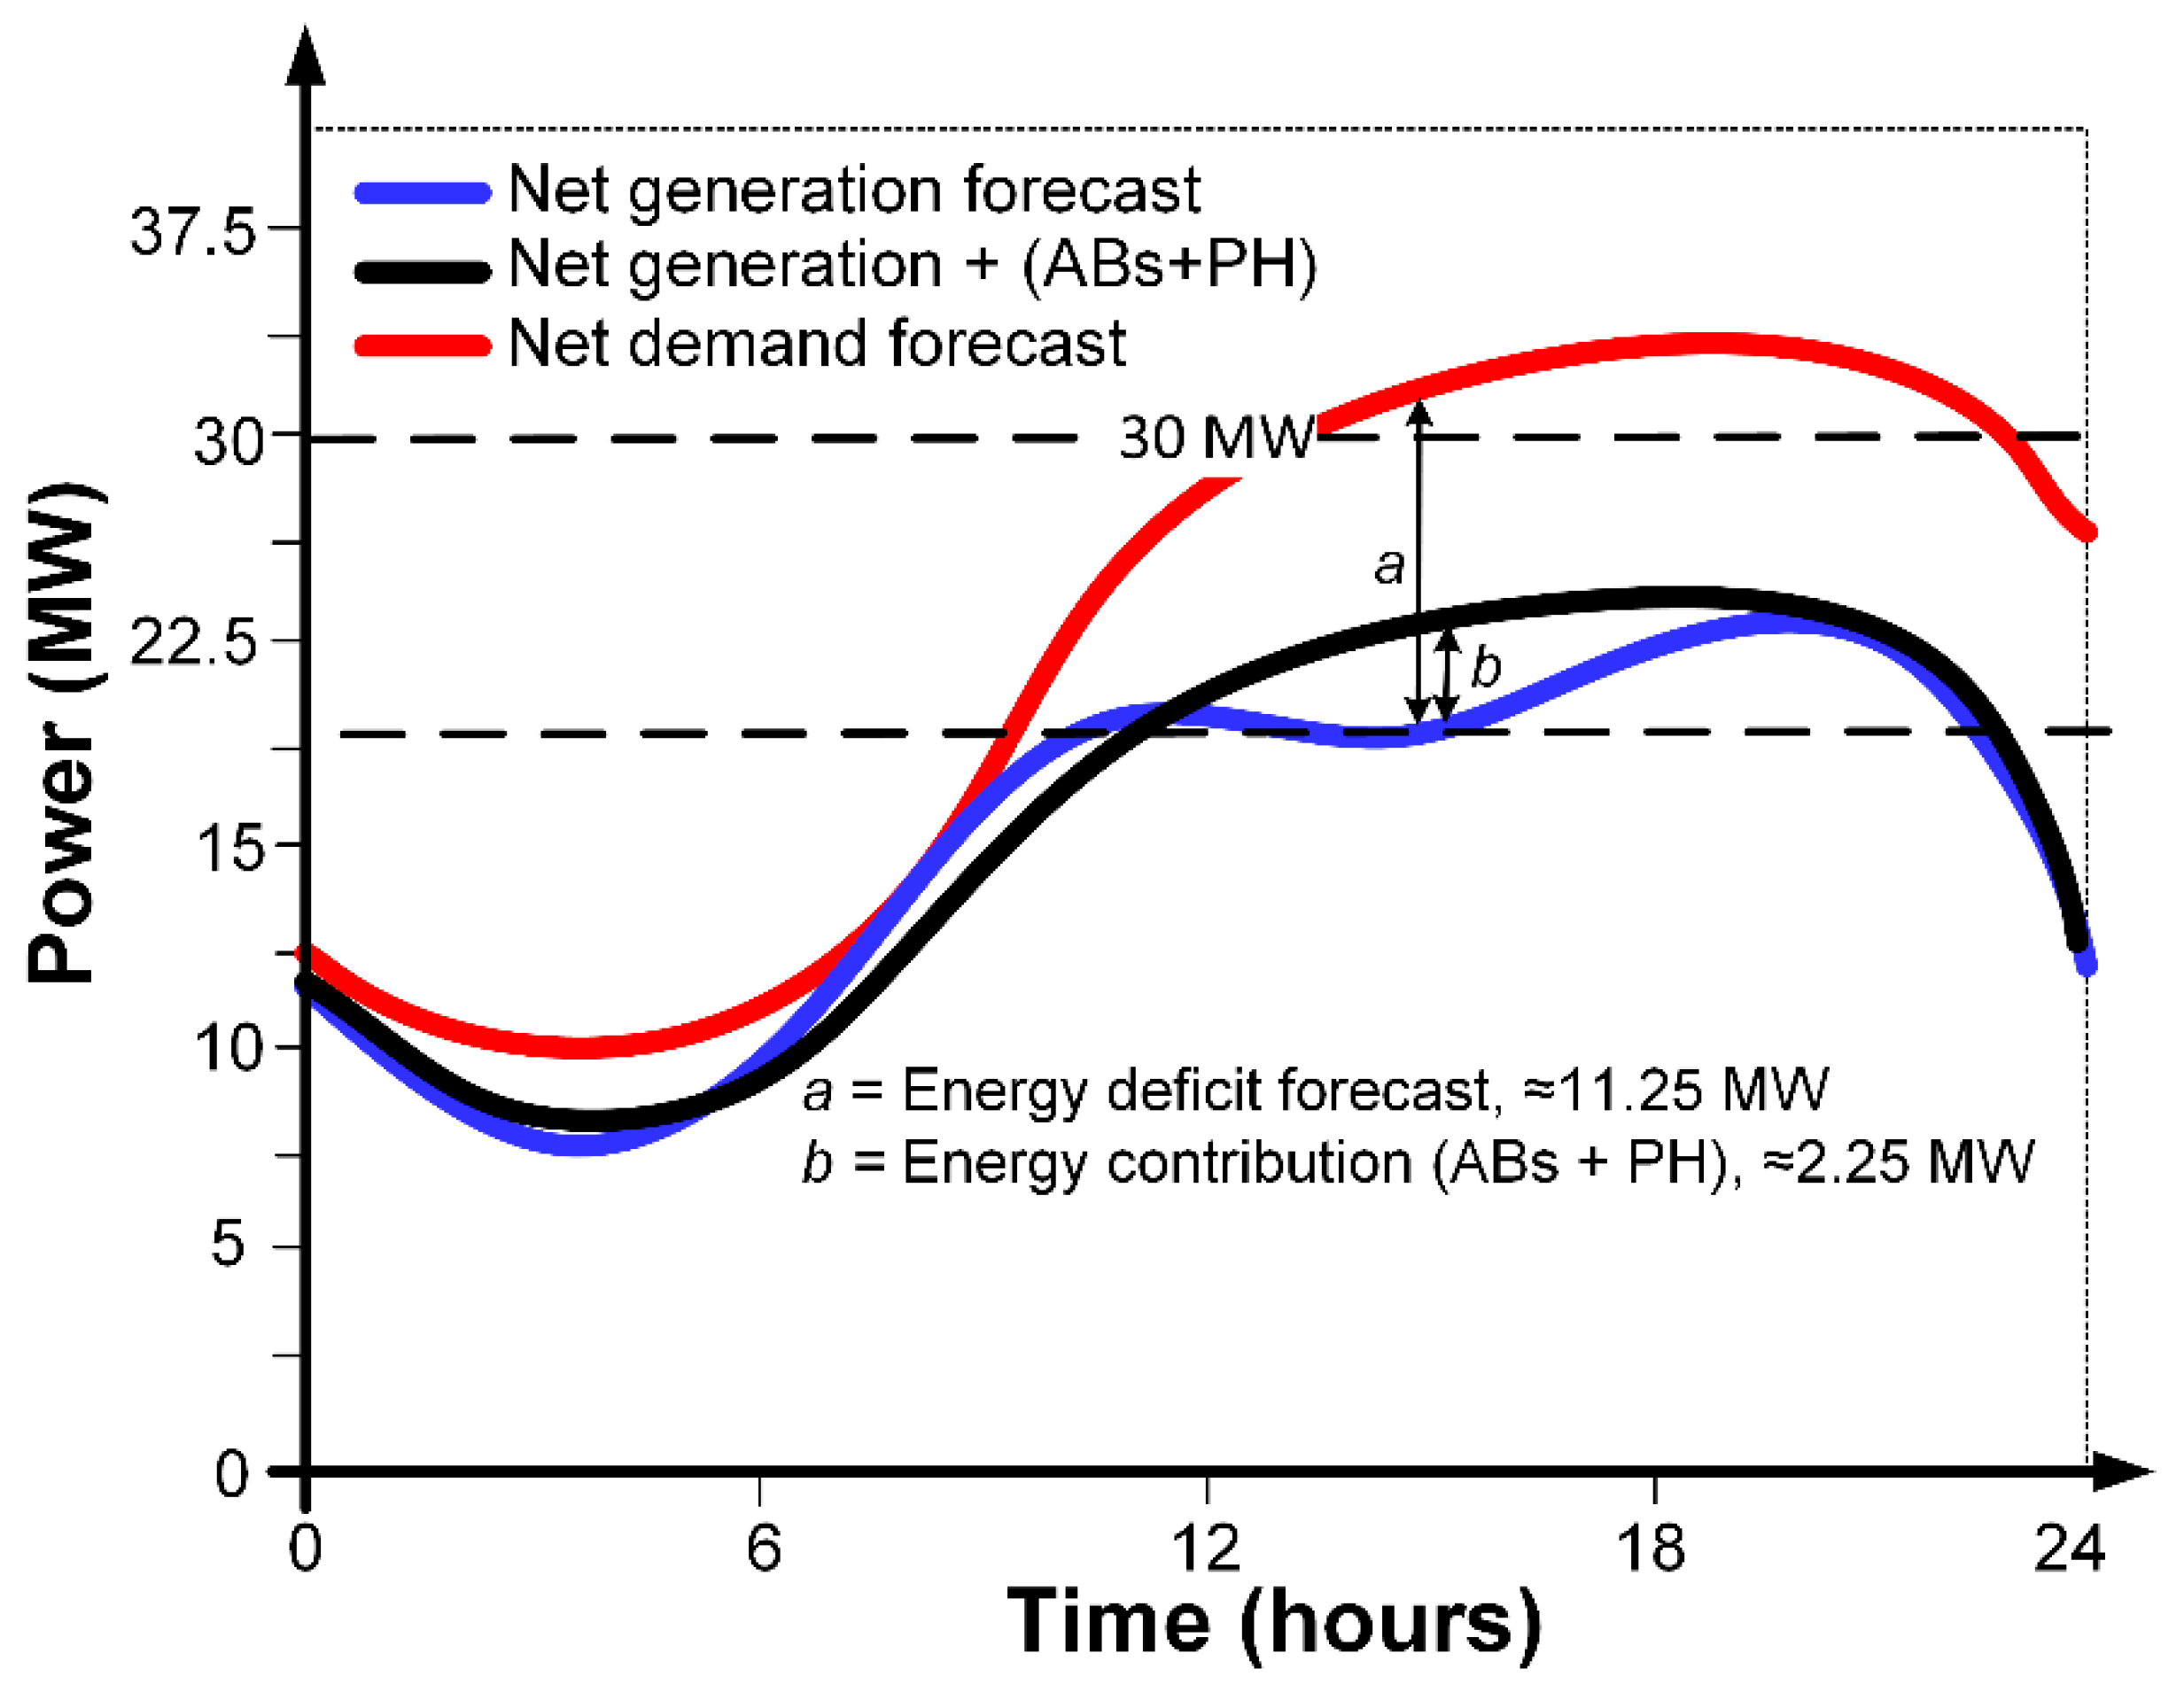
Figure 9 shows the net demand forecast (red solid line) of the electrical loads connected to the network. In particular, the power supply problem occurred in the period from ≈13:00 h to ≈23:15 h. The net demand forecast was ≈34.2 MW, but the power capacity of the electrical utility grid was 30 MW, i.e., there was an energy deficit of ≈4.2 MW.
On the other hand,
Figure 9 also shows the net generation forecast (blue solid line), which represented a maximum energy deficit forecast (
a) of ≈11.25 MW. Finally, the net generation with the ABs + PH considering all the DGCs is represented by the black solid line. It was shown that, from ≈00:00 h to ≈10:15 h, the values between the net demand forecast and net generation based on ABs + PH were very similar, i.e., from 75.2% to 95.5%. However, from ≈12:00 h, the net generation forecast decreased, but the energy contribution of the ABs + PH (
b) allowed for a reduction in the energy deficit in the regional grid, contributing to ≈2.25 MW.
6. Discussion
As mentioned above, the Active Building concept involves several particular aspects such as bioclimatic architecture, energy-efficient systems with performance monitoring, on-site renewable energy generation, energy storage, electric vehicle integration, and smartly managed integration with micro-grids and national energy networks. However, this proposal did not consider electric vehicle integration. The main reason was due to the reduced amount of electrical vehicles in the analyzed region. Even with this, there was a considerable number of electrical chargers (≈20 Destination Chargers and 1 Supercharges), but they were installed far from the analyzed electrical network.
In particular, this proposal only focused on the development of bioclimatic architecture based on the Passivhaus criteria and energy-efficient systems based on the optimization of energy consumption also based on the Passivhaus standard, but continuous monitoring was not considered. In addition, the proposal presented considered on-site renewable energy generation and smart management integration with micro-grids and national energy networks.
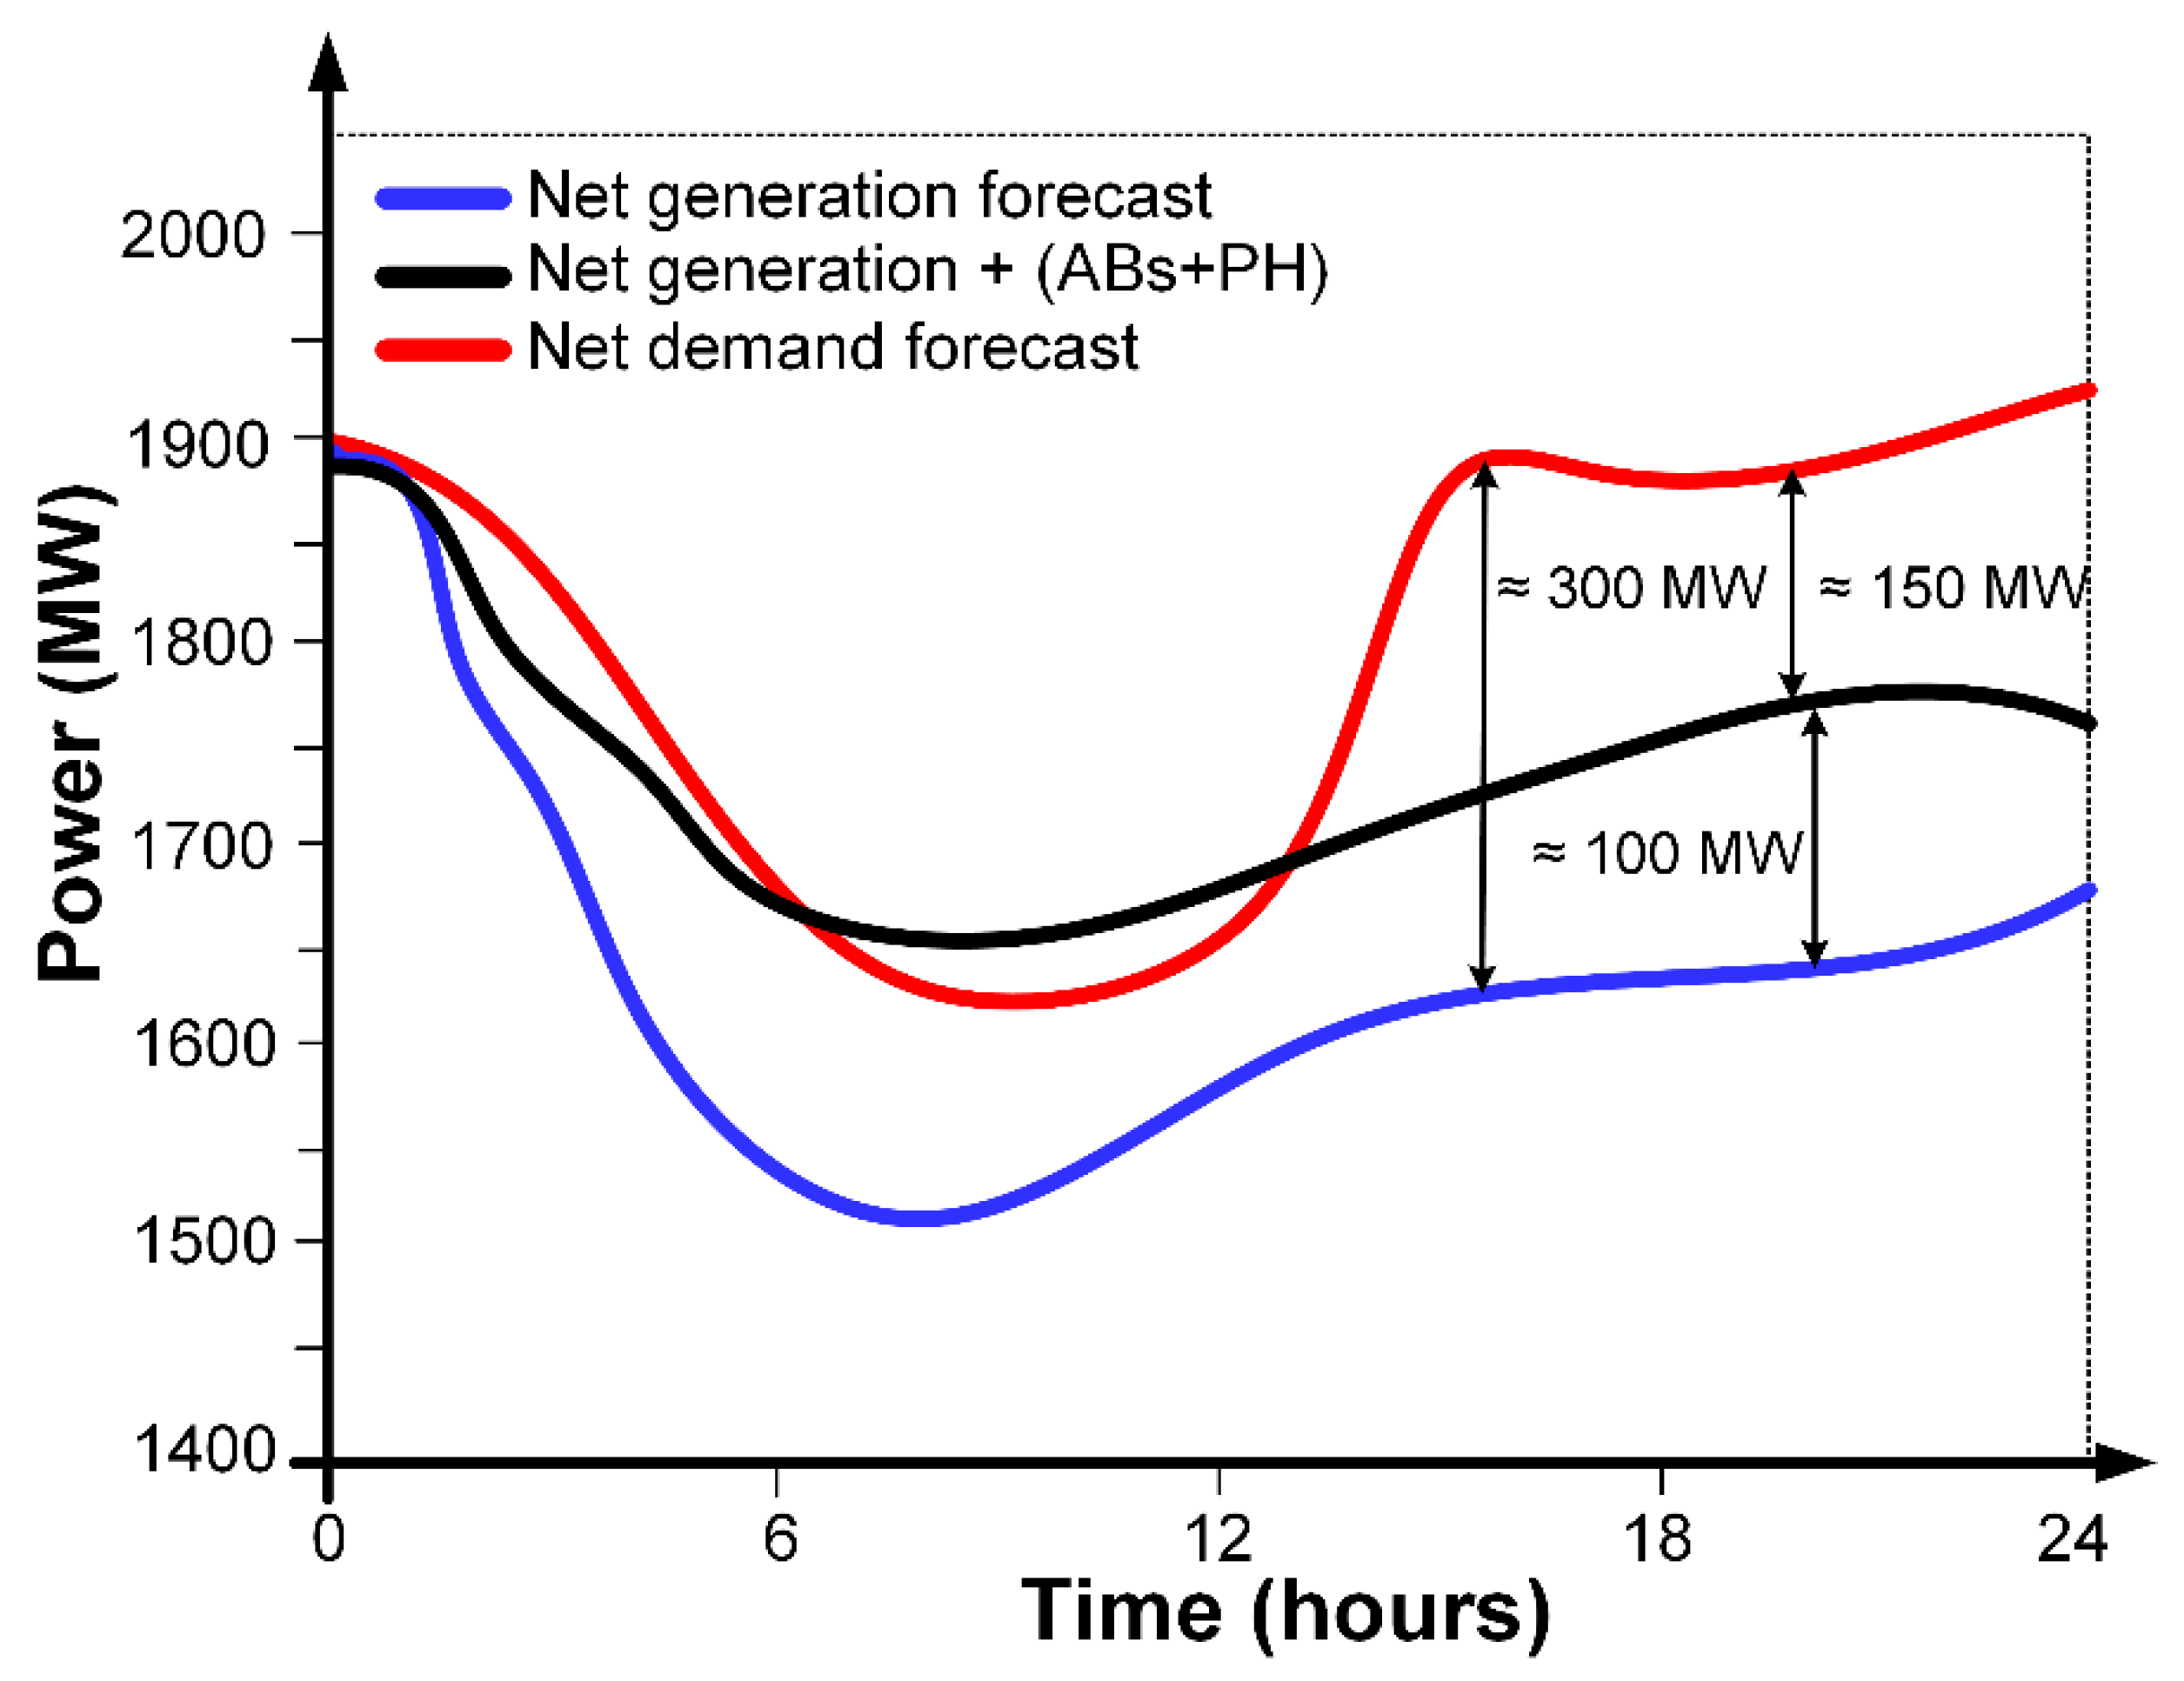
Considering the above,
Figure 10 shows the analysis of energy generation and demand of the North Baja California region. In this sense, the region’s net demand forecast was very high, up to ≈1950 MW, and the maximum energy deficit was ≈300 MW (although it could sometimes reach ≈600 MW). However, when the net power generation considered the contribution of ABs + PH, it was possible to reduce the power deficit up to ≈150 MW. This implied several challenges since it was stipulated that the energy contribution of Abs + PH was ≈100 MW, considering the generation of renewable energy on-site and the various types of energy storage. In particular,
Figure 9 showed that the ABs + PH analyzed in this work contributed up to ≈2.25 MW, so that even ≈97.5 MW had to be generated by ABs + PH distributed throughout the North Baja California region, which represented the development of ≈44 similar projects based on ABs + PH. Furthermore, as part of the discussion, it was very important to clarify that the role of ABs in the energy utility grid was to supply energy to DGCs as a strategy to reduce the energy deficit considering the AC model of ABs (see
Figure 5). Despite this, the proposal can be adapted to DC or Hybrid models of ABs.
Regarding the economic viability of the technical proposal implementation shown in this manuscript, it is important to mention that an economic analysis was carried out for the 18 buildings mentioned that met the Active Building + Passivhaus standard criteria, obtaining a Return On Investment (ROI) of approximately 11 years. The above was considering that the electricity prices of the exported and imported energy from the buildings were based on the national energy policy that establishes many tariffs and conditions. In particular, the price of electricity exported from the building (injected into the public network) was 0.015–0.13 USD/kWh. Regarding the electricity purchased from the public network, it was 0.032–0.23 USD/kWh. In this way, the economic viability analysis considered an average energy import and export price of 0.131 USD/kWh and 0.072 USD/kWh, respectively. Considering that the proposal was a project that helped to increase the energy security of the region, the return on investment could be reduced by up to 5.6 years, considering government support aimed at supporting buildings that prioritize caring for the environment through the use of renewable energy sources, energy management systems, and bioclimatic architecture.
7. Conclusions and Future Work
In this study, the analysis of the integration proposal of Active Buildings that meet the Passivhaus standard criteria at the Premium level was presented as an option to reduce the energy deficit (≈600 MW). Active Buildings were interconnected to distributed generation circuits (DGC1, DGC2, and DGC3) belonging to a regional electricity grid. In particular, the results concerning the energy rehabilitation of existing buildings showed the feasibility of increasing the installed power capacity up to ≈2.25 MW on the local electricity grid and up to ≈100 MW on the regional electricity grid considering several similar projects, through the in situ renewable energy generation while meeting a certain comfort level in the Active Buildings. The final results of the proposal shown in this manuscript allowed to determine the impact on the net generation forecast using Active Buildings that meet the Passivhaus criteria (the average absolute forecast error resulted from the emulations shown was 7.25%, depending on the distributed generation circuit, local and regional electrical network analyzed; although the overall margin of error for the forecasts was 6.1–9.2%). However, as shown in
Section 3, the particular actions related to energy rehabilitation had to be appropriate to the locality and quality of the buildings analyzed, or, in that case, establish the construction of new buildings that comply with the Passivhaus criteria from their conceptual design. In addition, this implies a reduction in the energy deficit of the National Electric System (particularly in the North Baja California region), which could help increase regional energy security. To clarify the primary energy sources that provide the utilities (heating, cooling, hot water, ventilation, lighting) in buildings currently, it is important to mention that, due to the different construction styles of the buildings analyzed, not all buildings used the same primary energy sources. However, in general, public services use renewable energy sources, especially photovoltaic and thermal solar energy, as well as wind energy. Furthermore, studies are currently being carried out for the adaptation of low enthalpy geothermal plants.
As part of our future work, we plan to implement a continuous monitoring system (based on advanced smart metering because it supports a smart grid operation) for the criteria related to the Passivhaus standard to control the net energy demand, since this may affect the proposed reduction in the energy deficit of the regional electric network. In addition, the energy storage techniques feasibility was analyzed (e.g., Pumped Hydroelectric Storage, Compressed Air Energy Storage, Hydrogen Energy Storage, Thermal Energy Storage, among others) in the regional electricity grid, both LV and MV Networks, considering the daily self-discharge, service lifetime, capital cost per unit energy (USD/kWh), and capital cost per unit power (USD/kW). This was because the project presented only considered a battery bank composed of Absorbent Glass Mat (AGM) batteries type, 2 V, and 1000 Ah.


 ,
, 


