Abstract
The aim of this paper is to detect a stator inter-turn short circuit in a synchronous machine through the analysis of the external magnetic field measured by external flux sensors. The paper exploits a methodology previously developed, based on the analysis of the behavior with load variation of sensitive spectral lines issued from two flux sensors positioned at 180° from each other around the machine. Further developments to improve this method were made, in which more than two flux sensors were used to keep a good sensitivity for stator fault detection. The method is based on the Pearson correlation coefficient calculated from sensitive spectral lines at different load operating conditions. Fusion information with belief function is then applied to the correlation coefficients, which enable the detection of an incipient fault in any phase of the machine. The method has the advantage to be fully non-invasive and does not require knowledge of the healthy state.
1. Introduction
Synchronous machines (SMs) provide an essential service for the production and the use of electrical energy with high efficiency [1]. However, when machine damage occurs, it can lead to expensive repairs and downtime for the global system what produces loss of production in industrial applications and electric power plants. Therefore, it is important to detect internal faults before tripping the electrical protections. In addition, from an energy point of view, small faults can lead to a loss of about 2% of the energy converted by the machine; therefore, the SMs are carefully monitored.
In many works, it has been shown that electrical machines are subject to mechanical issues common to most rotating machines [2,3], such as mechanical imbalance [4], bearing faults [5], or resonance [6]. However, electrical machines also have their own specific problems such as stator winding faults, demagnetization of magnets, or broken rotor bars, which will produce magnetic imbalances. For this reason, monitoring devices based on information provided by magnetic flux sensors can be effectively used to detect incipient internal imbalances.
The usual methods currently used for the diagnosis of electrical machines are based on the measurement of noise [7], currents [8], vibrations [9], torque, and temperature [10]. Currently, these methods give meaningful results but still face some problematic issues. It is, for example, necessary to detect the faults using the same standard sensors as those used for other purposes, such as current and voltage sensors. These methods have already proven their importance in the industry, but their use is generally reserved for specific applications (power plants, security installations, systems of significant economic interest) because they often operate in association with surveillance and monitoring systems. Thus, their costs or the need for specialized staff limit their generalization.
Recently, methods based on the analysis of external leakage flux measurement around electrical machines have been developed for the diagnosis of these machines [11]. Based on an evaluation from numerous practical cases, the external leakage flux can be considered to be one of the most practical signals containing information needed for the detection of faults, such as rotor broken bars [12], stator inter-turn short-circuits [13,14], eccentricities [15], or bearings faults [16]. For data analysis, these methods use a wide variety of analytical techniques, which are promising approaches for faults diagnostic [17,18]. One can mention the fusion of information with belief functions [19], or the methods based on correlation coefficient [20,21] recently used to detect the stator short-circuit faults.
The proposed method exploits the flux density components in the vicinity of the machine. It is based on a property tied to the variations of the amplitudes of sensitive spectral lines during a variation of the load level [18]. The information can be statistically analyzed by comparing the evolution of the amplitude of sensitive harmonics for two diametrically opposed sensors using the Pearson correlation coefficient . This feature gives the possibility to highlight incipient inter-turn short-circuit faults in synchronous machines and to classify the faults according to their severity.
Section 2 of this paper focuses on the presentation of the magnetic field measurement, the characteristics of the flux sensors, and the steps followed in the analysis procedure. Section 3 presents the diagnosis method based on the Pearson correlation coefficient and fusion with belief functions. Section 4 is dedicated to the experimental results obtained for the studied synchronous machine.
2. Magnetic Field Measurement
2.1. Principle of the Methodology
The methodology used to detect stator inter-turn short-circuit faults is based on comparative measurements of the stray magnetic field around the machine. This method is privileged because the external flux density is more sensitive than the stator current signature analysis to detect this type of fault in electrical machines. The measurement of the external field was carried out at no load and under load operating conditions using two wound sensors placed around the machine and shifted with 180°. An image of the sensors positioning at several positions is presented in Figure 1.
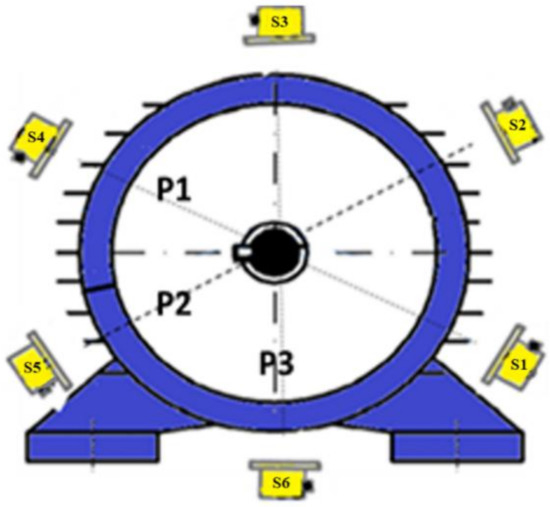
Figure 1.
Sensors’ position around the machine frame.
The signal analysis was limited to the amplitude variation of specific harmonics delivered by each sensor. The sensor positions were changed considering three different positions (P1, P2, P3) to cover the maximum surface of the machine frame. The procedure consisted of analyzing harmonic variations by calculating the Pearson correlation coefficient between harmonic amplitudes obtained from the signals delivered by a pair of sensors during load variations. This coefficient can be extracted from these variations, and therefore, a diagnostic procedure can be carried out. The steps of the measurement procedure are presented in Figure 2.
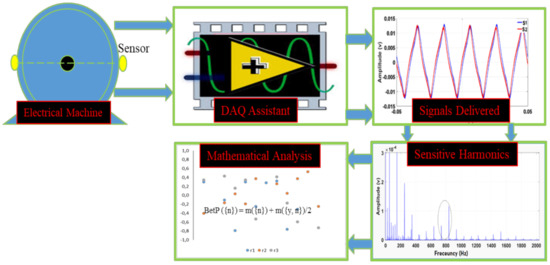
Figure 2.
Analysis procedure using the magnetic stray flux.
The fault-sensitive harmonic frequencies depend on the characteristics of the machine. Equation (1) makes it possible to calculate the sensitive spectral lines frequency [18].
where is the supply frequency, is the number of rotor slots or the number of rotor saliency for salient pole machine, and is machine rotation speed in rpm.
2.2. Sensor and Acquisition Characterization
For measurement of the leakage flux around the machine, similar coil sensors were used. The principle of the coil sensor is to transform this flux into an emf proportional with the number of coils and with the intensity of the leakage flux embraced by a coil. The sensor used for practical measurements was manufactured with 360 turns and S = 0.031416 m2 area. It was easy to install, the measurement was simple, and it did not require any associated electronics, except for amplifying the induced electromotive force signal if necessary (Figure 3).
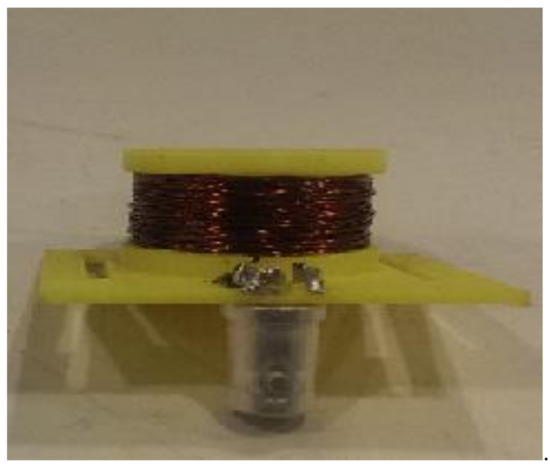
Figure 3.
Manufacture coil sensor used for measurement of the leakage flux around the machine.
To choose the sensor, it is necessary to consider its bandwidth and its resonant frequency. The bandwidth of the sensor is mainly tied to the first resonant frequency. In the case of a coil sensor without an additional circuit considered as an R-L-C circuit, the resonance can occur under certain conditions at a frequency expressed as , where is the inductance of the sensor and is the parasitic capacitance.
The frequency response obtained with an impedance analyzer for the used sensor is illustrated in Figure 4. This sensor has a resonance at 660 kHz, which means that the range of use of the sensor must be far from this frequency. In the presented study, the frequency response is lower than 1 kHz, which is suitable with the used sensor.
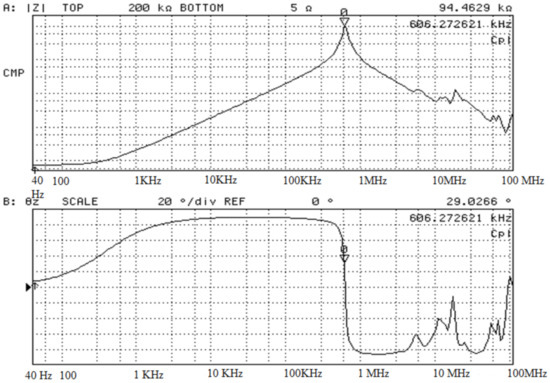
Figure 4.
Frequency response of the used coil sensor obtained with an impedance analyzer system.
The amplitude of the measured signal depends on the sensor transfer function, the attenuation of the machine frame, and the sensor position. The acquisition system must be able to measure this kind of signal, with a magnitude of some mV. For recording, the sampling frequency was chosen at fa = 10 kHz with a frequency resolution ∆f = ±0.1 Hz and acquisition time Ta = 10 s. Taking into consideration that the interest harmonics for synchronous machines are in the lower frequency range (<1 kHz), the acquisition of the signal was treated by the mean of numerical low-pass filter limited at 1500 Hz.
3. Diagnostic Method
Stator inter-turn short=circuit fault generates a magnetic internal asymmetry as well as a change in the amplitude of specific sensitive harmonics of the airgap flux density, as highlighted in [18]. Therefore, as the external magnetic field originates from the airgap flux density, it can provide useful information to detect stator inter-turn short-circuit fault. Moreover, the asymmetry can be further exploited by using at least two external flux sensors S1 and S2 positioned at 180° from each other around an electric machine, as is shown in Figure 5. The asymmetry leads to a difference between the signal provided by both signals, as shown in Figure 1. The asymmetry also affects the harmonics content including these sensitive to the fault.
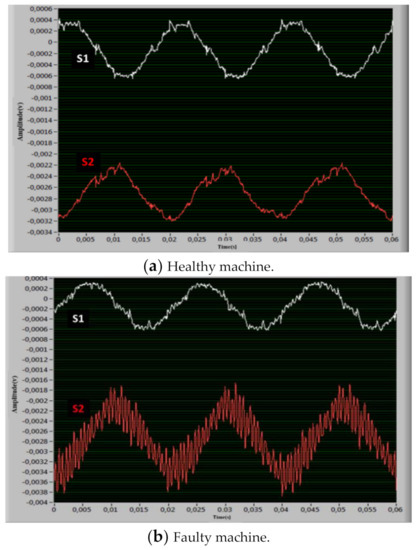
Figure 5.
Signals delivered by two coil sensors S1 and S2 placed at 180° around a 10 kW synchronous machine: (a) electromagnetic force measured for healthy machine: (b) electromagnetic force measured for the faulty machine.
The amplitudes of the sensitive harmonics denoted and are introduced by twin as inputs to determine the Pearson correlation coefficient . and are related to different load conditions k and different positions i. The Pearson coefficient can be defined as follows:
The Pearson correlation coefficient can be understood as follows:
- If ri is close to 0, there is no linear relationship between and when k varies. Therefore, the amplitudes of the harmonics vary in a different way, which indicates the presence of an inter-turn short-circuit fault in the stator.
- If ri is close to −1, and vary strictly in opposite direction and linearly in case of load variation. In this case, there is also a stator fault in the machine.
- On the contrary, when ri is close to 1, and vary together linearly according to load variations. This means that the external magnetic field around the machine keeps a good symmetry. The machine may be in good condition, but this could be confirmed for other positions because the position of the sensors from the faulty turn has also an influence on the Pearson coefficient [20].
With positions, correlation coefficients are obtained, and each Pearson coefficient can be considered as a piece of information regarding the presence of a fault. Then, the fusion technique using the Demptser–Shafer theory of belief functions [19,22] can be then used as a frame to characterize and combine information to make a final decision concerning the presence of a stator inter-turn short-circuit fault. The first step in belief function methodology is to define a frame of discernment Ω composed of the true value taken by a variable of interest x. In our case, the frame of discernment is composed of two elements “y” and “n”, Ω = {y, n}, such that “y” means that “there is a fault” and “n” means that “there is no fault”. Then, the goal is to define a mass function mr,i as information regarding the presence of a fault provided by each Pearson coefficient ri obtained at position i. The evolution of the mass function according to the value of the coefficient ri is given as an example in Figure 6. Considering number of possible positions of the sensors, mass functions tied to N information about the presence of a fault on the machine can be obtained. Then, this information can be combined using the following relationships:

Figure 6.
Evolution of the mass function as a function of the value of the correlation coefficient ri.
In the case of two mass functions, mr,1 and mr,2 issued from r1 and r2, respectively; this equation can be written as follows:
Since this rule is associative and commutative, the order used for combined sources does not affect the result.
To make a decision about the presence of a fault, the transformation of a single mass m into the probability can finally be made. The following expression is used to determine :
where |A| is the number of elements included in “A”, (its cardinality). The proposed procedure is performed in several steps displayed in Figure 7. In a first step, sensitive harmonics are extracted from the spectrum of the signal picked up by diametrically opposed sensors in different positions (P1, P2,…, PN) around the machine. In the second, the Pearson correlation coefficients “r1, r2,…, rN ” are calculated for each position. In the third step, the fusion of the Pearson coefficients is performed, and finally, a decision is obtained by converting the mass function into a probability.
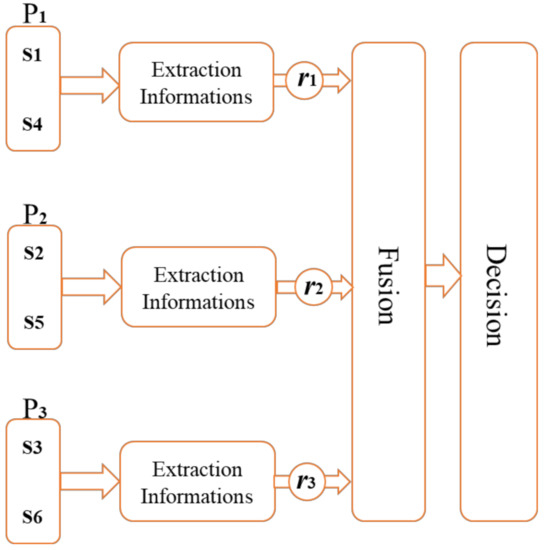
Figure 7.
Representation of the proposer procedure method for transforming the fem signal measured by the sensors S1 and S2 in probability information about presence of a short-circuit fault in the machine.
4. Experimental Results
4.1. Presentation of the Test Bench
The synchronous machine used for the experimental test was a 230/400 V, 4 poles, 50 Hz, 10 kW machine with a smooth rotor similar to the rotor of a turbo generator. The rotor winding is supplied with a DC current. This machine had the rotor regularly slotted with = 32 rotor slots, but some slots are not filled by the winding. Supplied on 50 Hz, the sensitive spectral lines are 750 and 850 Hz, and for this study, the choice for the analysis was 750 Hz, which corresponds to the line with the highest magnitude. Equation (1) makes it possible to calculate the sensitive spectral lines.
The test bench is presented in Figure 8. Internal connecting points were extracted from the stator winding of the machine to be able to create an artificial short circuit close to the phase input (phase A), in the middle phase (phase B), or close to the neutral point (phase C).
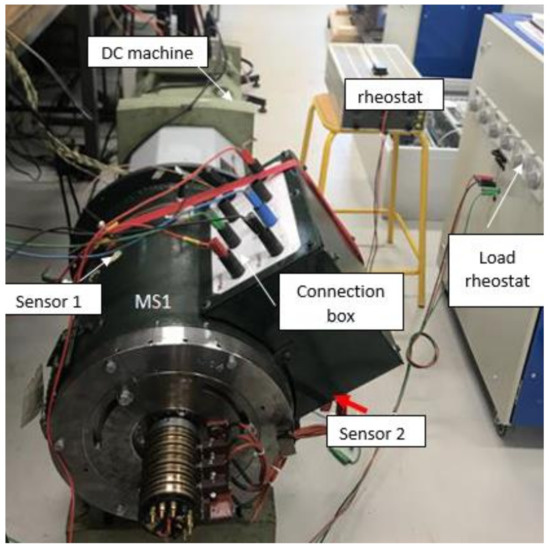
Figure 8.
Experimental test bench with 10 kW synchronous machine and DC machine used as drive motor.
Figure 9 shows the winding diagram of the machine with the internal connecting points. These points are accessible via the “connection box”, and the short-circuit current is controlled and limited by an external rheostat to protect the machine windings. The total number of turns in phase A is 126, and a short-circuit between 1 to 2 corresponds to a one short-circuited turn (0.8% of a complete phase), between 2 to 3 corresponds to three short-circuited turns (2.3%), and between 1 to 4 corresponds to five short-circuit turns (4%).
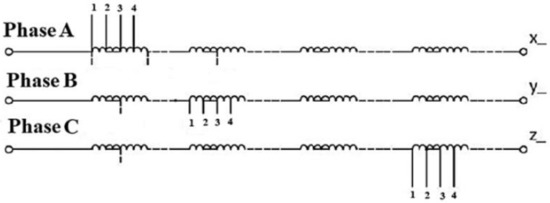
Figure 9.
Winding diagram of the stator of the synchronous machine.
4.2. Measurement Analysis
For the considered machine, a series of measurements were carried out at several loads and for different positions of the short circuit. The tests were carried out for the machine operating as a generator with a rheostat used as load and in the following configurations:
- −
- Without short circuit;
- −
- Short circuits between 1–2, 2–3, and 1–4, for the three phases;
The value of the current measured in each case of short circuit (‘sc’) is:
- −
- Isc = 3A for short circuits on coil ‘1–2’, one turn short circuit;
- −
- Isc = 9A for short circuits on coil ‘2–3’, three turns in short circuit;
- −
- Isc = 15A for short circuits on coil ‘1–4’, five turns in short circuit.
For this machine, the analyzed amplitude corresponded to a sensitive harmonic at 750 Hz harmonic.
In these configurations, 9 cases (8 with faults and 1 healthy) were identified. The measurements obtained by the sensors for the three positions are summarized in Table 1, in the case of the healthy machine, and in Table 2, in the case of the faulty machine (fault in phase A, Isc = 3A). Here, the measurements are given for harmonics at 750 Hz.

Table 1.
Example of measurements obtained from three positions for the healthy machine.
Table 2.
Example of measurements obtained from three positions for the faulty machine (A–3A).
The values of correlation coefficients , presented in Table 3, were obtained using the measured values and Equation (2).
Table 3.
Correlation coefficients obtained from three positions in the faulty machine (healthy only for one case).
- (1)
- Example of calculation of belief functions, fusion, and probability of fault
In this example, we considered the case of the faulty machine in which the short-circuit current measured in phase B between windings 1 and 2 is 3A. The mass functions was obtained using Figure 6. In this case, with we obtained the following mass function: and , where represents the information “I do not know if there is a fault”. The same operation was realized for and . Mass functions obtained are presented in Table 4. In this table, represents the conflict.
Table 4.
Mass functions obtained from the correlation coefficient presented in Table 3.
To obtain a unique mass function, we used the combination rule defined by (3) and (4). This combination rule is associative and commutative; therefore, in the first step, we combined and to obtain . In the second step, we combined with to obtain a final and unique mass function The numerical application of this combination rule is presented in Table 5.
Table 5.
Numerical application example of a combination of the mass functions (faulty machine B–3A).
The final mass function is for “yes” , for “no” , and for “I do not know” . In the example, the pieces of information are not conflictual, and that is why the conflicting mass is zero (.
To make a decision, the single mass function can be transformed into the probability measure [23,24] defined by (5). In case of the faulty machine (B–3A), using Equation (5), obtained from can be written as follows:
and
Therefore, we obtain probability for “yes“ and for “no”. Considering obtained probability, the decision made is the hypothesis because this corresponds to the hypothesis with the maximum probability. In this case, there is a fault on the considered machine. The same calculus was applied for each case of the nine tested cases and presented in Table 3.
- (2)
- Results obtained for global tests
Here, the influence of multiplying the number of positions around the machine on the efficiency of fault detection is analyzed.
The measurement is relative to one healthy case plus eight faulty cases, corresponding to faults at different positions of the stator. One case takes into account several load levels, and signals picked up by two sensors placed at three positions, as depicted in Figure 1. The results for this machine are presented in Table 6.
Table 6.
Percent of correct decisions for each series with the synchronous machine.
Here, the results are given as a percentage of correct detections.
To analyze the effect of the number of positions on the effectiveness of fault detection, the following values were taken into account:
By position P1, the method can detect percentage defects equal to 55.56%;
By position P2, the method can detect percentage defects equal to 22.22%;
By position P3, the method can detect percentage defects equal to 77.78%;
When, at the same time, we consider the information from the three positions (P1, P2, and P3), then, the proposed method detected percentage defects equal to 88.89%.
Therefore, it can be concluded that the detection can be increased if we multiply the number of positions around the machine.
5. Conclusions
This paper presents a new methodology to detect the short-circuit between the stator winding of synchronous machines. This method is based on the calculation of Pearson correlation coefficient and fusion of obtained Pearson coefficient with belief functions. Useful data concern sensitive harmonics in the external magnetic field picked up at several locations, and whose magnitude change when the load varies. Obtained results show the increase of detection percentage by multiplying the number of measurement positions around the machine. The method has the advantage of being fully non-invasive, and it does not require knowledge of the healthy state. As only load variations are required, the method is easy to use in an industrial application because the system simply needs to follow the operating condition of the machine and to pick up data from the external field.
Author Contributions
Conceptualization, R.R.; formal analysis, R.P.; investigation, M.I.; methodology, E.L. and D.M. All authors have read and agreed to the published version of the manuscript.
Funding
The authors gratefully acknowledge the financial support from the Major Domain of Interest (DIM) “Eco-Energy Efficiency” of Artois University.
Conflicts of Interest
The authors declare no conflict of interest.
References
- Bramerdorfer, G.; Silber, S.; Weidenholzer, G.; Amrhein, W. Comprehensive cost optimization study of high-efficiency brushless synchronous machines. In Proceedings of the 2013 International Electric Machines & Drives Conference, Chicago, IL, USA, 12–15 May 2013; pp. 1126–1131. [Google Scholar]
- Petrov, A.; Plokhov, I.; Rassõlkin, A.; Vaimann, T.; Kallaste, A.; Belahcen, A. Adjusted electrical equivalent circuit model of induction motor with broken rotor bars and eccentricity faults. In Proceedings of the 2017 IEEE 11th International Symposium on Diagnostics for Electrical Machines, Power Electronics and Drives (SDEMPED), Tinos, Greece, 29 August–1 September 2017; pp. 58–64. [Google Scholar]
- Hamadache, M.; Lee, D.; Veluvolu, K.C. Rotor speed-based bearing fault diagnosis (rsb-bfd) under variable speed and constant load. IEEE Trans. Ind. Electron. 2015, 62, 6486–6495. [Google Scholar] [CrossRef]
- Fournier, E.; Picot, A.; Régnier, J.; Yamdeu, M.T.; Andréjak, J.-M.; Maussion, P. Current-based detection of mechanical unbalance in an induction machine using spectral kurtosis with reference. IEEE Trans. Ind. Electron. 2015, 62, 1879–1887. [Google Scholar] [CrossRef] [Green Version]
- Tong, Z.; Li, W.; Zhang, B.; Jiang, F.; Zhou, G. Online Bearing Fault Diagnosis Based on a Novel Multiple Data Streams Transmission Scheme. IEEE Access 2019, 7, 66644–66654. [Google Scholar] [CrossRef]
- Perisse, F.; Mercier, D.; Lefevre, E.; Roger, D. Robust diagnostics of stator insulation based on high frequency resonances measurements. IEEE Trans. Dielectr. Electr. Insul. 2009, 16, 1496–1502. [Google Scholar] [CrossRef]
- Torregrossa, D.; Khoobroo, A.; Fahimi, B. Prediction of acoustic noise and torque pulsation in pm synchronous machines with static eccentricity and partial demagnetization using field reconstruction method. IEEE Trans. Ind. Electron. 2012, 59, 934–944. [Google Scholar] [CrossRef]
- Thomson, W.T.; Fenger, M. Current signature analysis to detect induction motor faults. IEEE Ind. Appl. Mag. 2001, 7, 26–34. [Google Scholar] [CrossRef]
- Lim, W.Q.; Zhang, D.H.; Zhou, J.H.; Belgi, P.H.; Chan, H.L. Vibration-based fault Diagnosis platform for rotary machines. In Proceedings of the 36th Annual Conference on IEEE Industrial Electronics Society (IECON 2010), Glendale, AZ, USA, 7–10 November 2010; pp. 1404–1409. [Google Scholar]
- Younsi, M.O.; Lecointe, J.; Ninet, O.; Morganti, F.; Brudny, J.; Zidat, F. A noninvasive external flux based method for in-service induction motors torque estimation. IEEE Trans. Energy Convers. 2018, 34, 782–788. [Google Scholar] [CrossRef]
- Frosini, L.; Borin, A.; Girometta, L.; Venchi, G. A novel approach to detect short circuits in low voltage induction motor by stray flux measurement. In Proceedings of the 20th International Conference on Electrical Machines (ICEM ’12), Marseille, France, 2–5 September 2012; pp. 1536–1542. [Google Scholar]
- Sun, L.; Wang, X.; Xu, B. A detection method for broken rotor bar fault in induction motors based on SVD and SFOC-ESPRIT. Diangong Jishu Xuebao/Trans. China Electrotech. Soc. 2015, 30, 147–156. [Google Scholar]
- Gritli, Y.; Rossi, C.; Casadei, D.; Filippetti, F. Square current spacevector signature analysis for rotor fault detection in wound-rotor induction machine. In Proceedings of the 2016 XXII International Conference on Electrical Machines (ICEM), Lausanne, Switzerland, 4–7 September 2016; pp. 2894–2898. [Google Scholar]
- Briz, F.; Degner, M.W.; Garcia, P.; Diez, A.B. High-frequency carrier-signal voltage selection for stator winding fault diagnosis in inverter-fed ac machines. IEEE Trans. Ind. Electron. 2008, 55, 4181–4190. [Google Scholar] [CrossRef]
- Chernyavska, I.; Vítek, O. Analysis of air-gap eccentricity in inverter fed induction motor by means of motor current signature analysis and stray flux of motor. In Proceedings of the IEEE 11th International Symposium on Diagnostics for Electrical Machines, Power Electronics and Drives (SDEMPED), Tinos, Greece, 29 August–1 September 2017; pp. 72–76. [Google Scholar]
- Bessous, N.; Pusca, R.; Romary, R.; Saba, S. Rolling Bearing Failure Detection in Induction Motors using Stator Current, Vibration and Stray Flux Analysis Techniques. In Proceedings of the IECON 2020 The 46th Annual Conference of the IEEE Industrial Electronics Society, Marina Bay Sands Expo, Singapore, 18–21 October 2020; pp. 1088–1095. [Google Scholar]
- Irhoumah, M.; Pusca, R.; Lefevre, E.; Mercier, D.; Rromary, R. Evaluation of the voltage supply unbalance and detection of the short-circuit faults in induction machine through the neighboring magnetic field. In Proceedings of the 2021 International Conference on Applied and Theoretical Electricity (ICATE), Craiova, Romania, 27–29 May 2021. [Google Scholar]
- Pusca, R.; Romary, R.; Ceban, A.; Brudny, J.F. An online universal diagnosis procedure using two external flux sensors applied to the AC electrical rotating machines. Sensors 2010, 10, 10448–10466. [Google Scholar] [CrossRef] [PubMed]
- Irhoumah, M.; Pusca, R.; Lefevre, E.; Mercier, D.; Romary, R.; Demian, C. Information Fusion with Belief Functions for Detection of Interturn Short-Circuit Faults in Electrical Machines Using External Flux Sensors. IEEE Trans. Ind. Electron. 2018, 65, 2642–2652. [Google Scholar] [CrossRef]
- Irhoumah, M.; Pusca, R.; Lefevre, E.; Mercier, D.; Romary, R. Detection of the Stator Winding Inter-Turn Faults in Asynchronous and Synchronous Machines Through the Correlation Between Harmonics of the Voltage of Two Magnetic Flux Sensors. IEEE Trans. Ind. Appl. 2019, 55, 2682–2689. [Google Scholar] [CrossRef]
- Irhoumah, M.; Pusca, R.; Lefèvre, E.; Mercier, D.; Romary, R. Information fusion with Correlation Coefficient for detecting inter-turn short circuit faults in asynchronous machines. In Proceedings of the 2019 IEEE 12th International Symposium on Diagnostics for Electrical Machines, Power Electronics and Drives (SDEMPED), Toulouse, France, 27–30 August 2019; pp. 232–237. [Google Scholar]
- Shafer, G. A Mathematical Theory of Evidence; Princeton University Press: Princeton, NJ, USA, 1976. [Google Scholar]
- Smets, P. Decision making in the TBM: The necessity of the pignistic transformation. Int. J. Approx. Reason. 2005, 38, 133–147. [Google Scholar] [CrossRef] [Green Version]
- Denoeux, T. Decision-making with belief functions: A review. Int. J. Approx. Reason. 2019, 109, 87–110. [Google Scholar] [CrossRef] [Green Version]
Publisher’s Note: MDPI stays neutral with regard to jurisdictional claims in published maps and institutional affiliations. |
© 2021 by the authors. Licensee MDPI, Basel, Switzerland. This article is an open access article distributed under the terms and conditions of the Creative Commons Attribution (CC BY) license (https://creativecommons.org/licenses/by/4.0/).