Article

Novel Protection Coordination Scheme for Active Distribution Networks

1
Department of Electrical Engineering, Sukkur IBA University, Sukkur 65200, Pakistan
2
Department of Electrical Power Engineering, Wroclaw University of Science and Technology, 50-370 Wroclaw, Poland
*
Authors to whom correspondence should be addressed.
These authors contributed equally to this work.
Electronics 2021, 10(18), 2312; https://doi.org/10.3390/electronics10182312
Submission received: 8 August 2021 / Revised: 8 September 2021 / Accepted: 14 September 2021 / Published: 20 September 2021
(This article belongs to the Special Issue Environment and Electrical Engineering-Edition 2021)

Abstract

:
Distribution networks are inherently radial and passive owing to the ease of operation and unidirectional power flow. Proper installation of Distributed Generators, on the one hand, makes the utility network active and mitigates certain power quality issues e.g., voltage dips, frequency deviations, losses, etc., but on the other hand, it disturbs the optimal coordination among existing protection devices e.g., over-current relays. In order to maintain the desired selectivity level, such that the primary and backup relays are synchronized against different contingencies, it necessitates design of intelligent and promising protection schemes to distinguish between the upstream and downstream power flows. This research proposes exploiting phase angle jump, an overlooked voltage sag parameter, to add directional element to digital over-current relays with inverse time characteristics. The decision on the direction of current is made on the basis of polarity of phase angle jump together with the impedance angle of the system. The proposed scheme at first is evaluated on a test system in a simulated environment under symmetrical and unsymmetrical faults and, secondly, as a proof of the concept, it is verified in real-time on a laboratory setup using a Power Hardware-in-loop (PHIL) system. Moreover, a comparative analysis is made with other state-of-the-art techniques to evaluate the performance and robustness of the proposed approach.

1. Introduction

Industrial revolution 4.0 has brought a broad scope of installing intelligent and autonomous devices to upgrade the exiting system to remain robust against abnormal conditions. Abnormalities include abrupt changes into the network characteristics due to different contingencies i.e., increased loading, frequent interruptions, sustained faults, etc. [1,2]. The traditional utility networks, being radial and passive are highly exposed to external disturbances but maintain their safety and security using conventional protection devices, as shown in Figure 1. Such protection devices lose their selectivity, to operate at the time of event for systems having intermittent power sources e.g., Distributed Generations (DGs) due to the bi-directional power flows [3,4]. In order to upgrade the existing protection schemes, two strategies are available, (1) changing internal settings of relays online and (2) adding directional element. However, exploiting directional element is a feasible option to ensure optimal operation and coordination of protection devices under faulty conditions [5].
With inception of faults, the network experiences voltage sag and the Sensitive Equipment (SE) may trip if its value is higher than the immunity level [6]. The parameters characterizing the voltage sag are its magnitude, duration and phase angle jump. The magnitude of voltage sag depends upon the type of fault and impedance of the network while its duration and phase angle jump rely on the fault clearing time and total X/R ratio of the network, respectively [7]. However, installed DGs are expected to support system’s voltage during sag conditions caused by prevailing contingencies [8]. However, when a fault occurs on the feeder, with DG installed between the fault point and protective devices, the relay senses a reduced fault current due to high fault impedance. Making installed protection scheme more sensitive is also not a desirable effect because it results into sympathetic and false tripping of relays even for transient events or faults occurring near the adjacent networks [9].
To avoid false tripping and maintain standard Coordination Time Interval (CTI) between the primary and backup relays, for effective protection coordination, two parameters i.e., Pick Current (IP) and Time Multiplier Setting (TMS) of over-current relays need to be designed according to the network conditions [10]. The backup protection has an important role in coordination scheme as the level of current seen by it is always assumed to be in their forward operating zone otherwise should not be activated. However, the primary relays are designed to operate for forward as well as for reverse directions to discriminate between the upstream and downstream fault currents [11]. To estimate fault direction while ensuring coordination among network relays, lead-lag angle between phase voltage and current is used as directional variable in [12]. We, in this research, following a similar idea, used phase angle jump approach instead. The intuition states that when the impedance angle is positive and phase angle jump is retarding, the direction is forward and if impedance angle is negative and phase angle jump is progressing then its reverse.
The rest of manuscript is structured into given sections: Section 2 highlights the recent research work carried out in the field of protection coordination of active distribution networks, Section 3 presents the research methodology on adding directional element to over-current relay using characteristics of phase angle jump, Section 4 discuses the results achieved with the application of proposed approach on simulated and real setups, Section 5 gives the comparative analysis of different protection coordination techniques, Section 6 summarizes the major outcomes of this research and its possible future extensions.

2. Related Works

The protection coordination analysis however has been well studied in the literature considering the fault level and distributed generation of utility network on mitigating the severe contingencies and improving system performance, respectively [13,14,15]. In [16], the researchers evaluated the effects of integrating DG with the protection coordination and voltage sag characteristics of the distribution network. However, the presented cases only accounted for post effects of DG installation without considering its outage under faulty conditions. The effects of disconnecting DGs on the protection coordination in radial distribution network were investigated in [17]. The proposed idea was however robust against upstream faults but its performance was compromised under downstream events. To determine the direction of fault current under both forward and reverse directions for back relay settings, the idea of exploiting angle between fault current and polarizing voltage was proposed in [18]. However, the proposed approach only addresses temporary faults and loses its accuracy for permanent ones. In [19], authors developed an efficient technique to coordinate the characteristics of recloser-fuse combination in distribution network with DG installed for temporary as well as sustained faults. The presented method requires manual tuning of devices using standard curve fitting characteristics. To alleviate such issue, Gravitational Search (GS) algorithm was used in [20] to select the optimal values of Plug Multiplier Settings (PMS) and Time Multiplier Settings (TMS) based on the user defined characteristics. In [21], researcher have proposed a non-heuristic technique to determine the optimal settings of relays for effective protection coordination irrespective of the DG location, size, network configuration and load. The approach is, however, dynamic and deterministic, but is computationally expensive and causes unnecessary delays in tripping of backup relays. In order to speed up the tripping of directional over-current relays in active meshed networks and ensure higher service reliability and availability, an economical and efficient idea is proposed in [22]. The suggested method is a passive yet effective way of relaxing coordination constraints to obtain fast-response of relays but is not a network agnostic approach and requires different strategies for distinct topologies. A generalized strategy using a fault current limiter to compensate the protection miscoordination and false tripping of over-current relays in utility networks is discussed in [23]. The approach uses passive elements as limiters to restrict the current flows to ensure optimal coordination among primary and backup relays. However, it requires manual computation of limiter’s impedance for installation of each DG and is also ineffective in the case of upstream faults.
To the best of authors’ knowledge, the existing protection schemes do not consider the phase angle jump information for coordination studies. The major contributions of this research are: (1) to investigate the effects of installing new DG on the voltage sag and protection coordination of utility network under different contingencies, (2) to improve an existing digital over-current relay with directional element using phase angle jump information, (3) to validate the performance and effectiveness of proposed scheme on simulated and real setups for its possible application in fields, (4) to examine the performance and robustness of proposed protection coordination scheme against other three state of art techniques.

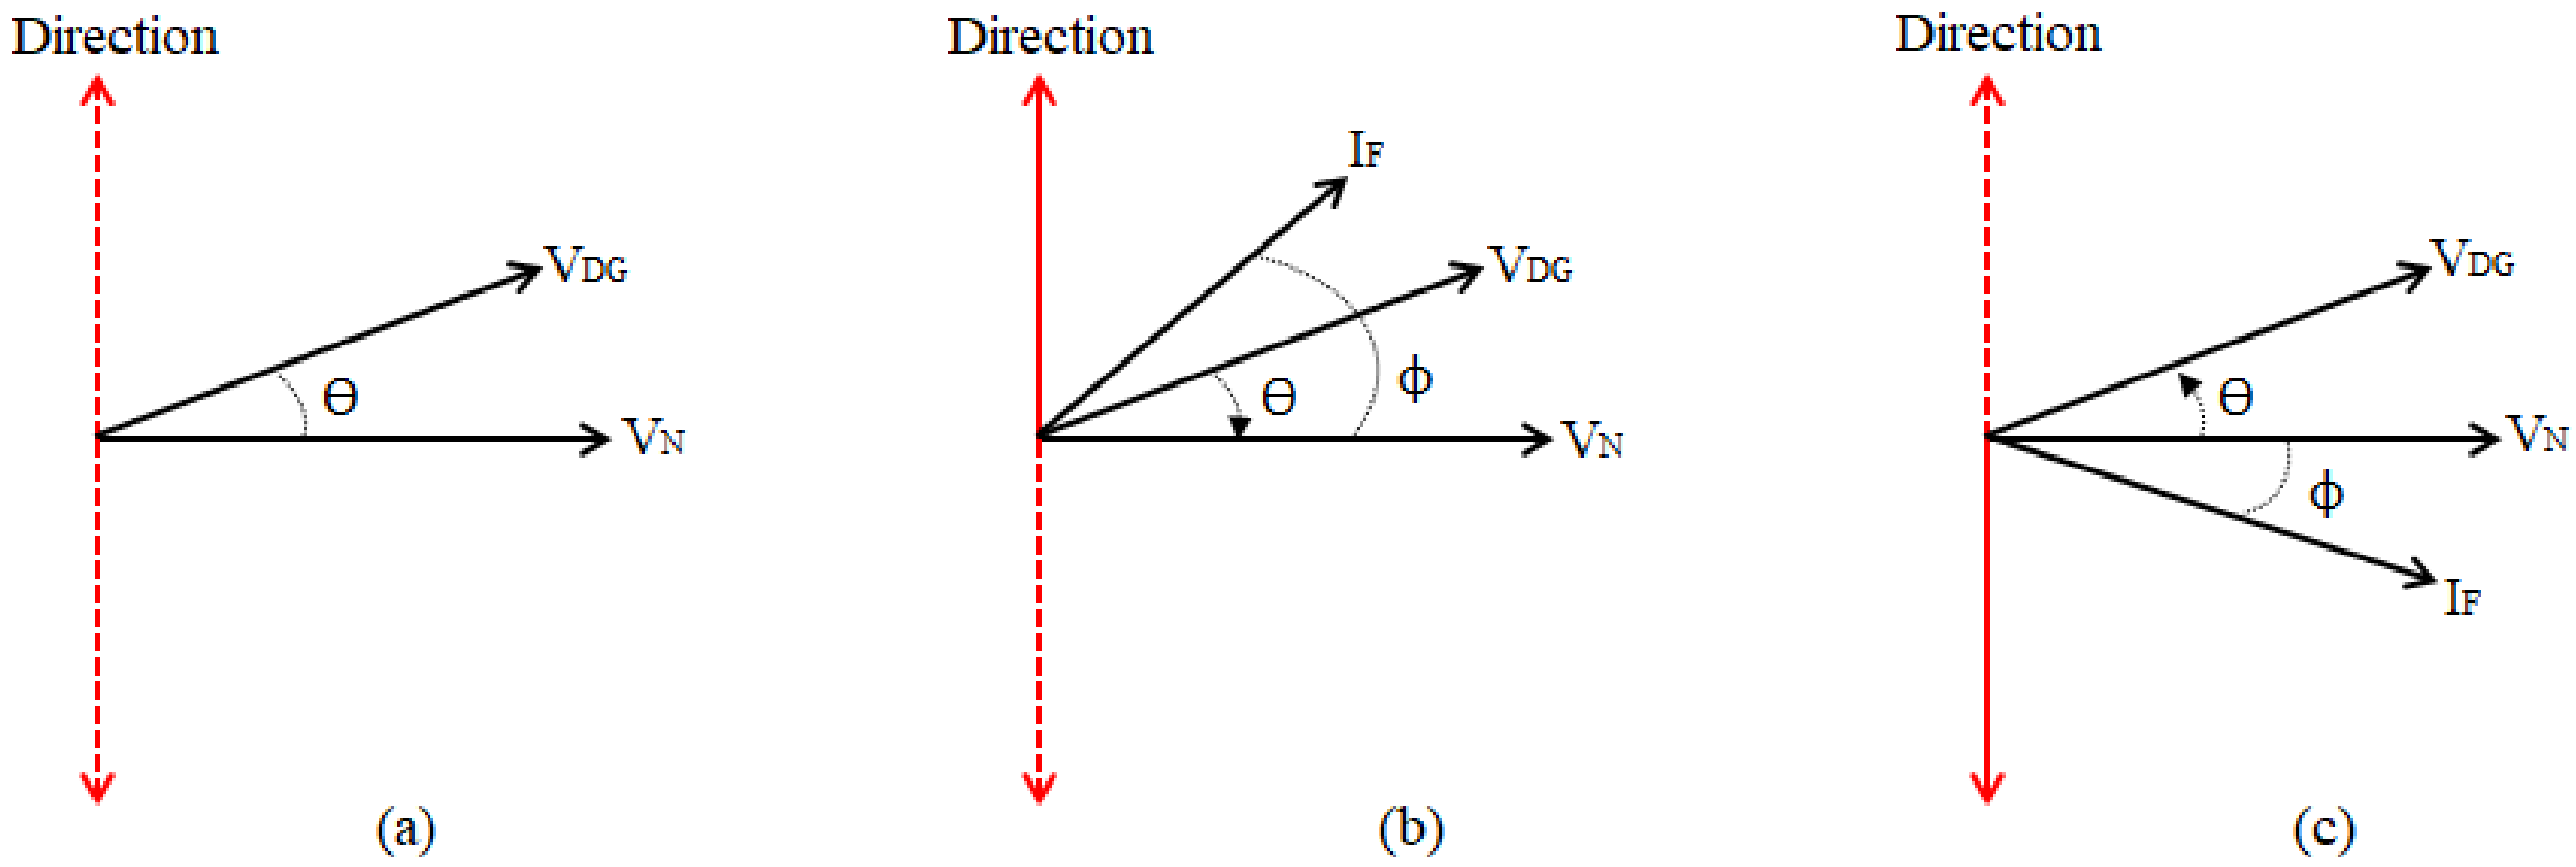
3. Research Methodology

As a proof of concept, the proposed approach is evaluated on test system shown in Figure 2. Wherein, a 132 kV source is feeding an 11 kV distribution network through 26 MVA, 132/11 kV transformer. The distribution network is supplying two distinct loads i.e., industrial and commercial with corresponding ratings of 1.1 MVA at 0.94 power factor and 2.0 MVA at 0.9 power factor. Further, a synchronous DG having peak capacity of 3.33 MVA at 0.953 power factor is installed at Bus-C through a transformer of 8 MVA, 0.4/11 kV rating. In addition to all this, to protect the network against external disturbances e.g., faults, three relay-breaker combinations are installed, which are marked as A, B and C near the grid source, industrial load and DG, respectively, with corresponding protection zones and the respective rectangular boxes between the buses represent the line impedance. It is worth mentioning that the proposed method is agnostic to network configuration and number of DGs used, provided the nature and characteristics of all participating entities, i.e, incoming DG or new equipment do not differ from the installed ones. Eventually, the entire network is transformed into per phase equivalent circuit to determine the overall voltage sag, current increase and phase angle jump for direction estimation and protection coordination.
Voltage sag, either caused by fault inception or heavy loading, is not only characterized by its magnitude and time duration but also involves change in angle of associated phase voltage, called phase angle jump [24]. To analyze the voltage sag characteristics of test system in Figure 2, its equivalent per phase circuit is defined, as shown in Figure 3.
With reference to Figure 3, the magnitude of voltage sag at the point of connection (PCC) for symmetrical faults is calculated using Equation (1), with V N , V D G , Z N , Z D G representing the voltage and impedance of utility network and DG, respectively, and Z F is the fault impedance.
V s a g = V N ( Z D G × Z F ( Z D G + Z F ) × Z N ) × V D G
Similarly, the voltage sag magnitude for unsymmetrical faults is determined using the notion of symmetrical components ( V 0 , V 1 , V 2 ) by Equation (2), where a = 1 < 120 0 is the rotation operator, V s a g P represent the phase voltage sag and V P C C is a phasor voltage at PCC given by Equation (3)
V s a g A V s a g B V s a g C = 1 1 1 1 a 2 a 1 a a 2 V P C C 0 V P C C 1 V P C C 2
V P C C = Z D G × Z F ( Z D G + Z F ) × I F
The fault current I F in Equation (3) is computed using Equation (4), where δ ( V N + V D G ) is dip in cumulative voltage profile of network and DG due to fault inception and Δ θ is change in its phase angle while Z R is the resultant impedance of network accounting effects of network, DG and faults characteristics and ϕ is the corresponding impedance angle. It is evident from Equation (4) that during faulty condition, the DG tries to compensate the voltage sag of system and thus contributes to fault current as well. This may result into unintentional tripping of relays and disturb immunity level of sensitive equipment installed, i.e, raising concerns for operating personnel and utility consumers but if the directional element is missing. Moreover, the current characteristic curves of installed relays are chosen to halt the fault flows within 0.4 (standard protection coordination interval) secs of fault inception to ensure the security and safety of network as well as the customers connected to system.
I F = δ ( V N + V D G ) < Δ θ Z R < ϕ
The phase angle jump Δ θ in Equation (4) associated with voltage sag in Equation (1) is determined by Equation (5), with obvious meaning of all the variables defined earlier.
Δ θ = tan 1 ( X N R N ) tan 1 ( X N + X D G R N + R D G )
A zero phase angle jump condition happens to exist when conjecture X N R N = X D G R D G is satisfied. It states that change in phase angle of voltage occurs when X/R ratio of DG and utility systems do not match during network operation [25]. It is evident from Equations (1) and (5) that the computation of phase angle jump (for direction estimation) is influenced by the network topology (defined by Z N ) and the characteristics of installed DG (governed by Z D G ). With varying Z D G of installed synchronous DG, which is partially caused by the excitation system and rest by the faulty conditions, the magnitude of voltage sag and phase angle jump changes but is compensated by the corresponding changes brought by the network characteristics ( Z N ) and eventually the direction estimation remains unchanged. This means that, uncertainties related to the installed DGs and utility network may affect the magnitude of cost function but do not influence the direction estimation which depends upon the polarity of line flows.

3.1. Digital Over-Current Relay Characteristics

The conceptual diagram of directional over-current relay is shown in Figure 4 [26]. Wherein, the input signal is initially filtered out to remove harmonics and dc components from it and later it is compared with the pick-up setting of relay. If it is higher than the predefined value, a signal is processed to select the desired characteristics curve. The chosen curve is integrated, and if the value of fault current is continuously higher than pickup setting of relay and is on rising trend, a trip signal is sent to the designated circuit breaker. Conversely, if fault current is temporary or momentary, the integrator output is reset to zero using feedback from reset logic gate. In order to incorporate directional features, a switch is used to allow the current to pass through the relay based on the particular direction of power flow. The directional element in this research is implemented using information of phase angle jump together with impedance angle of system, as shown in Figure 5.
In Figure 5, three scenarios are considered. In (a), the system operates in normal condition and no fault occurs, whereas in (b), a fault occurs at downstream with the direction of current flow being same as the polarity of relay. The direction in this condition is characterized by positive impedance angle ϕ and retarding phase angle jump Δ θ . While in (c), an upstream fault condition is shown where direction of current flow is opposite to the polarity of relay. The direction in this scenario is characterized by negative impedance angle ϕ and progressing phase angle jump Δ θ . However, an inverse time characteristics curve is predefined for all the fault conditions in Figure 4 that is mathematically formulated using Equation (6)
T o p t = K × T M S ( I s c / I 0 ) n 1 + L
Where, K, L and n are relay constants, I 0 is the pick-up current of relay and I s c is the short circuit current. According to IEC sheets [20], the standard values of L, K and n for inverse time over-current relays are 0, 0.145 and 0.021 , respectively. The standard value of T M S is between 0.1 and 1.

3.2. Problem Formulation

The problem of protection coordinated is formulated by a cost function that reduces the coordination times among all the relays while ensuring the desired selectivity. The objective function takes into account the sum of coordination intervals of all the backup and primary relays, which are required to be minimized and is thus defined by Equation (7) [9]
F = m = 1 K n = 1 L ( T P m n + T B m n )
For the object function defined by Equation (7), it is necessary to ensure the standard coordination time internal ( C T I ) between the relays, with its value between 0.2 and 0.4 . The CTI however defines to be the minimum time interval between the primary and backup relays to maintain the desired coordination among them. However, the value of pick current of relays in Equation (6), depends upon the load current and fault level of the system. In the view of such conditions, the objective function in Equation (7) is subjected to constraints defined by Equation (8)
T P m n T B m n C T I I O m i n I 0 I 0 m a x T M S m i n T M S T M S M a x
Furthermore, before making decisions on the operating times of relays in objective functions, the direction of fault current needs to be checked using the criteria defined by Equation (9). It states that; if the impedance angle ϕ is negative and phase angle jump Δ θ is progressing towards its reference, the direction is reverse, whereas for positive impedance angle ϕ and retarding phase angle jump Δ θ , the direction is forward.
ϕ [ ϕ v e , ϕ + v e ] 180 0 Δ θ 0 0
The complete idea, implementation and execution of proposed protection coordination scheme is summarized in Algorithm 1.
Algorithm 1: Proposed Protection Coordination Scheme.
Electronics 10 02312 i001

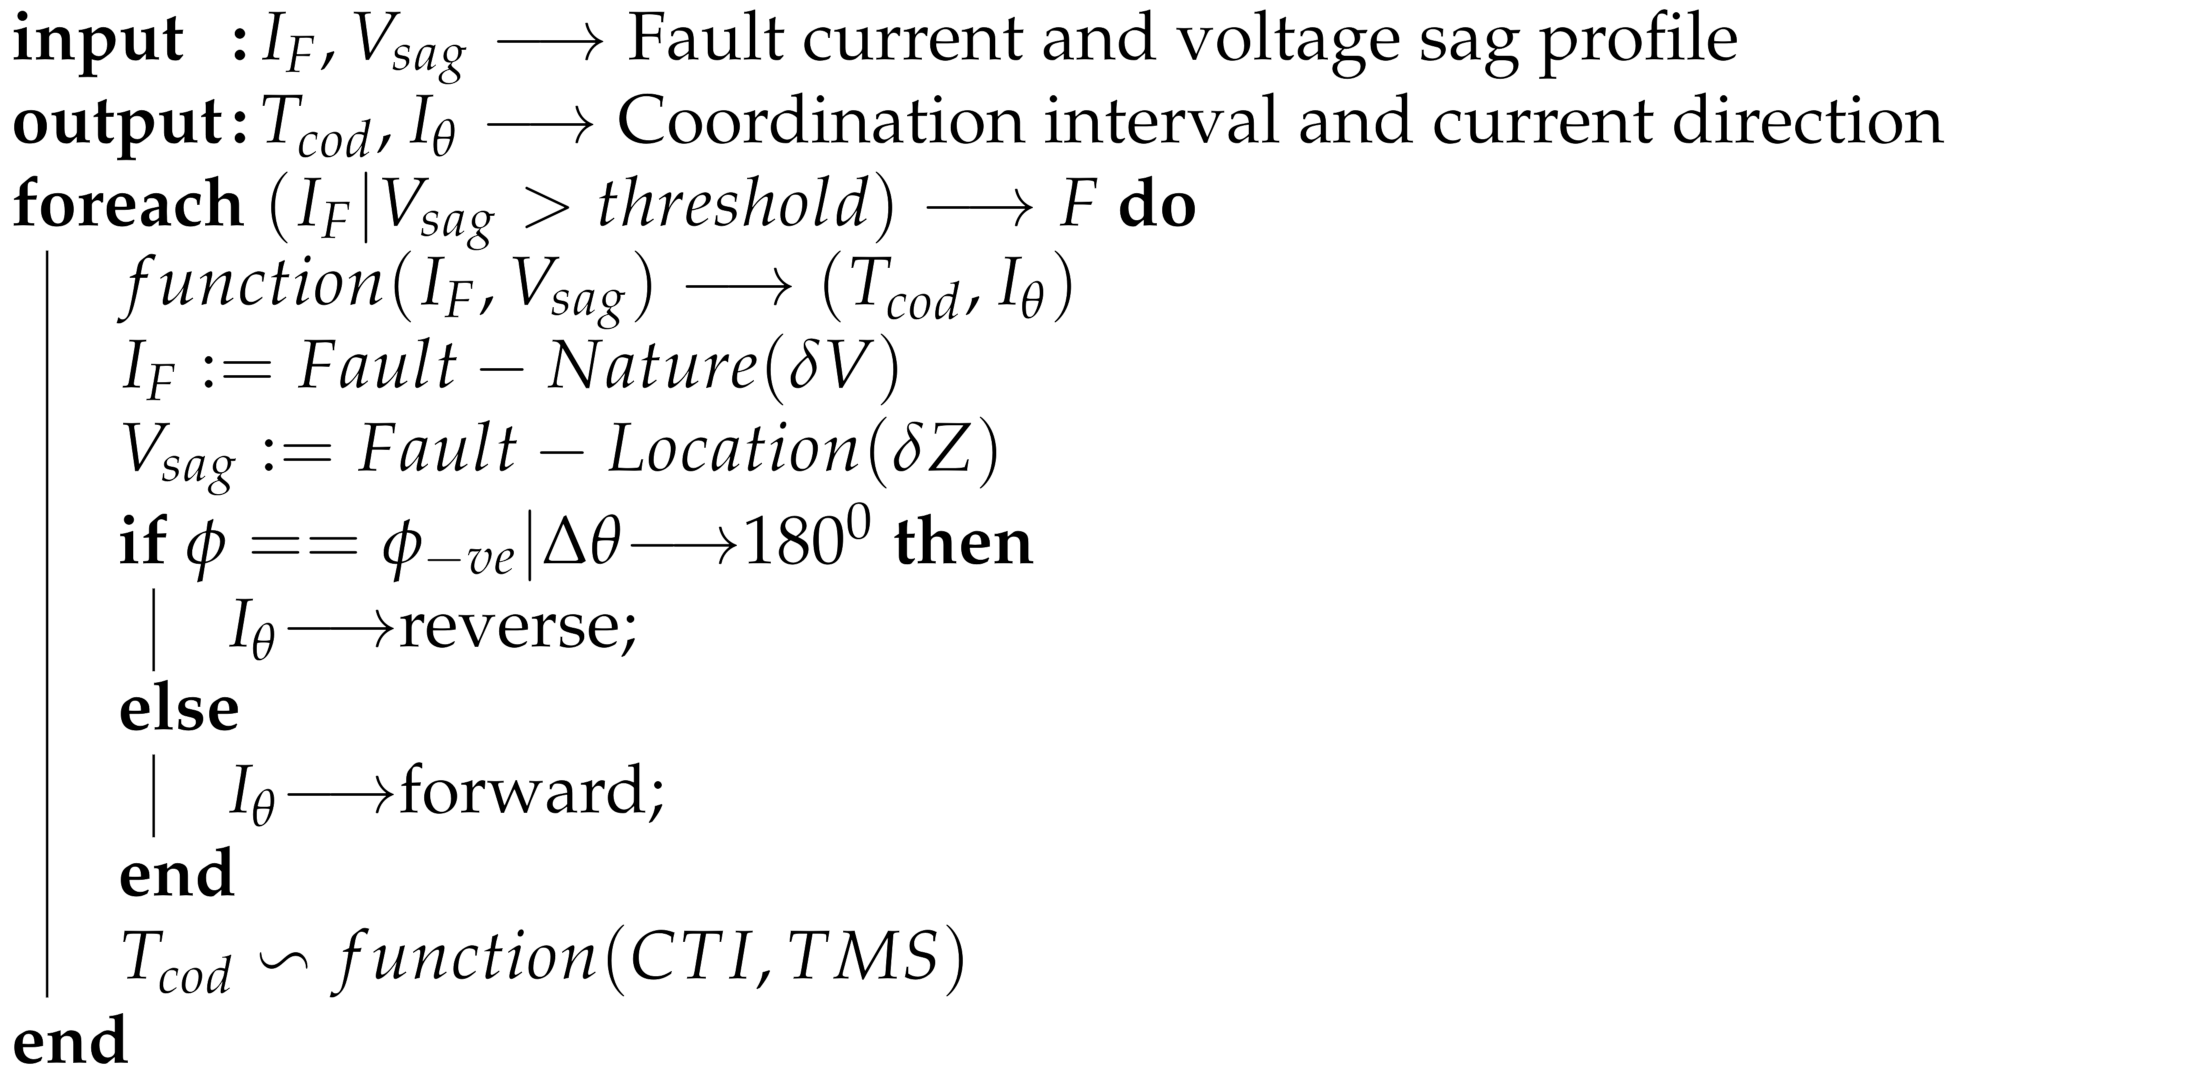
3.3. Economic Constraints

To gain maximum economical and technical benefits of proposed method, it requires to consider the financial constraints enforced by the capital cost ( C c ) on the installation of new DGs and the return (R) accumulated during their operation on supplying the additional energy, improving the voltage profile and reducing the power losses. The capital cost ( C c ) , measured in $ / h , on installing any new DG is defined by Equation (10).
C c = γ 1 S D G 2 + γ 2 S D G + γ 3
where, γ 1 , γ 2 and γ 3 are the cost coefficients, whose values are independent of the rating and type of incoming DG and as well as the configuration of distribution system being tested. In this research, their values are 0.12 , 0.26 and 0.33 respectively, that are chosen empirically. Apropos to this, the cost of integrating existing synchronous DG having rating 3.33 MVA is about 2.526 $/h. Therefore, the per day return (R), measured in $, achieved due to the improvement of voltage profile, loss reduction and energy supply by the installed DG, is computed using Equation (11)
R = Δ V Δ I × E T × T O
where, Δ V and Δ I are the change in network voltage and current brought by the installed DG, E T is the rate at which energy is supplied, and T O is the operating period of DG. In this research, the values of E T and T O define to be 0.015 $/kWh and 24 h, respectively.

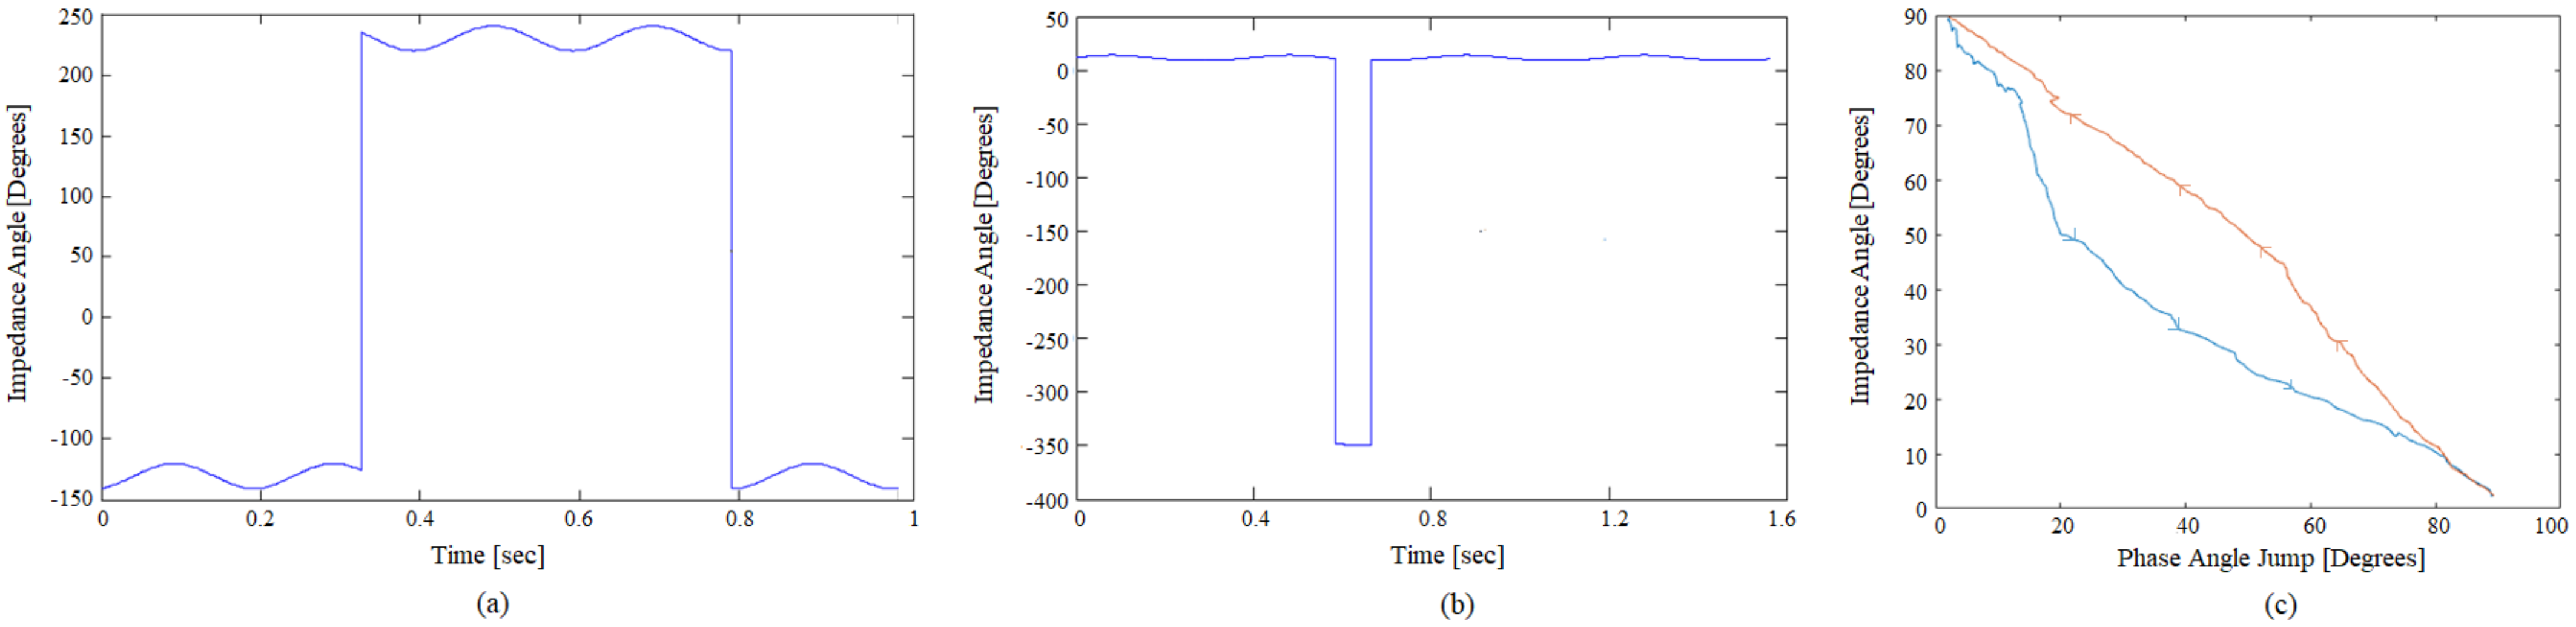
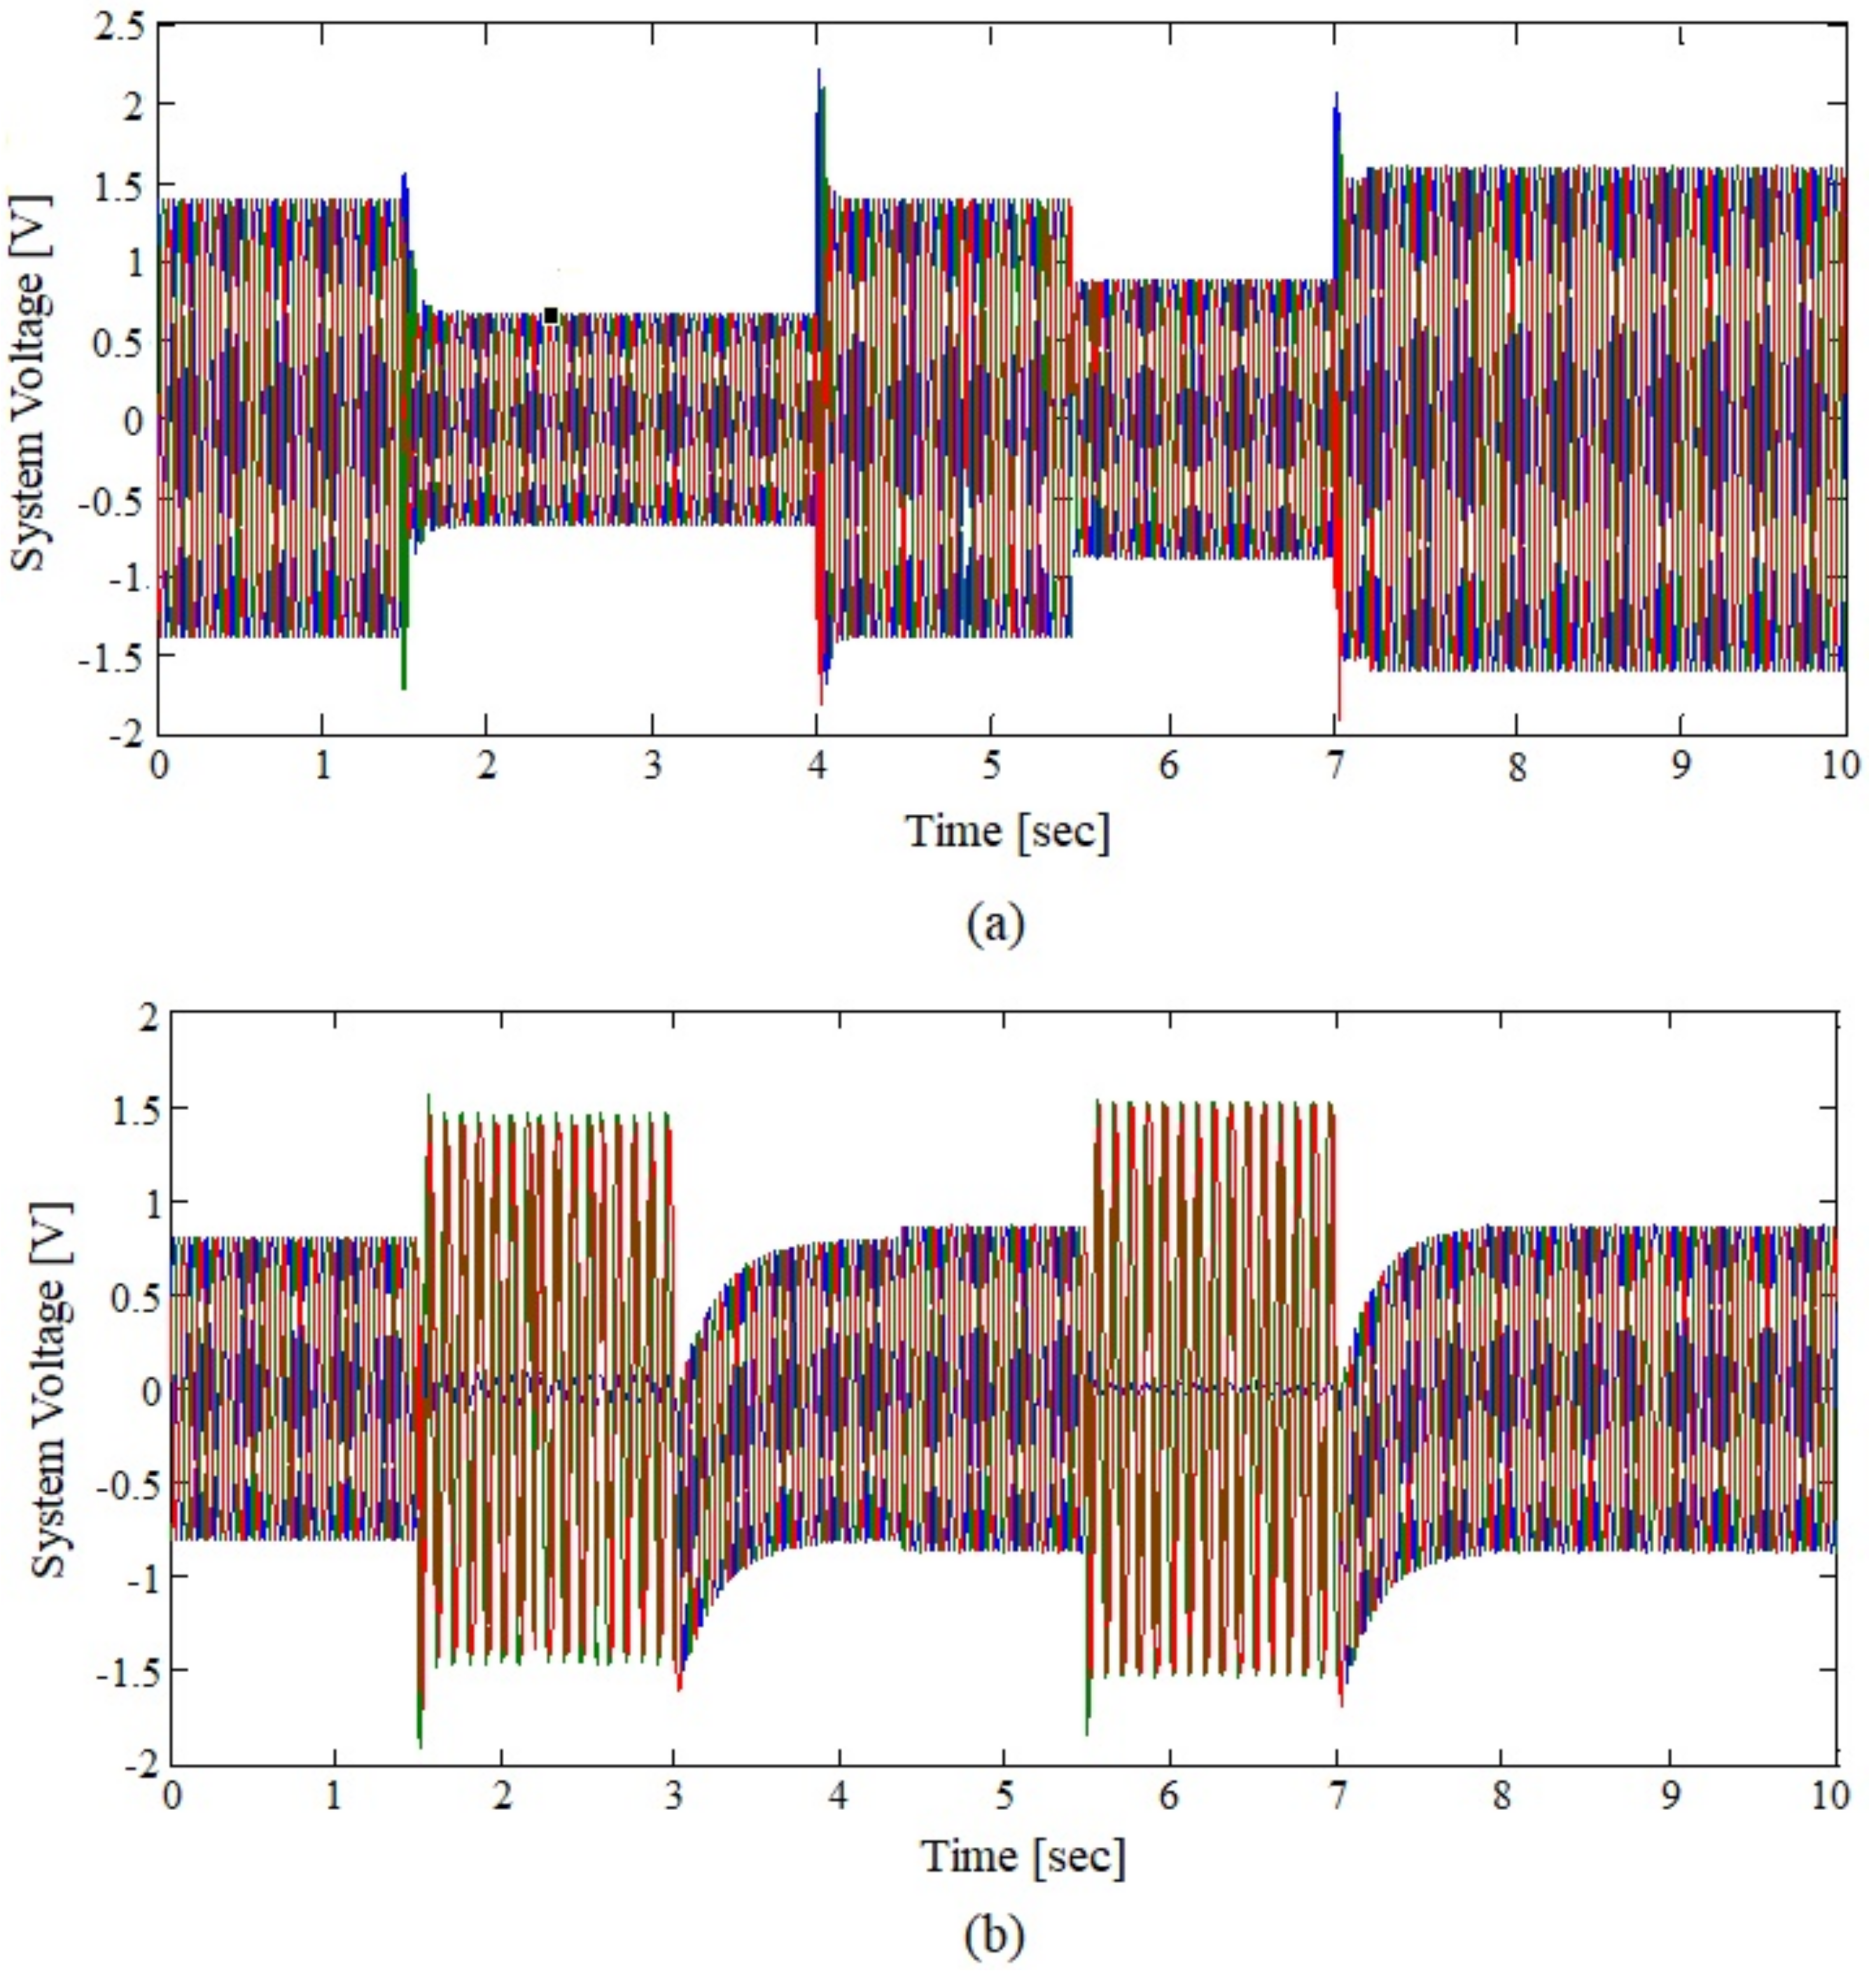
4. Results and Discussion

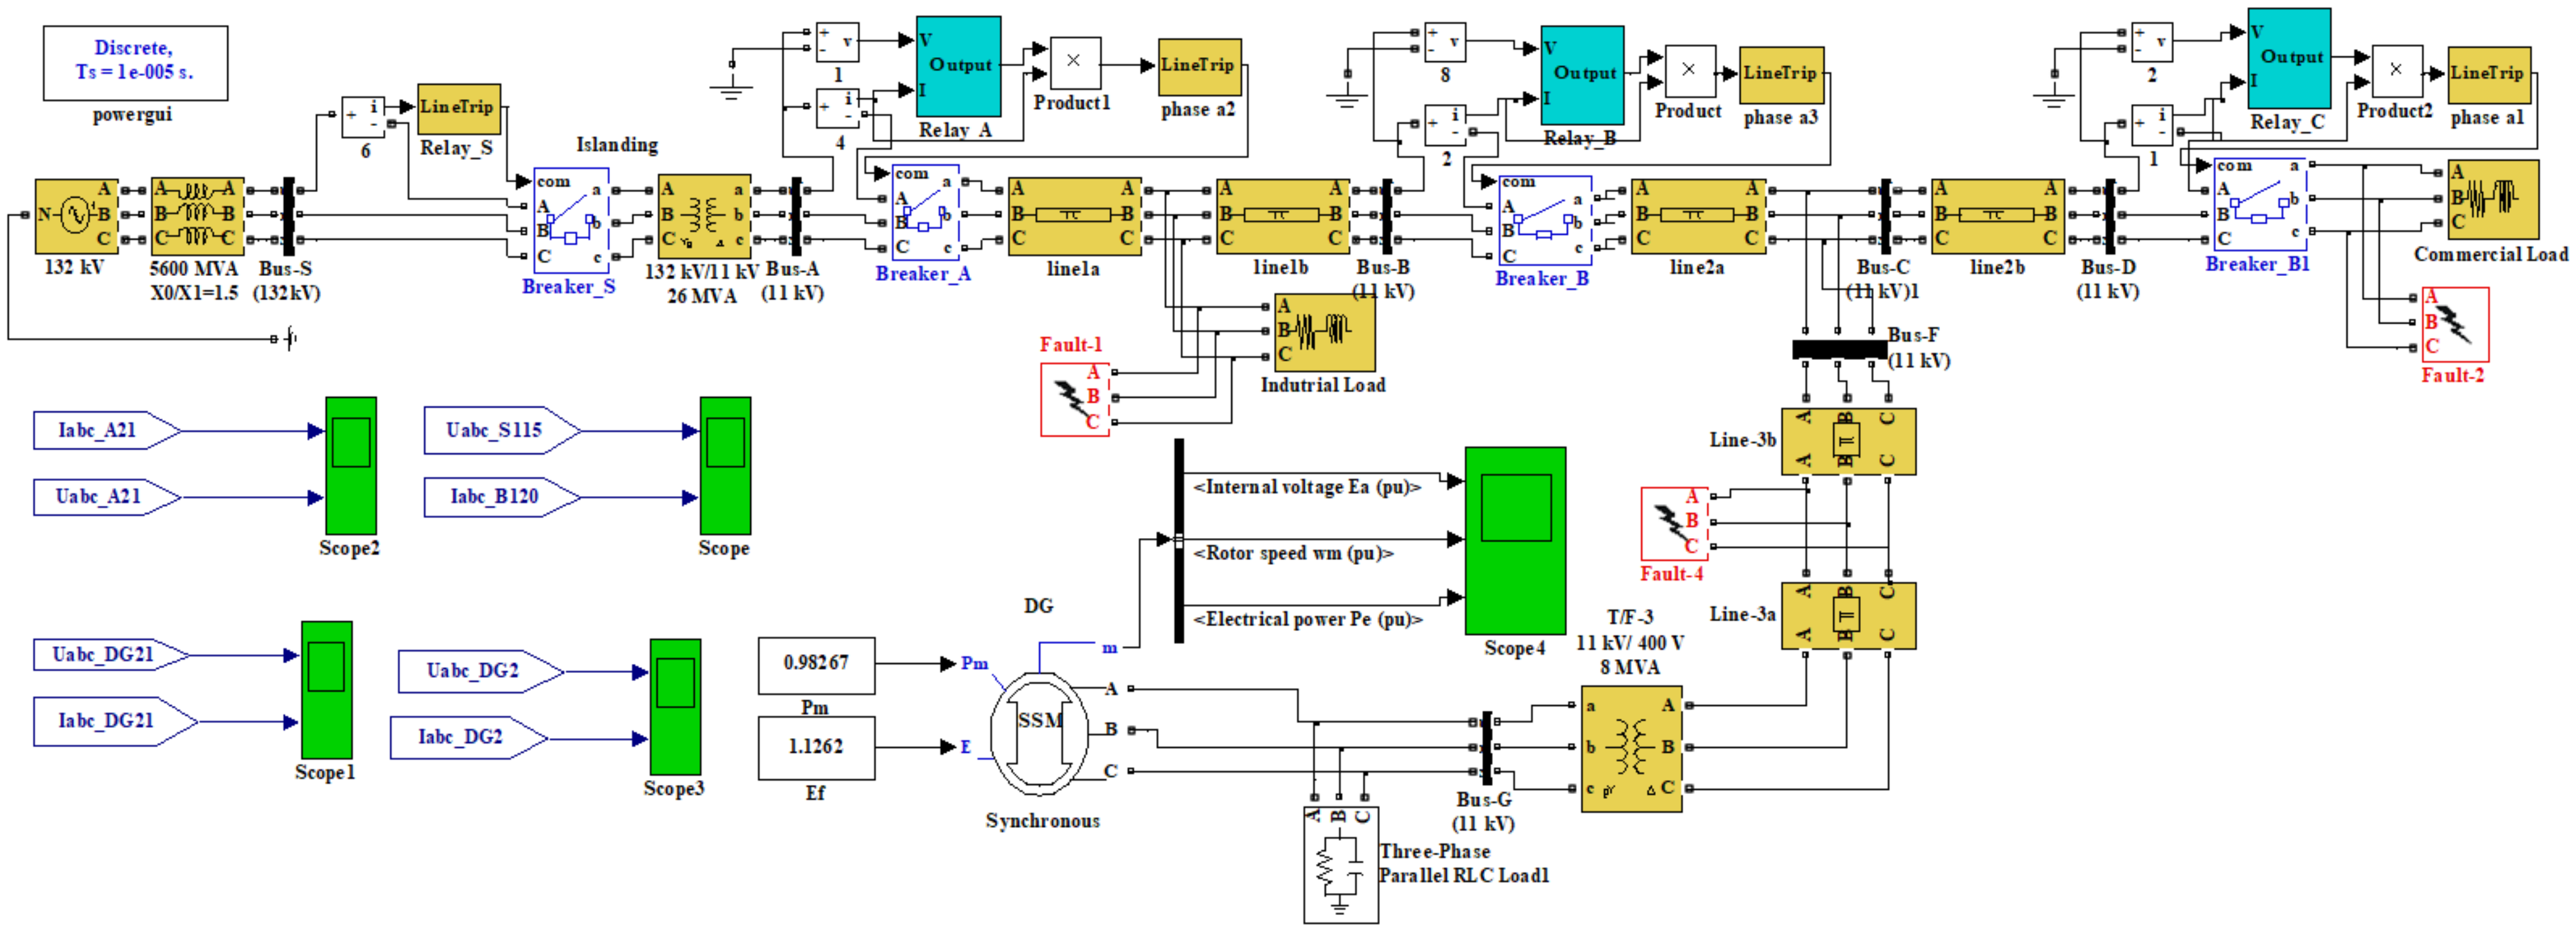
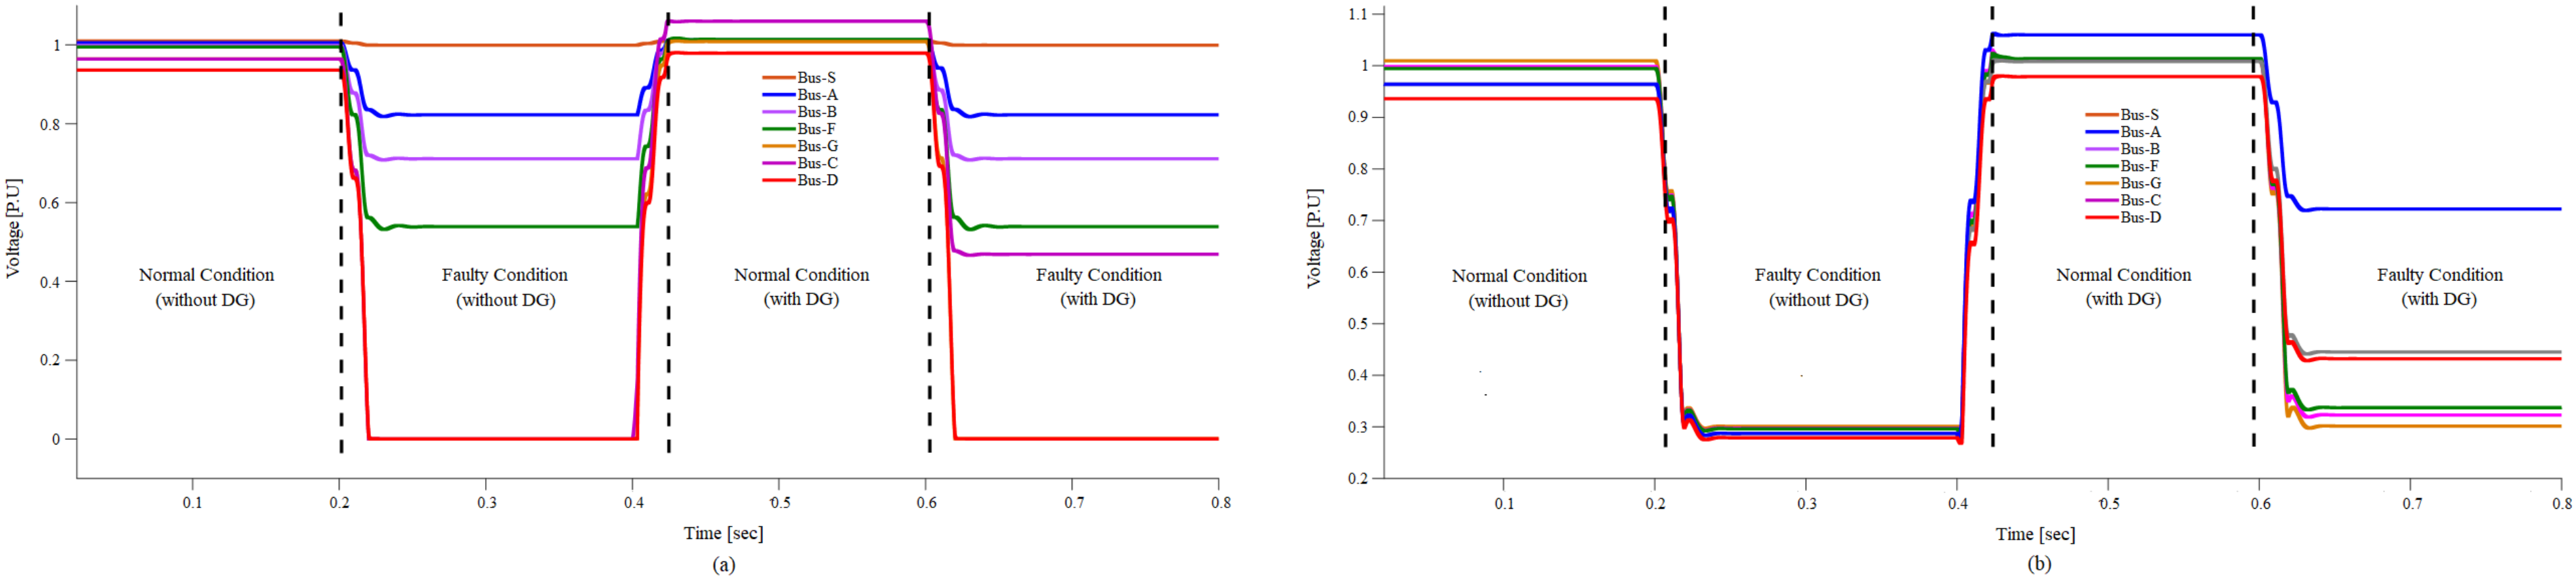
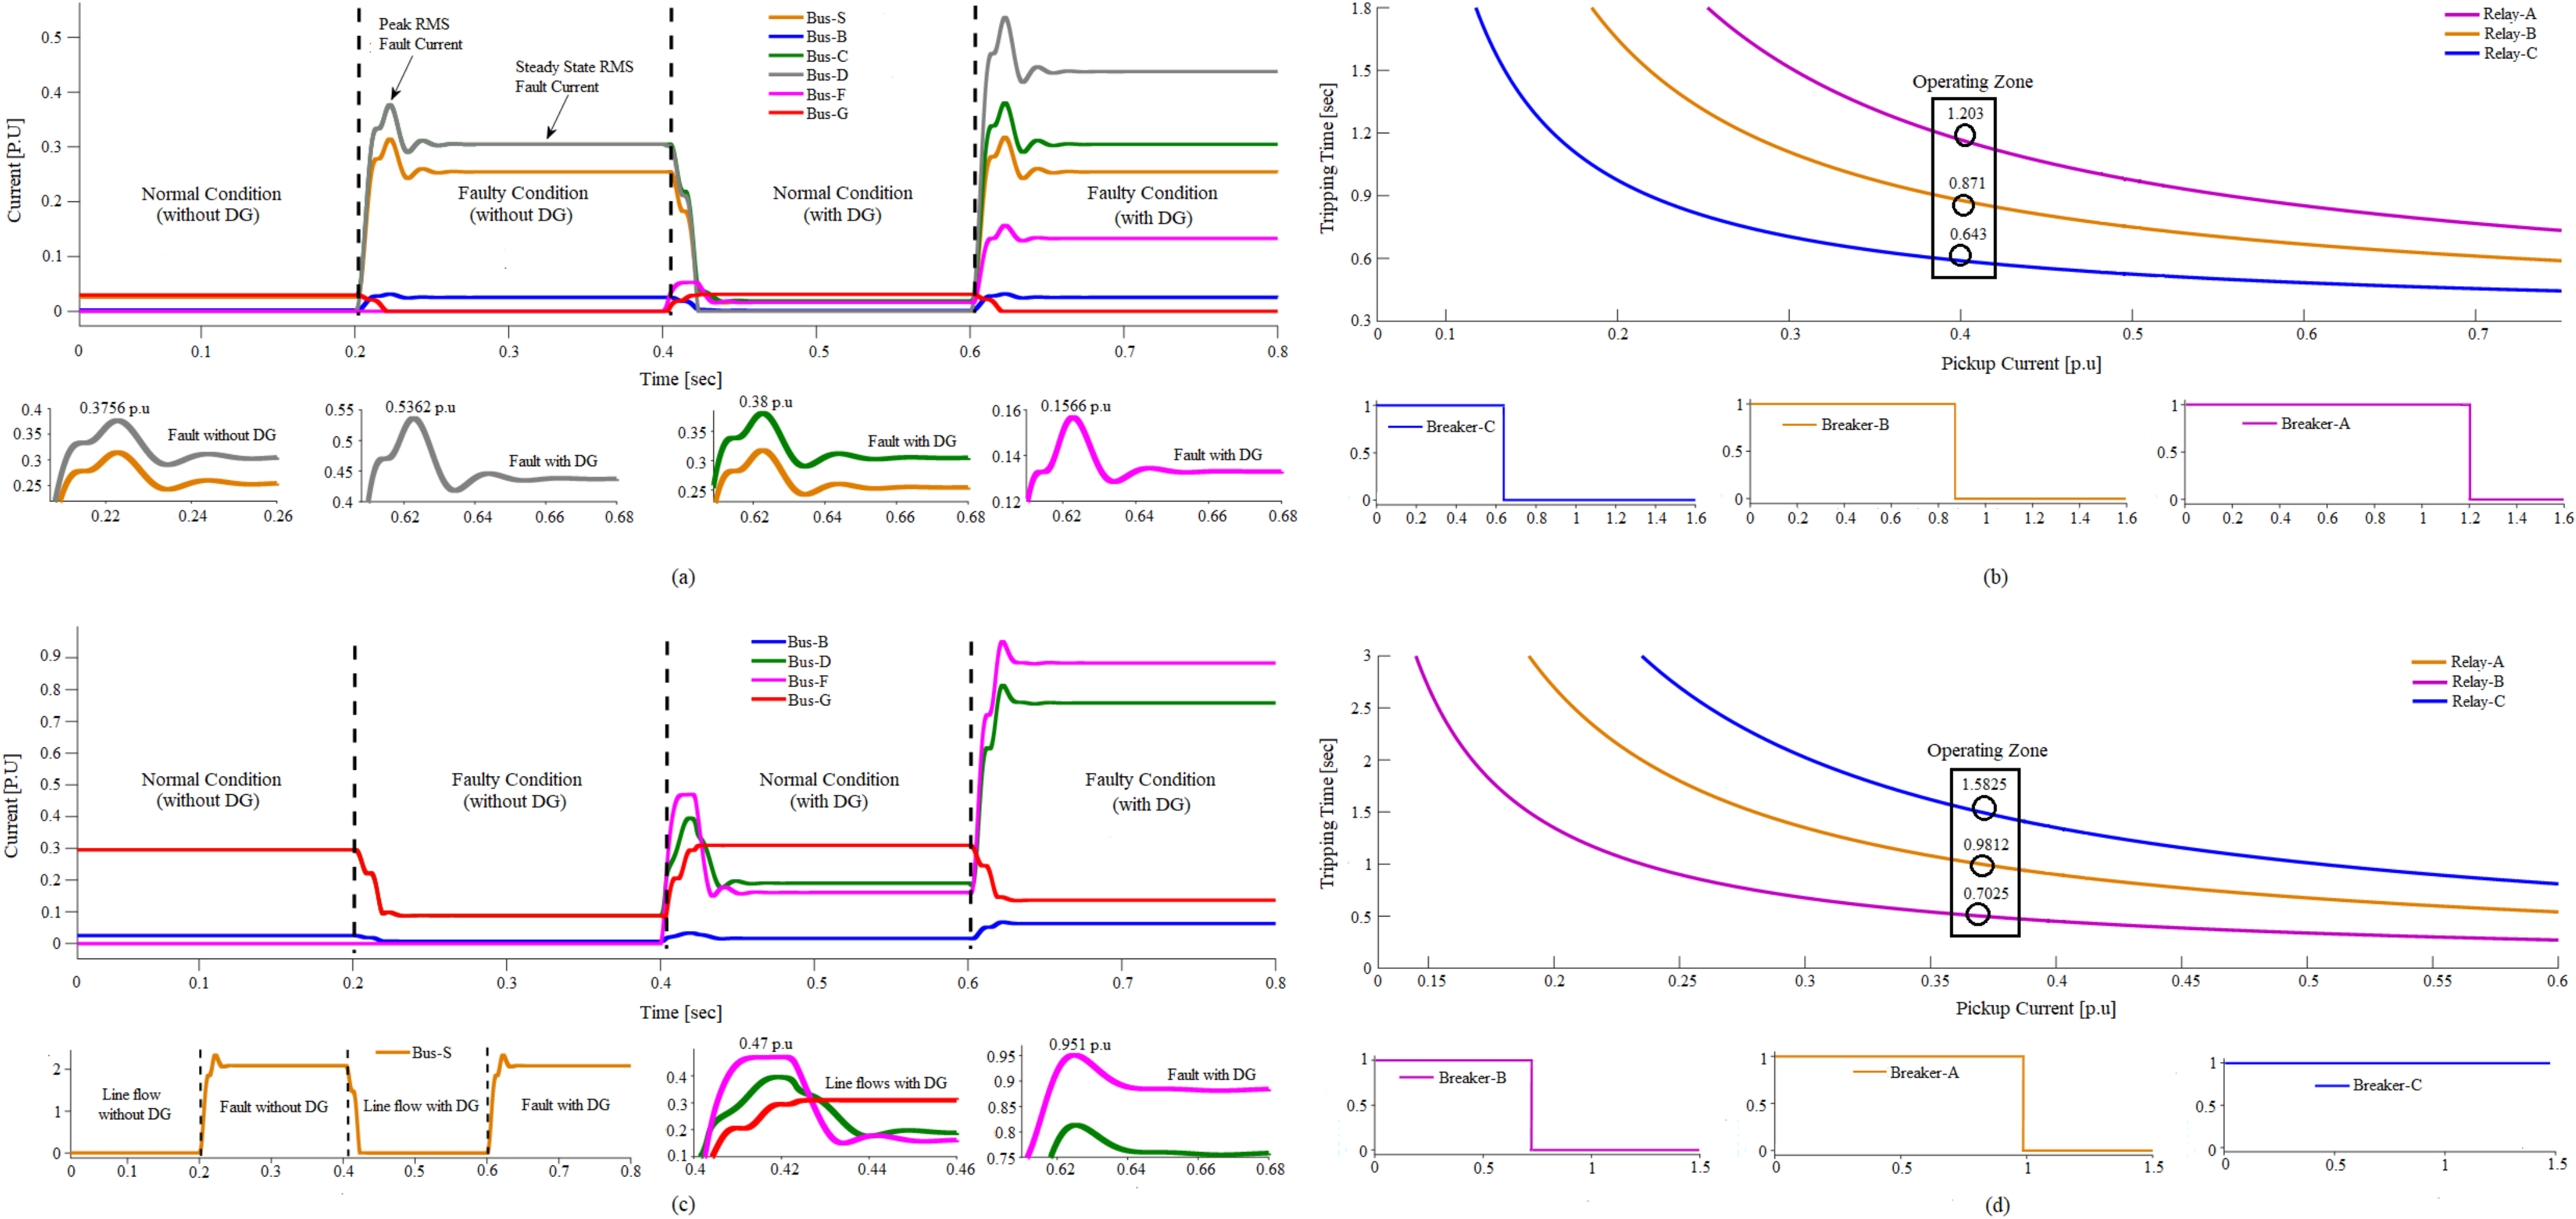
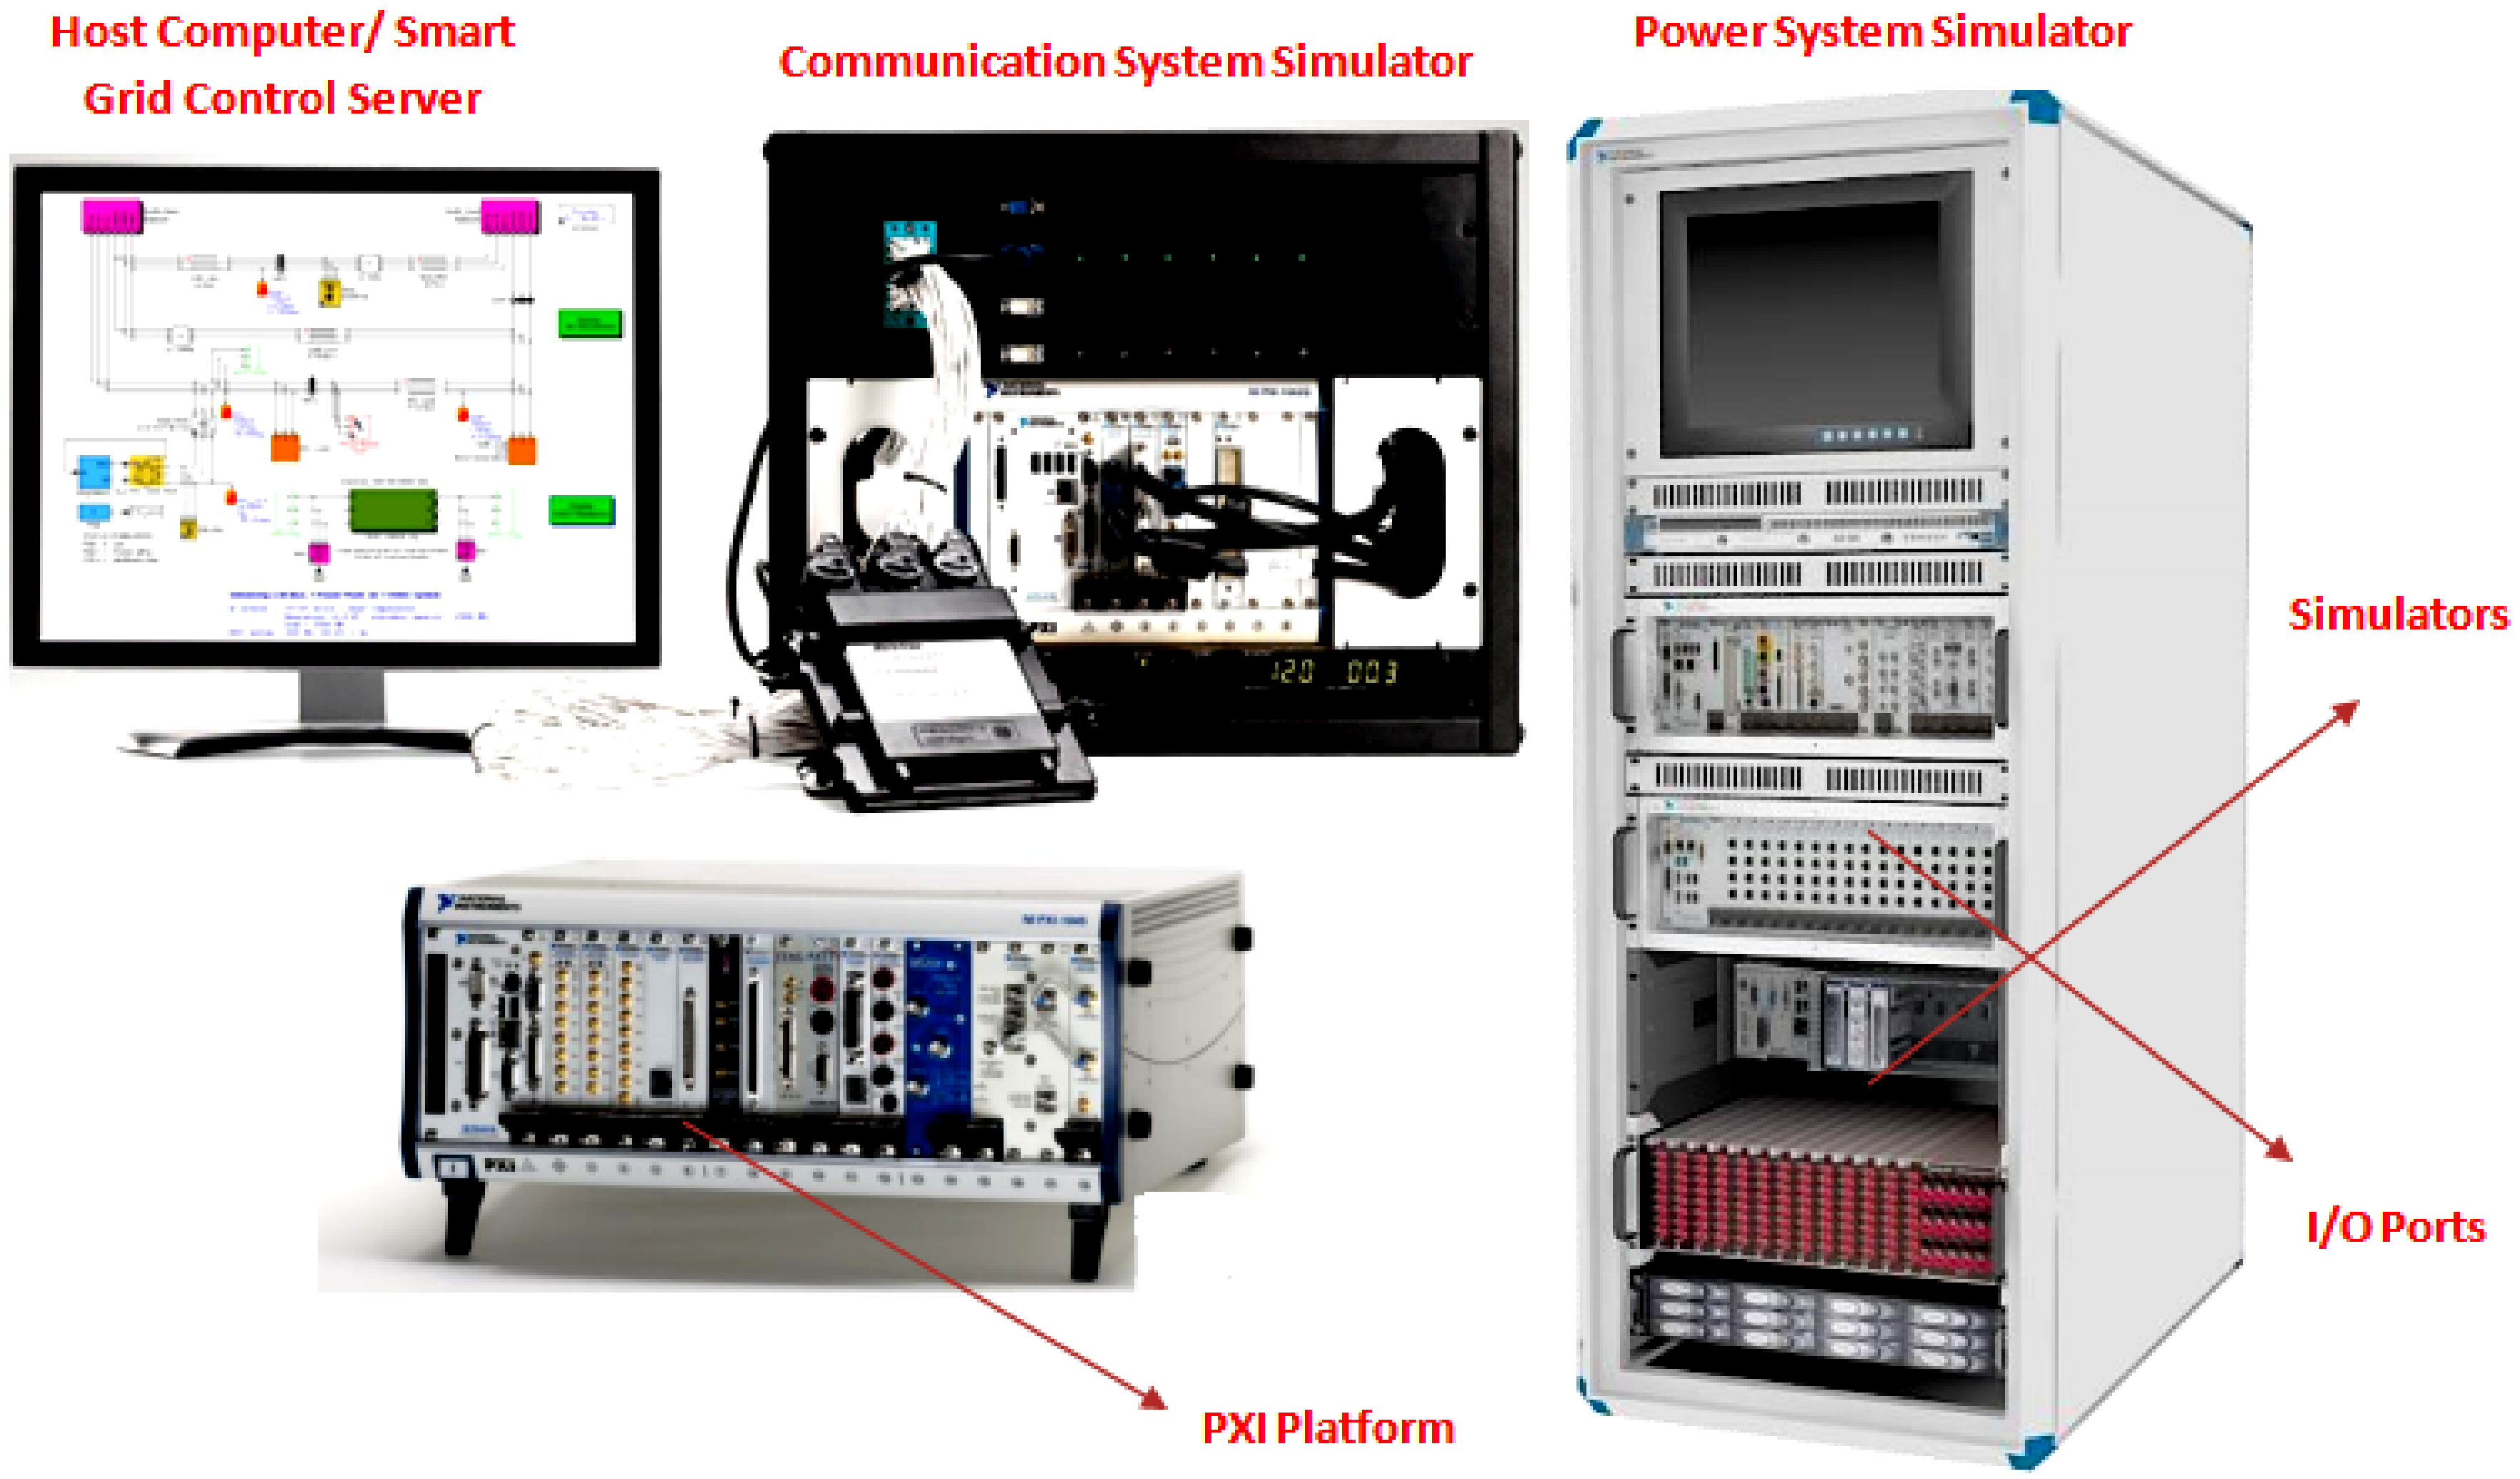
4.1. Simulated Setup

For simulation, the MATLAB 2020b, running on Intel core-i7 system with 16 GB RAM and 1 TB SSD, is exploited to examine and estimate the reliability and feasibility of proposed framework in the virtual environment, before deploying it on the real setup. The Simulink model of test system in Figure 2 is designed in Figure 6 and its different characteristics i.e., voltage profile, short circuit current level, phase angle jump variations and time sequence patterns of relays, under normal and faulty conditions are analyzed at a step size of 20 µs.
Considering the voltage sag, Figure 7 shows the voltage profile of all the system buses under normal and contingency states at different instances. Before fault, the system voltage is at nominal values (1 p . u ) and is within the pre-defined permissible limits ( ± 10 % ) until 0.2 s. After 0.2 s, a three phase (symmetrical) and single line to ground (unsymmetrical) faults are injected into the system at Bus-D and Bus-B in Figure 7a,b, respectively. In the case of three phase fault, the voltages on Bus-C and Bus-D tend to zero due to the existence of short circuit path with negligible fault impedance ( Z f ) while the other buses, especially grid Bus-S, are less effected due to the presence of significant line impedance Z N between its intermediate buses and fault point F2. After 0.4 s, the fault is cleared by the installed relays and network returns to its normal state, with its transient behavior, eventually damped by the characteristics impedance Z R of the network. However, at 0.4 s, a DG is integrated into the system and in its response, the voltages on all the buses have been improved and less sag is observed during the faulty condition as well. Such a scenario is simulated after 0.6 s, with a notable improvement in Bus-C voltage, which was experiencing zero potential during the fault before without DG, in Figure 7a. However, for single phase to ground fault at point F1, the situation is a bit different; being near to the grid its inception impacts almost all the buses uniformly but fortunately less as compared to three phase fault, owing to the fact that the zero sequence impedance of network ( Z N 0 ) contributes significantly to limit the level of fault current I F . Similarly, after installing DG, the network conditions happen to be better not only during the normal but also during faulty states, as shown in Figure 7b.
Notwithstanding, on one hand, the installation of DG helps in diminishing the magnitude of voltage sag caused by the given loading and contingency conditions, but on other hand, it disturbs the optimal coordination among the existing relays if an adaptive direction element is not present, (as proposed in this research). Under the forward fault condition (three phase fault at point F2) in Figure 8a, with its direction determined from the correspondence between the phase angle jump and impedance angle in Figure 9, the current flowing through relay R c is 0.5362 p . u , which is higher than its pickup (activation) value and thus it sends tripping command to its respective breaker-A at 0.65 s for fault isolation. However, if it fails to operate due to rigid contact state or long operational delays, the back-up relays R B and R C , which are also graded on the basis of current magnitude and time duration, sequentially removes the fault at 0.871 s and 1.203 s, respectively, thereby ensuring the standard CTI level among all relays for optimal protection coordination, as shown in Figure 8b. In case of reverse fault (single phase to ground fault at point F1) in Figure 8c, with its direction determined from Figure 9, a current of 0.951 p.u flows through relay R B , being higher than its pickup value it commands its circuit breaker-B to trip at 0.7025 s in order to remove the circulated ground fault but if it fails to do so, the backup relay on grid side, protects the source and isolates the system at 0.9812 s, thus maintaining the predefined coordination constraint. It must be noted that, in this scenario, the relay R C does not operate its breaker-C because the amount of current flowing through it remains out of its activation region till the period of analysis, as shown in Figure 8d.

4.2. Real Time Experiments

For practical evaluation, the designed model is loaded into and run at real-time ( 0.1 ns) onto the PHIL setup as a proof of concept for experimental implementation and deployment, as shown in Figure 10. PHIL is a physical and modular testbed for simulating electrical devices such as generator, communication hub, inverters etc to create different complex industrial scenarios at laboratory level. PHIL setup uses FPGA cores and loops that enable it to execute proposed ideas in real-time similar to dynamic physical environment with equipment under test.
In Figure 10, the power system simulator replicates the functional components and properties of test network in Figure 2. The PXI platform implements the characteristic of DG system, while the grid control server simulates the proposed protection coordination approach (fault direction detection and trip signal generation) and the communication system simulator supports the transmission and exchange of data among all the interfaces in the system. In addition to this, the system uses the Phasor Measurement Units (PMUs) to enumerate the values of voltage, current and phase angle jump, for decision making and taking desired actions accordingly.
For the voltage sag analysis, firstly, a three phase balanced fault is injected into the system near the load center (F2 point), which causes a voltage dip for the duration of fault, as shown in Figure 11a. In Figure 11a, before the fault, the voltage profile of the network is 1.4 V (Line-Line) but it dips down to 0.6564 V during the fault from 1.45 s to 4 s without DG. However, with the DG being integrated into system and fault being re-injected between 5.45 s and 7 s, the voltage during the normal condition becomes 1.55 V (the desired one), and also the voltage dip during the fault now has been improved to 0.8372 V, as illustrated in Figure 11a. Secondly, a single phase to ground fault is introduced into the system near the source (F1 point) and the conditions are obviously different than three phase fault. For the system with unbalanced conditions, the voltage on faulted phase reduces down while on healthy phases it rises up by 3 , as shown in Figure 11b. In Figure 11b, during the normal condition, the voltage profile of the system is 0.8 V (Line-Neural) and during the fault from 1.45 s to 3 s without DG, it drastically reduces to 0.073 on the faulted phase because the network current is routed to ground, causing significant voltage drop. After installing DG into the system and reintroducing fault from 5.45 s to 7 s, the voltage profile however during the normal state has been improved i.e., reaches to 0.88 V but during the faulty condition, the voltage sag on the faulted phase becomes even worst with a magnitude of 0.02338 V due to additional lines flows through ground, as shown in Figure 11b. Unfortunately, the voltage on healthy phases improves further as result of DG installation, which is actually not the desired case. Therefore, during the ground faults, the DGs are not allowed to operate owing to the fact that instead of supporting the system characteristics, it starts to deteriorate the performance of installed equipment.
For the fault analysis, the currents flowing through the relays and tripping status of corresponding breakers are recorded, as shown in Figure 12. The installed relays are graded on the basis of current magnitudes and operating times. For the forward fault direction as determined from the polarity of impedance angle and phase angle jump in Figure 13, the three phase near the load center (F2 point) from 0.3 s to 0.8 s in Figure 12a,b results into fault current of 1.74 A flowing through the relay R C , which is higher than its pick-up value and thus it sends a tripping signal to the respective beaker-C, which opens after 0.25 s, with a reasonable delay of 0.0051 s. However, if the fault still persists in the system, due to either failure of breaker B C or an auxiliary closed path happened to exist, the relay R B operates its corresponding circuit breaker-B after 0.5305 s, followed by R A after 0.9062 s eventually, thus maintaining the standard CTI value among them, as shown in Figure 12b and detailed in Table 1. However, with the reverse current flow for single phase to ground faultnear the source (F1 point) from 0.3 s to 0.8 s, determined from the information of impedance angle and phase angle jump of the system in Figure 13, the magnitude of current flowing through all the relays is shown in Figure 12c. For this scenario, the relay R C does not operate because the current flowing through it is less than its pickup value, as presented in Table 1, where the negative timing indicates the absolute closure of breaker C irrespective of the fault duration. Hence, the relay R B sends tripping signal to breaker-B after 0.5776 s and if it fails to isolate the fault, the back up relay R A shuts the current flow at 0.9579 s, thereby maintaining standard CTI, as shown in Figure 12d.

5. Comparative Analysis

To examine and validate the performance and potential of proposed protection coordination scheme, it is compared with other three standard methods in Table 2. This case study is carried out for balanced three phase and single phase to ground faults at points F2 and F1 respectively in Figure 2. The technique in [17] determines the direction of line flows using the polarity of fault current. The approach is however fast, consumes less computational resources and also localizes immediately the fault but has higher mitigation uncertainty, moderate fault clearance delay and has not been tested explicitly on field setup. Moreover, the approach proposed in [18] is, however, robust against mitigation uncertainty and nature of fault but consumes more CPU power and has higher delay in localizing and clearing the fault as compared to [17], and also it was tested only in simulated environment. Further, the method discussed in [19] is efficient and effective in terms of fault localization and clearance but suffers from moderate computational burden and mitigation uncertainty as compared to [17,18]. This method has been only tested on virtual setup with asymmetrical faults. In contrast to all, our proposed approach provides a good comprise for all the considered metrics. It is not only swift in localizing and removing the contingencies but also has least mitigation uncertainty and has been tested practically using PHIL setup for symmetrical as well as asymmetrical faults. Although, the proposed approach is a bit computationally inefficient mainly due to continuous monitoring and update of impedance angle and phase angle jump values for state estimation of system. Moreover, the proposed approach can be easily deployed into active distribution networks using NVIDIA Jetson Nano [27] and selector switch [28] for distributed control and coordination. The NVIDIA Jetson Nano uses on-board 2 GB GPU and quad-core CPU for local processing and decision making on direction estimation. It generates tripping signal for deployed selector switches to disconnect respective sections according. The combination of NVIDIA Jetson Nano and selector switch is not only economical and effective solution but is flexible and robust in dealing with large number of DG sources under distinct network conditions.

6. Conclusions

This research proposed the novel protection coordination scheme exploiting phase angle jump information, from voltage sag profile, to maintain desired security and safety of the system against distinct contingencies with and without the presence of intermittent source (DG). At first, the voltage sag profile of the system was analyzed under different faulty conditions, to better understand the variations in phase angle jump associated with respective voltage sag scenario. Later, the standard design of digital over-current relay was modified and a directional element was introduced on the basis of trend of phase angle jump together with the polarity of impedance angle to distinguish between the upstream and downstream flows. Further, as a basis for classic protection coordination problem, the objective function was defined using the operating times of primary and back relays with the given number of fault points, which was subjected to different constraints, for maintaining the desired coordination among relays for robust and adaptive fault detection and isolation.
The proposed approach initially was tested in simulated environment, and afterwards, as a proof of concept, on the laboratory setup for different faults having distinct location and duration with and without DG being installed. It was found that, no matter how the network condition changes with the possible influence of external disturbances, the designed protection scheme maintained the standard CTI level among all the relays which were graded on the basis of operating times and currents and thus ensured optimal coordination and response among all relays for distinct faults.
The possible extension to current research, is to employ Markov decision process to learn from the network conditions on run-time and make decisions accordingly for optimal relay settings instead of manual tuning. Further, the current approach can be evaluated on mesh networks with possible changes in its estimation part on phase angle jump and impedance angle using a pre-trained unified deep neural network with the aim of transfer learning.

Author Contributions

The major contributions of all the authors are summarized as: conceptualization—S.K.; methodology—S.K. and M.F.S.; software—S.K. and M.F.S.; validation—S.K., M.F.S., S.S., A.M. and Z.H.K.; formal analysis—S.K., A.M. and V.B.; investigation—S.K. and L.S.; resources—Z.H.K. and L.Z.; data curation—Z.H.K. and M.A.S.; writing—original draft preparation—S.K., L.S., S.S.; writing—review and editing—L.Z. and M.A.S.; visualization—Z.H.K.; supervision—L.S. and L.Z.; project administration—L.Z.; funding acquisition—L.Z. All authors have read and agreed to the published version of the manuscript.

Funding

This research received no external funding.

Acknowledgments

The authors are thankful to Sukkur IBA University, Pakistan for providing state of art facilities to conduct this research. Additionally, the first author is also grateful to Jan Izykowski from Wroclaw University of Science and Technology, Poland for his guidance and support during the master studies.

Conflicts of Interest

The authors declare no conflict of interest.

References

  1. Ukil, A.; Živanović, R. Abrupt change detection in power system fault analysis using adaptive whitening filter and wavelet transform. Electr. Power Syst. Res. 2006, 76, 815–823. [Google Scholar] [CrossRef] [Green Version]
  2. Katyara, S.; Hashmani, A.; Chowdhary, B.S.; Musavi, H.A.; Aleem, A.; Chachar, F.A.; Shah, M.A. Wireless Networks for Voltage Stability Analysis and Anti-islanding Protection of Smart Grid System. Wirel. Pers. Commun. 2021, 116, 1361–1378. [Google Scholar] [CrossRef]
  3. Juan, Y.; Ming, S.; Bo, D. Research about impact of DGs in distribution networks. In Proceedings of the 2008 IEEE China International Conference on Electricity Distribution, Guangzhou, China, 10–13 December 2008; pp. 1–6. [Google Scholar]
  4. Katyara, S.; Staszewski, L.; Leonowicz, Z. Protection coordination of properly sized and placed distributed generations—Methods, applications and future scope. Energies 2018, 11, 2672. [Google Scholar] [CrossRef] [Green Version]
  5. Łukasz, H.; Zeineldin, H.H. Planning the coordination of directional overcurrent relays for distribution systems considering DG. IEEE Trans. Smart Grid 2016, 7, 1642–1649. [Google Scholar]
  6. Gomez, J.C.; Morcos, M.M. Voltage sag mitigation using overcurrent protection devices. Electr. Power Components Syst. 2001, 29, 71–81. [Google Scholar]
  7. Chen, L.; Zhang, Q.; Wang, H.; Ma, R.; Wang, W.; Xu, H. Voltage sag assessment considering time characteristic of distance protection in meshed network. In Proceedings of the Transmission and Distribution Conference and Exposition-Latin America (PES T&D-LA), Morelia, Mexico, 20–24 September 2016; pp. 1–5. [Google Scholar]
  8. Katyara, S.; Shaikh, M.F.; Shaikh, S.; Khand, Z.H.; Staszewski, L.; Bhan, V.; Majeed, A.; Shah, M.A.; Zbigniew, L. Leveraging a Genetic Algorithm for the Optimal Placement of Distributed Generation and the Need for Energy Management Strategies Using a Fuzzy Inference System. Electronics 2021, 10, 172. [Google Scholar] [CrossRef]
  9. Jennet, K.I.; Booth, C.D.; Coffele, F.; Roscoe, A.J. Investigation of the sympathetic tripping problem in power systems with large penetrations of distributed generation. IET Gen. Transm. Distrib. 2015, 9, 379–385. [Google Scholar] [CrossRef] [Green Version]
  10. Anthony, M.A.; Anthony, M. Electric Power System Protection and Coordination: A Design Handbook for Overcurrent Protection; McGraw-Hill Companies: New York, NY, USA, 1995. [Google Scholar]
  11. Katyara, S.; Staszewski, L.; Musavi, H.A.; Soomro, F. Short Circuit Capacity: A Key to Design Reliable Protection Scheme for Power System with Distributed Generation. Int. J. Mech. Eng. Robot. Res. 2017, 6. [Google Scholar] [CrossRef]
  12. Horak, J. Directional overcurrent relaying (67) concepts. In Proceedings of the 59th Annual Conference for Protective Relay Engineers, College Station, TX, USA, 4–6 April 2006; p. 13. [Google Scholar]
  13. Srivastava, A.; Tripathi, J.M.; Mohanty, S.R.; Panda, B. Optimal over-current relay coordination with distributed generation using hybrid particle swarm optimization-gravitational search algorithm. Electr. Power Components Syst. 2016, 44, 506–517. [Google Scholar] [CrossRef]
  14. Yousaf, M.; Mahmood, T. Protection coordination for a distribution system in the presence of distributed generation. Turk. J. Electr. Eng. Comput. Sci. 2017, 25, 408–421. [Google Scholar] [CrossRef]
  15. Katyara, S.; Akhtar, F.; Solanki, S.; Leonowicz, Z.; Staszewski, L. Adaptive fault classification approach using digitized fuzzy logic (dfl) based on sequence components. In Proceedings of the 2018 IEEE International Conference on Environment and Electrical Engineering and 2018 IEEE Industrial and Commercial Power Systems Europe (EEEIC/I&CPS Europe), Palermo, Italy, 12–15 June 2018; pp. 1–7. [Google Scholar]
  16. Viawan, F.A.; Reza, M. The impact of synchronous distributed generation on voltage dip and overcurrent protection coordination. In Proceedings of the 2005 International Conference on Future Power Systems, Amsterdam, The Netherlands, 18 November 2005; p. 6. [Google Scholar]
  17. Dewadasa, M.; Ghosh, A.; Ledwich, G. Protection of distributed generation connected networks with coordination of overcurrent relays. In Proceedings of the 37th IEEE Annual Conference of the IEEE Industrial Electronics Society (IECON), Melbourne, VIC, Australia, 7–10 November 2011; pp. 924–929. [Google Scholar]
  18. Sharaf, H.M.; Zeineldin, H.H.; Ibrahim, D.K.; El Zahab, E.E.D.A. Protection coordination of directional overcurrent relays considering fault current direction. In Proceedings of the 5th IEEE PES Innovative Smart Grid Technologies Europe (ISGT Europe), Istanbul, Turkey, 12–15 October 2014; pp. 12–15. [Google Scholar]
  19. Gomez, J.C.; Morcos, M.M. Coordination of voltage sag and overcurrent protection in DG systems. IEEE Trans. Power Deliv. 2005, 20, 214–218. [Google Scholar] [CrossRef]
  20. Chawla, A.; Bhalija, B.R.; Panigarhi, B.K.; Singh, M. Gravitational Search Based Algorithm for Optimal Coordination of Directional Overcurrent Relays Using User Defined Characteristic. Electr. Power Components Syst. 2018, 46, 43–55. [Google Scholar] [CrossRef]
  21. Ghotbi-Maleki, M.; Chabanloo, R.M.; Zeineldin, H.H.; Miangafsheh, S.M.H. Design of Setting Group-Based Overcurrent Protection Scheme for Active Distribution Networks Using MILP. IEEE Trans. Smart Grid 2020, 12, 1185–1193. [Google Scholar] [CrossRef]
  22. Yazdaninejadi, A.; Nazarpour, D.; Talavat, V. Fast Protection Scheme for Active Distribution Networks: Breaking Chains by Utilizing Auxiliary Relays. J. Mod. Power Syst. Clean Energy 2020, 8, 540–548. [Google Scholar] [CrossRef]
  23. Zarei, S.F.; Khankalantary, S. Protection of active distribution networks with conventional and inverter-based distributed generators. Int. J. Electr. Power Energy Syst. 2021, 129, 106746. [Google Scholar] [CrossRef]
  24. Wang, Y.; Bollen, M.H.J.; Xiao, X.-Y. Calculation of the phase-angle-jump for voltage dips in three-phase systems. IEEE Trans. Power Deliv. 2015, 30, 480–487. [Google Scholar] [CrossRef]
  25. Shaikh, M.F.; Shah, M.A.; Katyara, S.; Chowdhry, B.S. Estimation of Phase Angle Jump (PAJ) for Different Types of Faults and Unbalancing in Distribution System. Int. J. Eng. Technol. 2018, 7, 23–29. [Google Scholar] [CrossRef] [Green Version]
  26. Rebizant, W.; Szafran, J.; Wiszniewski, A. Digital Signal Processing in Power System Protection and Control; Springer Science & Business Media: Berlin/Heidelberg, Germany, 2011. [Google Scholar]
  27. Jetson Nano Developer Kit. Available online: https://developer.nvidia.com/embedded/jetson-nano-developer-kit (accessed on 8 August 2021).
  28. Ledex Relay Selector Switch 28V PN 172964-001. Available online: https://flyingcolorsairparts.com/27362 (accessed on 8 August 2021).
Figure 1. Power system architecture employing distributed generation with effective protection scheme against upstream and downstream faults. Time coordination among relays (blue, green and red) with dedicated protection zones is shown by associated characteristics curves providing primary and backup functionalities.
Electronics 10 02312 g001
Figure 2. Single line diagram of test system under investigation.
Electronics 10 02312 g002
Figure 3. Equivalent per phase circuit of test system.
Electronics 10 02312 g003
Figure 4. Conceptual diagram of digital directional over-current relay.
Electronics 10 02312 g004
Figure 5. Phasor representation on estimating the direction of fault current, (a) normal operation of system, (b) forward flow of current with respect to fault location, (c) reverse current flow with respect to location of fault.
Electronics 10 02312 g005
Figure 6. Simulink model of test system for investigating voltage sag and protection coordination. A synchronous DG is integrated into system and all the measurement are taken at the point of common coupling. An auxiliary load also is connected in parallel to DG system to avoid its unloaded operation due to the fact that it may overshoot and damage its armature.
Electronics 10 02312 g006
Figure 7. Voltage profile of the simulated system with and without DG under normal and faulty conditions, (a) three phase fault (symmetrical) at point F2 (forward), (b) single phase fault (unsymmetrical) at point F1 (reverse).
Electronics 10 02312 g007
Figure 8. Current profile of the system for distinct network conditions and the coordination status of relay-breaker pair for upstream and downstream faults, (a,c) line flows under normal and fault conditions (for three phase and single phase to ground faults respectively) with and without DG being integrated, (b,d) inverse-time characteristics and tripping sequence of installed relay-breaker system for protection coordination against three phase and single phase to ground faults, respectively.
Electronics 10 02312 g008
Figure 9. Estimation of fault current direction as a function of impedance angle and phase angle jump of the system. Dynamic region represents the instant of fault inception with the formation of short circuit path while the highly non–linear region corresponds to momentary variations into network impedance which becomes linear eventually.
Electronics 10 02312 g009
Figure 10. PHIL system architecture on real-time evaluation of proposed protection coordination approach in smart grid system.
Electronics 10 02312 g010
Figure 11. Voltage profile with and without DG under normal and faulty scenarios, (a) three phase (symmetrical) fault at F2 (forward) and (b) single phase to ground (asymmetrical) fault at F1 (reverse).
Electronics 10 02312 g011
Figure 12. Relay current and breaker status under normal and faulty conditions, (a,c) magnitude of currents flowing through all the installed relays during normal and three phase (symmetrical) and single phase to ground (asymmetrical) faults, respectively, (b,d) tripping status of corresponding breakers during normal and three phase (symmetrical) and single phase to ground (asymmetrical) faults, respectively.
Electronics 10 02312 g012
Figure 13. Magnitude of impedance angle as a function of time and phase angle jump during different fault conditions, (a) positive impedance angle for forward fault, (b) negative impedance angle for reverse fault, (c) ascending impedance angle and retarding phase jump exhibit forward current direction and descending impedance angle and progressing phase angle jump indicate reverse current flow.
Electronics 10 02312 g013
Table 1. Operating characteristics of relays for forward and reverse faults.
FaultRelay ( I O ) ( I sc ) ( T op ) TMS
R A 0.03440.08840.90620.125
Forward R B 0.24170.890.53050.1
R C 0.21541.740.24490.075
R A 0.03440.0840.95790.125
Reverse R B 0.24170.7870.57760.1
R C 0.21540.082−0.54370.075
Table 2. Comparative analysis of proposed coordination scheme with other state of art techniques.
TechniqueFault Localization (Cycles)Fault Clearance (s)Type of FaultsMitigation Uncertainty (%)Practical TestsComputational Burden (s)
Current Polarity [17]0.750.03241S13.15NO9.24
Polarizing Voltage [18]1.250.04117S & AS10.34NO13.18
RF Curve [19]1.150.01675AS11.65NO10.32
Proposed Approach0.850.02145S & AS9.36YES12.38
S & AS—Symmetrical and Asymmetrical; RF—Recloser-Fuse combination; Fault Localization (cycles)—periodic delay in detecting contingency conditions in the system voltage profile; Fault Clearance (s)—the instant the tripping command is generated and the fault is removed or faulty circuit is isolated; Type of Faults—Nature and severity of contingency altering system characteristics; Mitigation Uncertainty (%)—degree of sensitivity in mis-classifying the overload conditions into temporary faults; Practical Test—real-time experimental evaluation and ease of implementation; Computational Burden (s)—CPU processing time required to reach the desired goal.
Publisher’s Note: MDPI stays neutral with regard to jurisdictional claims in published maps and institutional affiliations.

