Abstract
Presently, for the purpose of sustainable growth of the economy, it is a common choice to promote sectors’ digital transformation (DT). However, to credibly monitor the effect of DT on sectoral development, it is necessary to develop a systematic measure for the monitoring sector’s DT. This study provides a monitoring index system for sectors’ DT. First, an assessment framework for enterprises’ DT is introduced, which laid a foundation for the proposed monitoring index system for sectors’ DT. Secondly, a monitoring index system for sectors’ DT is established, which includes 13 monitoring indexes from four aspects, namely transformation stages, single-domain digitalization, integration and interconnection, and collaboration, interaction and mode innovation. A weighted method of interval hesitant fuzzy entropy is also given here. Finally, a panorama of sectors’ DT in China is derived by applying the proposed monitoring index system, and a prediction that the level of sectors’ DT in China will continue to grow in the next three years is made by gray predication.
1. Introduction
Over the past decade, big data, the Internet of Things, artificial intelligence, and other information and communication technologies (ICTs) have developed rapidly and penetrated into traditional industries quickly, causing a systematic and holistic industry innovation and technology revolution. Being data-driven is the key characteristic. Moreover, the economic development mode is transforming from material-dominated production to information-dominated production. Digital transformation (DT) has become the focus of all enterprises. Enterprises in China use DT to enhance corporate competitiveness and seek a comprehensive DT during these years. According to a survey, DT has been adopted as the core strategy in over 70% of China’s top 1000 enterprises in 2018, and 65% of China’s GDP will be related to data resource by 2022 [1]. In the context of the industrial revolution, sectors’ DT has been recognized worldwide as a necessary way to achieve economic innovation and development [2].
The core of DT is the application of ICTs, and the overall digitalization and cross-links of the value creation processes. From the perspective of enterprises, these changes brought by a successful DT can be realized only if it is implemented in their strategy level [3,4]. DT implies new ways of combining various products and services [5], and stimulates the emergency of new business modes such as digital platforms [6]. Enterprises expect major long-term gains in efficiency and productivity by applying DT [7]. Kohli et al. [8] examined seven dimensions of an adapted theoretical framework, including initiation, development, implementation, exploitation, the role of the external competitive environment, the role of internal organizational environment, and outcomes of product, service, and process, and suggested several areas of future research.
From the perspective of sectors, DT lies not only in the gains in efficiency and productivity, but also the degree of popularization and promotion of DT in the sector, as well as the formation of the sector ecology and the common prosperity of the sector chain. Some government departments, institutions, and scholars conducted research on the sectors’ DT. The development research center of the state council of the People’s Republic of China (PRC) [9] put forward a set of digitalized system architecture, which can cover agriculture, industry, and service sectors involving a digital layer, platform layer, and physical layer. Digital development is a strategic choice to build a new competitive advantage for the country in the digital age. They formulate national strategies, plans, and policies to support the DT and upgrading of sectors The “OECD Digital Economy Outlook 2015” report shows that 80% of OECD member countries have formulated national strategies or departmental policies, established the system of national strategies related to DT by 2015 [10]. The White House of the United States released a digital strategy plan and deployed a series of related supporting measures to accelerate the implementation of its digital strategy [3]. The UK digital strategy issued by the government takes connectivity, skills and inclusiveness, digital sector, macro-economy, cyber space, digital governance, and data economy as main strategic tasks [11,12]. Germany initiated “Industry 4.0”, which takes “cyber-physical systems” (CPS) as the core and promotes the in-depth application of ICTs in industries to realize seamless data transmission, accurate control of equipment, and intelligent interactions among production processes [13].
However, compared to enterprises’ DT, the sectors’ DT is a more complex system in terms of engineering, which involves promotion and application of technology innovation, management optimization, organizational change, data mining, use, etc. in the entire sector. Meanwhile, in this long-term process, we should track the development of the sectors, monitor the risk of this process transformation, and ensure the effectiveness of the transformation.
How to carry out DT at the sector level is the key. Unified and systematic methods for evaluating the effects of sectors’ DT have not yet been formed. It is necessary to establish a set of universal indexes that quantify the level and effect of sectors’ DT to guide various sectors to carry out DT scientifically and effectively.
In addition to the previous research work, there are still some problems to be addressed:
(1) A universal index system that quantify the level and effect of DT of various sectors is still needed to be investigated.
(2) Application of the universal index system whether objectively reflect the level and effectiveness of sectors’ DT of a country still needs to be proved by practice.
To answer these questions, we put forward a monitoring index system for sectors’ DT based on previous theoretical research and industrial practices [14]. Based on data from a large number of enterprises in China, we organized an overall statistical analysis to quantitatively monitor the development level and effects of sectors’ DT in China. With the monitoring index system the status of sectors’ DT in China was determined, characteristics of that was analyzed, and the priorities and path were clarified.
The remaining parts of this study are as follows: Section 2 is the overview of previous relevant research on DT, as well as different approaches in assessment for DT. Section 3 gives an assessment framework for enterprise’ DT. On this basis, Section 4 proposes a monitoring index system from the perspective of sectors, design a set of monitoring indexes as well as their weight and calculation methods. Section 5 shows the status and analysis of sectors’ DT in China by applying the monitoring index system. Section 6 gives a prediction of sectors’ DT in china and Section 7 provides the conclusion and future work.
2. Literature Review
In this section, we first review current studies of DT from perspectives of promotion initiatives, influencing factors, etc. Then the existing technology is sorted out and the assessment of DT is discussed.
2.1. Digital Transformation
Heated academic and industrial discussions are carried on DT [4,13,15,16]. They reached a consensus that DT is not only has an effect on technology shift [17,18,19], but also on business modes, user experiences and operational processes [20,21,22,23]. Therefore, discussions are mainly from the perspectives of emerging technology innovations, organizational management, business mode changes, etc.
In the aspect of technology innovation and adoption, experts address that in the digital age, smart products need to be created with high technologies in intertwined digital and physical processes [24]. Emerging ICTs are considered to be important drivers in the process of DT, including information systems [25], big data [26,27], cloud computing [28], three-dimensional printing [29,30], and the Internet of Things [31].
In the aspect of organizational management, Sandberg et al. [32] presented principles for examining digital options for a specific business process, which will help industries to realize a set of desirable and feasible IT capability investments. Li Jun et al. [33] analyzed the key elements of sectors’ DT in China, especially the organizational form innovation.
From the point of view of business mode changes, researchers consider that DT introduces digital technologies which bring about innovation of business mode, then result in major changes of enterprises’ products, organizational structures and capability of process automation [34,35]. In the face of rapidly changing customer needs, these changes enable companies to adjust in time and respond flexibly [36].
2.2. Assessment of Enterprises’ Digital Transformation
It is a process of long-term optimization and continuous evolution to promote DT. Despite the multiplicity of technological novelties and implementation methods, DT has taken a much longer time and faced much more difficulty than expected [37,38]. It is essential to quantitatively monitor and comprehensively evaluate the level and effect of DT. Different methods are used in the evaluation of DT, mainly through the evaluation of digital maturity or that of integration of informatization and industrialization.
The concept of digital maturity was proposed mostly by scholars or industrial practitioners in traditional industrial countries. Digital maturity was designed for enterprises from all industries [39] assessing their current business mode against emerging opportunities and potentially adapt it to the new digital era [40]. The same for several other tantamount terms, such as digital readiness [41] or DT index [42]. To organize assessment based on digital maturity, RWTH Aachen University, Heinz Nixdorf Institute, DFKI, Fraunhofer Research Institution, Technische Universität Darmstadt and Acatech launched jointly the Industry 4.0 Maturity Index Report. The ability of industry 4.0 is evaluated from four aspects, i.e., resources, information system, organization management, and cultural focus on the IoT information system [43,44]. Based on the maturity model, digital readiness assessment [45,46], enterprises architecture improvement [47], industrial digitalization roadmap [48,49], and smart factory implementation [50] are analyzed. However, the applicability of the digital maturity assessment is limited. On the one hand, Remane et al. [51] claim that digital maturity is typically described along a linear scale, thus assuming that all enterprises do and need to proceed through the same path, which seems to be a critical oversimplification that invites faulty thinking with the possibility of leading to wrong management decisions. On the other hand, from our observation in the context of industrial developing countries including China, most enterprises are now at the stage of Industrial 2.0, and a few of them are experiencing a transition from Industrial 2.0 to Industrial 3.0 [52]. Therefore, for most enterprises, existing assessment models or indexes, such as maturity model and readiness indexes in the scenario of Industrial 4.0, are not suitable for them to continuously monitor all the stages of their DT development.
Another widely used method for evaluating DT is that of Integration of Informatization and Industrialization (III), which was proposed mainly by scholars in China. It aims at helping enterprises to improve their competitive advantage in the digital era through continual assessment of their capability in the context of III, which is one of the major development path of enterprises in China in the digital era. Zhang Xin et al. [53] provided several indexes for III assessment, including III level index, informatization index, industrialization index, etc. and organized empirical research at the provincial level. Zhou Jian et al. [54] proposed a framework and method of III assessment which covered the whole lifecycle of manufacturing enterprises based on industrial practices of enterprises in China. Yu Chang-yue et al. [55] proposed an evaluation indicator system constituted by aspects of innovation driving, integrated development, scale, quality, sustainability, etc. and investigated the III development level in major provinces in China.
2.3. Monitoring of Sectors’ Digital Transformation
The successful cases of enterprises’ DT drive the development of sectors. The authors tried to monitor DT of an entire sector. However, existing assessment indicators are mostly designed from the perspective of enterprise individuals. There is a gap in the research of assessment and continuous monitoring in the sector level. Therefore, in order to provide insightful advice to policy makers, enterprises’ managers, capital investment bodies and other related stakeholders, it is of great importance to develop a universal monitoring index system for major sectors and establish a monitoring mechanism for continuous tracking of their development about DT.
In most current research on sectors’ DT, case studies are commonly used, which are carried out in micro-perspective due to the limitations of inadequate data in empirical studies, and usually draw just referential conclusions. However, in order to systematically and comprehensively study and evaluate sectors’ DT, data of up to hundreds of enterprises are essential in a statistical sense.
To fill the above-mentioned gap, we investigate current situation and further needs of vast Chinese enterprises which are incorporated into the design of monitoring index, and propose a monitoring index system for sectors’ DT. Moreover, we are engaged in promoting the index system and have attracted over 99,910 Chinese enterprises to use it online in recent years, which has achieved the coverage of entire-process, multi-angles and continuous monitoring. By analyzing the large amounts of data, the effective monitoring of sectors’ DT is fulfilled.
The major contributions of this research can be seen as follows: First, for the purpose of continuous monitoring development of sectors’ DT, this study provides a systematical and comprehensive monitoring index system and calculation methods, which could derive the panorama of a country’s DT. Second, the panorama of DT in China is presented by applying the monitoring index system, which could be a reference to other countries.
3. Introduction to the Assessment Framework for Enterprises’ Digital Transformation
DT contains three parts, i.e., idea transition, mode transformation and path innovation. The assessment framework of enterprises’ DT in [14,56] plays an active part over the past decade, which laid the theoretical foundation for the research of this article.
As shown in Figure 1, the assessment framework of enterprises’ DT is composed of two parts, i.e., progress assessment and impact assessment. In the integration process of industrialization and industrialization, enterprises are advancing step by step along four stages in both enterprise competitiveness, and economic and social benefits. The four stages are basis and support, domain application, integration and interaction, innovation, and disruption.
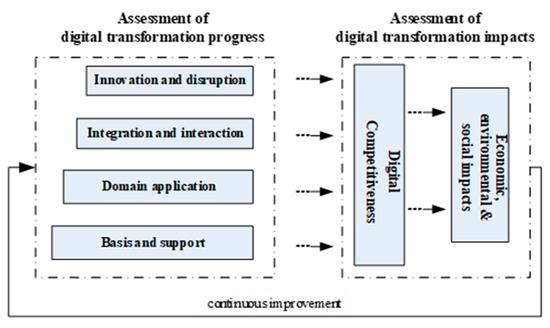
Figure 1.
Assessment framework of enterprises’ digital transformation.
According to the assessment framework, a set of assessment indicators with three levels are shown in Figure 2.
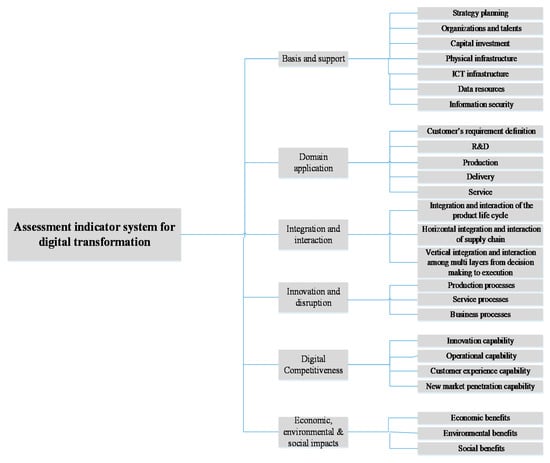
Figure 2.
Assessment indicators of enterprises’ digital transformation.
4. The Proposed Monitoring Index System for Sectors’ Digital Transformation
4.1. Monitoring Index System for Sectors’ Digital Transformation
After the assessment framework and indicators for enterprises’ DT were put forward, a large number of Chinese enterprises took it as a judgment and reference for evaluating and guiding DT in enterprises. The successful DT of some advanced enterprises has led to the continuous advancement of the entire sector’s DT process. In this case, in order to effectively monitor the level of sectors’ DT and derive a panorama of DT at sector level, the author team proposed a monitoring index system for sectors’ DT based on the assessment framework and indicators for enterprises’ DT. Current situation and further needs of vast enterprises, such the development and application of AI, blockchain, cloud and data analytics, and big data-driven are all be taken account into the design of the monitoring index system [57,58].
The proposed monitoring index system consists of 13 monitoring indexes concerning sectors’ DT, which is distributed in four aspects, i.e., single-domain digitalization, integration and interconnection, collaboration and interaction, and mode innovation, as shown as Table 1.

Table 1.
Proposed Monitoring Index System for Sectors’ DT.
4.2. Index Set for Monitoring Sectors’ Digital Transformation
In this section, the indexes for monitoring sectors’ DT are designed from four aspects, i.e., single-domain digitalization, integration and interconnection, collaboration and interaction, and mode innovation.
4.2.1. Indexes of Single-Domain Digitalization
The indexes of single-domain digitalization are as follows:
(a) Digital rate of production equipment, which refers to the ratio of the quantity of digitalized production equipment to the quantity of all production equipment. Specifically, in process industry, digitalized production equipment means independent equipment which can collect information automatically. In discrete industry, digitalized production equipment means NC machines, CNC machine centers, industrial robots, electromechanical equipment with data interface and so on.
(b) Digital R&D tool application rate: Digital R&D design tools mean software tools that are able to help enterprises in product design. These tools enable the enterprises to fulfill many tasks in digital form, such as modeling, simulation, verification and so on. In discrete industries, it refers to the ratio of the quantity of enterprises which can carry out 2D or 3D digital modeling to the quantity of all enterprises. In process industries, it refers to the ratio of the quantity of enterprises that use digital methods in R&D design.
(c) Numerical control (NC) rate of key processes: In discrete industries, it refers to the coverage rate of numerical control systems in key processes. NC DNC and CNC FMC are both typical numerical control systems. In process industries, it means the coverage rate of process control systems in key processes. PLC, DCS, and PCS are all typical process control systems.
(d) The E-commerce application rate refers to the fact that that the transactions of products or services are completed through the Internet. In related enterprises, the payment and delivery of those transactions are completed “online” or “offline”. It should be noted that orders which are received or dispatched by phone, fax or E-mail are not in the scope of E-commerce.
4.2.2. Indexes of Integration and Interconnection
The indexes of integration and interconnection are as follows:
(a) Proportion of enterprises that achieve the integration of design and manufacturing: In the enterprises that achieve the integration of design and manufacturing, data from product design, process design, and product manufacturing are integrated, and the information among those are also transmitted automatically.
(b) Proportion of enterprises that achieve integration of supply production-sale: In the enterprises that achieve integration of supply production-sale, by integrating corresponding information systems, integrated operation between links on internal supply chain can be achieved, so that the management for the procurement of materials, the warehouse of primary materials and completed products, the sales of products, etc. can be seamlessly connected with financial management by collecting automatically data from the integrated information system without manual input.
(c) Proportion of enterprises that achieve integration of management and control: In the enterprises that achieve integration of management and control, corresponding information systems are integrated so that seamless connection is achieved among enterprise production management (plan layer), workshop manufacturing execution (execution layer), production and manufacturing process control (control layer). The upload of information and the send of instructions can go through the above links.
4.2.3. Indexes of Collaboration and Interaction
The indexes of collaboration and interaction are as follows:
(a) Proportion of enterprises that achieve the control of the whole lifecycle of products: In the enterprises that achieve the control of the whole lifecycle of products, all data throughout the product life cycle is managed and used effectively, including product design, technological design, production and manufacturing, field installation, and debugging. Moreover, information can be transmitted automatically not only between product design and process design but also between process design and manufacturing. In addition, unified definitions of digitalized products are applied at all stages of the whole lifecycle of products.
(b) Proportion of enterprises that achieve the collaboration over the industry chain: In the enterprises that achieve the collaboration over the industry chain, the information system is used to achieve the collaborative operation of core businesses such as R&D, procurement, production, sales, finance, etc. with their upstream and downstream enterprises in the industry chain.
(c) Readiness rate of smart manufacturing: In the enterprises that achieve smart manufacturing, the NC rate in key processes exceeds 50 percent, and the integration of supply production-sale has almost completed. These enterprises have high NC degree of underlying equipment, and achieve not only the integration of procurement, production, sales, inventory, and finance on internal supply chain but also that of management and low-level automation. These enterprises tend to be intelligent factory or intelligent enterprises, and have formed the networked, flexible, and intelligent manufacturing mode.
4.2.4. Indexes of Mode Innovation
The indexes of collaboration and interaction are as follows:
(a) Proportion of enterprises that achieve networked collaboration, which refers to the proportion of enterprises that have achieved networked collaboration among all above-scale discrete manufacturing enterprises. In our work, networked collaboration involves cross-enterprise networked collaborative product design, cross-enterprise networked manufacturing and so on.
(b) The proportion of enterprises that achieve service-oriented manufacturing, which refers to the proportion of enterprises that have achieved service-oriented manufacturing among all above-scale discrete manufacturing enterprises. In our work, service-oriented manufacturing involves online operation and maintenance, remote monitoring, precise networked marketing, innovative service provision on the basis of intelligent terminals and so on.
(c) Proportion of enterprises that achieve personalized customization, which refers to the proportion of enterprises that have achieved personalized customization among all above-scale discrete manufacturing enterprises. Enterprises achieving personalized customization are capable of arranging and optimizing productions automatically based on customer orders and material supply.
4.3. Weights of Indexes
As shown in Table 1, the monitoring index system for sectors’ DT includes 13 monitoring indexes. To score the overall level of a sector’s DT, a weight method of interval valued hesitant fuzzy entropy are explored here for weight assignment.
Analytic hierarchy process (AHP) can analyze the problems hierarchically and combines the evaluation indicators according to different levels [17]. However, the importance of judgment matrix depends entirely on expert experience with large subjective components and relatively large amount of calculation. When the relationship of elements is complex, principal component analysis (PCA) is a good choice [18]. However, principal component analysis may lose the original information, which will affect the final weight result.
The entropy weight method (EWM) determines weight according to the amount of information [19]. That is to say, the more comprehensive effect an element can play, the more weight it will obtain. However, the entropy weight method has no fuzziness. In practice, it is sometimes difficult to give an accurate value, so it is difficult to quantify the qualitative problem reasonably.
When scoring the importance of an element, experts may hesitate between several scores. The weight determined by interval hesitant fuzzy entropy can weaken the uncertainty of experts in subjective scoring [20], and further make the determination of evaluation weight more reasonable [21].
In this section, we use interval valued hesitant fuzzy entropy (IVHFE) to determine the weight of each index. The proposed monitoring index system can be depicted as a hierarchical structure as in Figure 3. IVHFE weakens the hesitation of experts’ subjective evaluation and calculates the first-level indexes and the second-level indexes respectively. A fuzzy model of interval optimization can determine the weights of all indexes more reasonably.
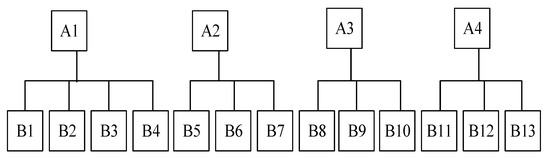
Figure 3.
Hierarchy of the proposed monitoring index system.
The evaluation interval given by experts is an interval hesitant fuzzy element, and the set of these fuzzy elements is an interval fuzzy hesitant set.
If the expert q gives a scoring interval for index i, the interval is Z(q) = [m,n]. Then the interval hesitant fuzzy element of index i is:
where is interval left value ‘m’, is interval right value ‘n’.
In the process of scoring, different experts have different understanding of the field and the depth of research. Therefore, when calculating the entropy of the interval hesitation fuzzy element, different experts should be given different weights . The interval hesitant fuzzy element, which is the score given by all experts for indicator i, is substituted into (2) to calculate the interval hesitant fuzzy entropy:
where T is the number of experts, Z(q) is the score interval of the qth expert, is the hesitant fuzzy entropy of the index i. By calculating entropy values of all indexes at the same level, , the weight of the index i, can be derived as follows:
where N is the number of indexes at the same level, and we have: .
Constructing an expert set E = {E1, E2, …, Eq, …, ET}, then interval hesitant fuzzy elements of indexes in the first-level are as shown in Table 2.
Table 2.
Interval Hesitation Fuzzy Element of the First-Level Indicators.
By substituting the interval hesitation fuzzy element to (2), the interval hesitation fuzzy entropy of the first-level indexes is obtained as . Then by (3), their weight values can be calculated, see Table 3.
Table 3.
Interval Hesitation Fuzzy Entropy and Weight of the First Level.
According to (3), we can obtain:
The weight calculation of the second-level indicators is similar to that of the first-level indicators. The interval hesitation fuzzy element of the second-level indicators is substituted into (2) to obtain the corresponding set of interval hesitation fuzzy entropy. The sets of interval hesitation fuzzy entropy of the indicators in the second level are as follows: . Substituting the calculated interval hesitation fuzzy entropy into (3), the corresponding set of weight values is obtained.
The weight of the first-level indicator Ai to the target problem is recorded as , and the weight of the second-level indicator directly connected to the first-level indicator relative to its upper-level indicator is recorded as .
Then the weight of the second-level indicator relative to the target problem is . According to (3), we can obtain
where t is the number of the second-level indicators corresponding to the first-level indicator . According to (5), we know that the sum of the weights of indicators on the second level relative to the target problem is 1.
The weights of indicators on the second level relative to the target question are shown in Table 4.
Table 4.
Weight Values of the Second-Level Indexes.
4.4. Methods and Steps for Calculation
In the monitoring index system for sectors’ DT, the score of every index and the overall level can be calculated as three steps, as shown in Figure 4.
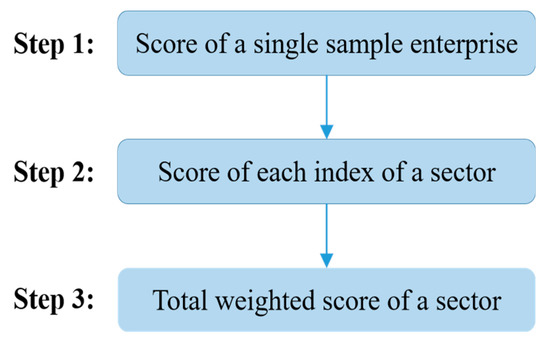
Figure 4.
Calculation steps for the score of a sector’s digital transformation.
4.4.1. Data Collected from Sample Enterprises
To monitor sectors’ DT and collect sample data, we developed the Contemporary Service Platform of Integration of Industrialization and Industrialization (www.cspiii.com accessed on 31 August 2020) [59]. According the monitoring index system of DT, combined with sector characteristics, a set of questionnaires is designed for data collection from enterprises, which includes numerical questions, single choice questions, and checklist questions.
For numerical questions, the scoring can be calculated by the formula: . Where means the score of this data collection item, which of value is between 0 and 100; means the real value of the ith data collection item; and are the minimum and maximum thresholds of this data collection item respectively.
For single choice questions, the scoring is calculated as follows:
(i) all the available options should be assigned with certain scores, which should be distributed in the value between 0 and 100.
(ii) the score of the data collection items should be the corresponding score of the selected option.
For checklist questions, the scoring is calculated as follows:
(i) all the available options should be assigned with certain scores, which should be distributed in the value range of [0, 100], and the options’ total scores should be 100.
(ii) the score of the data collection items should be the sum of the selected options’ scores.
4.4.2. Score of Each Index of a Sector
The calculation methods for the value of each index are shown in Table 5. Normalization is used here to transform the index value to the score of the index ranged in [0, 100].
Table 5.
The Calculation Methods for Other Indexes.
4.4.3. Total Weighted Score of a Sector
The total score of a sector’s DT is derived by performing a weighted summation of all indexes with the weights in Table 4.
This score can be regarded as an objective evaluation result of the DT level of a sector. By continuously tracking the score of the monitoring index system, it is possible to effectively judge and predict the development degree and trend of the sector’s DT.
5. Monitoring and Analysis for Sectors’ Digital Transformation in China
5.1. Data Source and Description of Samples
All data to be analyzed were collected from the Contemporary Service Platform of Integration of Industrialization and Industrialization (www.cspiii.com accessed on 31 August 2020) [59]. By the end of June 2018, 99,910 enterprises in China had reported their DT data through the platform, accounting for 26.4% of the total number of industrial enterprises above designated size in the national statistical system. Moreover, this sample covers 31 provinces (cities) and 101 industries of China, which are capable of objectively representing and reflecting the overall status of sectors’ DT in China.
In terms of enterprises distribution in different sectors, the number of sample enterprises in machinery, food industry, and light industry was relatively large, accounting for 21.2%, 11.9%, and 11.9%, respectively, followed by electronics, building materials, textiles, petrochemistry, and transportation equipment manufacturing, all of the proportions of which exceeded 5%. This distribution was roughly consistent with the industry distribution of industrial enterprises above designated size in China, especially with the distribution of industries that occupy relatively large proportions such as machinery, light industry, food industry, textiles and building materials. The sample enterprises were of high representativeness for industries and can objectively reflect the DT level in China (See Figure 5).
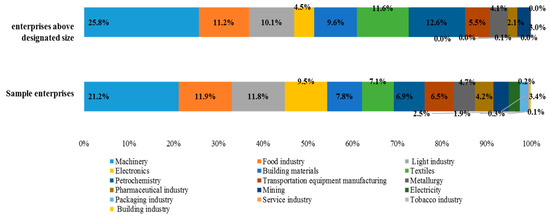
Figure 5.
Sector representativeness of sample enterprises.
In terms of size distribution, large-sized enterprises accounted for 6.5%, small- and micro-sized enterprises accounted for 58.7%, and medium-sized enterprises accounted for 17.8%. Compared with the distribution of industrial enterprises above designated size in China, the proportion of small- and micro-sized industrial enterprises in the samples was slightly lower, while the proportion of large and medium-sized industrial enterprises was higher (See Figure 6).
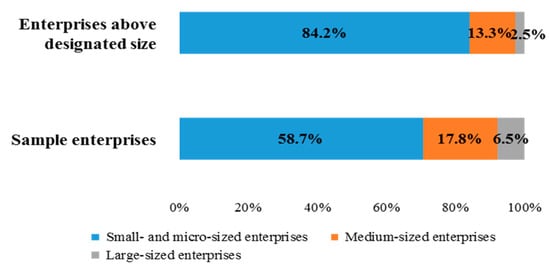
Figure 6.
Scale representativeness of sample enterprises.
In terms of region distribution, largest number of sample enterprises was found in East China, reaching as high as 34.4%, followed by those in North and South China, which took up 20.3% and 14.1%, respectively. Compared with the distribution of industrial enterprises above designated size in China by regions, the proportions of sample industrial enterprises in East and North China were different from the actual distribution in national statistics, while the distribution in other regions was basically the same (See Figure 7).
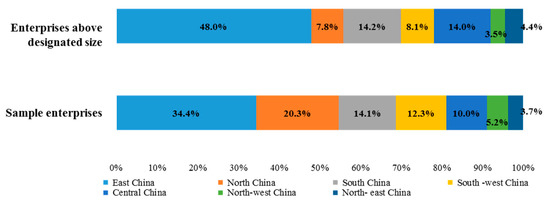
Figure 7.
Region representativeness of sample enterprises.
5.2. Overview of Sectors’ Digital Transformation in China
The level of sectors’ DT in China in 2018 reached 53.0. The application of ICT technology in some specific sectors, multi-business and multi-link integrated application and intelligent collaborative application is being continuously expanded horizontally and vertically.
From the perspective of enterprise size, the digitalization level of large enterprises remaining in the lead and growing stably, while that of small- and micro-sized enterprises and private enterprises improving rapidly, whose growth rates have exceeded that of large- and medium-sized enterprises (See Figure 8 and Figure 9). The overview of sectors’ DT in China (2018) can be seen in Table 6.
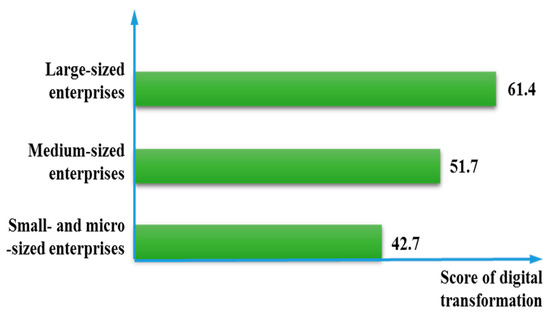
Figure 8.
Digital transformation level of enterprises of different sizes.
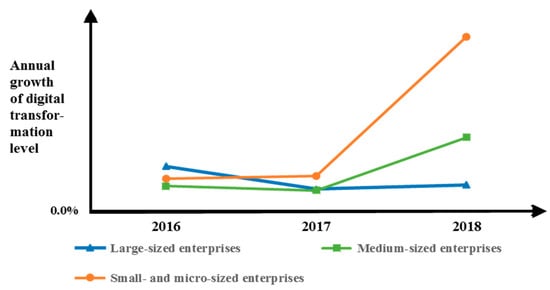
Figure 9.
Annual growth of digital transformation of enterprises of different sizes.
Table 6.
Overview of Sectors’ Digital Transformation in China (2018).
Seen from key indicators, the overall DT level of key areas in China has improved continuously, and the process of digitization, networkization and intelligentization has continuously accelerated. In terms of underlying devices, the digitalization rate of production equipment in China reached 45.9% in 2018, with grown 4.1% compared with that in 2016. In terms of R&D design, the digital R&D tool application rate in China reached 67.4% in 2018, having grown 9.1% compared with 2016. In terms of production control, China’s NC rate in key processes reached 48.4% in 2018, having grown 5.7% compared with 2016. In terms of intelligentization development, China’s intelligent manufacturing readiness rate was as high as 7.0% in 2018, having grown 37.3% compared with 2016 (see Figure 10).
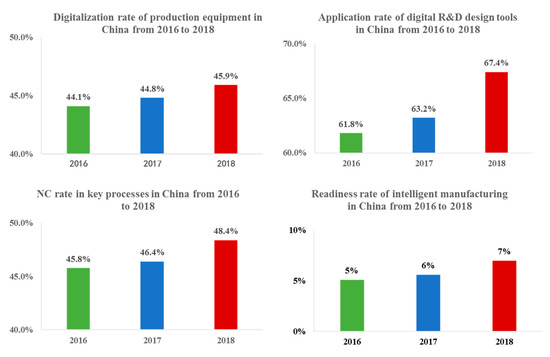
Figure 10.
Key monitoring indexes of digital transformation in China.
5.3. Different Paths of Digital Transformation Taken by Major Sectors in China
The DT development level in different industries are not the same in China, and different development needs and production characteristics exist in different industries. Based on their respective urgent demands of digitalization, networkization, and intelligentization, different industries have launched active explorations with different focuses on integrated development, and taken the core problems and shackles found them in the process to be focuses to make breakthroughs in future development.
The DT level of different industries ranked from high to low were electricity, tobacco industry, electronics, transportation equipment manufacturing, petrochemistry, pharmaceutical industry, textiles, machinery, light industry, food industry, metallurgy, building materials, and mining industry, presenting an overall status that the DT level of energy industry was higher than that of the manufacturing industry, and the latter was higher than that of mining industry. For the manufacturing industry, the DT level of consumer goods and electronics industries were relatively high, which were also higher than China’s national average, and the level of raw materials and equipment industries were basically the same (See Figure 11).
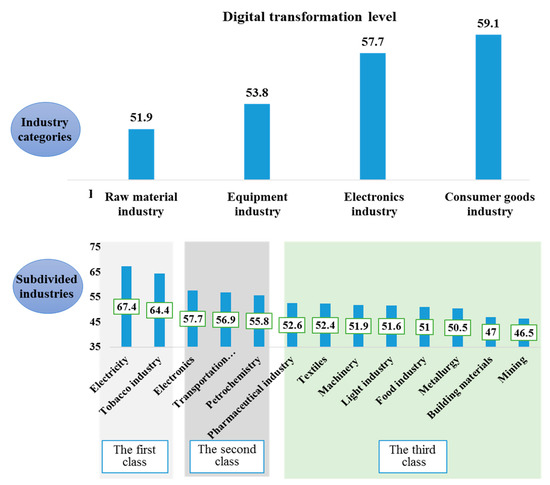
Figure 11.
Overview of sectors’ digital transformation in China.
The equipment industry takes the innovative application of digital R&D tools as a breakthrough point to promote DT [60], which is one of the most promising areas for integrated development among different industries [61]. The raw material industry represented by the petrochemistry focuses on strengthening the level of intelligentization in the manufacturing process, thus remaining at the lead among different industries in terms of the digital rate of production equipment, the networked rate of digital production equipment and the readiness rate of intelligent manufacturing [62]. The consumer goods industries, such as the food industry, pharmaceutical industry, etc. focuses on creating a rapid response capability to user needs, whose industry chain has a high level of coordination [63]. The electronics industry focuses on promoting the intelligentization development of products, whose levels of digitalization, networkization and intelligentization of product R&D, production and manufacturing are among the highest in all industries (see Figure 12).
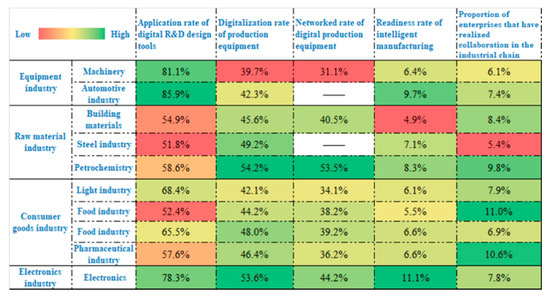
Figure 12.
Key indexes of digital transformation of China’s major sectors.
5.4. There Exists Imbalance among Different Regions in China
It is obvious that the DT level in various provinces in China shows a hierarchical distribution, with an overall status of “high in the coastal areas and southwest, low in the northwest and the northeast”. Due to the differences in strategy orientation, economic foundation, industrial structure, and resource endowment, etc., the DT levels of different provinces have obvious hierarchical distribution characteristics overall. Among them, provinces and cities in the first class include Shandong, Shanghai, Jiangsu, Guangdong, Beijing, Chongqing, Tianjin, Fujian, Zhejiang, Sichuan, etc., which are mostly located in the eastern coastal area, while Sichuan and Chongqing are always the pioneers in the southwest region. The provinces and cities in the second class are located intensively in the center and east of China such as Hebei, Liaoning, Hubei, Henan, Anhui, Inner Mongolia, Shanxi, Shaanxi, Jiangxi, Jilin, Hunan, etc. The third class involves provinces and cities scattered in the northeast and northwest China, including Ningxia, Heilongjiang, Guizhou, Guangxi, Hainan, Qinghai, Gansu, Tibet, Xinjiang, etc. (See Figure 13).
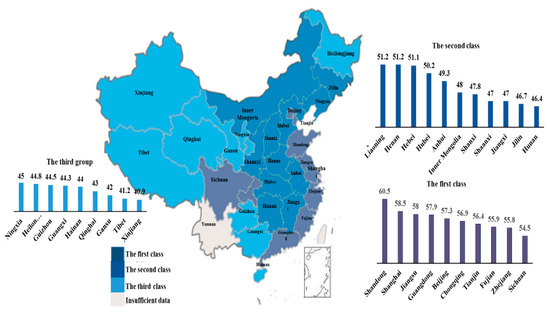
Figure 13.
Data map of China’s regional digital transformation.
6. Prediction of Sectors’ Digital Transformation in China
Depending on the history data regarding the DT level in China over the past several years, a gray forecasting model is explored to predict the level in next few years with both known information and uncertainty.
This is a time-related predictive problem that changes within a certain range. Because the function form is unknown, it is difficult to establish an accurate mathematical model. In addition, it is inappropriate to use artificial neural network because the amount of data is small. Gray forecasting model is a kind of forecasting method that uses a small amount of incomplete information to establish a mathematical model and make predictions. Therefore, we use gray forecasting model to predict the level of sectors’ DT in the next few years based on historical data about the level of sectors’ DT in the current year and the previous years.
As shown in Figure 14, a statistical analysis of existing historical data shows that the scores of sectors’ DT are increasing year by year, while the growth rates generally tend to slow down. Therefore, a gray prediction can be made as follows:
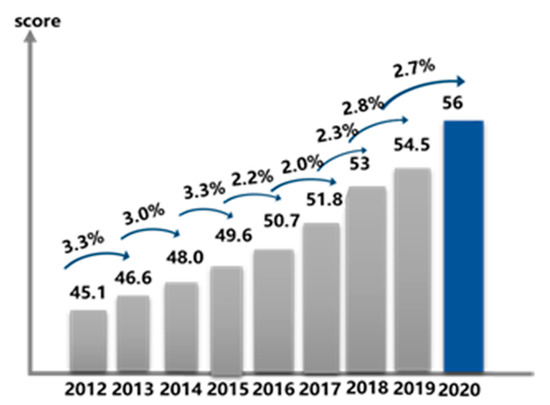
Figure 14.
Historical data of sector’ digital transformation in China.
(a) Feasibility analysis of gray prediction
To ensure the feasibility of the GM (1, 1) modeling method, it is necessary to perform necessary inspections on the known data. Let the original data be listed as:
Among this equation, n is 9, and is the scores of sectors’ DT from 2012 to 2020. Calculate the grade ratio of the sequence:
All the grade ratios fall within the acceptable coverage interval , so the sequence can be modeled with GM(1, 1) model and the gray predictions can be made.
(b) Build the GM (1, 1) model
Use regression analysis to obtain the estimated values of a and b, calculate the superimposed sequence from the original data sequence . So the corresponding whitening model is:
The solution is:
The predicted value is as follows:
The predicted value can be obtained accordingly:
(c) Prediction test
Calculate the relative residuals:
If all || < 0.1, it is considered that the high requirements are met; otherwise, if all || < 0.2, it is considered that the general requirements are met. In our work, the test value of the score of sectors’ DT from 2012 to 2020 is 0.0024, so it can be considered that the prediction meets high requirements.
Based on the historical data on the level of sectors’ DT from 2012 to 2020, the score of sectors’ DT from 2021 to 2023 are predicted. We use MATLAB to calculate the gray prediction value as shown in Figure 15.
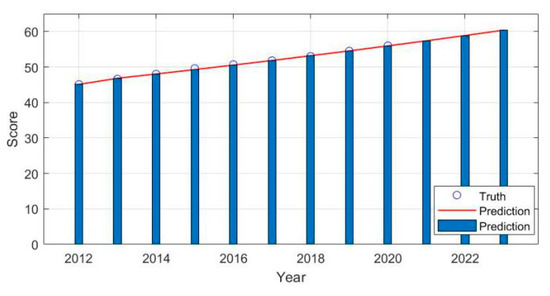
Figure 15.
Predication of sector’ digital transformation in China.
From the above autoregressive prediction, the sectors’ DT level in China will keep growing in the future three years. The progress of multiple aspects leading to this result such as the single-domain digitalization, Integration and interconnection, Collaboration and interaction, mode innovation and other aspects will be enhanced in varying degrees.
7. Conclusions and Future Work
This study proposes a monitoring index system for sectors’ DT. Based on the data collected from 99,910 enterprises, an overview of development level and effect of China’s DT is derived. There are three main achievements:
(i) A monitoring index system for sectors’ DT is proposed on basis of the assessment framework of enterprises’ DT, which contains four aspects and 13 monitoring indexes. A weight method of interval valued hesitant fuzzy entropy is used for the weight assignment of all indexes in the monitoring index system.
(ii) An overview of China’s DT is derived by applying the monitoring index system with the monitoring data from 99,910 enterprises.
(iii) With the history data from 2012–2020, the prediction of sectors’ DT in China is transformed into a self-regression problem, and the predicted level for next three years is derived with gray prediction.
The implications of our work are multifold. Theoretically, fully considering the current development and potential needs of DT, we propose a monitoring index system, which provides evaluation criteria and guiding reference for the development of sectors’ DT. With the monitoring index system, on the one hand, it could help sectors carry out comprehensive and quantitative analysis of their current DT status; and on the other hand, the result of assessment could provide sectors with insights of future direction and feasible path of DT. Practically, our study takes China as an example to illustrate how to make full use of the monitoring index system to monitoring sectors’ DT of a country, including the national overview, sectoral and regional differences, etc.
The future works of this study mainly focus on following two aspects:
(i) In the future improvement of the monitoring index system, we will optimize and expand the monitoring indexes, especially increasing the monitoring indexes directly reflecting the final value and benefit of DT.
(ii) We will implement some systematical analysis about the advantages and challenges of DT in other major countries by applying our monitoring index system.
Author Contributions
Conceptualization, J.L. and Q.L.; methodology, J.L., K.D. and S.W.; validation, J.L. and S.W.; formal analysis, S.W.; investigation, K.D.; resources, J.L. and K.D.; data curation, J.L. and K.D.; writing—original draft preparation, J.L., K.D. and S.W.; writing—review and editing, J.L., K.D. and S.W.; visualization, S.W.; supervision, J.L. and S.W.; project administration, J.L. and Q.L.; funding acquisition, J.L. All authors have read and agreed to the published version of the manuscript.
Funding
This research was supported in part by the National Natural Science Foundation of China, No. 61771281, in part by the National Social Science Foundation of China, No. 15ZDB151, in part by the National Key Research and Development Program of China, No. 2018YFF0213700, and in part by the 2018 Industrial Internet Platform innovation and development project of China.
Data Availability Statement
The data required to reproduce these findings cannot be shared at present because the data are also a part of an ongoing study.
Conflicts of Interest
The authors declare no conflict of interest.
References
- Xue, J.L. Strategic thinking on digital transformation of traditional enterprises. China Econ. 2018, 352, 265–266. [Google Scholar]
- Ustundag, A.; Cevikcan, E. Industry 4.0: Managing the Digital Transformation; Springer Scientcernational Publishing: Cham, Switzerland, 2018. [Google Scholar]
- Matt, C.; Hess, T.; Benlian, A. Digital Transformation Strategies. Bus. Inf. Syst. Eng. 2015, 57, 339–343. [Google Scholar] [CrossRef]
- Liere-Netheler, K.; Packmohr, S.; Vogelsang, K. Drivers of digital transformation in manufacturing. In Proceedings of the 51st Hawaii International Conference on System Sciences, Waikoloa Village, HI, USA, 3–6 January 2018; pp. 3926–3935. [Google Scholar]
- Kagermann, H.; Helbig, J.; Hellinger, A.; Wahlster, W. Recommendations for Implementing the Strategic Initiative INDUSTRIE 4.0; Industrie 4.0 Working Group of Acatech: Berlin, Germany, 2013. [Google Scholar]
- Benlian, A.; Hilkert, D.; Hess, T. How open is this Platform? The Meaning and Measurement of Platform Openness from the Complementers’ Perspective. J. Inf. Technol. 2015, 30, 209–228. [Google Scholar] [CrossRef]
- Schwab, K. The Fourth Industrial Revolution; World Economic Forum: Cologny, Switzerland, 2017. [Google Scholar]
- Kohli, R.; Melville, N.P. Digital innovation: A review and synthesis. Inf. Syst. J. 2019, 29, 200–223. [Google Scholar] [CrossRef]
- Development Research Center of the State Council of the People’s Republic of China. Digital Transformation of Traditional Industries: Its Pattern and Path; DRC: Beijing, China. Available online: https://www.sohu.com/a/228737475_282720 (accessed on 20 December 2018).
- Chen, T.X. OECD: The digital economy is far from reaching its full potential. JWE 2015, 2015, 77–78. [Google Scholar]
- Zhu, R.X. A comparison and the lessons of electronic public service development strategy in Anglo American countries. Adm. Law 2017, 2017, 24–30. [Google Scholar]
- Prime Minister’s Strategy Unit. Connecting the UK: The Digital Strategy. Available online: https://dera.ioe.ac.uk/5745/1/digital_strategy.pdf (accessed on 20 December 2018).
- Qin, J.; Liu, Y.; Grosvenor, R. A Categorical Framework of Manufacturing for Industry 4.0 and Beyond. Procedia CIRP 2016, 52, 173–178. [Google Scholar] [CrossRef]
- Assessment Framework for Digital Transformation of Sectors in Smart Cities. ITU-T Y.4906-2019. Available online: https://www.itu.int (accessed on 31 August 2020).
- Borangiu, T.; Trentesaux, D.; Thomas, A.; Leitão, P.; Barata, J. Digital transformation of manufacturing through cloud services and resource virtualization. Comput. Ind. 2019, 108, 150–162. [Google Scholar] [CrossRef]
- Schweer, D.; Sahl, J.C. The Digital Transformation of Industry—The Benefit for Germany. In The Drivers of Digital Transformation; Abolhassan, F., Ed.; Springer: Berlin/Heidelberg, Germany, 2017; pp. 23–31. [Google Scholar]
- Loebbecke, C.; Picot, A. Reflections on societal and business model transformation arising from digitization and big data analytics: A research agenda. J. Strat. Inf. Syst. 2015, 24, 149–157. [Google Scholar] [CrossRef]
- Schallmo, D.R.A.; Williams, C.A. Digital Transformation Now: Guiding the Successful Digitalization of Your Business Model; Springer: Berlin/Heidelberg, Germany, 2018. [Google Scholar]
- Berghaus, S.; Back, A. Stages in Digital Business Transformation: Results of an Empirical Maturity Study; Association for Information Systems: Atlanta, GA, USA, 2016; p. 22. [Google Scholar]
- Henriette, E.; Feki, M.; Boughzala, I. The Shape of Digital Transformation: A Systematic Literature Review; Association for Information Systems: Atlanta, GA, USA, 2015; pp. 431–443. [Google Scholar]
- Reis, J.; Amorim, M.; Melão, N.; Matos, P. Digital transformation: A literature review and guidelines for future research. In Proceedings of the 6th World Conference on Information Systems and Technologies, Naples, Italy, 27–29 March 2018; pp. 411–421. [Google Scholar]
- Parviainen, P.; Tihinen, M.; Kääriäinen, J.; Teppola, S. Tackling the digitalization challenge: How to benefit from digitalization in practice. Int. J. Inf. Syst. Proj. Manag. 2017, 5, 63–77. [Google Scholar]
- Hönigsberg, S.; Dinter, B. Toward a Method to Foster the Digital Transformation in SME Networks. In Proceedings of the Fortieth International Conference on Information Systems, Munich, Germany, 15–18 December 2019; pp. 1–9. [Google Scholar]
- Schmidt, R.; Möhring, M.; Härting, R.C.; Reichstein, C.; Neumaier, P.; Jozinović, P. Industry 4.0-potentials for creating smart products: Empirical research results. In Proceedings of the International Conference on Business Information Systems, Poznan, Poland, 24–26 June 2015. [Google Scholar]
- Agarwal, R.; Gao, G. (Gordon); Desroches, C.; Jha, A.K. Research Commentary—The Digital Transformation of Healthcare: Current Status and the Road Ahead. Inf. Syst. Res. 2010, 21, 796–809. [Google Scholar] [CrossRef]
- Pappas, I.O.; Mikalef, P.; Giannakos, M.N.; Krogstie, J.; Lekakos, G. Big data and business analytics ecosystems: Paving the way towards digital transformation and sustainable societies. Inf. Syst. E-Bus. Manag. 2018, 16, 479–491. [Google Scholar] [CrossRef]
- Hanelt, A.; Piccinini, E.; Gregory, R.W.; Hildebrandt, B.; Kolbe, L.M. Digital transformation of primarily physical industries-exploring the impact of digital trends on business models of automobile manufacturers. In Proceedings of the 12th International Conference on Wirtschaftsinformatik, Osnabrück, Germany, 4–6 March 2015; pp. 1313–1327. [Google Scholar]
- Hu, X.L. Cloud-based + ecology” helps banks in digital transformation. China Financ. 2017, 20, 82–83. [Google Scholar]
- Candi, M.; Beltagui, A. Effective use of 3D printing in the innovation process. Technovation 2019, 80, 63–73. [Google Scholar] [CrossRef]
- Xiao, N. 3D printing will lead the digital transformation of traditional industries. CPI 2014, 19, 66–67. [Google Scholar]
- Jeschke, S.; Brecher, C.; Meisen, T.; Özdemir, D.; Eschert, T. Industrial Internet of Things and Cyber Manufacturing Systems; Springer: Berlin/Heidelberg, Germany, 2016. [Google Scholar]
- Sandberg, J.; Mathiassen, L.; Napier, N. Digital options theory for IT capability investment. J. Assoc. Inf. Syst. 2014, 15, 1. [Google Scholar] [CrossRef]
- Li, J.; Qiu, J.J.; Dou, K.Q. Research and innovation on manufacturing management model under the background of new industrial revolution. Manuf. Autom. 2017, 39, 130–133. [Google Scholar]
- Hess, T.; Matt, C.; Benlian, A.; Wiesböck, F. Options for formulating a digital transformation strategy. MIS Q. Exec. 2016, 15, 2. [Google Scholar]
- Frank, A.G.; Mendes, G.H.S.; Ayala, N.F.; Ghezzi, A. Servitization and Industry 4.0 convergence in the digital transformation of product firms: A business model innovation perspective. Technol. Forecast. Soc. Chang. 2019, 141, 341–351. [Google Scholar] [CrossRef]
- Berman, S.J. Digital transformation: Opportunities to create new business models. Strategy Leadersh. 2012, 40, 16–24. [Google Scholar] [CrossRef]
- Zinder, E.; Yunatova, I. International Conference on Digital Transformation and Global Society; Springer: Berlin/Heidelberg, Germany, 2016; pp. 155–168. [Google Scholar]
- Fitzgerald, M.; Kruschwitz, N.; Bonnet, D.; Welch, M. Embracing digital technology: A new strategic imperative. MIT Sloan Manag. Rev. 2014, 55, 1. [Google Scholar]
- Westerman, G.; Bonnet, D.; McAfee, A. Leading Digital: Turning Technology into Business Transformation; Harvard Business Review Press: Brighton, MA, USA, 2014. [Google Scholar]
- Gannon, B. Outsiders: An exploratory history of IS in corporations. J. Inf. Technol. 2013, 28, 50–62. [Google Scholar] [CrossRef]
- Machadoa, C.G.; Winrotha, M.; Carlssonb, D.; Almström, P.; Centerholt, V.; Hallin, M. Industry 4.0 readiness in manufacturing companies: Challenges and enablers towards increased digitalization. Procedia CIRP 2019, 81, 1113–1118. [Google Scholar] [CrossRef]
- Bock, R.; Iansiti, M.; Lakhani, K.R. What the Companies on the Right Side of the Digital Business Divide Have in Common; Harvard Business Review Press: Brighton, UK, 2017. [Google Scholar]
- Schumacher, A.; Erol, S.; Sihn, W. A maturity model for assessing Industry 4.0 readiness and maturity of manufacturing enterprises. Procedia Cirp. 2016, 52, 161–166. [Google Scholar] [CrossRef]
- Schuh, G.; Anderl, R.; Gausemeier, J.; ten Hompel, M.; Wahlster, W. Industry 4.0 Maturity Index; Managing the Digital Transformation of Companies: Munich, Germany, 2017. [Google Scholar]
- Akdil, K.Y.; Ustundag, A.; Cevikcan, E. Maturity and Readiness Model for Industry 4.0 Strategy; Springer: Berlin/Heidelberg, Germany, 2018; pp. 61–94. [Google Scholar]
- Veselovsky, M.Y.; Izmailova, M.A.; Yunusov, L.A.; Yunusov, I.A. Quality of digital transformation management on the way of formation of innovative economy of Russia. Qual. Access Success 2019, 20, 66–71. [Google Scholar]
- Schwer, K.; Hitz, C.; Wyss, R.; Wirz, D.; Minonne, C. Digital maturity variables and their impact on the enterprise architecture layers. Probl. Perspect. Manag. 2018, 16, 141–154. [Google Scholar] [CrossRef]
- Schumacher, A.; Nemeth, T.; Sihn, W. Roadmapping towards industrial digitalization based on an Industry 4.0 maturity model for manufacturing enterprises. Procedia CIRP 2019, 79, 409–414. [Google Scholar] [CrossRef]
- Chao, G.; Shiyou, Q.; Tingyu, L.; Guoqiang, S.; Yingying, X.; Mei, W.; Qiudan, M.; Hang, J. Research on maturity evaluation technology of complex digital industrial system. J. Syst. Simul. 2018, 30, 29–35. [Google Scholar]
- Sjödin, D.R.; Parida, V.; Leksell, M.; Petrovic, A. Smart factory implementation and process innovation: A preliminary maturity model for leveraging digitalization. Res. Technol. Manag. 2018, 61, 22–31. [Google Scholar] [CrossRef]
- Remane, G.; Hanelt, A.; Wiesboeck, F.; Kolbe, L. Digital maturity in traditional industries–an exploratory analysis. In Proceedings of the 25th European Conference on Information Systems, Guimarães, Portugal, 5–10 June 2017; pp. 1–5. [Google Scholar]
- Wang, C.C.; Guo, Y.; Yin, Z.M.; Yang, X. Simulation Analysis of Realizing Industry 4.0 Capability in Equipment Manufacturing Industry Based on SD. JLIT Nat. Sci. Ed. 2018, 2018, 200–205. [Google Scholar]
- Zhang, X.; Ma, J.H.; Liu, P.D.; Liu, Q.; Xu, F. Evaluation method and application of the integration level of regional industrialization and information. JSU Nat. Sci. Ed. 2012, 2012, 71–76. [Google Scholar]
- Zhou, J.; Chen, J. Index system construction for assessing integration of informatization and industrialization in manufacturing enterprises. CIMS 2013, 19, 2251–2263. [Google Scholar]
- Yu, C.Y.; Wang, C.F.; Zhang, W.Y.; Fu, W. Empirical research on the evaluation system of integration of informatization and industrialization. Inf. Sci. 2017, 2017, 84–87. [Google Scholar]
- Assessment Specification on Integration of Informatization and Industrialization for Industrial Enterprises. GB/T23020-2013. Available online: http://openstd.samr.gov.cn/bzgk/gb/ (accessed on 31 August 2020).
- Akter, S.; Michael, K.; Uddin, M.R.; McCarthy, G.; Rahman, M. Transforming business using digital innovations: The application of AI, blockchain, cloud and data analytics. Ann. Oper. Res. 2020, 1–33. [Google Scholar] [CrossRef]
- Mohiuddin Babu, M.; Rahman, M.; Alam, A.; Dey, B.L. Exploring big data-driven innovation in the manufacturing sector: Evidence from UK firms. Ann. Oper. Res. 2021, 1–28. [Google Scholar]
- The Contemporary Service Platform of Integration of Industrialization and Industrialization. Available online: http://www.cspiii.com (accessed on 31 August 2020).
- Huang, J.; Guo, G.X.; Liu, M.; Qin, Y. Research on the intelligent transformation and upgrade path of china automobile manufacturing enterprises from the perspective of dynamic capabilities. STPP 2018, 35, 121–129. [Google Scholar]
- Yu, C.L.; Hou, J.J.; Zhao, Y.; Xu, H.; Zhang, W. Intelligent manufacturing system architecture of multi-variety and variable-batch products. AMT 2019, 62, 98–102. [Google Scholar]
- Yu, Y. Information architecture design of Hesteel Tangsteel industry for intelligent manufacturing. Iron. Steel 2017, 52, 1–6. [Google Scholar]
- Zhang, J.J.; Zhao, Q.L. Transformation and upgrading of the business model of the circulation supply chain driven by “New Rail”. JBE 2018, 38, 5–15. [Google Scholar]
Publisher’s Note: MDPI stays neutral with regard to jurisdictional claims in published maps and institutional affiliations. |
© 2021 by the authors. Licensee MDPI, Basel, Switzerland. This article is an open access article distributed under the terms and conditions of the Creative Commons Attribution (CC BY) license (https://creativecommons.org/licenses/by/4.0/).