1. Introduction
Sensory evaluation of bare skin is indispensable for developing skin care products with high user satisfaction. It evaluates the appearance and sense of touch on the skin and the changes in skin due to skin care products, and the results can be used for product claims.
Sensory evaluation can be divided into two categories: evaluation by users and evaluation by professional assessors [
1]. Evaluation by users is conducted to investigate consumers’ preferences under conditions similar to actual usage, whereas evaluations by professional assessors are based on specific criteria. The purpose of the evaluation by professional assessors is to determine the characteristics of each attribute analytically, and reliability is a primary concern. Therefore, this study focused on the reliability of sensory evaluations conducted by professional assessors.
Various guidelines and studies have been published, aiming to improve the reliability of sensory evaluations [
1,
2,
3,
4,
5,
6,
7,
8,
9]. For example, the International Organization for Standardization (ISO) 11036 is a guideline for texture evaluation, covering texture profile classification, attribute classification and development, reference samples, evaluation methods, scales, panel screening and training, and data analysis [
2]. The American Society for Testing and Materials has defined sensory evaluation methods for skin creams, lotions, and shampoos [
6,
7]. The guidelines on efficacy evaluation issued by the European Cosmetic and Perfumery Association describe the classification of efficacy claims, the disclosure of information when conducting tests, and the writing of reports [
1]. Additionally, the European Group on Efficacy Measurement and Evaluation of Cosmetics and Other Products (EEMCO), a working group of experts, has published guidelines for the sensory evaluation of wrinkles and dryness [
7,
8].
Currently, cosmetic manufacturers and research institutes that perform efficacy evaluations of cosmetics train professional assessors based on these or similar guidelines [
10,
11,
12,
13,
14,
15,
16]. For example, Addor et al. [
13] evaluated the effect of moisturizing products by instrumental measurements and trained panelists. However, there is limited published information on the reliability of sensory evaluations.
Aust et al. reported on the tactile evaluations of five lotions involving nine trained assessors to show the differences in their textures [
17]. They confirmed that the standard deviation of the scores by the expert assessors was small, but they did not indicate this value. Additionally, because the evaluation was conducted only once, intra-assessor reproducibility was not evaluated. Further, Vieira et al. trained 43 assessors to evaluate moisturizing creams [
18] and classified the application process into four categories: appearance, pick-up, rub-out, and after-feel. Then, they selected 14 important attributes for each process. The assessors evaluated the three samples for each attribute and reported that there were no significant differences between the first and second evaluations of each attribute and that the responses of the assessors were reliable; however, this study did not provide specific data. Calixo et al. conducted sensory evaluations of four gel creams by 50 Brazilian and 50 French participants and reported high reliabilities of the sensory evaluations of texture between the two cultures [
19]. Larnier et al. also developed a photographic scale to evaluate skin photodamage and evaluated the reliability among assessors [
20]; however, they did not investigate tactile sensations. Kang et al. assessed dry skin based on the EEMCO guidelines by both dermatologists and pharmacists and tested the inter-assessor reliability using the intraclass correlation coefficient (ICC) [
21]. The results showed that the visual scale and crack fissures were in fair agreement, and the overall dry skin score, redness and roughness, and scaling, as defined in the guidelines, were in moderate or substantial agreement. The EEMCO guidelines for assessing dry skin covered several attributes for appearance, and only roughness was related to tactile sensation. Additionally, Kang et al. did not investigate the reproducibility for the assessors [
21].
As mentioned, only a few studies have reported on the reliability of sensory evaluations of tactile sensations on skin. Several studies have discussed reliability among assessors but not within assessors. Although the sensory evaluation of bare skin is indispensable for the evaluation of cosmetic products, the fact that the specific degree of reliability is unclear is a major issue. We believe that it is important to understand the current situation to improve the evaluation method. Therefore, this study aimed to determine the reliability of tactile evaluations of bare skin and examine the following: (a) differences in reliability among attributes (i.e., smoothness, elasticity, softness, and moisturization) and (b) the difference in reliability between the attributes with and without training. In addition, to investigate the consistency of the sensory evaluation with the physical quantities obtained by skin measurement instruments, we also report the correlation coefficients between these quantities following earlier studies [
22,
23].
2. Materials and Methods
The study was approved by the Human Study Ethics Committee of the Shiseido Global Innovation Center (Study No. C02205, C02206). Written informed consent was obtained from the 4 assessors and 22 participants of the study.
2.1. Assessors and Examinee
The assessors were two trained professional assessors (Assessors A and B) and two untrained researchers (Assessors C and D). Assessors A and B had 5 and 16 years of experience, respectively, at the time of the study. They occupationally perform the tactile sensory evaluation of skin and cosmetics and have tested more than several hundred people in the past. There were no other assessors as experienced as these two in the authors’ institute. Only a few professional assessors routinely perform sensory evaluations of bare skin. In contrast, Assessors C and D had never conducted the tactile sensory evaluation of skin at their workplaces. The examinees were 22 women aged 25–57 years.
2.2. Reproducibility Test for Sensory Evaluation
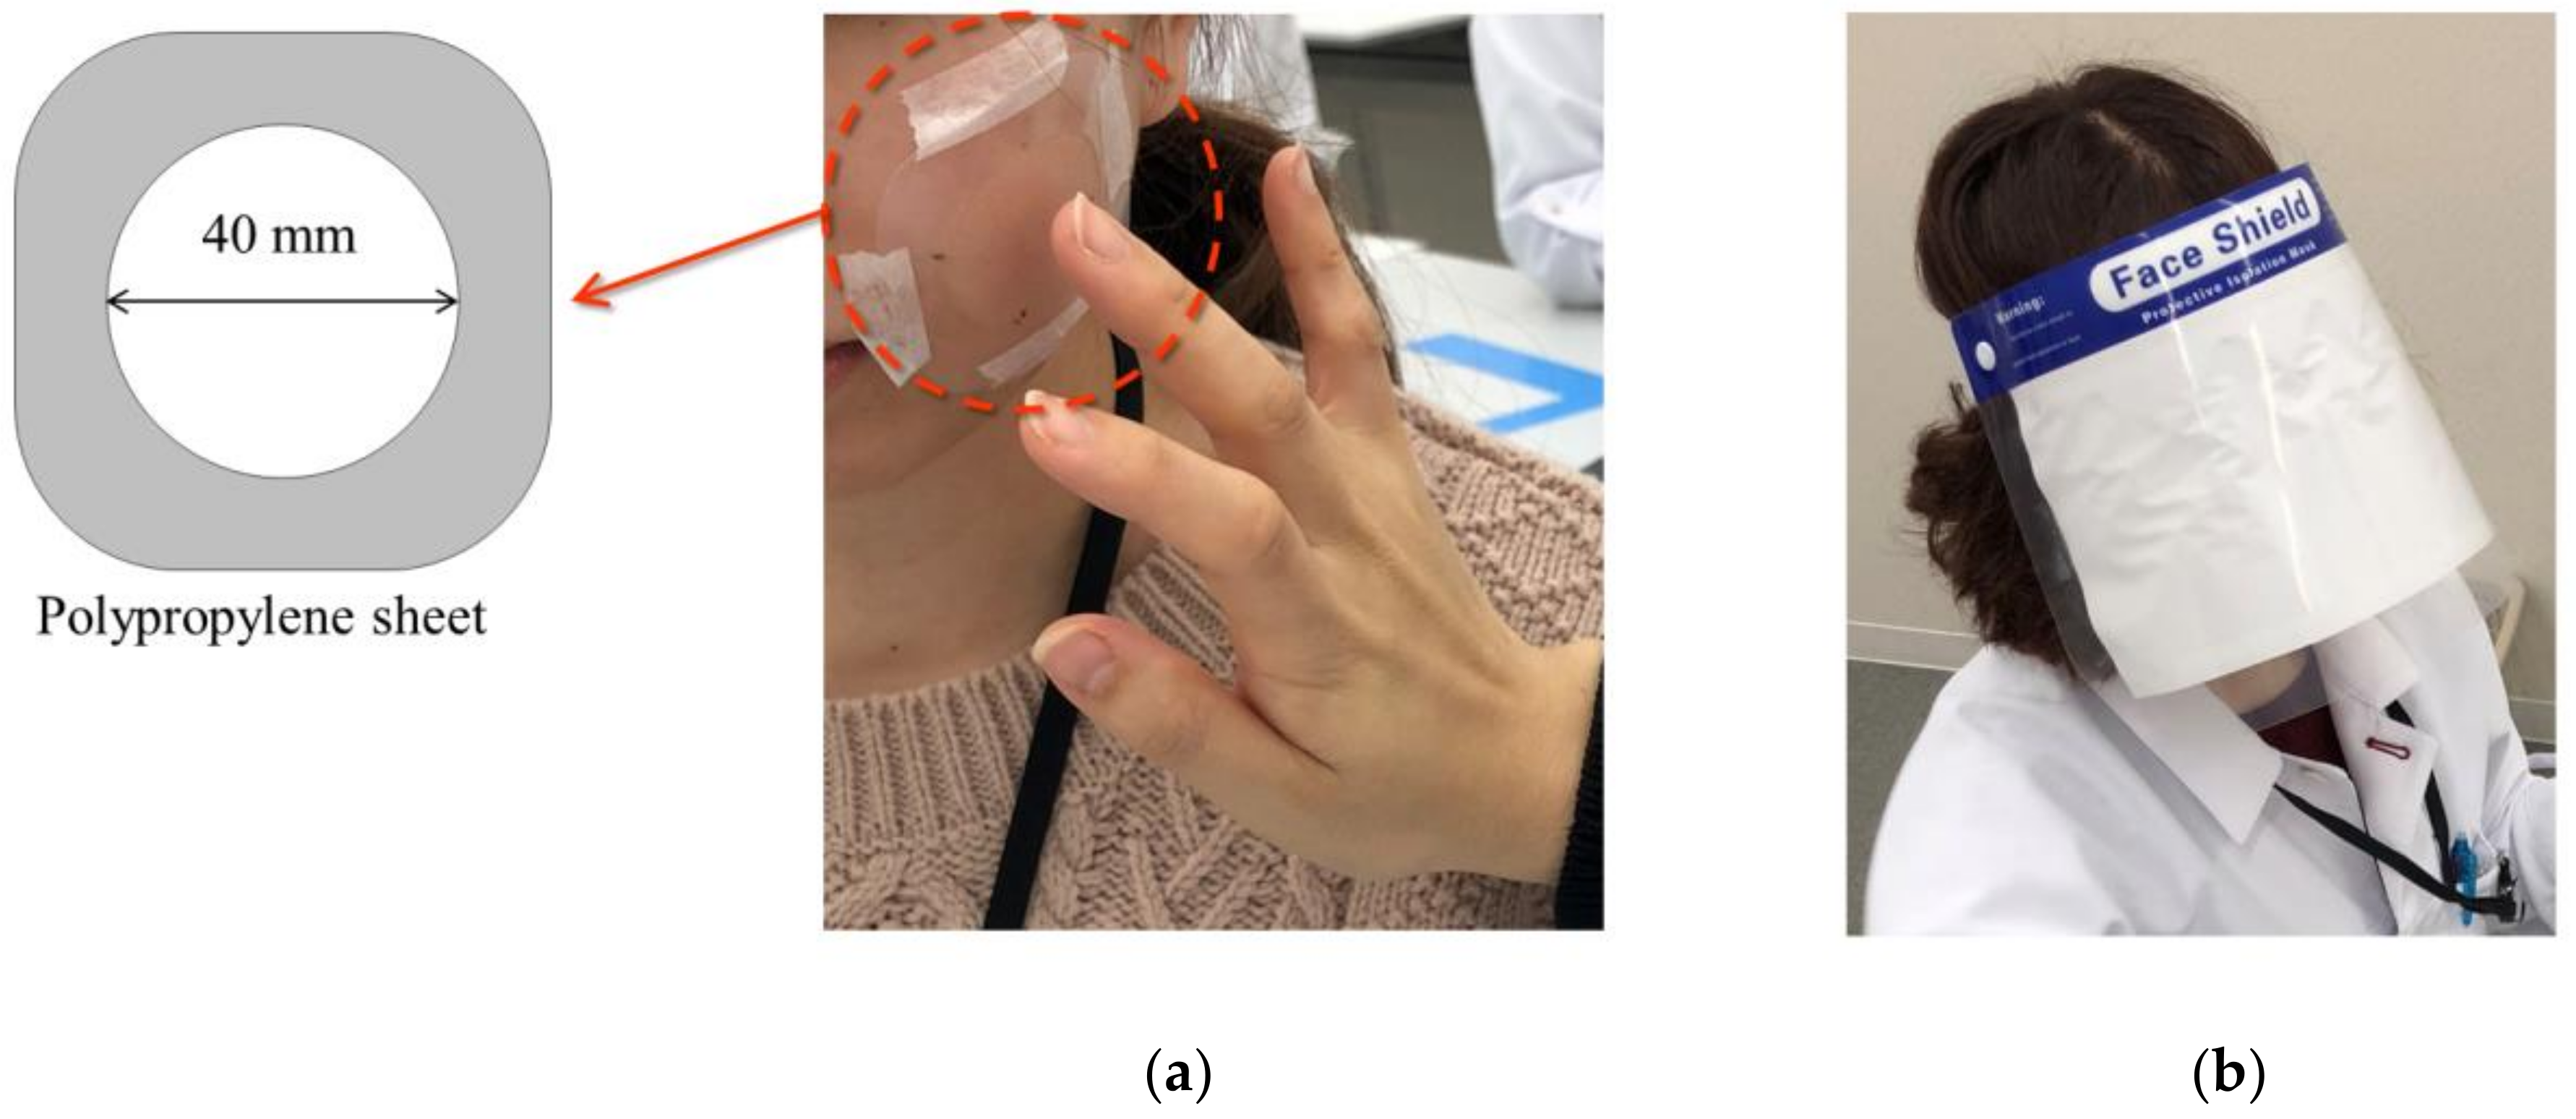
The evaluation site was a 40 mm diameter area on the left cheek next to the nose, and the area was masked with a 0.2 mm thick polypropylene sheet (
Figure 1a). The assessors were blindfolded using a face shield to eliminate any visual effects. Normally, expert assessors are not blindfolded when assessing bare skin; however, in this experiment, they were blindfolded to prevent the examinee from being identified (
Figure 1b). Assessors practiced in advance in sensory evaluation while being blindfolded. As the assessors could not visually check the evaluation site, the examinee guided the assessor’s hand to the evaluation site.
The experiment was performed over three days with 6–8 examinees per day. Examinees removed their makeup and washed their face before the test, and the sensory evaluation was started 5–10 min after washing their face. The same examinee was tested twice in a blind manner. For example, in one day, eight examinees joined the evaluation; however, the assessors did not know how many examinees there were or how many times each examinee was evaluated. The same examinee was never evaluated twice by the same assessor in a row. For each examinee, the second test was conducted within 30 min after the first test. This design was to prevent temporal changes in the skin condition after cleansing. The test was conducted in a thermo-hydrostatic chamber set at a room temperature of 23 °C and a relative humidity of 45%.
2.3. Sensory Evaluation of Bare Skin
We adopted the sensory evaluation method used by the authors’ group. The evaluation attributes were
smooth–rough,
elastic–not elastic,
soft–hard (
surface),
soft–hard (base),
moisturized–dry, and
oily–not oily.
Elastic–not elastic referred to stiffness or restoring force of the skin, removing the effect of viscosity.
Soft–hard (
surface) referred to softness up to a depth of approximately 2 mm, and
soft–hard (base) referred to softness up to a depth of approximately 5 mm. The definitions provided to the panel are listed in
Table 1. They were presented in Japanese and English. These attributes are typically used in the sensory evaluation of skin [
13,
24,
25,
26], except for the two types of softness.
Of the six evaluation attributes, four were evaluated referring to artificial skin models, and the remaining two were evaluated without such models. Two sets, each of which was composed of four models, were used as references. One set was the reference for the smooth–rough evaluation, which was made of urethane from a plaster mold of the cheek. Each had a cylindrical shape with a diameter of 45 mm and a height of 6 mm. The other reference set was used to evaluate soft–hard (surface), soft–hard (base), and elastic–not elastic. They were cylindrical urethane with diameters of 50 mm and heights of 15 mm. Both reference models were created under the supervision of experienced expert assessors so that the score for each attribute had an even distribution across four levels. Non-disclosure agreements with the manufacturer of these skin models preclude us from providing details on how the artificial skin models were created.
The evaluation was conducted using a scale of 0–5 points, with 11 steps of 0.5 points each. Hand movements for the evaluation were not controlled, and the assessor adopted movements that were easy to evaluate.
2.4. Instrumental Measurements of Skin
Physical conditions of skin were measured after the sensory evaluation tasks.
The state of the furrow of the skin surface was investigated using a video microscope. The amount of furrow and image features representing the non-uniformity of the furrow were obtained from the captured images [
27]. The amount of furrow is the number of black dots in the binarized image in which the skin grooves are blackened. The non-uniformity of the furrow is defined as the coefficient of variation in the number of black dots in each square when the acquired image is divided into
squares, with larger values indicating non-uniformity and smaller values indicating uniformity. The average value was obtained from three measurements taken in the area where the sensory evaluation was conducted.
A Corneometer CM 825 (Courage & Khazaka, Cologne, Germany) and a Skicon-200EX (Yayoi Co., Ltd., Tokyo, Japan) were used to measure the water content of the left cheeks. Measurements were repeated five times, and their arithmetic mean was calculated.
Skin viscoelasticity was evaluated using a Cutometer CT580 (Courage & Khazaka) with a 2 mm suction diameter and a suction pressure of 400 mbar. Twelve parameters defined in [
28] (i.e.,
R0–9 and
F0–1) were recorded for later analyses.
2.5. Analysis
We removed some outliers before the main analyses. For each physical parameter of skin, the examinees whose ratings were outside the mean plus or minus twice the standard deviation among all the examinees were excluded as outliers. Each examinee was tested twice by the same assessor; hence, for individual assessors, examinees for which the difference between the first and second ratings of each attribute was more than twice the standard deviation among all assessors were excluded as outliers [
29]. Based on these criteria, out of 88 trials (22 examinees
four assessors),
smooth–rough and
moisturized–dry were removed as outliers in five trials, and
elastic–not elastic,
soft–hard (
surface), and
soft–hard (
base) in seven trials.
To seek consistency and reliability between the sensory evaluation and physical parameters of skins, we calculated their Pearson’s correlation coefficients. For this calculation, the mean ratings among the four assessors were used. Regarding
smooth–rough, the correlation coefficients were calculated with two parameters acquired by a video microscope [
27]. Regarding
moisturized–dry, correlations with the Corneometer CM 825 and Skicon-200EX values were calculated. Further, the correlation coefficients between each of the
elastic–not elastic,
soft–hard (
surface), and
soft–hard (
base) ratings and each of the twelve parameters provided by the Cutometer CT580 were calculated.
Pearson’s correlation coefficients were calculated for each assessor’s first and second scores to evaluate the reproducibility within assessors. Additionally, Pearson’s correlation coefficient between the two assessors was calculated by using the mean of each examinee’s first and second scores to evaluate the reproducibility between the two assessors. The interpretation of the correlation coefficient is described in
Table 2 [
30].
Correlation coefficients can be used to check whether the two data are in a linear relationship, but they cannot evaluate whether the data agree. Therefore, we calculated ICCs. The ICCs were classified into three categories [
31]. In this study, ICC (1,1) and ICC (1,2) of Case 1 were calculated as indices of intra-assessor reliability. ICC (1,2) indicates the reliability when the average of two evaluations is used.
The ICC (2,1) and ICC (2,2) for Case 2 and ICC (3,1) and ICC (3,2) for Case 3 were calculated as indices of inter-assessor reliability. Note that Case 2 required an absolute score agreement among assessors, while Case 3 was unaffected by assessment biases. The criteria used for ICCs are listed in
Table 3 [
32]. The average of two evaluations by each assessor was used for the calculations of Cases 2 and 3. SPSS Statistics (version 23, IBM, Armonk, NY, USA) was used to calculate ICCs. The level of significance was set at
p < 0.05.
3. Results
Table 4 shows the results of the evaluation of the furrow of the skin surface, including the mean, standard deviation, maximum, and minimum values for the participants, as well as the correlation coefficient with the
smooth–rough score. The furrow condition differed among the participants. The correlation coefficients between
smooth and rough and the number and nonuniformity of creases were −0.40 (
p = 0.065) and 0.46 (
p = 0.030), respectively.
Table 5 shows the mean, standard deviation, maximum, and minimum values of moisture indices for the participants, as well as the correlation coefficient with the
moisturized–dry scores. The correlation coefficients between
moisturized–dry scores and Corneometer CM 825 and Skicon-200EX values were −0.22 (
p = 0.323) and −0.61 (
p = 0.003), respectively.
Table 6 shows the results of skin viscoelasticity measurements, including the mean, standard deviation, maximum and minimum values among the examinees, as well as the correlation coefficients between
elastic–not elastic,
soft–hard (
surface), and
soft–hard (
base).
Elastic–not elastic was significantly correlated with
R1 (−0.46,
p = 0.03),
R2 (0.47,
p = 0.026), and
R4 (−0.45,
p =0.037) of the Cutometer parameters.
Soft–hard (
surface) was significantly correlated with
R0 (−0.49,
p = 0.021),
R3 (−0.45,
p = 0.035),
R8 (−0.51,
p = 0.016), and
F1 (−0.53,
p = 0.012). None of the correlations for
soft–hard (
base) were significant whereas the correlations with
R8 and
F1 were relatively high at −0.40 (
p = 0.066) and −0.41 (
p =0.055), respectively.
The scatter plots of the first and second scores for each attribute and assessor are presented in
Figure 2. The results for
oily–not oily were excluded from the analysis because the corresponding scores were almost zero. This may be attributed to the fact that all examinees were women, and the evaluation was performed immediately after washing the face, which resulted in less sebum overall.
Pearson’s correlation coefficients for the first and second scores of each assessor are shown in
Table 7 (top). Regarding the mean values of the intra-assessor correlation coefficients among the four assessors,
smooth–rough exhibited the highest value of 0.77. Conversely, the value of
moisturized–dry was the lowest with a moderate correlation of 0.52. The other attributes exhibited strong correlations ranging from 0.63–0.68.
When assessors A and B, who were expert assessors, were compared with assessors C and D, who were untrained assessors, no clear differences were found in intra-assessor correlation values. For all assessors, the correlation for smooth–rough was very large (i.e., 0.95 for assessor A). For assessor A, it was weak for elastic–not elastic and moderate for the other attributes. For assessor B, only the correlation for moisturized–dry was moderate, whereas the correlations for the other attributes were strong or very strong. Assessor C exhibited strong correlations for all items and high intra-assessor reproducibility. Assessor D exhibited low values for smooth–rough and moisturized–dry.
The bottom of
Table 7 shows the inter-assessor correlation coefficients. The mean correlation coefficient for
smooth–rough was highest at 0.81. The second highest inter-assessor correlation was 0.58 for
elastic–not elastic; those for the other attributes were smaller than 0.36. The correlation coefficient for the expert assessors (A and B) averaged across all attributes was 0.38, which was not largely different from those of other combinations of assessors.
Table 8 shows the ICC (1,1) and ICC (1,2) values. The mean value among the four assessors was highest for
smooth–rough (0.77), lowest for
moisturized–dry (0.53), and greater than 0.6 for the other attributes. For assessor A,
smooth–rough was almost perfect, but the other attributes were below moderate values. For assessor B, only
moisturized–dry was moderate, and all other attributes scored greater than 0.61 and were substantial. For assessor C, all the attributes were above substantial. Assessor D exhibited low scores for
smooth–rough and
moisturized–dry. Overall, the ICC (1,2) value increased compared to the ICC (1,1) value.
Table 9 shows the results of ICC (2,1) and ICC (2,2). The mean ICC (2,1) of
smooth–rough was 0.64, which was a substantial agreement. The mean ICC (2,1) of
elastic–not elastic was 0.51 with a moderate agreement. The values for
soft–hard (surface) and
soft–hard (base) were 0.27 and 0.23, respectively, with a fair agreement.
Moisturized–dry exhibited the lowest mean value of 0.17. The reliability, or ICC (2,1), for the expert assessors (A and B) averaged over all attributes was 0.34, which was not largely different from that of other combinations of assessors. The values of ICC (2,2) were higher than those of ICC (2,1), and the means of
smooth–rough and
elastic–not elastic were substantial and that of
soft–hard (
surface) was moderate. The mean ICC (2,2) values for
soft–hard (
base) and
moisturized–dry were fair.
4. Discussion
We tested the reliability of sensory evaluations of tactile sensation on bare skin, for which little public information was available. As there was no publicly available information to begin with, the results obtained in this study will be useful for conducting reliable sensory evaluations of tactile sensation on skin in the future.
There was a moderate correlation between the instrumental measurement values and scores for each attribute. As in
Table 4, the non-uniform distribution of skin furrows led to the judgment of roughness.
Moisturized–dry exhibited a low correlation with Corneometer CM825 values, but a high correlation with Skicon-200EX values. This may be because of differences in their measurement principles. The Skicon-200EX is considered more suitable for the surface moisture content of the skin than the Corneometer CM825 [
33].
Elastic–not elastic was correlated with
R1,
R2,
R4, and
R5 calculated from the Cutometer CT580.
R1 and
R4 indicate the magnitudes of residual deformation at the first and second relaxation, respectively.
R2 is the proportion of the elastic recovery of skin deformation after relaxation.
R5 is the ratio of the amount of elastic deformation during suction to the amount of immediate recovery during relaxation.
R2 and
R5 are related to elasticity.
Soft–hard (
surface) and
soft–hard (
base) were correlated with
R0,
R3,
R8, and
F1.
R0 and
R3 represent the first and second maximum suctions, respectively.
R8 is the amount of recovery during relaxation, and
F1 is defined as the area of the waveform showing the time variation in the amount of suction during relaxation, with a smaller area indicating more elastic or less viscous properties. These correlations between the sensory evaluation ratings and instrumental values indicate that the assessors’ sensory evaluations captured the physical aspects of human skin.
The inter-assessor reliability was not very high for softness or moistness in the present experiment. This could be in part attributed to the individual differences in the assessors’ finger conditions. Previous studies have reported that differences in finger size and stiffness affect the perception of softness [
34,
35]. Therefore, the inter-assessor reliability of softness may be reduced by individual differences in finger size and stiffness. It is also known that finger moisture content affects friction, and that friction is associated with sensory evaluation of moistness [
36,
37,
38,
39,
40,
41]. Adhesion friction, which is thought to be the major force of friction when touching skin with a finger, is expressed as the product of the contact area and the shear strength of the adhesive surface. Different moisture contents of the fingers may result in a different adhesion force and softness of the skin surface [
39], which in turn changes the contact area. Therefore, the friction generated by different assessors may differ, resulting in a decrease in inter-assessor reliability of moistness [
42,
43,
44].
The agreement between the trained assessors was similar to that between the untrained assessors. After the test, expert evaluator A commented that the evaluation was more difficult than usual because the skin on her fingers was rough and different from usual. This suggests that it is difficult for even expert assessors to make reliable evaluations depending on the condition of their fingers. Therefore, it is important to manage the condition of the assessors’ fingers by measuring the moisture content and stiffness at each assessment and training.
The values of ICC (1,2) and ICC (2,2) were greater than those of ICC (1,1) and ICC (2,1) suggesting that reliability can be improved by using the average of two repetitions. To improve the reliability of soft–hard (surface), soft–hard (base), and moisturized–dry, which exhibited low reliability in this study, the number of evaluation trials by the same panelists will need to be increased.
The following suggestions are made based on the results of this study: (a) soft–hard (surface), soft–hard (base), and moisturized–dry are attributes that require intensive training; (b) the condition of assessors’ fingers should be thoroughly managed during evaluation and training; and (c) the evaluation should be repeated two or more times and the average value should be used as the score.
The greatest limitation of the study is the small number of panelists in the experiment. For this study, we did not employ and train novice panelists. Instead, we employed two experts with occupational experience of at least five years. It is true that this small sample size limits the generalizability of the study. However, our purpose was to investigate the reliability of such experts’ sensory evaluation, and only two such experts were found in the authors’ institution. A complementary study needs to be performed in the future in which more panelists are trained to investigate their reliability. However, such trained panelists would not be deemed experts.


