
Analysis of Prohibited and Restricted Ingredients in Cosmetics


Abstract
:1. Introduction
2. Regulatory Overview
3. Bithionol
4. Formaldehyde

| No. | Sample | Derivatization Agents | Extraction Method | Analytical Method | LOD | LOQ | Linearity (Correlation Coefficient) | Accuracy/Precision | Ref. |
|---|---|---|---|---|---|---|---|---|---|
| 1. | Cosmetic product (fixative gels, body moisturizer, hand cream, hair conditioner, shampoo, and shower gel | 0.100% acetylacetone | GDME (gas-diffusion microextraction) | Spectrophotometry | 0.150 mg/kg | 0.500 mg/kg | 0.9999 | - | [24] |
| 0.100% acetylacetone | GDME (gas-diffusion microextraction) | Smartphone reader | 0.200 | 0.500 | 0.9985 | - | |||
| 2. | Semi-solid and liquid hair cosmetics | Sulfite | Ultrasound-assisted cloud-point extraction | Spectrophotometry | 0.38 μg/L | 1.26 μg/L | 0.9965 | - | [83] |
5. Cadmium
6. Color Additives
7. Zirconium-Containing Complexes
8. Chloroform
9. Halogenated Salicylanilides
10. Hexachlorophene
11. Coumarin
12. Furocoumarin
13. Mercury Compound
14. Conclusions
Author Contributions
Funding
Institutional Review Board Statement
Informed Consent Statement
Data Availability Statement
Conflicts of Interest
References
- FDA Cosmetics. Available online: https://www.fda.gov/industry/regulated-products/cosmetics-overview#:~:text=The%20FDA%20defines%20a%20cosmetic,attractiveness%2C%20or%20altering%20the%20appearance (accessed on 6 May 2022).
- Halla, N.; Fernandes, I.P.; Heleno, S.A.; Costa, P.; Boucherit-Otmani, Z.; Boucherit, K.; Rodrigues, A.E.; Ferreira, I.C.F.R.; Barreiro, M.F. Cosmetics Preservation: A Review on Present Strategies. Molecules 2018, 23, 1571. [Google Scholar] [CrossRef] [PubMed]
- European Parliament. Council of the Eruropean Union Regulation (EC) No 1223/2009 of the European Parliament and of the Council on Cosmetic Products. Available online: https://eur-lex.europa.eu/legal-content/EN/TXT/PDF/?uri=CELEX:02009R1223-20220301&from=EN (accessed on 7 August 2022).
- Mitsui, T. New Cosmetic Science; Elsevier: Amsterdam, The Netherlands, 1997. [Google Scholar]
- Bezerra, K.G.O.; Rufino, R.D.; Luna, J.M.; Sarubbo, L.A. Saponins and microbial biosurfactants: Potential raw materials for the formulation of cosmetics. Biotechnol. Prog. 2018, 34, 1482–1493. [Google Scholar] [CrossRef] [PubMed]
- Dreger, M.; Wielgus, K. Application of essential oils as natural cosmetic preservatives. Herba Pol. 2013, 59, 142–156. [Google Scholar] [CrossRef]
- Maurício, E.; Rosado, C.; Duarte, M.P.; Verissimo, J.; Bom, S.; Vasconcelos, L. Efficiency of Nisin as Preservative in Cosmetics and Topical Products. Cosmetics 2017, 4, 41. [Google Scholar] [CrossRef]
- Kaličanin, B.; Velimirović, D. A Study of the Possible Harmful Effects of Cosmetic Beauty Products on Human Health. Biol. Trace Element Res. 2016, 170, 476–484. [Google Scholar] [CrossRef]
- Kesslen, B. California Woman in Semi-Comatose State Due to Mercury Poisoning from Mexican Skin Cream. Available online: https://www.nbcnews.com/news/us-news/california-woman-semi-comatose-state-due-mercury-poisoning-mexican-skin-n1052961 (accessed on 18 June 2022).
- Gbetoh, M.H.; Amyot, M. Mercury, hydroquinone and clobetasol propionate in skin lightening products in West Africa and Canada. Environ. Res. 2016, 150, 403–410. [Google Scholar] [CrossRef]
- Michalek, I.M.; Benn, E.K.; dos Santos, F.L.C.; Gordon, S.; Wen, C.; Liu, B. A systematic review of global legal regulations on the permissible level of heavy metals in cosmetics with particular emphasis on skin lightening products. Environ. Res. 2019, 170, 187–193. [Google Scholar] [CrossRef]
- Pramanik, S.; Kumar, M.; Qureshi, A. Mercury in skin-care products in India and consumer exposure risks. Regul. Toxicol. Pharmacol. 2021, 121, 104870. [Google Scholar] [CrossRef]
- Health Sciences Authority Guidelines for Safety Evaluation of Cosmetic Products. Available online: https://www.hsa.gov.sg/cosmetic-products/asean-cosmetic-directive (accessed on 5 July 2022).
- Briliana, V.; Mursito, N. Exploring antecedents and consequences of Indonesian Muslim youths’ attitude towards halal cosmetic products: A case study in Jakarta. Asia Pac. Manag. Rev. 2017, 22, 176–184. [Google Scholar] [CrossRef]
- Sugibayashi, K.; Yusuf, E.; Todo, H.; Dahlizar, S.; Sakdiset, P.; Arce, F.J.; See, G.L. Halal Cosmetics: A Review on Ingredients, Production, and Testing Methods. Cosmetics 2019, 6, 37. [Google Scholar] [CrossRef]
- FDA Prohibited & Restricted Ingredients in Cosmetics. Available online: https://www.fda.gov/cosmetics/cosmetics-laws-regulations/prohibited-restricted-ingredients-cosmetics (accessed on 7 August 2022).
- FDA FDA Authority Over Cosmetics: How Cosmetics Are Not FDA-Approved, but Are FDA-Regulated. Available online: https://www.fda.gov/cosmetics/cosmetics-laws-regulations/fda-authority-over-cosmetics-how-cosmetics-are-not-fda-approved-are-fda-regulated (accessed on 7 August 2022).
- Scientific Committee on Consumer Safety. The Sccs Notes of Guidance for the Testing of Cosmetic Ingredients and Their Safety Evaluation 11th Revision. Regul. Toxicol. Pharmacol. 2021, 127, 105052. [Google Scholar]
- Park, J.-D.; Zheng, W. Human Exposure and Health Effects of Inorganic and Elemental Mercury. J. Prev. Med. Public Health 2012, 45, 344–352. [Google Scholar] [CrossRef] [PubMed]
- Aronson, J.K. Meyler’s Side Effects of Drugs: The International Encyclopedia of Adverse Drug Reactions and Interactions, 16th ed.; Elsevier: Amsterdam, The Netherlands, 2015. [Google Scholar]
- Groot, A.C.D. Monographs in Contact Allergy, Volume 1: Non-Fragrance Allergens in Cosmetics; CRC Press: London, UK, 2018. [Google Scholar]
- Zheng, Z.; Li, X.; Gao, F.; Liu, H.; Gao, Y. A sweeping-micellar electrokinetic chromatography method for the detection of three chlorophenols in cosmetic samples. Acta Chromatogr. 2021, 33, 387–393. [Google Scholar] [CrossRef]
- Kim, K.-H.; Jahan, S.A.; Lee, J.-T. Exposure to Formaldehyde and Its Potential Human Health Hazards. J. Environ. Sci. Health Part C 2011, 29, 277–299. [Google Scholar] [CrossRef]
- Lamarca, R.S.; Luchiari, N.D.C.; Bonjorno, A.F.; Filho, J.P.; Cardoso, A.A.; Gomes, P.C.F.D.L. Determination of formaldehyde in cosmetic products using gas-diffusion microextraction coupled with a smartphone reader. Anal. Methods 2019, 11, 3697–3705. [Google Scholar] [CrossRef]
- Suhardiana, E.; Endah, S.R.N. Validation of The Cadmium Analysis Method (Cd) by Atomic Absorption Spectrophotometry in Traditional Scrub. J. Midpro 2021, 12, 311–318. [Google Scholar] [CrossRef]
- Saadatzadeh, A.; Afzalan, S.; Zadehdabagh, R.; Tishezan, L.; Najafi, N.; SeyedTabib, M.; Noori, S.M.A. Determination of heavy metals (lead, cadmium, arsenic, and mercury) in authorized and unauthorized cosmetics. Cutan. Ocul. Toxicol. 2019, 38, 207–211. [Google Scholar] [CrossRef]
- Chisvert, A. Salvador Colouring Agents in Decorative and Other Cosmetics. Analytical Methods. In Analysis of Cosmetic Products, 1st ed.; Elsevier: Amsterdam, The Netherlands, 2007. [Google Scholar]
- Platzek, T. Overview on toxicity and exposure to azo dyes and aromatic amines. Toxicol. Lett. 2013, 221, S53. [Google Scholar] [CrossRef]
- Chequer, F.M.D.; Venâncio, V.D.P.; Prado, M.R.D.S.; Junior, L.R.C.D.S.E.C.; Lizier, T.M.; Zanoni, M.V.B.; Burbano, R.R.; Bianchi, M.L.P.; Antunes, L.M.G. The cosmetic dye quinoline yellow causes DNA damage in vitro. Mutat. Res. Genet. Toxicol. Environ. Mutagen. 2015, 777, 54–61. [Google Scholar] [CrossRef]
- Desiderio, C.; Marra, C.; Fanali, S. Quantitative analysis of synthetic dyes in lipstick by micellar electrokinetic capillary chromatography. Electrophoresis 1998, 19, 1478–1483. [Google Scholar] [CrossRef]
- Miranda-Bermudez, E.; Harp, B.P.; Barrows, J.N. Qualitative Identification of Permitted and Non-permitted Color Additives in Cosmetics. J. AOAC Int. 2014, 97, 1039–1047. [Google Scholar] [CrossRef] [PubMed]
- Guerra, E.; Llompart, M.; Garcia-Jares, C. Miniaturized matrix solid-phase dispersion followed by liquid chromatography-tandem mass spectrometry for the quantification of synthetic dyes in cosmetics and foodstuffs used or consumed by children. J. Chromatogr. A 2017, 1529, 29–38. [Google Scholar] [CrossRef] [PubMed]
- Guerra, E.; Alvarez-Rivera, G.; Llompart, M.; Garcia-Jares, C. Simultaneous determination of preservatives and synthetic dyes in cosmetics by single-step vortex extraction and clean-up followed by liquid chromatography coupled to tandem mass spectrometry. Talanta 2018, 188, 251–258. [Google Scholar] [CrossRef]
- Chen, M.; Bai, H.; Zhai, J.; Meng, X.; Guo, X.; Wang, C.; Wang, P.; Lei, H.; Niu, Z.; Ma, Q. Comprehensive screening of 63 coloring agents in cosmetics using matrix solid-phase dispersion and ultra-high-performance liquid chromatography coupled with quadrupole-Orbitrap high-resolution mass spectrometry. J. Chromatogr. A 2019, 1590, 27–38. [Google Scholar] [CrossRef]
- Nevitasari, R.; Rohman, A.; Martono, S. Validation and Quantitative Analysis of Carmine and Rhodamine B in Lipstick Formulation. Int. J. Appl. Pharm. 2019, 11, 176–180. [Google Scholar] [CrossRef]
- MAK Value Documentation Zirconium and Its Compounds [MAK Value Documentation, 1999]. MAK-Collect. Occup. Health Saf. 2012, 12, 224–236. [CrossRef]
- Beavin, P. Colorimetric Determination of Zirconium in Antiperspirant Aerosols. J. AOAC Int. 1976, 59, 830–834. [Google Scholar] [CrossRef]
- U.S. Government Information 21 CFR 700.18-Use of Chloroform as an Ingredient in Cosmetic Products. Available online: https://www.govinfo.gov/app/details/CFR-2013-title21-vol7/CFR-2013-title21-vol7-sec700-18/context (accessed on 29 April 2022).
- Stutsman, M.J. Gas-Liquid Chromatographic Determination of Chloroform in Toothpastes, Using the Headspace Analytical Technique. J. AOAC Int. 1974, 57, 560–562. [Google Scholar] [CrossRef]
- U.S. Government Information 21 CFR 700.15-Use of Certain Halogenated Salicylanilides as Ingredients in Cosmetic Products. Available online: https://www.govinfo.gov/app/details/CFR-2013-title21-vol7/CFR-2013-title21-vol7-sec700-15 (accessed on 11 May 2022).
- Li, S.; Liu, X.; Zhang, Y.; Lin, S.; Huang, J.; Li, X.; Guo, X.; Xian, Y.; Dong, H. Determination of seven restricted halogenated salicylanilides in cosmetics by high performance liquid chromatography. Anal. Methods 2016, 8, 5129–5135. [Google Scholar] [CrossRef]
- Lin, S.; Xian, Y.; Xun, Z.; Li, S.; Liu, X.; Du, W.; Huang, J.; Guo, X.; Dong, H. Solid-phase extraction coupled with ultra performance liquid chromatography tandem mass spectrometry to determine seven halogenated salicylanilides in cosmetics. RSC Adv. 2016, 6, 49011–49018. [Google Scholar] [CrossRef]
- U.S. Government Information 21 CFR § 250.250-Hexachlorophene, as a Component of Drug and Cosmetic Products. Available online: https://www.govinfo.gov/app/details/CFR-2021-title21-vol4/CFR-2021-title21-vol4-sec250-250 (accessed on 11 May 2022).
- Liu, R.; Liu, Y.; Cheng, C.; Yang, Y. Magnetic Solid-Phase Extraction and Ionic Liquid Dispersive Liquid–Liquid Microextraction Coupled with High-Performance Liquid Chromatography for the Determination of Hexachlorophene in Cosmetics. Chromatographia 2017, 80, 783–791. [Google Scholar] [CrossRef]
- Li, X.; Gao, F.; Liu, H.; Gao, Y. Determination of hexachlorophene in cosmetics by capillary electrophoresis compared with high performance liquid chromatography. Acta Chromatogr. 2020, 33, 44–50. [Google Scholar] [CrossRef]
- Ma, Q.; Xi, H.; Ma, H.; Meng, X.; Wang, Z.; Bai, H.; Li, W.; Wang, C. Simultaneous Separation and Determination of 22 Coumarin Derivatives in Cosmetics by UPLC-MS/MS. Chromatographia 2015, 78, 241–249. [Google Scholar] [CrossRef]
- Devos, C.; Ochiai, N.; Sasamoto, K.; Sandra, P.; David, F. Full evaporation dynamic headspace in combination with selectable one-dimensional/two-dimensional gas chromatography–mass spectrometry for the determination of suspected fragrance allergens in cosmetic products. J. Chromatogr. A 2012, 1255, 207–215. [Google Scholar] [CrossRef]
- Stiefel, C.; Schubert, T.; Morlock, G.E. Bioprofiling of Cosmetics with Focus on Streamlined Coumarin Analysis. ACS Omega 2017, 2, 5242–5250. [Google Scholar] [CrossRef]
- Arigò, A.; Dugo, P.; Rigano, F.; Mondello, L. Linear retention index approach applied to liquid chromatography coupled to triple quadrupole mass spectrometry to determine oxygen heterocyclic compounds at trace level in finished cosmetics. J. Chromatogr. A 2021, 1649, 462183. [Google Scholar] [CrossRef]
- Melough, M.M.; Cho, E.; Chun, O.K. Furocoumarins: A review of biochemical activities, dietary sources and intake, and potential health risks. Food Chem. Toxicol. 2018, 113, 99–107. [Google Scholar] [CrossRef]
- International Fragrance Association (IFRA). Information Letter 799; International Fragrance Association (IFRA): Geneva, Switzerland, 2008; pp. 1–2. [Google Scholar]
- Corbi, E.; Pérès, C.; David, N. Quantification of furocoumarins in hydroalcoholic fragrances by a liquid chromatography-high resolution/accurate mass method. Flavour Fragr. J. 2014, 29, 173–183. [Google Scholar] [CrossRef]
- Kreidl, M.; Rainer, M.; Jakschitz, T.; Bonn, G.K. Determination of phototoxic furanocoumarins in natural cosmetics using SPE with LC-MS. Anal. Chim. Acta 2019, 1101, 211–221. [Google Scholar] [CrossRef]
- U.S. Government Information 21 CFR 700.13-Use of Mercury Compounds in Cosmetics Including Use as Skinbleaching Agents in Cosmetic Preparations Also Regarded as Drugs. Available online: https://www.govinfo.gov/app/details/CFR-2021-title21-vol7/CFR-2021-title21-vol7-sec700-13 (accessed on 11 May 2022).
- Wang, Y.; Yang, H.; Pschenitza, M.; Niessner, R.; Li, Y.; Knopp, D.; Deng, A. Highly sensitive and specific determination of mercury(II) ion in water, food and cosmetic samples with an ELISA based on a novel monoclonal antibody. Anal. Bioanal. Chem. 2012, 403, 2519–2528. [Google Scholar] [CrossRef]
- Podgórska, A.; Puścion-Jakubik, A.; Grodzka, A.; Naliwajko, S.; Markiewicz-Żukowska, R.; Socha, K. Natural and Conventional Cosmetics—Mercury Exposure Assessment. Molecules 2021, 26, 4088. [Google Scholar] [CrossRef]
- Dwijayanti, E. Susanti Analysis of Mercury (Hg) in Whitening Cream Distributed in Palu City by Atomic Absorption Spectroscopy. J. Appl. Chem. Sci. 2018, 2018, 430–433. [Google Scholar] [CrossRef]
- Liu, S.; Zhang, P.; Liu, H.; Wang, W.; Lian, K. Determination of Trace Mercury in Cosmetics by Suspension- Sampling Hydride Generation Atomic Fluorescence Spectrometry. Asian J. Chem. 2013, 25, 7315–7318. [Google Scholar] [CrossRef]
- Chen, K.-L.; Jiang, S.-J.; Chen, Y.-L. Determining lead, cadmium and mercury in cosmetics using sweeping via dynamic chelation by capillary electrophoresis. Anal. Bioanal. Chem. 2017, 409, 2461–2469. [Google Scholar] [CrossRef]
- Wang, L.; Zhang, H. Mercury content in marketed cosmetics: Analytical survey in Shijiazhuang, China. Cutan. Ocul. Toxicol. 2014, 34, 322–326. [Google Scholar] [CrossRef]
- Bin Ho, Y.; Abdullah, N.H.; Hamsan, H.; Tan, E.S.S. Mercury contamination in facial skin lightening creams and its health risks to user. Regul. Toxicol. Pharmacol. 2017, 88, 72–76. [Google Scholar] [CrossRef]
- Safitri, E.; Irmawati, I.; Suhud, K.; Islami, N. Mercury Analysis of Body Lotion Cosmetic Using CVAAS Method: Case Study of Distributed Product in Banda Aceh. Indones. J. Fundam. Appl. Chem. 2020, 5, 35–41. [Google Scholar] [CrossRef]
- Peregrino, C.P.; Moreno, M.V.; Miranda, S.V.; Rubio, A.D.; Leal, L.O. Mercury Levels in Locally Manufactured Mexican Skin-Lightening Creams. Int. J. Environ. Res. Public Health 2011, 8, 2516–2523. [Google Scholar] [CrossRef]
- Ahmed, H.A.M.; Al-Qahtani, K.M.A.; Emara, H.; Janjua, M.N.; Alhafez, N.; Al-Otaibi, M.B. Determination of Some Heavy Metals in Eye Shadows Cosmetics. Asian J. Chem. 2017, 29, 1441–1446. [Google Scholar] [CrossRef]
- Prasertboonyai, K.; Liawraungrath, B.; Pojanakaroon, T.; Liawraungrath, S. Mercury(II) determination in commercial cosmetics and local Thai traditional medicines by flow injection spectrophotometry. Int. J. Cosmet. Sci. 2015, 38, 68–76. [Google Scholar] [CrossRef]
- Lu, Y.; Yu, J.; Ye, W.; Yao, X.; Zhou, P.; Zhang, H.; Zhao, S.; Jia, L. Spectrophotometric determination of mercury(II) ions based on their stimulation effect on the peroxidase-like activity of molybdenum disulfide nanosheets. Mikrochim. Acta 2016, 183, 2481–2489. [Google Scholar] [CrossRef]
- Alqadami, A.A.; Naushad, M.; Abdalla, M.A.; Khan, M.R.; Alothman, Z.A.; Wabaidur, S.M.; Ghfar, A.A. Determination of heavy metals in skin-whitening cosmetics using microwave digestion and inductively coupled plasma atomic emission spectrometry. IET Nanobiotechnol. 2017, 11, 597–603. [Google Scholar] [CrossRef] [PubMed]
- Salama, A.K. Assessment of metals in cosmetics commonly used in Saudi Arabia. Environ. Monit. Assess. 2016, 188, 1441–1446. [Google Scholar] [CrossRef]
- Gao, Y.; Shi, Z.; Zong, Q.; Wu, P.; Su, J.; Liu, R. Direct determination of mercury in cosmetic samples by isotope dilution inductively coupled plasma mass spectrometry after dissolution with formic acid. Anal. Chim. Acta 2014, 812, 6–11. [Google Scholar] [CrossRef]
- Jia, X.; Han, Y.; Wei, C.; Duan, T.; Chen, H. Speciation of mercury in liquid cosmetic samples by ionic liquid based dispersive liquid–liquid microextraction combined with high-performance liquid chromatography-inductively coupled plasma mass spectrometry. J. Anal. At. Spectrom. 2011, 26, 1380–1386. [Google Scholar] [CrossRef]
- Qudus, H.; Purwadi, P.; Holilah, I.; Hadi, S. Analysis of Mercury in Skin Lightening Cream by Microwave Plasma Atomic Emission Spectroscopy (MP-AES). Molecules 2021, 26, 3130. [Google Scholar] [CrossRef]
- Wang, W.; Bao, N.; Yuan, W.; Si, N.; Bai, H.; Li, H.; Zhang, Q. Simultaneous determination of lead, arsenic, and mercury in cosmetics using a plastic based disposable electrochemical sensor. Microchem. J. 2019, 148, 240–247. [Google Scholar] [CrossRef]
- Bohari, N.A.; Siddiquee, S.; Saallah, S.; Misson, M.; Arshad, S.E. Optimization and Analytical Behavior of Electrochemical Sensors Based on the Modification of Indium Tin Oxide (ITO) Using PANI/MWCNTs/AuNPs for Mercury Detection. Sensors 2020, 20, 6502. [Google Scholar] [CrossRef]
- Alqadami, A.A.; Abdalla, M.A.; Alothman, Z.A.; Omer, K. Application of Solid Phase Extraction on Multiwalled Carbon Nanotubes of Some Heavy Metal Ions to Analysis of Skin Whitening Cosmetics Using ICP-AES. Int. J. Environ. Res. Public Health 2013, 10, 361–374. [Google Scholar] [CrossRef]
- NCBI Bithionol. Available online: https://pubchem.ncbi.nlm.nih.gov/compound/Bithionol (accessed on 3 May 2022).
- Greenspoon, J.; Ahluwalia, R.; Juma, N.; Rosen, C.F. Allergic and Photoallergic Contact Dermatitis. Dermatitis 2013, 24, 29–32. [Google Scholar] [CrossRef]
- Agathokleous, E.; Calabrese, E.J. Formaldehyde: Another hormesis-inducing chemical. Environ. Res. 2021, 199, 111395. [Google Scholar] [CrossRef] [PubMed]
- Jackson, E. Formalehyde in Personal Care Products. Ski. Pharmacol. Physiol. 2012, 25, 236–240. [Google Scholar] [CrossRef] [PubMed]
- Cekhov, A. Determination of Free FormaldehydeiIn Cosmetic Products; Council of Europe: Strasbourg, France, 2016. [Google Scholar]
- Malinauskiene, L.; Blaziene, A.; Chomiciene, A.; Isaksson, M. Formaldehyde may be found in cosmetic products even when unlabelled. Open Med. 2015, 10, 323–328. [Google Scholar] [CrossRef]
- Yuniati, W.; Amelia, T.; Ibrahim, S.; Damayanti, S. Analytical Method Development for Determining Formaldehyde in Cream Cosmetics Using Hyphenated Gas Chromatography. ACS Omega 2021, 6, 28403–28409. [Google Scholar] [CrossRef]
- Miralles, P.; Chisvert, A.; Alonso, M.J.; Hernandorena, S.; Salvador, A. Determination of free formaldehyde in cosmetics containing formaldehyde-releasing preservatives by reversed-phase dispersive liquid–liquid microextraction and liquid chromatography with post-column derivatization. J. Chromatogr. A 2018, 1543, 34–39. [Google Scholar] [CrossRef] [PubMed]
- Temel, N.K.; Gürkan, R. Combination of Ultrasound-Assisted Cloud-Point Extraction with Spectrophotometry for Extraction, Preconcentration, and Determination of Low Levels of Free Formaldehyde from Cosmetic Products. J. AOAC Int. 2018, 101, 1763–1772. [Google Scholar] [CrossRef] [PubMed]
- NCBI Cadmium. Available online: https://pubchem.ncbi.nlm.nih.gov/compound/Cadmium (accessed on 29 April 2022).
- Bruzzoniti, M.C.; Abollino, O.; Pazzi, M.; Rivoira, L.; Giacomino, A.; Vincenti, M. Chromium, nickel, and cobalt in cosmetic matrices: An integrated bioanalytical characterization through total content, bioaccessibility, and Cr(III)/Cr(VI) speciation. Anal. Bioanal. Chem. 2017, 409, 6831–6841. [Google Scholar] [CrossRef] [PubMed]
- Borowska, S.; Brzóska, M.M. Metals in cosmetics: Implications for human health. J. Appl. Toxicol. 2015, 35, 551–572. [Google Scholar] [CrossRef]
- Godt, J.; Scheidig, F.; Grosse-Siestrup, C.; Esche, V.; Brandenburg, P.; Reich, A.; Groneberg, D.A. The toxicity of cadmium and resulting hazards for human health. J. Occup. Med. Toxicol. 2006, 1, 22. [Google Scholar] [CrossRef]
- Liu, Y.; Chu, Y.; Hu, Z.; Zhang, S.; Ma, S.; Khan, M.S.; Chen, F.; Zhang, D.; Guo, L.; Lau, C. High-sensitivity determination of trace lead and cadmium in cosmetics using laser-induced breakdown spectroscopy with ultrasound-assisted extraction. Microchem. J. 2020, 158, 105322. [Google Scholar] [CrossRef]
- Asra, R.; Rusdi; Yandra, R.B.; Nessa. Determination of Lead and Cadmium Added in Selected Lipstick Products Sold in Padang City Using Atomic Absorption Spectrophotometry. Indones. J. Pharm. Clin. Res. (IDJPCR) 2019, 2, 13–18. [Google Scholar] [CrossRef]
- Hahn, D.W.; Omenetto, N. Laser-Induced Breakdown Spectroscopy (LIBS), Part I: Review of Basic Diagnostics and Plasma—Particle Interactions: Still-Challenging Issues within the Analytical Plasma Community. Appl. Spectrosc. 2010, 64, 335A–336A. [Google Scholar] [CrossRef] [PubMed]
- Paudel, S.; Kumar, S.; Mallik, A. Atomic Absorption Spectroscopy: A Short Review. EPRA Int. J. Res. Dev. (IJRD) 2021, 6, 322–327. [Google Scholar] [CrossRef]
- Lewen, N. The use of atomic spectroscopy in the pharmaceutical industry for the determination of trace elements in pharmaceuticals. J. Pharm. Biomed. Anal. 2011, 55, 653–661. [Google Scholar] [CrossRef] [PubMed]
- Ma, S.; Tang, Y.; Ma, Y.; Dong, D.; Guo, L.; Zhu, H.; Liu, J.; Lu, Y. The pH effect on the detection of heavy metals in wastewater by laser-induced breakdown spectroscopy coupled with a phase transformation method. J. Anal. At. Spectrom. 2019, 35, 198–203. [Google Scholar] [CrossRef]
- Ma, S.; Tang, Y.; Ma, Y.; Chu, Y.; Chen, F.; Hu, Z.; Zhu, Z.; Guo, L.; Zeng, X.; Lu, Y. Determination of trace heavy metal elements in aqueous solution using surface-enhanced laser-induced breakdown spectroscopy. Opt. Express 2019, 27, 15091–15099. [Google Scholar] [CrossRef]
- Hahn, D.; Omenetto, N. Laser-Induced Breakdown Spectroscopy (LIBS), Part II: Review of Instrumental and Methodological Approaches to Material Analysis and Applications to Different Fields. Appl. Spectrosc. 2012, 66, 347–419. [Google Scholar] [CrossRef]
- Brüschweiler, B.J.; Merlot, C. Azo dyes in clothing textiles can be cleaved into a series of mutagenic aromatic amines which are not regulated yet. Regul. Toxicol. Pharmacol. 2017, 88, 214–226. [Google Scholar] [CrossRef]
- Brumley, W.C.; Jones, W.J. Comparison of micellar electrokinetic chromatography (MEKC) with capillary gas chromatography in the separation of phenols, anilines and polynuclear aromatics Potential field-screening applications of MEKC. J. Chromatogr. A 1994, 680, 163–173. [Google Scholar] [CrossRef]
- Thompson, C.O.; Trenerry, V. Determination of synthetic colours in confectionery and cordials by micellar electrokinetic capillary chromatography. J. Chromatogr. A 1995, 704, 195–201. [Google Scholar] [CrossRef]
- Bartter, T.; Irwin, R.S.; Abraham, J.L.; Dascal, A.; Nash, G.; Himmelstein, J.S.; Jederlinic, P.J. Zirconium Compound-Induced Pulmonary Fibrosis. Arch. Intern. Med. 1991, 151, 1197–1201. [Google Scholar] [CrossRef]
- NCBI Chloroform. Available online: https://pubchem.ncbi.nlm.nih.gov/compound/Chloroform (accessed on 29 April 2022).
- National Toxicology Program. Substance Profile: Chloroform. In NTP 11th Report on Carcinogens; U.S. Department of Health and Human Services, Public Health Service: Durham, NC, USA, 2004. [Google Scholar]
- Tripathy, H.; Pradhan, D.G.; Dash, B.C.; Mahapatra, G.N. Synthesis of Some New Halogenated N-Thiazolyl Substituted Hydroxy Acid Amides and Their Use as Possible Fungicides. Agric. Biol. Chem. 1973, 37, 1375–1383. [Google Scholar] [CrossRef]
- Garcia, C.; Burgain, A.; Chaillot, J.; Pic, É.; Khemiri, I.; Sellam, A. A phenotypic small-molecule screen identifies halogenated salicylanilides as inhibitors of fungal morphogenesis, biofilm formation and host cell invasion. Sci. Rep. 2018, 8, 11559. [Google Scholar] [CrossRef] [PubMed]
- Dréno, B.; Zuberbier, T.; Gelmetti, C.; Gontijo, G.; Marinovich, M. Safety review of phenoxyethanol when used as a preservative in cosmetics. J. Eur. Acad. Dermatol. Venereol. 2019, 33, 15–24. [Google Scholar] [CrossRef] [PubMed]
- Alvarez-Rivera, G.; Llompart, M.; Lores, M.; Garcia–Jares, C. Chapter 9-Preservatives in Cosmetics: Regulatory Aspects and Analytical Methods. In Analysis of Cosmetic Products, 2nd ed.; Salvador, A., Chisvert, A., Eds.; Elsevier: Boston, MA, USA, 2018; pp. 175–224. ISBN 978-0-444-63508-2. [Google Scholar]
- NCBI Hexachlorophene. Available online: https://pubchem.ncbi.nlm.nih.gov/compound/Hexachlorophene (accessed on 11 May 2022).
- Wade, N. Hexachlorophene: FDA Temporizes on Brain-Damaging Chemical on JSTOR. Science 1971, 174, 805–807. [Google Scholar] [CrossRef]
- Kliegman, R.M.; Geme, J.S. Textbook of Pediatrics, 21st ed.; Elsevier: Amsterdam, The Netherlands, 2020. [Google Scholar]
- NCBI Mercury. Available online: https://pubchem.ncbi.nlm.nih.gov/element/Mercury (accessed on 6 May 2022).
- Denton, C.R.; Lerner, A.B.; Fitzpatrick, T.B. Inhibition of Melanin Formation by Chemical Agents. J. Investig. Dermatol. 1952, 18, 119–135. [Google Scholar] [CrossRef] [PubMed]
- Ori, M.R.; Larsen, J.B.; Shirazi, F. Mercury Poisoning in a Toddler from Home Contamination due to Skin-Lightening Cream. J. Pediatr. 2018, 196, 314–317.e1. [Google Scholar] [CrossRef] [PubMed]
- Wang, Z.; Fang, X. Chronic Mercury Poisoning from Daily Cosmetics: Case Report and Brief Literature Review. Cureus 2021, 13, e19916. [Google Scholar] [CrossRef]
- Parengkuan, K.; Citraningtyas, G. Analisis Kandungan Merkuri Pada Krim Pemutih Yang Beredar Di Kota Manado; Sam Ratulangi University: Manado, Indonesia, 2013; Volume 2. [Google Scholar]
- Omolaoye, J.A.; Uzairu, A.; Gimba, C.E. Heavy Metal Assessment of Some Eye Shadow Products Imported into Nigeria from China. Arch. Appl. Sci. Res. 2010, 2, 76–84. [Google Scholar]
- Stockwell, P.B. The role of flow injection analysis within the framework of an automated laboratory. J. Autom. Chem. 1990, 12, 95–103. [Google Scholar] [CrossRef]
- Mičová, K.; Friedecký, D.; Faber, E.; Polýnková, A.; Adam, T. Flow injection analysis vs. ultra high performance liquid chromatography coupled with tandem mass spectrometry for determination of imatinib in human plasma. Clin. Chim. Acta 2010, 411, 1957–1962. [Google Scholar] [CrossRef] [PubMed]
| No. | Substance | Status by FDA Regulation | Status by EU Regulation |
|---|---|---|---|
| 1. | Bithionol | Prohibited | Prohibited |
| 2. | Formaldehyde | - | Prohibited |
| 3. | Cadmium | - | Prohibited |
| 4. | Azo dyes, rhodamine, yellow quinoline | Color additives are permitted in cosmetics only if the FDA has approved them for the intended use | - |
| 5. | Zirconium-containing complexes | Prohibited | Prohibited |
| 6. | Chloroform | Prohibited except as residual solvent or byproduct | Prohibited |
| 7. | Halogenated salicylanilides | Prohibited | Prohibited |
| 8. | Hexachlorophene | May be used only when no other preservative has been shown to be as effective and must not exceed 0.1% | Prohibited |
| 9. | Coumarin | - | Prohibited |
| 10. | Furocoumarin | - | Prohibited |
| 11. | Mercury compounds | Limited to eye area products. No more than 0.0065% In a trace amount of less than 0.0001% Permitted only if no other effective and safe preservative is available | Prohibited, except in special cases |
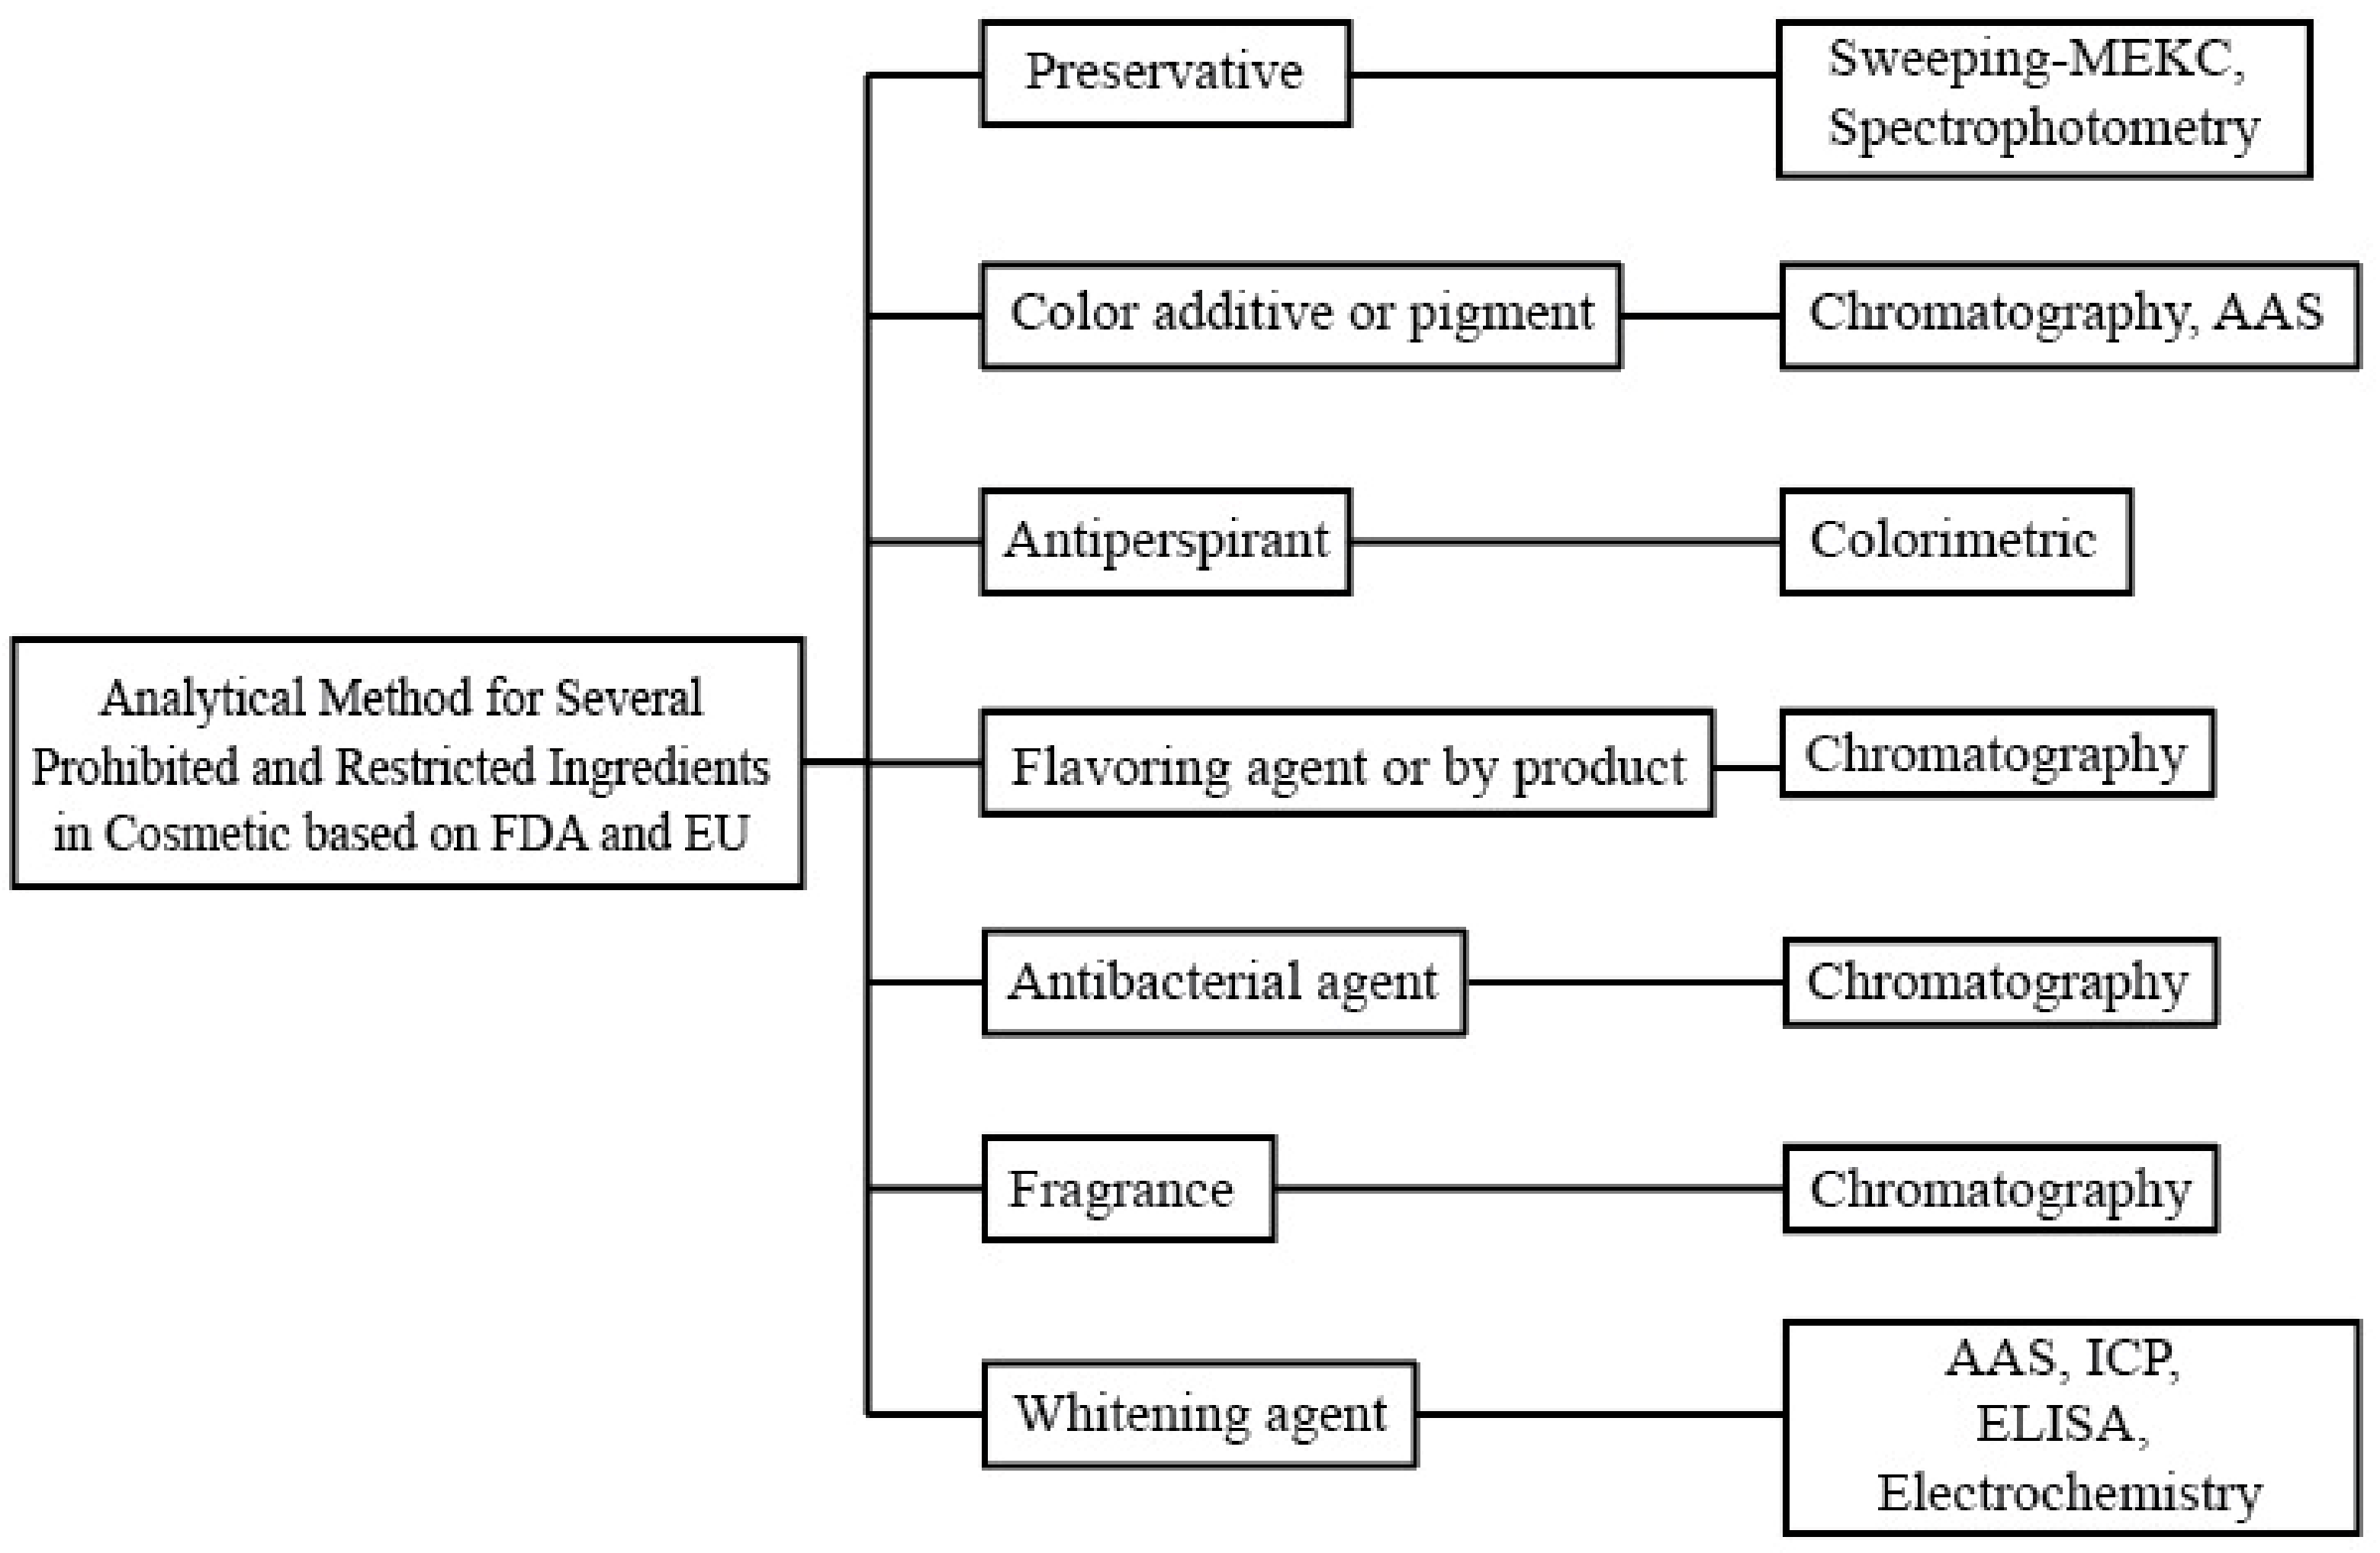
| No. | Substance | Role in Cosmetic | Effect on the Body | Analytical Method | References for Analytical Method |
|---|---|---|---|---|---|
| 1. | Bithionol | Preservative [20] | The substance may cause photocontact sensitization [21] | Sweeping-MEKC | [22] |
| 2. | Formaldehyde | Preservative | Dermal allergies, characterized by red spots, swelling, irritation, pain, and burning sensation [23] | Spectrophotometry, Smartphone reader | [24] |
| 3. | Cadmium | Pigments | Causes the kidneys to experience cadmium dysfunction [25] | GFAAS, AAS, LIBS | [25,26] |
| 4. | Color additives (certain dyes or pigment) | Color additives can be used to color the cosmetic product itself or used to give color to a part of the body such as the hair, skin, eyelashes, or nails [27] | Azo dyes can have mutagenic, genotoxic, and carcinogenic effects [28]. Yellow quinoline dye can be absorbed through the skin and cause genotoxic effects [29]. | MEKC, LC-PDA, LC-MS, LC-MS/MS, UHPLC-Q-Orbitrap HRMS, RP-HPLC-PDA | [30,31,32,33,34,35] |
| 5. | Zirconium-containing complexes | Aerosol product [1] | Toxic effects on the lungs of animals, as well as the formation of granulomas in humans [36] | Colorimetric, with direct and fusion procedures | [37] |
| 6. | Chloroform | Ingredient and flavoring agent | Tests on laboratory animals show the carcinogenic potential of using chloroform as a cosmetic [38]. | GC | [39] |
| 7. | Halogenated salicylanilides | Antibacterial agent | May cause serious skin disorders [40] | HPLC-FLD, SPE-UPLC-MS/MS | [41,42] |
| 8. | Hexachlorophene | Antibacterial agent | Due to its toxic effect and ability to penetrate human skin, it cannot be used in cosmetics applied to the mucous membranes, such as the lips [43]. | HPLC-PDA, CE-UV | [44,45] |
| 9. | Coumarin | Fragrance [46] | Skin sensitization and eczema through dermal administration [46] | 1D/2D GC-MS, UPLC-MS/MS, HPTLC, LC-MS/MS LRI | [46,47,48,49] |
| 10. | Furocoumarin | Fragrance [50] | Phototoxicity, hyperpigmentation, erythematous rash, blisters, and sunburn if the user is exposed to UV-A radiation from the sun [51] | RP-HPLC-coupled HR/AM, LC-MS, LC-MS/MS LRI | [49,52,53] |
| 11. | Mercury compound | Whitening agent, preservative | Allergic reactions, skin irritation, or neurotoxic problems [54] | ELISA, AAS, AFS, CE, CV-AAS, FAAS, FIA, ICP AES, ICP-MS, PVG ICP-MS, HPLC-ICP MS, MP AES, Electrochemical sensors | [55,56,57,58,59,60,61,62,63,64,65,66,67,68,69,70,71,72,73,74] |
| No. | Sample | Extraction Method | Analytical Method | LOD | LOQ | Linearity (Correlation Coefficient) | Accuracy/ Precision | Ref. |
|---|---|---|---|---|---|---|---|---|
| 1. | Lipstick, mascara, eyeshadow, eyebrow pencil | - | GFAAS | 0.14 μg/L | - | 0.994 ± 0.002 | - | [26] |
| 2. | Traditional scrub | Wet digestion | AAS | 0.63 ppm | 2.11 ppm | 0.9982 | Average recovery = 102.89% | [25] |
| 3. | Low-quality pomade | ultrasound-assisted extraction (UAE) | LIBS | 0.016 mg/kg | - | 0.9916 | - | [88] |
| No. | Sample | Analyte | Extraction Method | Analytical Method | LOD | LOQ | Linearity (Correlation Coefficient) | Accuracy/Precision | Ref. |
|---|---|---|---|---|---|---|---|---|---|
| 1. | Lipstick | Rhodamine B | MS-AE | MEKC | 6.25 × 10⁻⁷ M | - | - | - | [30] |
| 2. | Brow pencil and body glitter | Rhodamine B | LLE | LC with PDA detector | 0.34 mg/L | - | - | - | [31] |
| 3. | Shampoo, face paints, toothpaste, hairspray, nail polishes, soap, and eyeshadow | Acid orange 7, ponceau 4R, rhodamine, amaranth, and acid yellow 36 | Miniaturized MSPD | LC-MS | 0.0142–0.476 µg/g | 1–50 ng/mL | ≥0.9928 | % recovery = 69.5–121% | [32] |
| 4. | Lip product, body lotion, body butter, hand cream, age spot corrector mask, shampoos, shower gels, soap, rough skin remover, moisturizing mask, toothpaste, smoothing masks, and facial gel | Ponceau SX, amaranth, carmoisine, and ponceau 4R | Single-Step VE | LC-MS/MS | - | 0.07–3.437 mg/kg | ≥0.9918 | RSD < 16% % recovery = 70.3–117% | [33] |
| 5. | Lipstick, eyeshadow, toothpaste, nail polishes, blusher, and eyeliner | Color Additive | MSPD | UHPLC-Q-Orbitrap HRMS | 0.0005–0.1 mg/kg | 0.002–0.2 mg/kg | ≥0.99 | intraday precision = 1.0–10.7% interday precision = 0.5–11.7% | [34] |
| 6. | Lipstick | Rhodamine B | - | RP-HPLC with PDA detector | 3.85 ng/mL | 12.82 ng/mL | ≥0.999 | Precision = 1.22% % recovery at concentration <100 ppm = 80–110% | [35] |
| No. | Sample | Analyte | Extraction Method | Analytical Method | LOD | LOQ | Linearity (Correlation Coefficient) | Accuracy/Precision | Ref. |
|---|---|---|---|---|---|---|---|---|---|
| 1. | Eye shadow, lipstick, shampoo, and toner | 5-chlorosalicylanilide (CSA) | Eye shadow and toner = Liquid–liquid extraction with acetonitrile Lipstick = Liquid–liquid extraction with hexane saturated acetonitrile Shampoo = Liquid–liquid extraction with 4% formic acetonitrile | HPLC-FLD | 33.0 µg/kg | 110 µg/kg | 0.9999 | Recovery = 70–110% RSD < 13% | [41] |
| 4′-bromosalicylanilide (BSA) | 42.9 µg/kg | 143 µg/kg | 0.9996 | ||||||
| 5-bromo-4′-chlorosalicylanilide (BCSA) | 29.1 µg/kg | 97.0 µg/kg | 0.9998 | ||||||
| Dibromsalan (DBS) | 35.2 µg/kg | 117 µg/kg | 0.9998 | ||||||
| Metabromsalon (MBS) | 25.1 µg/kg | 83.7 µg/kg | 0.9999 | ||||||
| Tribromsalan (TBS) | 13.8 µg/kg | 46.0 µg/kg | 0.9999 | ||||||
| 3,3′,4′,5-tetrachlorosalicylanilide (TCSA) | 14.0 µg/kg | 46.7 µg/kg | 0.9996 | ||||||
| 2. | Aftershave, acne-treating face wash, toner, moisturizer, shaving cream, facial cleanser, skincare cream, body wash, shampoo | Tribromsalan (TBS) | SPE | UPLC-MS/MS | 0.8 µg/kg | 2.5 µg/kg | 0.9978 | Recovery = 83.9–107% RSD intra-day = 2.9–6.5% RSD inter-day = 4.9–7.0% | [42] |
| Dibromsalan (DBS) | 0.5 µg/kg | 1.5 µg/kg | 0.9988 | ||||||
| Metabromsalon (MBS) | 0.5 µg/kg | 1.5 µg/kg | 0.9988 | ||||||
| 3,3′,4′,5-tetrachlorosalicylanilide (TCSA) | 0.5 µg/kg | 1.5 µg/kg | 0.9992 | ||||||
| 5-bromo-4′-chlorosalicylanilide (BCSA) | 0.8 µg/kg | 2.5 µg/kg | 0.9986 | ||||||
| 4′-bromosalicylanilide (BSA) | 0.8 µg/kg | 2.5 µg/kg | 0.9992 | ||||||
| 5-chlorosalicylanilide (CSA) | 0.8 µg/kg | 2.5 µg/kg | 0.9974 |
| No. | Sample | Analyte | Extraction Method | Analytical Method | LOD | LOQ | Linearity (Correlation Coefficient) | Accuracy/Precision | Ref. |
|---|---|---|---|---|---|---|---|---|---|
| 1. | Moisturizer, toner, body lotion | Hexachlorophene | IL-DLLME and MSPE | HPLC-PDA | 0.14 µg/mL | - | 0.9976 | Recovery = 74.5–97.7% RSD = 3.8–6.7% | [44] |
| 2. | Loose powder, emulsion, and toner samples | Hexachlorophene | Centrifugation and filtration | CE-UV | 0.06 µg/mL | 0.19 µg/mL | 0.9999 | Recovery = 90.0–96.4% RSD = 0.52–3.02% | [45] |
| HPLC-PDA | 0.05 µg/mL | 0.15 µg/mL | 0.9999 | Recovery = 96.8–109.0% RSD = 0.15–0.5% |
| No. | Sample | Analyte | Extraction Method | Analytical Method | LOD | LOQ | Linearity (Correlation Coefficient) | Accuracy/Precision | Ref. |
|---|---|---|---|---|---|---|---|---|---|
| 1. | Perfume | Coumarin | EDH | 1D/2D GC-MS | - | - | 0.9999 | RSD = 1.3% for standards and 2.3% for sample | [47] |
| 2. | Cream, Lipstick, Shampoo, and lotion | Acenocoumarol | UAE and SPE | UPLC-MS/MS | - | 10 µg/kg | 0.9954 | With 50 µg/kg spike: % recovery = 86.8% Intra/interday precision = 5.2/8.9% | [46] |
| Dicumarol | 20 µg/kg | 0.9950 | With 50 µg/kg spike: % recovery = 88.9% Intra/inter-day precision = 7.4/10.1% | ||||||
| Coumarin | 15 µg/kg | 0.9911 | With 50 µg/kg spike: % recovery = 84.8% Intra/interday precision = 6.2/12.9% | ||||||
| 7-Methoxycoumarin | 15 µg/kg | 0.9947 | With 50 µg/kg spike: % recovery = 91.6% Intra/interday precision = 7.1/9% | ||||||
| Dihydrocoumarin | 15 µg/kg | 0.9950 | With 50 µg/kg spike: % recovery = 83.1% Intra/interday precision = 6.5/9.9% | ||||||
| 7-Methylcoumarin | 5 µg/kg | 0.9931 | With 50 µg/kg spike: % recovery = 86.9% Intra/interday precision = 5.4/8.3% | ||||||
| 4-Methyl-7-Ethocycoumarin | 5 µg/kg | 0.9978 | With 50 µg/kg spike: % recovery = 86.6% Intra/interday precision = 5.6/9.9% | ||||||
| 3. | Deodorant, body oil, body milk, body lotion, face cream, sunscreen, bath additive, conditioner, body butter, hand cream, and lip products | Coumarin | UAE | HPTLC | 200 pg/band for standard | 1.3 mg/kg for samples | 0.9998 | RSD = 0.7–3.7% (deodorant, body oil, lip care, body milk) RSD = 1.7–5.8% (deodorant, body butter, cleaning milk, face cream, body lotion, bath essence, and conditioner) | [48] |
| 4. | Perfume and body wash | Coumarin | LLE | LC-MS/MS with LRI | 0.0003–0.0087 mg/L | 0.0009–0.0291 mg/L | - | Intraday precision = 2.3–8.6% Interday precision = 2.8–9.6% | [49] |
| No. | Sample | Analyte | Extraction Method | Analytical Method | LOD | LOQ | Linearity (Correlation Coefficient) | Accuracy/Precision | Ref. |
|---|---|---|---|---|---|---|---|---|---|
| 1. | Hydroalcoholic fragrance | Xanthotoxin | - | RP-HPLC-coupled HR/AM | - | 0.03 mg/L | >0.995 | SD on 5 replications < 15% RSD on 30 replications < 10% Recovery for each furocoumarin was close to 100%, except for epoxy bergamottin, which was around 70% | [52] |
| Bergapten | 0.07 mg/L | ||||||||
| Isopimpinellin | 0.1 mg/L | ||||||||
| Oxypeucedanin | 0.05 mg/L | ||||||||
| Byakangelicol | 0.01 mg/L | ||||||||
| Epoxybergamottin | 0.02 mg/L | ||||||||
| Bergamottin | 0.1 mg/L | ||||||||
| 2. | Creams, pomade, shampoo, perfume, shower gel, and deodorant | Oxypeucedanin hydrate | Ultra-sonification and SPE | LC-MS | Standard solution = 0.1–0.5 ng/mL Sample = 1–5 µg/kg | Sample = 10 µg/kg | 0.9984 | RSD = 17.9% % recovery = 96% | [53] |
| Byacangelicin | 0.9993 | RSD = 4.9% % recovery = 100% | |||||||
| Bergapten | 0.9991 | RSD = 8.2% % recovery = 94% | |||||||
| Isopimpinellin | 0.9991 | RSD = 2.8% % recovery = 96% | |||||||
| Oxypeucedanin | 0.9989 | RSD = 7.1% % recovery = 94% | |||||||
| Byacangelicol | 0.9994 | RSD = 3.5% % recovery = 98% | |||||||
| Epoxybergamottin | 0.9993 | RSD = 4.1% % recovery = 94% | |||||||
| Bergamottin | 0.9990 | RSD = 2.7% % recovery = 68% | |||||||
| 3. | Perfume and body wash | Furocoumarin | LLE | LC-MS/MS with LRI | 0.00003–0.0008 mg/L | 0.00008–0.0028 mg/L | - | Intraday precision = 0.9–16.5% Interday precision = 1.7–18.4% | [49] |
| No. | Sample | Analyte | Extraction Method | Analytical Method | LOD | LOQ | Linearity (Correlation Coefficient) | Accuracy/Precision | Ref. |
|---|---|---|---|---|---|---|---|---|---|
| 1 | Facial cleanser, night cream | Mercury | Extracted with 30% HNO3 and centrifugation | ELISA | 0.08 ng/mL | - | 0.98 | Recovery = night cream: 80.0–92.0% facial cleanser: 84.0–102.0% RSD = night cream: 7.5–12.0% facial cleanser: 5.8–18.6% | [55] |
| 2. | Body butter, body lotion, body milk, body oil, peeling, body serum, cream, eye cream, foam, gel, hydrolate, mask, micellar liquid, face serum, SPF cream, tonic | Mercury | - | AAS | - | 0.003 ng | - | RSD < 1.5% | [56] |
| 3. | Whitening cream | Mercury | Wet destruction | AAS | - | - | 0.9985 | - | [57] |
| 4. | Cosmetics sample (not stated) | Mercury | Microwave digestion | AFS | 2.4 ng/L | - | 0.9992 | Recovery = 94–106% RSD 2.8–4.2% | [58] |
| 5. | Loofah moisturizer (A), homemade moisturizing lotion emulsion (B) | Mercury | Sweeping via dynamic complexation | CE | 50 ng/L | - | sample A: 0.998 sample B: 0.994 | Recovery = sample A: 100–107% sample B: 76% RSD < 8.7% | [59] |
| 6. | Skin-lightening cream | Mercury | Microwave digestion | CV-AAS | 0.0005 mg/kg | 0.001 mg/kg | 0.999 | Recovery = 94% RSD = 4% | [61] |
| 7 | Shampoo, hairdressing gel, hair dye, body wash, hair conditioner, hand lotion, hand wash, facial cleanser, moisturizer/cream, whitening, eye gel, lip care, toner, nail saver, others | Mercury | - | CV AAS | 0.04 µg/kg | - | >0.999 | Recovery = 96.2%, 99.1% 103.1% RSD = 6.4%, 5.1%, 3.9% (shampoo I, shampoo II, cleanser) | [60] |
| 8. | Body lotion | Mercury | Wet destruction | CV AAS | 0.004854 ppb | 0.01681 ppb | 0.9726 | Recovery = 99.33% RSD = 1.829% | [62] |
| 9. | Skin-lightening cream, | Low-concentration mercury | Microwave-assisted digestion | CV AAS | 0.005 ppm | - | 0.9984 | Recovery = 98–102% RSD = 2.8% | [63] |
| High-concentration mercury | FAAS | - | - | 0.9998 | RSD = 0.94% | ||||
| 10. | Eye shadow | Mercury | Microwave digestion | FAAS | 1.87 mg/kg | 5.68 | 0.9993 | Recovery = 99.07%, RSD = 2.50674 | [64] |
| 11. | Facial blemish balm creams, facial whitening creams | Mercury | - | FIA | 0.03 µg/mL | 0.14 µg/mL | 0.9961 | RSD = 1.32% (0.05 µg/mL) 0.78% (0.20 µg/mL) | [65] |
| 12. | Cosmetic sample | Mercury (Hg(II)) | Digestion | Spectrophotometric determination based on peroxidase activity | 0.5 μM | - | 0.994 | Recovery = 95.6–108.5% RSD = 4.5–8.2% | [66] |
| 13. | Skin-whitening cream | Mercury | Microwave digestion | ICP AES | 3.3 ppb | - | >0.999 | Recovery = 87.6–91.0% RSD < 3% | [67] |
| 14. | Skin-whitening cream | Mercury | SPE | ICP AES | 1.8 ng/mL | - | - | Recovery = 89.6–90.4% RSD = 1.1% | [74] |
| 15. | Hair cream, beauty cream, hair gel, scrub, shampoo, shower gel, body lotion, hand wash, shaving cream, toothpaste, soap | Mercury | Dry-ashing digestion | ICP-MS | - | - | 0.998–0.999 | - | [68] |
| 16. | Lotion, facial lightening mask, facial lightening cream, lightening serum | Mercury | Dissolution in formic acid | PVG-ICP MS | 0.6 pg/mL | - | 0.997 | Recovery = 90–105% RSD intraday = 2.3% (0.5 ng/mL) 4.8% (0.02 ng/mL) RSD interday = 5.1% (0.5 ng/mL) 9.2% (0.02 ng/mL) | [69] |
| 17. | Skin refresheners and hand moisturizing lotion | Hg2+ | IL-DLLME | HPLC-ICP-MS | 1.3 ng/L | - | 0.9986 | Recovery = 96.6–101.2% RSD = 7.4% | [70] |
| MeHg+ | 7.2 ng/L | - | 0.9987 | Recovery = 86.7–89.7% RSD = 5.2% | |||||
| EtHg+ | 5.4 ng/L | - | 0.9999 | Recovery = 88.2–93.5% RSD = 2.3% | |||||
| 18. | Skin-lightening cream, | Mercury | Microwave digestion | MP-AES | 0.59 μg/L | 1.98 μg/L | 0.993 | Recovery = 92.78% RSD = 2.67% | [71] |
| 19. | Talcum powder, skin lotion, eye shadow | Mercury (Hg(II)) | Microwave digestion | Electrochemical sensor | 0.5 μg/L | 0.25 mg/kg | 0.998 | Recovery = 77.0–93.0% | [72] |
| 20. | Lotion, serum, moisturizer, cream, lotion, gel, hair straightener, shampoo, dye, soap, oil, shower gel, face powder, foundation, lipstick, scented oil, deodorant, salve | Mercury | Centrifugation and ultrasonication | Electrochemical cyclic voltammetry (CV) and differential pulse voltammetry (DPV) | 0.03 ppm | - | 0.9969 | Recovery = 96.6–97.5% RSD < 1% | [73] |
Publisher’s Note: MDPI stays neutral with regard to jurisdictional claims in published maps and institutional affiliations. |
© 2022 by the authors. Licensee MDPI, Basel, Switzerland. This article is an open access article distributed under the terms and conditions of the Creative Commons Attribution (CC BY) license (https://creativecommons.org/licenses/by/4.0/).
Share and Cite
Pratiwi, R.; Auliya As, N.N.; Yusar, R.F.; Shofwan, A.A.A. Analysis of Prohibited and Restricted Ingredients in Cosmetics. Cosmetics 2022, 9, 87. https://doi.org/10.3390/cosmetics9040087
Pratiwi R, Auliya As NN, Yusar RF, Shofwan AAA. Analysis of Prohibited and Restricted Ingredients in Cosmetics. Cosmetics. 2022; 9(4):87. https://doi.org/10.3390/cosmetics9040087
Chicago/Turabian StylePratiwi, Rimadani, Nisa Nurul Auliya As, Rani Fitrilia Yusar, and Adnan Aly Al Shofwan. 2022. "Analysis of Prohibited and Restricted Ingredients in Cosmetics" Cosmetics 9, no. 4: 87. https://doi.org/10.3390/cosmetics9040087
APA StylePratiwi, R., Auliya As, N. N., Yusar, R. F., & Shofwan, A. A. A. (2022). Analysis of Prohibited and Restricted Ingredients in Cosmetics. Cosmetics, 9(4), 87. https://doi.org/10.3390/cosmetics9040087