Abstract
Cinnamon (Cinnamomum burmannii) is a potential source used in cosmetics to prevent skin aging due to its flavonoids and antioxidant properties. This research aims to determine the best solvent for extracting flavonoids, to conduct a large-scale isolation of flavonoids, and to evaluate the effect of ascorbic acid and temperature on the extract’s stability for 16 weeks. Various solvents for small-scale extraction were screened based on the polarity index, and one of the best for use in large-scale maceration was selected based on the AlCl3 colorimetric flavonoid content and DPPH antioxidant activity. The stability test was performed by treating cinnamon with and without ascorbic acid at selected temperatures. This test measured physical stability, evaluated flavonoid content and antioxidant activity, and analyzed volatile and non-volatile compounds using GC-MS and LC-MS. The most excellent solvent to extract flavonoids was ethanol due to its high yield (21.50%), flavonoid content (0.01749 ± 8.0 × 10⁻⁵ mg QE/g extract), and antioxidant activity (IC50 0.0162 + 7.5 × 10⁻⁴ mg/mL). The ascorbic acid addition at both temperatures affected the stability of the pH and chemical constituents. The vast majority of the extract’s flavonoid content and antioxidant activity continued to increase until the end of the observation week. This study revealed that ethanol was the best extraction solvent, and ascorbic acid can be recommended as a stabilizer of cinnamon extract for use in cosmetics for further application.
1. Introduction
A number of Indonesian plants have the potential to be explored as traditional medicines, cosmetics, and food sources [1]. The usage of plant extracts as ingredients in cosmetics manufacturing is increasingly in demand by consumers, who are gradually becoming concerned with environmentally friendly products [2]. One of the benefits of utilizing herbal plant-based cosmetics is to protect the skin from ultraviolet (UV) exposure. Most customers need cosmetics with high antioxidant properties to protect against UV radiation [3]. The secondary metabolites derived from plants, generally known as essential compounds for antioxidant agents, are flavonoids [4]. Cinnamon (Cinnamomum burmannii) is rich in this type of compound [5].
Cinnamon, obtained from the dried outer layer of C. burmannii’s bark, is commonly consumed as a traditional medicine, spice, and flavoring agent and can increase the farmers’ economy in selected Indonesian areas [6,7]. This plant is extensively recognized as a potential source of essential oils and phenolic compounds, such as flavonoids, phenolic aldehydes and acids, coumarins, and proanthocyanidins [7,8]. A previous study reported that the major compounds in n-butane extract of Chinese cinnamon from subcritical extraction consisted of (E)-cinnamaldehyde, eugenol, and coumarin, while its ethanol extract presented procyanidin trimer, (E)-cinnamaldehyde, and (Z)-cinnamaldehyde [9]. In addition, methanol extract of Indonesian cinnamon from Kerinci, Sumatra, showed the presence of catechin, epicatechin, procyanidin B2, quercitrin, 3,4-dihydroxybenzaldehyde, protocatechuic acid, and cinnamic acid by ultrasonic extraction [10]. Other extracts from different regions of Indonesia, i.e., Karanganyar and Padang, exhibited cinnamaldehyde as a major compound using steam distillation [11]. Differences in the phytochemical constituents in plants are affected by physiological age, habitat or environmental conditions, and genetic factors [12].
Cinnamon has a wide range of biological activities, such as antioxidant, anticoagulant, antidiabetic, anti-inflammatory, anti-tumor, anticancer, anti-microbial, anti-fungal, antiviral, and gastro-protective properties, treating dental problems, and lowering blood pressure, cholesterol, and lipids [13,14,15]. Due to its health benefits, this plant captures scholars’ attention to exploring its flavonoid content as a potential candidate to be used in cosmetics [16,17,18]. However, there are still limited studies on cinnamon extract for beauty products. In addition, ascorbic acid as a plant extract stabilizer should be added to prevent significant changes in the physical properties, flavonoid contents, antioxidant activities, and chemical constituents.
Studies using additive compounds have been conducted to enhance the stability of plant extracts. Using sodium carboxymethyl cellulose (CMC-Na) as a gelling agent improved the consistency, stickiness, dispersibility, and antibacterial activity of the hand sanitizer gel based on basil leaf extract for five days [19]. Moreover, the addition of polyvinyl alcohol (PVA) and guar gum as a cold-swelling agent presented the best performance in the physical and physicochemical stability tests of a peel-off facial mask containing soybean extract for 15 days [20]. An emulsion stabilizer was also introduced in the cream formulation of Sueada asparagoides extract and showed the best stability on pH, viscosity, and absorbance during 12 weeks of observation [21]. Furthermore, the combination of a cinnamon essential oil nano-emulsion as a polyphenol oxidase (PPO) inhibitor and ascorbic acid as a reducing agent could improve the inhibition of enzymatic browning and maintain the quality of apple juice for 54 h [22].
This research selected the best solvent to extract flavonoids, extracted flavonoids in a large-scale maceration, and assessed the extract’s stability for 16 weeks in the absence and presence of ascorbic acid at room temperature (RT, 27.0 + 1.0 °C) and in an incubator (40 + 0.5 °C). The stability tests included physical stability tests, such as the organoleptic test and pH (every week), flavonoid content and antioxidant activity tests (every four weeks), and volatile and non-volatile chemical compound analyses (every eight weeks). Identifying the effect of ascorbic acid on the stability of physical properties, flavonoid contents, antioxidant activities, and chemical compositions in Indonesian cinnamon extract (C. burmannii) could significantly impact commercializing Indonesian plant extracts for cosmetics.
2. Materials and Methods
2.1. Chemicals and Instrumentations
The solvents used for extraction were ethanol (EtOH), ethyl acetate (EtOAc), and acetone of technical grade (CV. Satya Darmawan). For the qualitative and quantitative phytochemical screening, quercetin was purchased from Sigma Aldrich, while the others, i.e., NaOH, HCl, Mg ribbon, FeCl3, CHCl3, NH4OH, H2SO4, Dragendorff, Meyer, Wagner, AlCl3, and CH3COOK were obtained from Merck. For the antioxidant activity test, ascorbic acid (SmartLab) was used as a stabilizer in the stability test and positive control. 2,2-Diphenyl-1-picrylhydrazyl (DPPH) from SmartLab and EtOH from Merck were also used for the antioxidant analysis. Weekly pH measurements for the stability test were conducted using an ICONIX PC-50 multiparameter with a pH5F and a semisolid probe. The operated instrumentations were a UV-visible (UV-Vis) Shimadzu UV2450, a gas chromatography-mass spectrometry (GC-MS) 5975 Series G 1701 EA 02.02 (Agilent Technologies), and a liquid chromatography-mass spectrometry (LC-MS) Acquity UPLC H-class system.
2.2. Sample Preparation and Identification
Three-year-old cinnamon (Cinnamomum burmannii (Nees and T. Nees) Blume) bark was obtained from the Tropical Biopharmaca Research Center (Trop BRC) garden, Institute for Research and Community Service (LPPM) IPB University, Dramaga, Bogor, West Java, Indonesia, in February 2021. The dark brown outer layer of cinnamon bark was determined by Taopik Ridwan, S.P., M.Si., in the same institution and dried at room temperature for three days. The air-dried sample then was ground using a Honda GX 160 equipped with a Disk Mill FFC-15 (Hong Tong Fang - Shan Dong Ji Mo Disk Machienery The People’s Republic of China) to obtain the 80-mesh powder form.
2.3. Small-Scale Plant Extraction
Into three different glass-stoppered Erlenmeyer flasks, finely ground air-dried cinnamon (50 g) was placed and macerated for 3 × 24 h using various solvents, i.e., EtOH, EtOAc, and acetone. All samples were then filtered using Whatman No. 1 filtration paper and concentrated under reduced pressure with an IKA RV 8 rotary evaporator (40 °C, 90 rpm, 175–556 mbar). Each concentrated extract was weighed and determined for its yield (Equation (1)). All the extracts were then tested for qualitative phytochemical screening, their total flavonoid contents, and their antioxidant activities. The solvent that showed promising results was then selected for large-scale isolation.
2.4. Large-Scale Plant Extraction
A total of 6 kg of dried powdered cinnamon was used in a large-scale extraction and was macerated using EtOH three times at room temperature.
The following procedures to yield the brownish-black extract (788 g, 13.13% w/w) remained the same as the small-scale isolation. The qualitative phytochemical investigation was then also applied for the large-scale extract.
2.5. Qualitative Phytochemical Analysis
A 100 mg extract was diluted in 10 mL of ethanol as the plant extract. The plant extract was then applied for a preliminary investigation of the presence of secondary metabolites following standard procedures [23] and conducted in two replicates.
2.5.1. Flavonoids
A 2 mL volume of plant extract was placed into two test tubes. Two drops of NaOH 10% (w/v) were added to the first tube, while two drops of HCl and 0.1 g of Mg ribbon were added to the second test tube. The color change of the solution to red, yellow, or orange indicated the presence of flavonoids.
2.5.2. Tannin
A 2 mL volume of plant extract was arranged into a test tube, and 1 mL of FeCl3 5% (w/v) was added. The color change of the solution to blue-black indicated the presence of tannin.
2.5.3. Terpenoid and Steroid
Acetate anhydride acid was added to 500 mg of concentrated extract until soaked for 15 min. The filtrate was then separated into a test tube, and 2–3 drops of H2SO4 conc. were added. The color change of the solution to orange, red, or purple indicated the presence of terpenoids and steroids.
2.5.4. Saponin
A 2 mL volume of plant extract was put into a test tube and shaken until a lather was formed. A stable lather for about 30 min indicated the presence of saponin.
2.5.5. Alkaloid
A 2 mL volume of plant extract was added into a test tube, followed by 2 mL of CHCl3, 2 mL of NH4OH, and 3–5 drops of H2SO4 conc. The mixture’s upper layer was then transferred into three test tubes to undergo Dragendorff, Meyer, and Wagner tests. Brown, orange, and white precipitation observed in the solution indicated the presence of alkaloids, respectively.
2.6. Sample Preparation of Stability Test
A stability test was conducted in the presence and absence of ascorbic acid. Around 600 g of cinnamon extract was divided into six wide-mouth glass bottles with screw caps to receive different treatments (Table 1). Samples A and B were assigned without the addition of ascorbic acid, while samples C and D were treated using 10% (w/w) ascorbic acid, and samples E and F were 15% (w/w) ascorbic acid. Samples A, C, and E were stored at RT (27.0 + 1.0 °C), while the others were kept in the incubator (40 + 0.5 °C). In subsequent stages, all samples were then subjected to physical stability tests (every week), followed by an evaluation of flavonoid content and antioxidant activity (every four weeks) and an analysis of volatile and non-volatile chemical compounds using GC-MS and LC-MS (every eight weeks).

Table 1.
Sample preparation of stability test.
2.7. Physical Stability Test
Organoleptic tests were conducted to observe the texture, odor, and color changes. A pH measurement was also assessed for all samples and was measured in two replicates.
2.8. Determination of Total Flavonoid Content
Total flavonoid content was determined by the AlCl3 colorimetric method using UV-Vis [24]. Each 0.5 mL sample was treated with 1.5 mL of ethanol, 0.1 mL of AlCl3 (10%, w/v), 0.1 mL of potassium acetate 1 M, and 2.8 mL of distilled water. The mixture was then homogenized with a vortex mixer for about 30 s, allowed to stand at room temperature for 30 min, and the absorbance was measured at λ 435.5 nm. Various concentrations of quercetin were used as a comparison, which was expressed as the quercetin equivalent (QE). Duplicates were maintained, and the experiment was repeated two times. The flavonoid content was presented in mg of quercetin equivalent in g of total extract (QE mg/g) based on Equation (2), where F = total flavonoid content (QE mg/g), c = quercetin equivalent concentration of extract (mg/mL), V = volume of extract (mL), f = dilution factor, and m = mass of extract (g).
2.9. DPPH Radical Scavenging Activity Assay
The DPPH radical scavenging method was used to determine the antioxidant activity following the standardized procedures [25] with some modifications by mixing 2 mL of an ethanolic solution of 0.1 mM DPPH and 2 mL of EtOH dissolved in the samples at various concentrations. After incubating in the dark for 30 min, the absorbance was measured at λ 510 nm. The experiment was repeated twice in this study. DPPH in EtOH without a sample was used as a negative control, while ascorbic acid was selected as a positive control. The radical scavenging activity percentage was then determined using Equation (3), where A0 = the absorbance of the negative control and Ai = the absorbance of the sample. The antioxidant activity in IC50 (mg/mL) was calculated by substituting 50% RSA in the linear equation obtained by plotting %RSA with the sample’s concentration.
2.10. Chemical Constituent Analysis
The identification of volatile and non-volatile chemical constituents in samples was performed using GC-MS and LC-MS, respectively, in ethanol. GC-MS with He UHP gas was set at a 50 °C column oven temperature for 5 min, then the temperature was gradually increased to 280 °C. The injection temperature was set to 280 °C at a pressure of 101 kPa and a column flow of 0.85 mL/min. The MS detector temperature was also selected for ion source at 200 °C, interface temperature at 280 °C, detector temperature at 280 °C, and pyrolyzer temperature at 300 °C. An ultra-performance LC was used with C-18 as a stationary phase with a 50 °C column temperature and a flow rate of 0.2 mL/min for 23 min. A 5 mM ammonium formate and acetonitrile with 0.05% formic acid were used as a mobile phase. Electrospray ionization with positive mode was used for MS detection. A mass analysis was carried out at 50–1200 m/z with two different energies, 4 and 25–50 V. The chromatogram was then analyzed using MassLynx software.
3. Results and Discussion
Belonging to the Lauraceae family, cinnamon (C. burmannii) was nominated since this species is commonly used in traditional medicine and food-flavoring and is recognized to have a rich source of polyphenols such as flavonoids [1,5,7]. However, relatively little was explored regarding the extraction and stability test of flavonoids from Indonesian cinnamon for preliminary use in cosmetics. Therefore, in this present study, we communicate the best solvent to extract flavonoids and the effect of the addition of ascorbic acid on the stability of cinnamon extract at RT (27.0 + 1.0 °C) and in an incubator (40 + 0.5 °C).
3.1. Small-Scale Plant Extraction
Plant extraction on a small scale was carried out to choose the best solvent for isolating flavonoids. This work is the first report on selecting the best solvent to extract flavonoids from cinnamon using small-scale maceration. The solvents consisted of EtOH, EtOAc, and acetone, which were categorized as semi-polar solvents according to their polarity index [26]. EtOH was chosen because it was an FDA-approved solvent for foods, drugs, and cosmetics [27]. Meanwhile, EtOAc and acetone were selected due to the demand from the cosmetic industries to find alternatives to producing alcohol-free products [28]. In addition, these three solvents were classified as having a very low danger level according to the permitted daily exposure (PDE) [29].
The best solvent for extracting flavonoids from cinnamon was evaluated based on the extract yield, qualitative flavonoid test, quantitative flavonoid content, and antioxidant activity, as summarized in Table 2. According to Table 2, EtOH extract produced the highest yield with 10.75 g (21.50%). This yield could be considered a good yield with the traditional method in comparison with other methods in the previous reports [9,10]. Chinese cinnamon was reported to give 1.56% and 8.45% in yield using subcritical extraction for n-butane and EtOH extracts, respectively [9]. In addition, Indonesian cinnamon extract from Kerinci exhibited a 14.4–29.8% yield using an ultrasonic method with various solvents, such as water, acetone, methanol, and EtOH [10]. It can be noticed that environmental and geographical conditions affected the compounds extracted [12].
Table 2.
Solvent screening for preparation of large-scale plant extraction.
Qualitative flavonoid tests using the Shinoda and acetophenone formation tests of EtOH extract exhibited positive results (Table 2) and had the closest similarity to quercetin as a control. Although the EtOH and EtOAc extracts showed a slight similarity in the AlCl3 colorimetric quantitative flavonoid content, the DPPH-antioxidant activity of both extracts indicated a significant difference in activity. The IC50 of EtOH and EtOAc extracts were 0.0162 + 7.5 × 10⁻⁴ (strongly active) and 0.1069 + 1.7 × 10⁻³ (weakly active) mg/mL, respectively. According to the extensive literature review, cinnamon extract in organic solvents will show a positive result in the flavonoid test and a high content of phenolic flavonoids, with the highest results obtained using protic semi-polar to polar solvents [7,8,9,10,11]. Furthermore, the EtOH extract of cinnamon also showed the highest biological activities compared to the other solvents [9,10,11]. Therefore, EtOH was chosen to isolate flavonoids in cinnamon in a large-scale extraction.
3.2. Large-Scale Plant Extraction
A total of 6 kg of cinnamon was successfully macerated using EtOH to isolate 787.984 g (13.13%) of dark brown extract (Table 3). The yield of the large-scale extraction was smaller than the small-scale extraction due to the reduced molecular collision between sample and solvent, lower stirring frequency, difference in the ratio of sample and solvent, and the excess of solvent absorption into the sample [31]. A preliminary phytochemical investigation of EtOH extract was conducted to explore the secondary metabolites group. Six phytochemicals were screened, and four were presented, i.e., flavonoids, tannins, terpenoids, and alkaloids. These results were in accordance with the same species of different origins [9,10,11].
Table 3.
Yield, quantitative flavonoid content, and antioxidant activity of large-scale EtOH extract of cinnamon.
The quantitative flavonoid content and antioxidant activity of large-scale EtOH extract of cinnamon are also displayed in Table 3. Compared to the small-scale EtOH extract, the large-scale extract showed a significant increase in flavonoid content but decreased antioxidant activity. However, the large-scale EtOH extract was still categorized as a strongly active extract for antioxidants. The extraction process affects the composition and variation of compounds dissolved in the extract. The differences may also influence the composition of antioxidant compounds in the extract [32].
GC-MS and LC-MS measurements were carried out to analyze the tentatively identified volatile and non-volatile compounds contained in the large-scale EtOH extract of cinnamon based on their specific m/z values (Table 4). This research limited the identification of phenolics, flavonoids, and compounds to cosmetic applications. In the GC-MS analysis, four phenylpropanoids were identified in the cinnamon extract, comprising (E)-cinnamaldehyde, cinnamyl alcohol, coumarin, and 3,4-dihydrocoumarin. These compounds have also been reported in cinnamon of different origins [7,8,9,10,11] and are commonly utilized as fragrance or perfuming ingredients and flavoring agents in cosmetics and skin care products [33,34]. Furthermore, in the LC-MS analysis, four phenylpropanoids were found, the same as in the GC-MS analysis, together with three flavonoids, i.e., kaempferol, procyanidin dimer, and procyanidin trimer, and one terpenoid, linalool. All the compounds have also been detected in the same species of various origins [7,8,9,10,11]. Kaempferol and procyanidin derivatives are widely used as antioxidant and anti-aging agents for cosmetic purposes [35,36]. At the same time, linalool helps to improve the scent and taste of beauty product formulations and acts as an anti-stress and soothing ingredient [37]. Therefore, cinnamon extract is an excellent source of phenolic constituents of interest to the cosmetic industry.
Table 4.
Chemical constituent analysis of large-scale EtOH extract of cinnamon by GC-MS and LC-MS. Identification was based on their specific m/z values and comparison to literature data and MS database.
3.3. Stability Test of Cinnamon Extract
A stability test of the cinnamon extract was conducted as a preliminary experiment for use in cosmetics. This test was carried out with the addition of ascorbic acid for 16 weeks of investigation. Ascorbic acid was selected as a stabilizer due to its photoprotection, wound healing, and anti-pigmentary abilities. Moreover, ascorbic acid also plays a fundamental role in skin health according to its antioxidant activity [38]. The stability test in the absence of a stabilizer was also conducted to study the effect of ascorbic acid. The present work represents the first time Indonesian cinnamon extract has been stabilized with a stabilizing agent.
The optimal concentration of ascorbic acid in beauty products depends on its formulation. In cosmetics, producers recommend using ascorbic acid in higher concentrations than in foods, generally between 5 and 15% [39]. In most cases, a product must have an ascorbic acid concentration greater than 8% to be biologically significant. However, a concentration greater than 20% does not increase its biological importance and, on the contrary, may lead to skin irritation [38]. Therefore, we added 10% and 15% ascorbic acid in this study to evaluate the extract’s stability. The selection of RT (27.0 + 1.0 °C) and an incubator (40 + 0.5 °C) minimized the oxidation of ascorbic acid, which led to degradation [40]. Additionally, these temperatures are commonly used in accelerated stability studies [20,21].
3.3.1. Physical Stability Test
The physical stability test, including the organoleptic test and pH measurement, was conducted every week. The organoleptic test included the odor, texture or consistency, and color, and the results are recapped in Table 5. This test evaluated the organoleptic changes for 16 weeks of storage at different temperatures. Each sample had a characteristic cinnamon scent, but the sample with no addition of ascorbic acid (A–B) tended to be more pungent than the present ones (C–F). Meanwhile, the texture of samples A–B was denser due to the absence of water in the ascorbic acid solution. After the seventh week of observation, all samples remained the same in odor but harder and thicker because of water evaporation. Moreover, ascorbic acid also affected the color of the sample. Anthocyanins were reported to make an essential contribution to the color of the cinnamon extract [41]. Over time, the presence of ascorbic acid in samples C–F will stabilize the color. However, it can also lead to the degradation of anthocyanins, making them lighter in color. The color stability of anthocyanins was affected by temperature, pH, type of solvent, light, enzyme, and oxygen [42]. The utilization of additives in stabilizing plant extract has been proven to contribute to excellent physical evaluations, such as color, odor, consistency, stickiness, dispersibility, homogeneity, and viscosity [19,20,21,22].
Table 5.
Organoleptic test of all stability test samples. The details of sample (extract) code refer to Table 1.
pH measurements were carried out to determine the effects of ascorbic acid and temperature on pH changes during storage. According to the pH measurements (Figure 1), overall, all samples exhibited a gradual decrease in pH during 16 weeks of storage. The absence of ascorbic acid in samples A–B showed a higher pH, and it was relevant to the dark color of these samples. Phenolics, such as flavonoids and tannins, corresponded to the dark color of samples. The hydroxyl groups in phenolics can easily be ionized under a basic-neutral condition, causing an increase in their solubility [43]. Furthermore, samples C–F indicated a more acidic pH due to ascorbic acid’s acidic atmosphere. The addition of ascorbic acid could maintain the pH by keeping it from decreasing significantly compared to the samples without ascorbic acid [19,20,21]. In addition, this phenomenon correlated with the stabilizer role of ascorbic acid at low pH. It was reported that ascorbic acid degraded faster at pH 7–8 than at pH 3–5 [44].
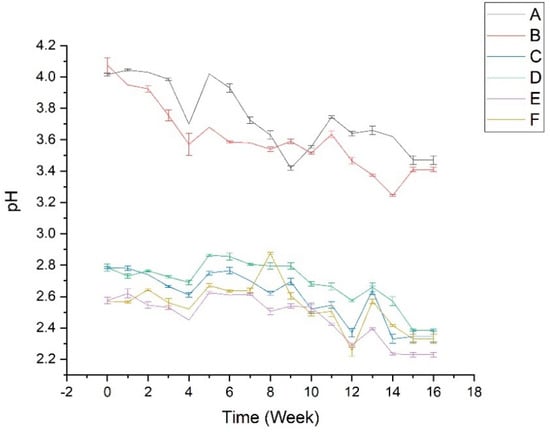
Figure 1.
pH measurement of all stability test samples. The details of sample code refer to Table 1.
3.3.2. Total Flavonoid Content and Antioxidant Activity
Quantitative flavonoid content and antioxidant activity were measured every four weeks to investigate the effect of ascorbic acid and temperature during 16 weeks of storage. The correlation between the two measurements is depicted in Figure 2. Based on Figure 2, the antioxidant activity increased with the total flavonoid and ascorbic acid contents, although the increase did not show a linear correlation. Both flavonoids and ascorbic acid could donate the proton in hydroxyl groups, playing a vital contribution to antioxidant abilities [8,38,39]. Generally, all stability tests were only covered for the physical or physicochemical evaluations in several days [19,20,22] or a maximum of 12 weeks of storage [21]. Therefore, a study on the total flavonoid content and antioxidant activity for the plant extract’s stability test is reported here for the first time for 16 weeks of observation.
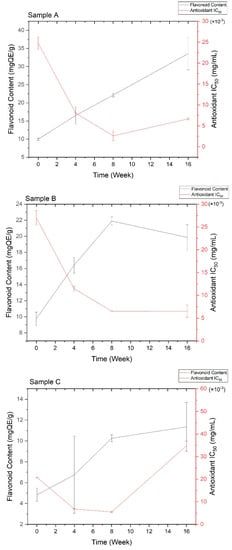
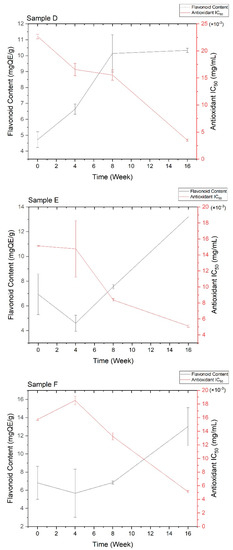
Figure 2.
Correlation between quantitative flavonoid content and antioxidant activity of all stability test samples. The details of sample code refer to Table 1.
Samples A-B showed higher flavonoid content and were more active as an antioxidant than samples C-F. This result was observed due to the possibility of ascorbic acid degradation. In addition, the storage temperature of 40 + 0.5 °C exhibited lower flavonoid content and antioxidant activity since both flavonoids and ascorbic acid were sensitive to the high temperatures [42,45]. Higher temperature can cause the degradation of ascorbic acid to dehydroascorbic acid with 80% activity, which is readily hydrolyzed to 2,3-diketogulonic acid with less antioxidant activity [40]. At the same temperature, the addition of 10% ascorbic acid provided more flavonoid content and better antioxidant activity compared to the 15% addition in the first eight weeks. The lower concentration of ascorbic acid leads to less degradation of flavonoids, providing an excellent protective effect [40,45]. On the other hand, the higher concentration of ascorbic acid provides the maximum flavonoid content and antioxidant activity in a prolonged storage time up to 16 weeks due to the retention and formation of bioactive compounds [46]. Therefore, 10–15% ascorbic acid is the best pharmacological concentration [38,39].
3.3.3. Chemical Constituent Analysis
The chemical constituent analysis using GC-MS and LC-MS was employed every eight weeks. This analysis was used to investigate the changes in tentatively identified compounds due to the addition of ascorbic acid and different temperatures during the storage time. Similar to the total flavonoid content and antioxidant activity, the changes in phytochemicals during the stability test are reported here for the first time. The GC-MS analysis of all stability samples exhibited differences in the chemical composition over observation time (Table 6). Overall, during the same observation period, the addition of ascorbic acid led to a decrease in (E)-cinnamaldehyde and an increase in coumarin composition. Samples without ascorbic acid showed a loss of (E)-cinnamaldehyde due to the oxidation process to give (E)-cinnamic acid, especially at higher temperatures [33]. Due to the prolonged storage time, cinnamyl alcohol could also undergo oxidation to produce (E)-cinnamic acid, which easily generated a coumarin scaffold by intramolecular cyclization. Thus, a drop in the composition of cinnamyl alcohol was observed in all samples [47]. Moreover, a decrease in (E)-cinnamaldehyde could also be explained by the ring formation of 3,4-dihydrocoumarin. It can be observed that with increasing 3,4-dihydrocoumarin levels (E)-cinnamaldehyde decreased and vice versa [48]. In all instances, a fall in coumarin’s composition resulted from a derivatization to yield 3,4-dihydrocoumarin [49].
Table 6.
Chemical constituent analysis of all stability test samples by GC-MS. Identification was based on their specific m/z values and comparison to literature data and MS database. The details of sample code refer to Table 1. W refers to week.
All chemical constituents analyzed by LC-MS of all stability test samples also revealed another set of changes (Table 7). All phenylpropanoids, including (E)-cinnamic acid, showed similarities to the previous GC-MS analysis. Furthermore, a fall in the composition of kaempferol was observed due to the conversion to obtain coumarins [50]. A degradation occurred in procyanidin trimer to its dimer by depolymerization and sensitivity to oxidation, causing a drop in the composition of procyanidin trimer [51]. Due to the conversion of aromatic compounds, such as phenylpropanoids and flavonoids, terpenes activating the formation of linalool resulted in an increase in linalool composition over time [52]. In addition, ascorbic acid was detected using LC-MS, and the composition decreased over time due to the degradation, leading to a growing intensity of dehydroascorbic acid and 2,3-diketogulonic acid [40]. Nevertheless, with the longer storage time, the degraded compounds were in a relative decline, as there was a small amount of ascorbic acid added versus the extract.
Table 7.
Chemical constituent analysis of all stability test samples by LC-MS. Identification was based on their specific m/z values and comparison to literature data and MS database. The details of sample code refer to Table 1. W refers to week.
The interaction between ascorbic acid and the samples containing flavonoids caused their faster degradation and loss of color. The specific decomposition process is currently unknown; however, the presumed mechanisms could be explained in three approaches, i.e., the direct condensation of ascorbic acid with flavonoids, the formation of hydrogen peroxide, and the oxidative cleavage of the pyrylium ring by peroxides [42]. The degradation of flavonoids in this interaction is due to their ability to act as a molecular oxygen activator, thus resulting in free radicals [53]. Consequently, samples with ascorbic acid tend to have lower flavonoid compositions and less active antioxidants than pure extracts. The storage temperature also affects the amounts of flavonoids and the antioxidant capacity. Due to higher storage temperature, flavonoids can undergo a multitude of mechanisms that will cause decomposition [42]. This study has proven that the stability of all samples decreases with increasing temperature. Although the presence of ascorbic acid could not significantly improve the total flavonoid content and antioxidant activity, it could maintain the pH and chemical constituents of the samples during the storage time. Thus, ascorbic acid could serve as a stabilizer in the cinnamon extract.
4. Conclusions
Chemical constituents, especially flavonoids, from Indonesian cinnamon were successfully large-scale macerated in ethanol. Ethanol was selected as the best solvent for extraction according to the yield percentage, flavonoid content, and antioxidant activity in the preliminary solvent screening. Ascorbic acid (10% and 15%, w/w) as a stabilizer in ethanol extract at RT (27.0 + 1.0 °C) and in an incubator (40 + 0.5 °C) affected its physical stability since the organoleptic tests exhibited stable results with no significant changes in the pH or chemical constituents. Each extract’s flavonoid content and antioxidant activity continued to increase until 16 weeks, except for extracts at high temperatures because of the long storage time and degradation. This research indicates that ascorbic acid has the potency to be used as a stabilizer in cosmetics from plant extracts for topical formulations, such as gels, lotions, and creams.
Author Contributions
Conceptualization, D.U.C.R.; methodology, D.U.C.R., R.A.H., S.A.M., and A.R.S.; software, R.A.H. and S.A.M.; validation, D.U.C.R. and A.R.S.; formal analysis, D.U.C.R., R.A.H., S.A.M., and A.R.S.; investigation, R.A.H. and S.A.M.; resources, D.U.C.R.; data curation, D.U.C.R., R.A.H., and S.A.M.; writing—original draft preparation, D.U.C.R., R.A.H., and S.A.M.; writing—review and editing, D.U.C.R.; visualization, D.U.C.R., R.A.H., and S.A.M.; supervision, D.U.C.R., and A.R.S.; project administration, D.U.C.R.; funding acquisition, D.U.C.R. All authors have read and agreed to the published version of the manuscript.
Funding
This research was carried out with financial support through a research collaboration grant between FMIPA UI and PT. Nose Herbalindo No. 002/NOSE/RND/PKS/V/2021 and/or 181/PKS/FMIPA/UI/2021.
Institutional Review Board Statement
Not applicable.
Informed Consent Statement
Not applicable.
Data Availability Statement
The data presented in this study are available on request from the corresponding authors. The data are not publicly available due to privacy reasons.
Acknowledgments
The authors acknowledge Bambang Sulaeman from Trop BRC, LPPM IPB University, Indonesia, for the technical support in collecting and preparing the cinnamon samples and Azhar Darlan and Taslim Maulana from Forensic Laboratory Center (Puslabfor) BARESKRIM POLRI, Sentul, Bogor, West Java, Indonesia, for the technical assistance in recording GC-MS and LC-MS.
Conflicts of Interest
The authors declare no conflict of interest.
References
- Batubara, I.; Prastya, M.E. Potential use of Indonesian medicinal plants for cosmetic and oral health: A review. Jurnal Kimia Valensi 2020, 6, 118–132. [Google Scholar]
- Amberg, N.; Fogarassy, C. Green Consumer behavior in the cosmetics market. Resources 2019, 8, 137. [Google Scholar] [CrossRef]
- Michalak, M. Plant-derived antioxidants: Significance in skin health and the ageing process. Int. J. Mol. Sci. 2022, 23, 585. [Google Scholar] [CrossRef]
- Cefali, L.C.; Ataide, J.A.; Moriel, P.; Foglio, M.A.; Mazzola, P.G. Plant-based active photoprotectants for sunscreens. Int. J. Cosmet. Sci. 2016, 38, 346–353. [Google Scholar] [CrossRef]
- Muhammad, D.R.A.; Dewettinck, K. Cinnamon and its derivatives as potential ingredient in functional food—A review. Int. J. Food Prop. 2017, 20, 2237–2263. [Google Scholar] [CrossRef]
- Menggala, S.R.; Vanhove, W.; Muhammad, D.R.A.; Hendri, J.; Speelman, S.; Van Damme, P. Sustainable harvesting of Cinnamomum burmannii (Nees & T. Nees) blume in kerinci regency, Indonesia. Sustainability 2019, 11, 6709. [Google Scholar] [CrossRef]
- Błaszczyk, N.; Rosiak, A.; Kałużna-Czaplińska, J. The potential role of cinnamon in human health. Forests 2021, 12, 648. [Google Scholar] [CrossRef]
- Durazzo, A.; Lucarini, M.; Souto, E.B.; Cicala, C.; Caiazzo, E.; Izzo, A.A.; Novellino, E.; Santini, A. Polyphenols: A concise overview on the chemistry, occurrence, and human health. Phytother. Res. 2019, 33, 2221–2243. [Google Scholar] [CrossRef]
- Liang, Y.; Li, Y.; Sun, A.; Liu, X. Chemical compound identification and antibacterial activity evaluation of cinnamon extracts obtained by subcritical n-butane and ethanol extraction. Food Sci. Nutr. 2019, 7, 2186–2193. [Google Scholar] [CrossRef]
- Muhammad, D.R.A.; Tuenter, E.; Patria, G.D.; Foubert, K.; Pieters, L.; Dewettinck, K. Phytochemical composition and antioxidant activity of Cinnamomum burmannii blume extracts and their potential application in white chocolate. Food Chem. 2021, 340, 127983. [Google Scholar] [CrossRef]
- Plumeriastuti, H.; Budiastuti; Effendi, M.E.; Budiarto. Identification of bioactive compound of the essential oils of Cinnamomum burmannii from several areas in Indonesia by gas chromatography–mass spectrometry method for antidiabetic potential. Natl. J. Physiol. Pharm. Pharmacol. 2019, 9, 279–283. [Google Scholar] [CrossRef]
- Wahba, H.E.; Sarhan, A.Z.; Salama, A.B.; Sharaf-Eldin, M.A.; Gad, H.M. Effect of Seasonal variation on the growth and chemical composition of Cynara cardunculus L. plants. J. Mater. Environ. Sci. 2017, 8, 318–323. [Google Scholar]
- Parham, S.; Kharazi, A.Z.; Bakhsheshi-Rad, H.R.; Nur, H.; Ismail, A.F.; Sharif, S.; RamaKrishna, S.; Berto, F. Antioxidant, antimicrobial and antiviral properties of herbal materials. Antioxidants 2020, 9, 1309. [Google Scholar] [CrossRef] [PubMed]
- Oladele, J.O.; Ajayi, E.I.; Oyeleke, O.M.; Oladele, O.T.; Olowookere, B.D.; Adeniyi, B.M.; Oyewole, O.I.; Oladiji, A.T. A systematic review on COVID-19 pandemic with special emphasis on curative potentials of nigeria based medicinal plants. Heliyon 2020, 6, e04897. [Google Scholar] [CrossRef] [PubMed]
- Khanal, A.; Devkota, H.P.; Kaundinnyayana, S.; Gyawali, P.; Ananda, R.; Adhikari, R. Culinary herbs and spices in Nepal: A review of their traditional uses, chemical constituents, and pharmacological activities. Ethnobot. Res. Appl. 2021, 21, 40. [Google Scholar] [CrossRef]
- Ribeiro-Santos, R.; Andrade, M.; Madella, D.; Martinazzo, A.P.; Moura, L.D.A.G.; De Melo, N.R.; Sanches-Silva, A. Revisiting an ancient spice with medicinal purposes: Cinnamon. Trends Food Sci. Technol. 2017, 62, 154–169. [Google Scholar] [CrossRef]
- Ainane, T.; Khammour, F.; Merghoub, N.; Elabboubi, M.; Charaf, S.; Ainane, A.; Elkouali, M.H.; Talbi, M.; Abba, E.H.; Cherroud, S. Cosmetic bio-product based on cinnamon essential oil “Cinnamomum verum” for the treatment of mycoses: Preparation, chemical analysis and antimicrobial activity. MOJ Toxicol. 2019, 5, 5–8. [Google Scholar] [CrossRef]
- Suliman, R.S.; Ali, H.; Nurulain, I.; Shamiha, N.N.; Nizam, M.; Budiasih, S.; Suliman, R.; Al-Gebaly, A. cinnamon bark extract for the formulation and characterisation of antimicrobial cream. Int. J. Res. Ayurveda Pharm. 2017, 8, 200–206. [Google Scholar] [CrossRef]
- Rohmani, S.; Kuncoro, M.A.A. Stabilization and activity test handsanitizer gel of kemangi leaves extract. J. Pharm. Sci. Clin. Res. 2019, 1, 16–28. [Google Scholar] [CrossRef]
- Vieira, R.P.; Fernandes, A.R.; Kaneko, T.M.; Consiglieri, V.O.; Pinto, C.A.S.D.O.; Pereira, C.S.C.; Baby, A.R.; Velasco, M.V.R. Physical and physicochemical stability evaluation of cosmetic formulations containing soybean extract fermented by Bifidobacterium animalis. Braz. J. Pharm. Sci. 2009, 45, 515–525. [Google Scholar] [CrossRef][Green Version]
- Jeon, S.M.; Ahn, J.Y.; Park, S.N. A Study on the stability test for the cream containing Suaeda asparagoides Extract. J. Soc. Cosmet. 2007, 33, 231–238. [Google Scholar]
- Xu, J.; Zhou, L.; Miao, J.; Yu, W.; Zou, L.; Zhou, W.; Liu, C.; Liu, W. Effect of cinnamon essential oil nanoemulsion combined with ascorbic acid on enzymatic browning of cloudy apple juice. Food Bioproc. Tech. 2020, 13, 860–870. [Google Scholar] [CrossRef]
- Kurniawanti, D.D.A.; Dianhar, H.; Rahayu, D.U.C.; Sugita, P. Phytochemical screening and preliminary evaluation of antioxidant activity of three indonesian araucaria leaves extracts. Sci. Arch. 2021, 2, 250–254. [Google Scholar] [CrossRef]
- Bhandari, L.; Rajbhandari, M. Isolation of quercetin from flower petals, estimation of total phenolic, total flavonoid and antioxidant activity of the different parts of Rhododendron arboreum smith. Sci. World 2015, 12, 34–40. [Google Scholar] [CrossRef]
- Rahayu, D.U.C.; Al-Laily, R.S.; Khalwani, D.A.; Anjani, A.; Handayani, S.; Saepudin, E.; Dianhar, H.; Sugita, P. Microwave-assisted synthesis of 4-methyl coumarins, their antioxidant and antibacterial activities. Rasayan J. Chem. 2022, 15, 1053–1062. [Google Scholar] [CrossRef]
- Razali, M.; Didaskalou, C.; Kim, J.F.; Babaei, M.; Drioli, E.; Lee, Y.M.; Szekely, G. Exploring and exploiting the effect of solvent treatment in membrane separations. ACS Appl. Mater. Interfaces 2017, 9, 11279–11289. [Google Scholar] [CrossRef] [PubMed]
- FDA. Bulk Drug Substances Nominated for Use in Compounding Under Section 503B of the Federal Food, Drug, and Cosmetic Act. Available online: https://www.fda.gov/media/94164/download (accessed on 27 March 2022).
- FDA. Alcohol Free. Available online: https://www.fda.gov/cosmetics/cosmetics-labeling-claims/alcohol-free (accessed on 27 March 2022).
- FDA. Toxicological Data for Class 3 Solvents. Available online: https://www.fda.gov/media/71194/download (accessed on 27 March 2022).
- Phongpaichit, S.; Nikom, J.; Rungjindamai, N.; Sakayaroj, J.; Hutadilok-Towatana, N.; Rukachaisirikul, V.; Kirtikara, K. Biological activities of extracts from endophytic fungi isolated from garcinia plants. FEMS Immunol. Med. Microbiol. 2007, 51, 517–525. [Google Scholar] [CrossRef]
- Chaves, J.O.; De Souza, M.C.; Da Silva, L.C.; Lachos-Perez, D.; Torres-Mayanga, P.C.; Machado, A.P.D.F.; Forster-Carneiro, T.; Vázquez-Espinosa, M.; González-de-Peredo, A.V.; Barbero, G.F.; et al. Extraction of flavonoids from natural sources using modern techniques. Front. Chem. 2020, 8, 507887. [Google Scholar] [CrossRef]
- Jiménez-Moreno, N.; Volpe, F.; Moler, J.A.; Esparza, I.; Ancín-Azpilicueta, C. Impact of extraction conditions on the phenolic composition and antioxidant capacity of grape stem extracts. Antioxidants 2019, 8, 597. [Google Scholar] [CrossRef]
- Gunia-Krzyżak, A.; Słoczyńska, K.; Popiół, J.; Koczurkiewicz, P.; Marona, H.; Pękala, E. Cinnamic acid derivatives in cosmetics: Current use and future prospects. Int. J. Cosmet. Sci. 2018, 40, 356–366. [Google Scholar] [CrossRef]
- Pan, T.-L.; Wang, P.-W.; Aljuffali, I.A.; Leu, Y.-L.; Hung, Y.-Y.; Fang, J.-Y. Coumarin derivatives, but not coumarin itself, cause skin irritation via topical delivery. Toxicol. Lett. 2014, 226, 173–181. [Google Scholar] [CrossRef] [PubMed]
- Ronsisvalle, S.; Panarello, F.; Longhitano, G.; Siciliano, E.A.; Montenegro, L.; Panico, A. Natural flavones and flavonols: Relationships among antioxidant activity, glycation, and metalloproteinase inhibition. Cosmetics 2020, 7, 71. [Google Scholar] [CrossRef]
- Rue, E.A.; Rush, M.D.; Van Breemen, R.B. Procyanidins: A comprehensive review encompassing structure elucidation via mass spectrometry. Phytochem. Rev. 2018, 17, 1–16. [Google Scholar] [CrossRef] [PubMed]
- Sharmeen, J.B.; Mahomoodally, F.M.; Zengin, G.; Maggi, F. Essential oils as natural sources of fragrance compounds for cosmetics and cosmeceuticals. Molecules 2021, 26, 666. [Google Scholar] [CrossRef]
- Ravetti, S.; Clemente, C.; Brignone, S.; Hergert, L.; Allemandi, D.; Palma, S. Ascorbic acid in skin health. Cosmetics 2019, 6, 58. [Google Scholar] [CrossRef]
- Enko, J.; Gliszczyńska-Świgło, A. Influence of the interactions between tea (Camellia sinensis) extracts and ascorbic acid on their antioxidant activity: Analysis with interaction indexes and isobolograms. Food Addit. Contam. Part A 2015, 32, 1234–1242. [Google Scholar] [CrossRef]
- Yin, X.; Chen, K.; Cheng, H.; Chen, X.; Feng, S.; Song, Y.; Liang, L. Chemical stability of ascorbic acid integrated into commercial products: A review on bioactivity and delivery technology. Antioxidants 2022, 11, 153. [Google Scholar] [CrossRef]
- Wu, X.; Beecher, G.R.; Holden, J.M.; Haytowitz, D.B.; Gebhardt, S.E.; Prior, R.L. Concentrations of anthocyanins in common foods in the United States and estimation of normal consumption. J. Agric. Food Chem. 2006, 54, 4069–4075. [Google Scholar] [CrossRef]
- Enaru, B.; Drețcanu, G.; Pop, T.D.; Stǎnilǎ, A.; Diaconeasa, Z. Anthocyanins: Factors affecting their stability and degradation. Antioxidants 2021, 10, 1967. [Google Scholar] [CrossRef]
- Mattioli, R.; Francioso, A.; Mosca, L.; Silva, P. Anthocyanins: A comprehensive review of their chemical properties and health effects on cardiovascular and neurodegenerative diseases. Molecules 2020, 25, 3809. [Google Scholar] [CrossRef]
- Herbig, A.-L.; Renard, C.M.G.C. Factors that impact the stability of vitamin c at intermediate temperatures in a food matrix. Food Chem. 2017, 220, 444–451. [Google Scholar] [CrossRef]
- Pérez-Lamela, C.; Franco, I.; Falqué, E. Impact of high-pressure processing on antioxidant activity during storage of fruits and fruit products: A review. Molecules 2021, 26, 5265. [Google Scholar] [CrossRef] [PubMed]
- Cao, H.; Saroglu, O.; Karadag, A.; Diaconeasa, Z.; Zoccatelli, G.; Conte-Junior, C.A.; Gonzalez-Aguilar, G.A.; Ou, J.; Bai, W.; Zamarioli, C.M.; et al. Available technologies on improving the stability of polyphenols in food processing. Food Front. 2021, 2, 109–139. [Google Scholar] [CrossRef]
- Niklasson, I.B.; Delaine, T.; Islam, M.N.; Karlsson, R.; Luthman, K.; Karlberg, A.-T. Cinnamyl alcohol oxidizes rapidly upon air exposure. Contact Derm. 2013, 68, 129–138. [Google Scholar] [CrossRef] [PubMed]
- Lončar, M.; Jakovljević, M.; Šubarić, D.; Pavlić, M.; Buzjak Služek, V.; Cindrić, I.; Molnar, M. Coumarins in food and methods of their determination. Foods 2020, 9, 645. [Google Scholar] [CrossRef] [PubMed]
- Stefanachi, A.; Leonetti, F.; Pisani, L.; Catto, M.; Carotti, A. Coumarin: A natural, privileged and versatile scaffold for bioactive compounds. Molecules 2018, 23, 250. [Google Scholar] [CrossRef]
- Voges, M.J.E.E.E.; Bai, Y.; Schulze-Lefert, P.; Sattely, E.S. Plant-derived coumarins shape the composition of an arabidopsis synthetic root microbiome. Proc. Natl. Acad. Sci. 2019, 116, 12558–12565. [Google Scholar] [CrossRef]
- De Taeye, C.; Cibaka, M.-L.K.; Collin, S. Occurrence and antioxidant activity of C1 degradation products in cocoa. Foods 2017, 6, 18. [Google Scholar] [CrossRef]
- Ashaari, N.S.; Rahim, M.H.A.; Sabri, S.; Lai, K.S.; Song, A.A.-L.; Rahim, R.A.; Abdullah, J.O. Kinetic studies and homology modeling of a dual-substrate linalool/nerolidol synthase from Plectranthus amboinicus. Sci. Rep. 2021, 11, 17094. [Google Scholar] [CrossRef]
- Speisky, H.; Shahidi, F.; Costa de Camargo, A.; Fuentes, J. Revisiting the oxidation of flavonoids: Loss, conservation or enhancement of their antioxidant properties. Antioxidants 2022, 11, 133. [Google Scholar] [CrossRef]
Publisher’s Note: MDPI stays neutral with regard to jurisdictional claims in published maps and institutional affiliations. |
© 2022 by the authors. Licensee MDPI, Basel, Switzerland. This article is an open access article distributed under the terms and conditions of the Creative Commons Attribution (CC BY) license (https://creativecommons.org/licenses/by/4.0/).