Abstract
The search for alternatives to animal testing in cosmetics has encouraged the development of in vitro systems capable of evaluating formulation-driven biophysical parameters assessed on human skin. This study presents a cell-free tri-layered chitosan membrane as a material-based model for characterizing the physicochemical anti-aging performance of topical formulations. Three cosmetic products were incorporated either in the top layer (1L(t)) or across all layers (3L), and key parameters—including pore area, water permeation, firmness, elasticity, swelling and moisture retention—were quantified. VitCOil produced consistent effects across configurations, reducing pore area by 52–56% and decreasing water permeation by 54–61%, while increasing moisture retention by 36–38%. OilSerum showed a marked layer-dependent response, enhancing swelling by +70% in 3L and +35% in 1L(t), and increasing water permeation by 16% (3L) and 4% (1L(t)). EyeCr improved firmness and elasticity at low concentration, with stronger elastic response in the top layer (+27% in 3L; +34% in 1L(t)). Overall, this novel platform strengthens early-stage physicochemical screening by linking formulation-dependent mechanisms with directional biophysical trends observed clinically.
1. Introduction
Physical appearance is primarily associated with the face, considered one of the most important social factors. As global life expectancy continues to rise, the manifestation of age-related changes has become increasingly visible, exerting a significant impact on psychological well-being and self-esteem—particularly among women, who are more susceptible to such effects due to menopause-associated physiological transitions [1,2,3]. Recent evidence underscores this growing concern: during the COVID-19 pandemic, a survey of 1434 consumers revealed that 44% perceived a decline in skin satisfaction compared to five years earlier, with younger participants and women expressing higher levels of dissatisfaction [4]. Consistently, a 2024 Statista report indicated that nearly half of U.S. consumers aged over 43 prioritized anti-aging properties when selecting skincare products in 2022 [5]. Supporting these findings, an observational study of 511 individuals seeking aesthetic treatments reported that 80% expressed a desire to preserve a youthful appearance, irrespective of socioeconomic background [3]. In response to this increasing demand, rejuvenation strategies have evolved substantially, ranging from invasive procedures such as plastic surgery and injectable fillers [6,7,8], to minimally invasive techniques including chemical peels, laser treatments, and platelet-rich plasma therapy [9,10]. Non-invasive modalities further encompass topical pharmaceutical and cosmetic formulations [2,11], as well as nutritional supplements aimed at mitigating visible aging signs [12,13]. Reflecting this growing interest, the global anti-aging skincare market—valued at USD 62.6 billion in 2021—is projected to reach approximately USD 92 billion by 2027 [4].
Given this rapid market expansion, ensuring the safety and efficacy of cosmetic formulations has become a critical prerequisite for regulatory compliance and consumer protection. Daily cosmetic use necessitates rigorous safety and performance evaluations to prevent adverse reactions and substantiate product claims. Historically, such evaluations relied on animal testing; however, since 11 March 2009, the EU has banned the marketing of cosmetics and cosmetic ingredients tested on animals, with the complete enforcement of the marketing ban in 2013. As a consequence, cosmetic safety and efficacy assessment has progressively shifted towards non-animal alternatives. These regulatory changes have reshaped cosmetic research over the past decade, accelerating the development and adoption of New Approach Methodologies (NAMs) as alternatives to animal testing [6,7].
Validated NAMs—including reconstructed human epidermis (RhE) models such as EpiSkin™, EpiDerm™, SkinEthic™ and epiCS®, as well as full-thickness skin equivalents like Phenion®—provide physiologically relevant cell-based platforms, but remain costly, technically demanding and limited by short shelf-life [8]. To address these constraints, several synthetic and natural biomaterial-based scaffolds have been explored as more accessible, often cell-free alternatives. Among them, chitosan-based systems—either alone or combined with gelatin, collagen, alginate, hyaluronan or related polymers—can be engineered to modulate elasticity, water uptake and mechanical stability [9,10,11,12,13,14,15,16,17,18,19,20]. However, most of these models still capture only specific aspects of human skin and are not optimized for routine, formulation-driven anti-aging screening. In this context, the present study evaluates a tri-layered chitosan membrane as a viable and cost-effective alternative to conventional commercial models, which often involve complex handling procedures and limited operational scalability, particularly when they rely on living cells cultured within artificial scaffolds [21,22].
The present approach instead focuses exclusively on physicochemical and mechanical responses. The tri-layer membrane was conceived as a controlled multilayer polymeric scaffold to evaluate physicochemical responses to topical formulations, without aiming to reproduce full skin architecture or physiology. As a cell-free, self-standing material, it is compatible with demanding mechanical and physicochemical assays such as rheological deformation, microneedle activation and water-swelling tests. In contrast, current 3D biological skin models, although optimized for cellular viability, rely on thin epidermal layers supported by soft collagen-based matrices, which are not self-supporting, tend to deform or delaminate under swelling, and cannot withstand intensive rheological or tensile testing without compromising tissue integrity [23,24,25,26]. For these reasons, RhE systems (e.g., EpiSkin™, SkinEthic™, EpiDerm®) were not included as comparators in this study.
Ch, a deacetylated derivative of chitin [27,28], shares structural similarities with glycosaminoglycans (GAGs) [29] and exhibits antimicrobial, haemostatic, and antifungal properties [11,13,15,30,31,32,33,34,35]. Compared to collagen, it offers lower cost, absence of contraction in fibroblast cultures [36,37], and sustainable sourcing [38]. Notably, its degree of deacetylation (DDA) can be tuned between 50 and 100%, allowing control over its physicochemical and biological behavior [39].
To our knowledge, no previous study has applied a tri-layered, cell-free chitosan membrane as an in vitro alternative for predicting the physicochemical component of anti-aging formulation performance. In this study, we test the hypothesis that the ionically crosslinked tri-layered chitosan membrane functions as a material-based, physicochemical and predictive in vitro model for evaluating the anti-aging performance of topical cosmetic formulations. Specifically, we hypothesize that the membrane’s biophysical responses (pore area variation, water permeation, firmness, elasticity, swelling and moisture retention) will reproduce the directional trends—several of which have been previously reported in clinical studies for the same commercial formulations—thus supporting its applicability as a NAM.
It is important to note that the present model is intentionally cell-free and therefore cannot evaluate biological anti-aging mechanisms such as collagen synthesis, elastin regulation, oxidative-stress responses or inflammatory pathways. In this work, the term ‘anti-aging efficacy’ refers exclusively to biophysical trends (firmness, elasticity, swelling, moisture retention, pore area, and permeability), which are the same instrumental endpoints commonly assessed in clinical cosmetic studies. Thus, the model is proposed as a physicochemical NAM suitable for early-stage screening rather than as a replacement for biological assays. While the model is cell-free, its mechanical behavior enables it to mimic physicochemical and biomechanical responses—such as hydration, swelling, surface elasticity, tightness, and barrier-like behavior—that characterize early instrumental measurements in vivo [40]. In this way, the model aligns with the physicochemical component of topical product performance.
To validate the model’s applicability, three commercial facial finished cosmetic products (FCPs) with different galenic forms and with anti-aging claims—vitamin C oil, firming oil serum, and eye cream—were tested [41]. The formulations were introduced either to the top layer of the membrane or across all three layers, with results compared to a blank membrane (Supplementary Figure S1).
The complete ingredient lists of the three tested cosmetic products are provided in Supplementary Table S1.
1.1. Overview of the Three Anti-Aging FCPs: Claimed Benefits and Galenic Forms
1.1.1. Anti-Aging Vitamin C Face Oil (VitCOil)
This facial oil contains 30% ascorbyl tetraisopalmitate, an oil-soluble derivative of vitamin C. According to the brand, it reduces pore size, has an anti-wrinkle effect, improves signs of photoaging, diminishes dark spots, and enhances radiance and luminosity.
1.1.2. Anti-Aging Face Oil Serum (OilSerum)
Marketed as an oil-based serum designed for mature, dry, and dull skin, this product combines hydrophilic solvents (water, glycerin, alcohol) with emollient oils (Camellia Japonica and Rosa Canina seed oils). Based on the ingredient listing, the formulation is predominantly aqueous, with oils incorporated as a minor phase. Reported benefits include quick absorption, hydration, comfort, and instant radiance and firmness while respecting the skin barrier. Its firming effect has been substantiated.
1.1.3. Anti-Aging Eye Contour Cream (EyeCr)
A water-in-oil emulsion specially formulated for the periorbital region, incorporating six anti-aging peptides. Claimed to reduce fine lines, brighten dark areas, reduce puffiness, and provide a lifting effect. Its anti-wrinkle, firming, and elasticity effects have been substantiated.
The visual appearance of these products is shown in Supplementary Figure S2.
1.2. Estimation of the Concentrations of FCPs to Be Studied
The Organization for Economic Co-operation and Development (OECD) guidelines were employed as an initial framework to estimate the amount of finished cosmetic product (FCP) to be applied onto the chitosan-based membrane [42,43]. These guidelines are primarily designed for assessing the safety of cosmetic ingredients and serve as a valuable reference for determining realistic exposure conditions.
According to the OECD, the estimation of a product’s quantity mimicking human exposure normally corresponds to 1–5 mg/cm2 of skin for a solid and up to 10 μL/cm2 for liquids. In the present study, these values were adopted exclusively as preliminary reference points to inform the preparation of the membrane-loading solutions. It is important to note that these concentrations were not intended to represent optimized or definitive application levels, but rather a scientifically justified starting range.
To complement these reference points, additional consideration was given to the wide variability in the reported distribution of cosmetic ingredients following topical application. The dataset published by Hewitt et al. [44], which evaluated 56 cosmetic ingredients, was used only to contextualize the broad range of possible exposure levels. Reported values varied from nearly complete recovery to very low residual fractions, depending on physicochemical parameters such as solubility, molecular weight and diffusivity.
For the purposes of this work, the formulation present in the membrane-loading solution was defined as the application-level concentration (100%), while 1% of this value was used as a reduced-dose condition. This 1% value was selected as a conservative lower-bound estimate, consistent with the lowest ranges reported in the Hewitt et al. dataset [44], and served solely to explore concentration-dependent physicochemical responses within the in vitro system. These values were not intended to model biological or physiological penetration.
2. Materials and Methods
Ch (product number 448877) of medium MW was acquired from Aldrich, Merck Life Science S.L. (Madrid, Spain); it originated in seashells and had a DDA of 85%: batch nº STBH9838 and a viscosity of 340 cps (1% in 1% Acetic Acid (AcOH), 20 °C).
Acetic Acid (AcOH) glacial and Sodium Hydroxide (NaOH) pellets were acquired from PanReac AppliChem, Panreac Química S.L.U. (Barcelona, Spain). Sodium tripolyphosphate (TPP) with a technical grade of 95.2% was supplied by Alfa Aesar, Thermofisher GmbH (Kandel, Germany). Agarose BioReagent for molecular biology, low electroendosmosis (EEOO), was supplied by Sigma, Merck Life Science S.L. (Madrid, Spain). The phosphate-buffered saline tablets (PBS) were supplied by Sigma, Merck Life Science S.L. (Madrid, Spain). One tablet of PBS dissolved in 200 mL of deionized water yields 0.01 M phosphate buffer, 0.0027 M potassium chloride, and 0.137 M sodium chloride, pH 7.4, at 25 °C. Calcium chloride from Quimivita, S.A. (Barcelona, Spain) was used in its granular form. Three FCPs with different formulas were also studied: an oil-based vitamin C face oil, a hydro-alcoholic anti-aging oil serum, and an oil-in-water (O/W) emulsion-based eye contour cream.
Petri dishes with a diameter of 90 mm were used for the manipulation of the different layers. Teflon molds were fabricated at the university and were especially designed for the creation of these membranes. The molds were composed of a base scaffold with a cylinder piece with a diameter of 6 cm, which fitted in the round gap, a lid, an extra lid for pressing the membrane and assuring the obtention of the same thickness, and a cylindrical tube.
The microneedle device was a 140 DRS® system acquired through https://www.ibeautymachine.com/micro-needle-derma-stamp.html (access on 4 November 2025), GBS International Holding Ltd. (Guangzhou, China). It was composed of 140 stainless steel microneedles; the needle width was 0.25 mm, and the needle spacing was 1.58 mm. The depth of the needles could be adjusted from 0.2 to 3.0 mm in order to ensure that they crossed all membrane layers. In this study, a Dermastamp® with needles of a 3.0 mm depth was employed. Therefore, complete perforation of the three layers of the membrane was achieved.
Franz cells of a customized size were designed and fabricated by Fisher Scientific, S.L., part of Thermofisher Scientific (Madrid, Spain).
2.1. Solution Preparation
A stock solution obtained with Ch 85% DDA was used to create the membranes containing the three FCPs described.
2.1.1. Preparation of the Stock Solution
The Ch stock solution was prepared following the method previously described [39]. The experimental details are provided in the Supplementary Section S2.1.1 and in Supplementary Figure S3.
2.1.2. Preparation of FCPs’ Liquid Solution
The solutions were prepared by adding the liquids FCP, VitCOil or OilSerum, to a known quantity of stock solution (as described in Section 2.1.1). Once the products were added to their respective solutions, automatic stirring was performed for 30 min at 542 rpm (Supplementary Figure S4).
In the case of VitCOil, the resultant solution had a milky appearance, despite being homogeneous, due to it being an oil. A slight decrease in the viscosity was observed.
They were independently tested first in the top layer of the membrane to simulate topical application and, later, in all three layers.
2.1.3. Preparation of FCPs’ Semisolid Solution
To effectively incorporate the semisolid cosmetic product (EyeCr) into the Ch membrane, the addition order of components was modified to prevent solid cream traces. A detailed methodology and a flowchart are provided in the Supplementary Material (Section S2.1.3 and Figure S5, respectively).
2.2. Concentration Estimation of the Finished Cosmetic Products in the Stock Solution
For calculation of the FCP concentrations to be used in the Ch 85% DDA solution, the OECD guidelines [42,43] for the in vitro skin absorption testing of chemicals were used. In addition, and following common practice in absorption-related testing [40], a “low-dose” condition was also included. In this study, a 1% concentration was selected to represent a minimal exposure scenario, consistent with the lower-bound values reported for a wide range of cosmetic ingredients. This low-dose condition was used only to explore concentration-dependent physicochemical responses of the membrane, without implying physiological penetration through skin [44]. These values were not intended to model biological absorption, but rather to define realistic application-level and reduced-dose concentration ranges for the in vitro system.
As previously stated, according to the OECD, the estimated amount of product representing human exposure is typically 1–5 mg/cm2 for solids and up to 10 μL/cm2 for liquids. As creams are classified as semi-solid products, their application amount was determined based on the OECD’s recommendations for solids.
The surface area of the membrane was calculated in cm2, starting from a diameter of 6 cm. With Equation (1), the area of a circle was calculated.
where A is the area of the circle and r is the radius of the membrane (3 cm).
The area was found to be 28.26 cm2.
2.2.1. Concentration Calculations for Liquid FCPs
Both VitCOil and OilSerum were considered liquids, with a maximum application volume of 0.01 mL/cm2 (equivalent to the OECD guideline limit of 10 μL/cm2). The density of VitCOil (0.88 g/mL) was used as the reference for calculating the applied volume for both products; using the density of OilSerum (1.049 g/mL) would have resulted in a volume exceeding this recommended limit.
The quantity of liquid product per cm2, in grams, was determined as follows (Equation (2)):
where 0.88 g/mL is the density of the liquid product, 0.01 mL/cm2 is the OECD-recommended maximum application volume per unit area, and PL represents the mass of liquid product per unit area (g/cm2).
The total quantity of liquid product to be included in the solution corresponding to the top layer of the membrane was calculated as follows (Equation (3)):
where 0.2487 g is the total amount of liquid product (PL) to be applied to the membrane surface area A = 28.26 cm2.
Finally, the concentration of liquid product to be included in the stock solution, based on 3 g of stock solution used to form the top layer, was calculated as follows (Equation (4)):
Accordingly, 8.3% of liquid product—considering both VitCOil and OilSerum as liquids—was added to the stock solution to represent a realistic topical application level. This concentration (8.3%) was used in the top layer as well as in all three membrane layers for comparison and simplification.
Additionally, a lower concentration of 0.083% liquid product in the stock solution was included in selected experiments to explore concentration-dependent physicochemical effects. This 0.083% corresponds to 1% of the application-level solution and was chosen as a reduced-dose condition consistent with minimal exposure values reported for various cosmetic ingredients [44]. This reduced concentration was used only to define a lower-bound testing range for the in vitro system and does not imply actual physiological skin penetration. These reduced concentrations, therefore, directly derive from the 1% low-dose criterion described above.
2.2.2. Concentration Calculations for Semisolid or Solid FCPs
The semisolid EyeCr was considered to be solid for the calculations, with an average OECD-recommended dosage of 2.5 mg/cm2.
The total quantity of solid product to be included in the solution corresponding to the top layer of the membrane was calculated as follows (Equation (5)):
where PS represents the solid product applied to the membrane surface area A = 28.26 cm2.
The concentration of solid product to be included in the stock solution, based on 3 g of stock solution used to form the top layer, was calculated as follows (Equation (6)):
Accordingly, 2.4% of solid product—in this case, EyeCr—was added to the stock solution. This concentration (2.4%) was included in the top layer as well as in all three membrane layers for comparison and simplification.
In addition, a lower concentration of 0.024% solid product was included in selected experiments to explore concentration-dependent physicochemical responses. This reduced concentration corresponds to 1% of the application-level solution and was chosen as a minimal-dose condition consistent with lower-bound exposure values reported for various cosmetic ingredients [44]. This reduced-dose condition was not intended to simulate physiological skin penetration, but rather to define a realistic low-range concentration for the in vitro model.
2.3. Membrane Characterization and Preparation
2.3.1. Characterization of the Different Membranes
The different kinds of membranes prepared were identified using MYL(z)-C%X, where M = the membrane; “Y” as 3L or 1L = the number of layers containing the FCPs of study (three or one layer, respectively); “L” = layer; subindex “z” = when blank, the FCP was introduced in 3L or, when (t), the FCP was introduced in the top layer; “C” = the concentration % (w/w) of Ch (blank) or the FCP added to the Ch stock solution; and X = the FCP (VitCOil, OilSerum, or EyeCr). All the membranes were crosslinked with TPP.
2.3.2. Membrane Preparation
The tri-layer arrangement was selected to provide a controlled polymeric environment with tunable mechanical behavior, not to replicate epidermal or dermal structures.
The membrane was prepared in three steps to create three layers, as previously described [39]. The detailed methodology and schematic representation of the process are provided below.
As shown in Figure 1, the step-by-step process for preparing the tri-layered membranes is illustrated, including the incorporation of FCP either individually on the top layer or combined across the three layers.
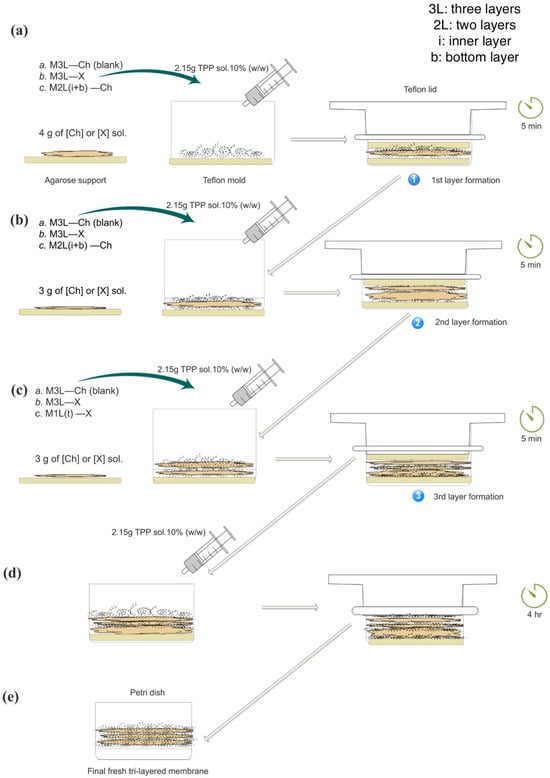
Figure 1.
Schematic representation of the formation of the tri-layered crosslinked membrane with the cosmetic product incorporated into the target layer, compared to blank membrane. (a) Formation of the first layer; (b) Formation of the second layer; (c) Formation of the third layer; (d) Resting/curing period; (e) Final freshly prepared tri-layered membrane. Membrane codes: a. M3L—Ch (blank) for blank membranes containing the chitosan stock solution in all three layers (3L); b. M3L—X for membranes containing the cosmetic product solutions in the 3L; and c. M1L(t)—X for membranes containing the cosmetic product solutions in the top layer. The bottom (b) and inner layers (i) of c. M1L(t)—X were identified as M2L(i+b)—Ch. All stock solutions contained 2.6% of Ch. Diagonal arrows indicate the progression of the same product to the next step.
The base layer (bottom) was made by weighing 4 g of either a Ch solution (for blank membranes) or an FCP solution. The second layer (inner) consisted of 3 g of the same respective solution—Ch or FCP membranes. Similarly, the top layer was prepared with 3 g of Ch (in the case of blank membranes or FCP solution). The bottom layer was prepared with 4 g instead of 3 g to ensure mechanical stability during the formation process. Using 3 g for this layer produced a thinner film that occasionally shifted or detached when the agarose support was removed, whereas 4 g provided sufficient thickness and cohesion for reliable handling. The 4 g/3 g/3 g configuration also yielded a stable stratified structure in which each layer could display slightly different physicochemical behavior, improving overall robustness and uniform crosslinking. This arrangement was conceptually inspired by the hierarchical organization found in multilayer biological tissues, such as skin, but implemented purely for structural and physicochemical purposes.
Each layer was sequentially crosslinked using a 10% TPP solution. Once assembled, the membrane was left undisturbed in the mold for 4 h to allow it to set, with a Teflon lid placed on top to ensure a flat surface. After this resting period, the membrane was weighed and stored in a Petri dish.
The preparation of the membranes was carried out at 20 ± 3 °C and 75 ± 10% of RH for all tests, except for the rheology ones. For these tests, as temperature is a critical parameter influencing the Storage modulus (G′), the membranes were obtained at 19 ± 0.5 °C.
The tri-layered membrane’s preparation consisted of creating three layers, the difference being the addition of the solution containing the FCPs to the top layer, 1L(t), and comparing it to its inclusion in 3L (Figure 1).
Finally, a different curation process was carried out to distinguish between the base and activated membranes, whereby physical pores were created on the latter using a microneedle device, based on the method previously reported [39,45]. The detailed experimental steps are described below.
2.3.3. Base Membrane Curing Process
The last step in obtaining a crosslinked membrane and improving its resistance was to soak it in a 10% (w/w) TPP solution bath for 1 h and 5 min, followed by a 15 min water bath, with both baths involving magnetic stirring, in order to remove excess TPP (Figure 2, right side).
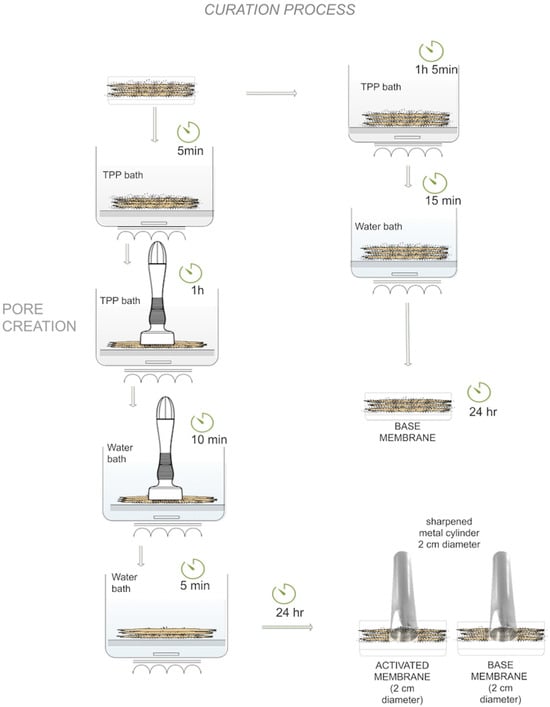
Figure 2.
Scheme of the curing process of activated and base tri-layered membranes.
2.3.4. Activated Membrane Curing Process
After membrane formation, it was immersed in a 10% TPP solution for 5 min to improve consistency. It was then punched using the DermaStamp® microneedling device set to a 3.0 mm depth, with an agarose layer underneath to confirm complete perforation. While still being punctured, the membrane was soaked again in the same TPP solution for 1 h. A 10-min water bath followed, continuing the puncturing to remove excess TPP. The microneedles were then retracted to prevent damage, and a final 5-min water bath was used to eliminate remaining TPP. The process is illustrated in Figure 2 (left side).
After 24 h, the membranes were ready for use and cut to obtain round samples with a 2 cm diameter.
2.4. Concentration of Finished Cosmetic Product and Chitosan
The stock solution contained 2.6% Ch and 0.56% NaOH. Different concentrations of FCP were added, according to the product, as previously reported. The resulting Ch concentration (%) in the solution after the addition of a given amount of FCPs [X] was calculated using Equation (7):
where X is the mass (g) of FCP added.
Table 1 shows the characterization of the membranes, with the inclusion of the FCPs in 3L or 1L(t) at the different concentrations studied. When X was contained in 1L(t), it was always introduced into the top layer to simulate topical application, with the inner and bottom layers being a 2.6% Ch solution (stock solution).

Table 1.
ID of different membranes, including the percentage of FCPs in 3L or 1L(t).
2.5. Instrumental Tests
All characterization experiments presented below were carried out on tri-layered crosslinked base membranes, except for pore quantification and the permeation tests, where only activated tri-layered crosslinked membranes were used.
All experiments were conducted in the ranges of 20 ± 3 °C and 75 ± 10% of relative humidity (RH).
2.5.1. Pore Area Calculation
The pore variation effect is the capacity of a material to change its pore size compared to that in its initial state.
The quantification of pore areas was conducted on activated membranes, where mechanical pore channels had been created. The pores of the tri-layered crosslinked membranes were observed with a Euromex Bioblue Optical Microscope. Periodic pores were optically checked throughout the activated tri-layered crosslinked membrane.
The mean pore reduction percentage compared to the blank membrane was calculated according to Equation (8).
where represents the pore area (µm2) on the activated membrane containing the cosmetic product, and represents the pore area (µm2) of the blank activated membrane.
2.5.2. Permeation Tests
According to the World Health Organization (WHO) [46], permeation is one of the three steps that define the percutaneous/dermal absorption process. Permeation is the penetration through one layer into another, which is both functionally and structurally different from the first layer.
Customized Franz cells from Fisher Scientific, S.L. (Madrid, Spain) were employed in the water permeation tests. To determine the permeation over time, 30 g of deionized water was introduced into the donor compartment, and the permeated water was collected in the receptor compartment. The mean permeation percentage after 1 min compared to the blank membrane was calculated according to Equation (9).
where represents the mass of water that permeated through the activated membrane containing the specific concentration of the FCP, and represents the mass of water that permeated through the blank activated membrane.
2.5.3. Effective Pore Area
To relate membrane structure to water permeation, two parameters were considered: the Real Pore Area (RPA) and the Effective Pore Area (EPA).
The RPA corresponds to the mean pore area (µm2) directly quantified by microscopy, whereas the EPA represents the functional pore area, i.e., the equivalent pore area expected from the permeation behavior of the membrane containing FCPs.
The EPA was calculated according to Equations (8) and (9) to enable comparison of permeation data using the same blank reference. The relationship is expressed in Equation (10):
where is the mean pore area of the membrane containing the FCP, is the mass of water permeated through this membrane, and is the mass of water permeated through the blank membrane.
Equation (10), therefore, converts the permeation ratio (/) into an area-equivalent value, allowing a direct comparison between the functional permeability of the membrane and its structural pore dimensions.
To assess how closely structural and functional changes match, the discrepancy between EPA and RPA was calculated with Equation (11):
where is the mean real pore area (µm2) obtained by microscopy and is the effective pore area inferred from permeation.
Positive values indicate that the functional pore area is larger than expected from the structural pore size (enhanced permeation), whereas negative values indicate a tighter barrier than predicted by structure alone.
2.5.4. Rheology Tests
Rheology tests were performed on three-layer crosslinked-based membranes using an AR 2000 ex Rheometer and a Rheology Advantage Instrument Control AR (TA Instruments, New Castle, DE, USA), with a 20 mm steel cross-hatched plate at 25 °C, 1 Hz, and 0.01–100% strain. A normal force of ~1.5 N was applied before oscillatory measurements to obtain G′, and was used to assess membrane firmness, also considered a synonym of the stiffness of materials [47,48,49,50], and elasticity [51]. In an oscillatory test, firmness is the relationship between the stress required (Pa) to obtain a specific strain or deformation (%) in the plateau region at a specific frequency and temperature.
Firmness difference vs. blank was calculated with Equation (12) for the different concentrations [X] of FCP studied:
where is the storage modulus (Pa) measured for the membrane containing concentration [X] of the FCP, and is the storage modulus (Pa) of the blank membrane.
Elasticity can be defined in several ways. One definition considers it as the ability to deform reversibly without energy loss, as proposed by Gosline et al. [52]. For the purposes of this work, we will adopt this definition.
Elasticity difference vs. blank was with Equation (13):
where εmax,X is the maximum strain (%) of the membrane at concentration [X] obtained from the plateau region, and εmax,blank is the maximum strain (%) of the blank membrane.
2.5.5. Hydration
Hydration is a complex process involving two mechanisms. The barrier effect refers to the ability of a system to prevent water loss, which in the skin is known as transepidermal water loss (TEWL). Hydration, on the other hand, refers to providing or maintaining an adequate amount of water or moisture within the skin.
This process involves water intake, absorption (swelling [53,54,55], and retention from the bloodstream or the environment [53,56,57,58]). To evaluate hydration, the following tests were performed: swelling and moisture retention assays.
2.5.6. Swelling Tests
Base membranes were dried with granular CaCl2 for 24 h until constant weight. Dried membranes containing different FCP concentrations were weighed and immersed in PBS (0.01 M phosphate, 0.0027 M KCl, 0.137 M NaCl; pH 7.4; 25 °C) under constant agitation for 0–24 h until maximum swelling. Swollen weight (Ws) was recorded after removing surface water with filter paper. Swelling index (SI) was calculated according to Equation (14):
where is dry weight and is the swollen (wet) weight. The difference vs. blank was obtained with Equation (15):
where is the swelling index of the membrane containing concentration [X] of the FCP and is the swelling index of the blank membrane.
2.5.7. Moisture Retention Tests
A DBS moisture analyzer (Kern) was used to assess membrane water retention. The temperature was raised to 100 °C over 5 min. Measurements at 15 and 30 min were then used to distinguish free water (≤15 min; associated with TEWL and barrier function) from retained water (>15 min; indicative of hydration).
The test measured the MR of the whole membrane, as drying caused wrinkling and exposed the bottom layer. For this reason, only 3L FCP membranes were analyzed. MR (%) was normalized to the blank according to Equation (16):
where t = 15 or 30 min and is the mean water loss (%) at time t for the membrane containing FCP concentration X; is the water loss (%) of the blank membrane.
2.6. Data Handling and Variability Reporting
Each experiment was performed with approximately 3–4 independent replicates. Minor variations in the final number of valid replicates resulted from applying a predefined acceptance criterion during data analysis. Because of these small differences, exact replicate counts are not reported for each condition. Instead, results are presented as mean values, and the variability of the primary measurements (mean ± SD) prior to applying the equations for each tested property is provided in the Supplementary Material.
Normalized results (e.g., percentage differences and other derived parameters) propagate the variability of both the blank and the sample, which leads to amplified SD values. For clarity, figures display mean normalized values, while the full variability of the primary measurements (mean ± SD) is reported in Supplementary Tables S2–S7.
3. Results and Discussion
As observed in Table 1, the concentration of Ch could decrease to 2.4% when the concentration of FCP was very high. To assess the impact of slightly lower Ch concentrations, blanks below 2.4% were prepared: 2.1% Ch for the evaluation of G′ and maximum strain in the plateau (%), and 2.3% Ch for the remaining properties—swelling, permeation, and moisture retention tests. No significant differences were observed compared to the results obtained with 2.6% Ch membranes.
Base membranes with FCPs weighed 0.32 ± 0.060 g and were 0.90 ± 0.1 mm thick; activated membranes with FCPs weighed 0.30 ± 0.040 g and were 0.70 ± 0.090 mm thick. Corresponding blank membranes weighed 0.30 ± 0.03 g for both base and activated with thicknesses of 0.80 ± 0.050 mm (base) and 0.70 ± 0.05 mm (activated). All figure results are expressed as % difference vs. blank.
3.1. Pore Area Quantification
A wide range of FCPs is formulated to address the appearance of enlarged facial pores, reflecting their relevance as a visible aesthetic attribute. The apparent pore size may increase through several mechanisms, including age-related reductions in dermal elastic recoil and firmness, as well as surface oil accumulation and/or dehydration, both of which enhance pore contour visibility [59,60,61,62,63].
Figure 3 shows the percentage difference in mean pore area of activated membranes containing each FCP at the tested concentrations and configurations (3L and 1L(t)), relative to the blank (Equation (8)).
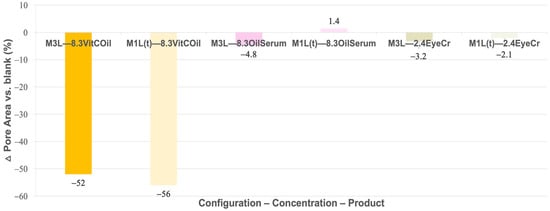
Figure 3.
Mean pore area variation (%) between activated membranes containing the three cosmetic products applied either in the third layer (3L) or in the top layer (1L(t)) vs. blank. Primary measurement variability (mean pore areas ± SD, µm2) is provided in Supplementary Table S2.
A great reduction in pore size was noted for VitCOil, with almost no difference between its inclusion in 3L or the top layer.
Some clinical tests were performed using this VitCOil, as studies carried out by the supplier had assessed that it could reduce pore size. According to data from 10 volunteers who used the FCP for one month, a −30% reduction in sebaceous pore size was observed in 75% of subjects. In our membrane model, this reduction appeared even more pronounced than in the clinical observations. However, almost no evidence of pore-size reduction was observed for the other two products, OilSerum and EyeCr, at the concentrations tested. It should be noted that the correspondence with clinical instrumental outcomes reflects qualitative and magnitude-level agreement only and is not intended to represent statistical clinical equivalence.
As previously reported by Flament et al. [59], facial pore sizes vary depending on ethnicity, with values of 15,000 μm2, between 35,000 and 47,500 μm2, between 40,000 and 55,000 μm2, and up to 92,500 μm2 obtained among Chinese, Japanese, Caucasian, and Brazilian populations, respectively [64]. As such, the pore area measured on the blank membrane, (379 ± 6) × 102 µm2, closer to the values observed among Caucasian and Japanese populations, could be reduced to values similar to those found among Chinese populations after VitCOil introduction, (166 ± 5) × 102 µm2 (Supplementary Table S2). It should also be noted that the mechanically induced pores of the activated chitosan membrane (≈3.79 × 104 µm2) differ substantially from natural skin follicles in both morphology and tortuosity. The pores are generated by microneedle perforation, resulting in straight, predominantly cylindrical microchannels. However, the incorporation of cosmetic formulations slightly alters their geometry, leading to irregular or non-perfectly cylindrical contours due to local polymer relaxation and interfacial effects between the formulation and the chitosan matrix. Therefore, these pores act as structural analogs—providing a controlled, reproducible framework for assessing physicochemical transport—rather than as biological counterparts capable of reproducing follicular architecture or function.
Microscope images in Figure 4 provide visual evidence of variations in pore area between the activated membranes containing the different FCPs and the activated blank.
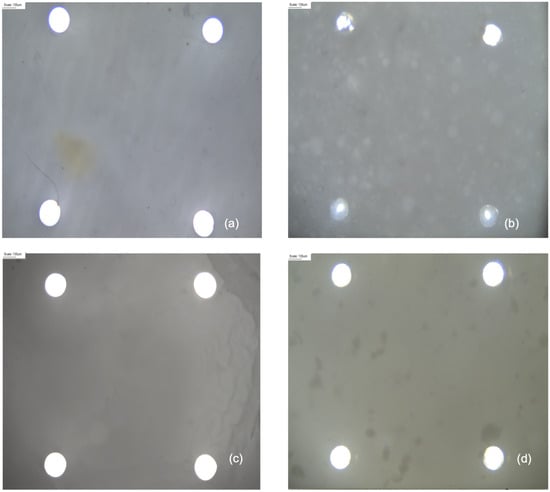
Figure 4.
Optical microscope visualization of pores on activated membranes containing the different cosmetic products and the blank (Scale 135 µm), using a semi-plan 4 × 0.10 oil-immersion objective with a 0.45 wide field: (a) blank; (b) VitCOil at 8.3% in the three layers (3L); (c) OilSerum at 8.3% in 3L; and (d) EyeCr at 2.4% in 3L.
In the microscope images, the pore area reduction is visually evident for the membranes containing VitCOil (Figure 4b), alongside easily observable oil drops.
3.2. Permeation
During permeation tests, blank activated membranes exhibited the highest water flux within the first minute, with 30 g of water fully permeated in an average of 2.9 min. Since most of the water permeated during the first minute, this time point was taken as the reference for comparing the performance of the different membranes. The mean water permeation (%) of the different experiments, conducted at 20 ± 3 °C, was calculated according to Equation (9).
As shown in Figure 5, VitCOil led to pronounced reductions in skin permeation (−61% in the 3L model and −54% in the top layer), whereas OilSerum slightly increased permeation compared to the blank. EyeCr produced moderate decreases (−23% in the 3L model and −16% in the top layer). The enhanced permeation observed with OilSerum may be associated with its claimed “fast absorption” properties.
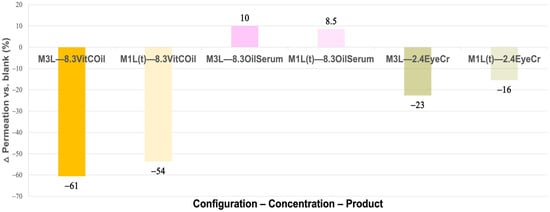
Figure 5.
Mean reduction (%) in water permeation after 1 min for the activated membranes containing the three cosmetic products in three layers (3L) and the top layer (1L(t)) vs. the blank activated membrane. Primary measurement variability (mean water permeation (mean w perm ± SD, g)) is provided in Supplementary Table S3.
3.3. Effective Pore Area
This section explores the relationship between the membranes’ mean pore area and their corresponding water permeation. A conceptual scheme linking real pore area (RPA), effective pore area (EPA) and water flux is shown in Figure 6, and the numerical values are summarized in Table 2.
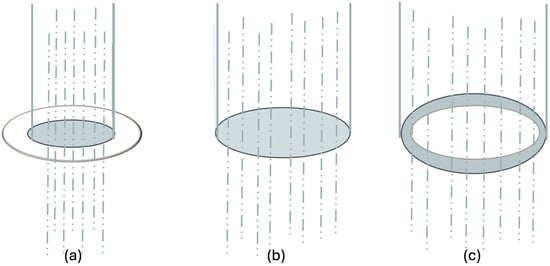
Figure 6.
Conceptual model linking real pore area (RPA), permeation (Gperm) and effective pore area (EPA): (a) reduced functional area (EPA < RPA), (b) alignment, (EPA ≈ RPA) (c) enhanced permeation (EPA > RPA). The transparent circle represents the real pore area, and the blue circle represents the water permeation.
Table 2.
Calculation of the mean effective pore area and the percentage of variation between the effective pore area vs. the total area for the different FCPs.
The schematic representation in Figure 6 illustrates the conceptual relationship between the real pore area (RPA), effective pore area (EPA), and water flux through the membrane. Specifically, panel (a) depicts a reduced functional pore area, where interfacial effects, partial pore obstruction, or variations in local hydrophilicity/hydrophobicity restrict water transport. Panel (b) represents structural and functional alignment, in which RPA and EPA coincide, indicating that permeation is governed primarily by the membrane’s geometric pore characteristics. Finally, panel (c) illustrates an enhanced functional pore area, where facilitated water transport occurs due to increased wettability or the formation of preferential diffusion pathways within the membrane structure. Together, these configurations conceptually describe how physicochemical interactions between the cosmetic formulation and the chitosan matrix can modulate membrane permeability beyond purely structural factors.
Table 2 shows the mean effective pore area calculated from Equation (10) and the percentage difference between the EPA and the real pore area obtained by microscopy (Equation (11)). The sign of the EPA vs. RPA (%) term is indicative of the permeation behavior: negative values reflect reduced permeation relative to the structural pore area, whereas positive values indicate enhanced permeation efficiency.
Membranes containing VitCOil in 3L (−17%) and EyeCr in both 3L (−13%) and 1L (−8%) exhibited decreased EPA vs. RPA, meaning that water permeation was lower than expected from their nominal pore areas. In contrast, OilSerum in 3L (16%) and 1L (7%), together with VitCOil in 1L (6%), showed positive EPA vs. RPA values, indicating more efficient water transport than predicted from pore size alone. OilSerum produced the largest enhancement, particularly in 3L, in line with its marketed “fast absorption” property.
For VitCOil, the reduction in permeation observed in 3L is consistent with partial obstruction of the pores by its oily phase. At high VitCOil levels (e.g., 8.3%), this phase may also disrupt membrane architecture and form tortuous channels. When VitCOil is located in 3L, these channels favor water retention, whereas when it is confined to 1L they are mainly formed at the surface, facilitating higher permeation than the blank. This behavior can be attributed to oil-phase occlusion, which forms localized hydrophobic barriers that reduce water mobility and hinder diffusion through the membrane microchannels.
A similar pattern was observed for EyeCr: permeation decreased in 3L due to oil-phase obstruction, with a milder effect in 1L, where water transport increases after initial channel penetration.
Overall, deviations between EPA and RPA suggest that water permeation is largely governed by structural pore features, whereas marked deviations indicate additional mechanisms such as interfacial effects, local hydrophilicity/hydrophobicity variations, or partial pore coating that alter the effective transport behavior. Thus, EPA provides an integrative descriptor that bridges morphological pore metrics with functional permeability, offering mechanistic insight into how cosmetic actives modulate membrane performance and water transport.
3.4. Rheology Tests
Rheological testing was conducted at 19 ± 0.5 °C to ensure reproducibility [45].
Elastic or Young Modulus (G′) of the blank membrane obtained was of (47 ± 2) × 103 Pa (Supplementary Table S4). Much divergence has been found between different authors when comparing the elastic modulus of different human skin and different techniques, such as tensile tests, indentation tests, and suction or torsion tests [50,65,66]. As is mentioned in previous studies, a wide range of elastic modulus values, from 1000 to 57,000,000 Pa, have been reported. This large margin of the elastic modulus reaffirms the need for a human skin alternative with reproducible results. Moreover, several authors have highlighted that reconstructed human skin models and collagen-based full-thickness equivalents, although biologically relevant, suffer from weak mechanical strength and a limited lifespan, which restricts their use in mechanically demanding or self-standing applications [8,67,68,69]. From a rheological standpoint, membrane “firmness” is directly related to the storage modulus (G′), which quantifies the elastic component of the response under small-amplitude oscillatory shear; higher G′ values correspond to a stiffer and more self-supporting structure [70].
In our previous study, a margin of elastic modulus from 3500 to 55,000 Pa was achieved with our tri-layered membranes, depending on the chitosan used, exhibiting a good reproducibility with each chitosan used [39].
A different behavior was found in our results from the pattern reported by Dunn and Silver [71] and Tonge et al. [72]. In those studies, the elastic modulus increased with strain [65], whereas in our membranes the opposite trend was found: higher modulus values at lower strains, with a progressive decrease as strain increased—consistent with the viscoelastic characteristic of ionically crosslinked chitosan networks.
Several in vivo studies report elastic modulus values within the same order of magnitude as those measured in our system. For example, Bader and Bowker [73] reported different values of the order of 1000 Pa for young and aged forearms, while Zhang et al. [66] reported values from 6630 ± 3.4 Pa for the back site up to 28,410 ± 13.32 Pa for the palm site. Sanders et al. [74] described a margin of 30,000–100,000 Pa for the forearm (<30 years) and 20,000–50,000 Pa for the forearm (>30 years).
The modulus obtained in this study for the 85% DDA chitosan membrane falls within the lower-to-mid range of the values reported by Sanders et al., further indicating that the membrane exhibits a physically relevant mechanical range without implying biomimetic equivalence.
Firmness was evaluated using YM within the linear viscoelastic region [75], defined until a −1% decrease in G′ from the initial value was observed.
No firming effect was observed for VitCOil in 3L (−63%), whereas OilSerum at 0.083% yielded the highest firmness (+32%), matching, at a preliminary level, the brand’s instrumental test result (+29% of firmness instantly achieved). EyeCr at 0.024% also increased firmness (+19%) (Figure 7), showing preliminary concordance with clinical outcomes (3.1–41%). For both OilSerum and EyeCr, lower concentrations produced stronger firming than higher concentrations, suggesting an optimal efficiency within a limited concentration range. When applied only to the top layer, VitCOil’s negative effect decreased (−10%), OilSerum showed reduced firmness at low concentration (−5.3%), and EyeCr maintained similar or improved results compared to 3L (+15%), (Figure 8).
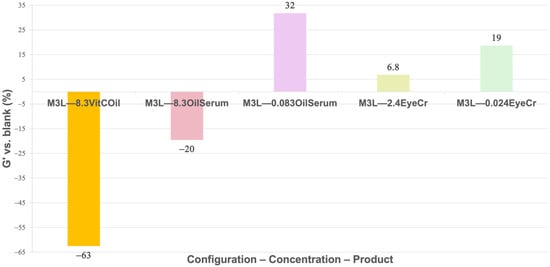
Figure 7.
Mean G′ (%) for membranes containing the cosmetic products in three layers (3L) normalized vs. blank membranes. The different cosmetic products were introduced at 8.3% for liquids and at 2.4% for solids. A 1% reduction in concentration was studied for cosmetic products presenting clinical results: OilSerum and EyeCr. Primary measurement variability (mean G′ ± SD, Pa) is provided in Supplementary Table S4.
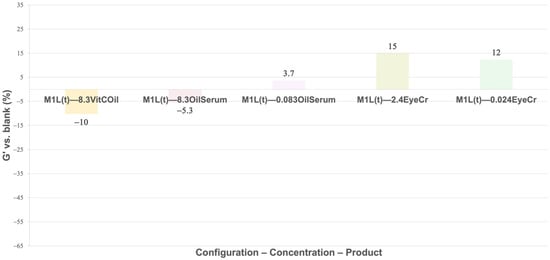
Figure 8.
Mean G′ (%) for membranes containing the cosmetic products in the top layer (1L(t)) normalized vs. blank membranes. The different cosmetic products were introduced at 8.3% for liquids and at 2.4% for solids. A 1% reduction in concentration was studied for cosmetic products presenting clinical results: OilSerum and EyeCr. Primary measurement variability (mean G′ ± SD, Pa) is provided in Supplementary Table S4.
Both OilSerum and EyeCr produced strong firming responses across all tested concentrations, with higher effects observed at the lower levels. This behavior indicates that while the FCP content clearly influences membrane reinforcement, the resulting firming efficiency also depends on how the FCP distributes across the different membrane layers and interacts with each layer’s polymer structure.
In contrast, VitCOil reduced firmness markedly in the multilayer model, though this effect diminished when applied only to the top layer. The consistency between the rheological and reported clinical results supports the potential of OilSerum and EyeCr as firming agents, while the softening effect of VitCOil suggests a different functional role, possibly linked to its high oil content.
The changes in firmness observed for the different FCPs are not expected to arise from biological responses, but rather from molecular-level interactions between the cosmetic formulations, water, and the chitosan-based polymer network. These interactions likely differ between products according to their polarity, oil–water balance, miscibility with the polymer matrix, and their ability to plasticize or rigidify the film.
VitCOil contains a high proportion of non-polar oils and emollients. When incorporated into the membrane, these components could: (i) partially disrupt polymer–polymer hydrogen bonding, reducing the number of effective intermolecular interactions that sustain the elastic network; (ii) act as internal lubricants between chitosan chains, increasing chain mobility and effectively lowering crosslink density; and (iii) accumulate within hydrophobic microdomains, creating local discontinuities that weaken the structural integrity of the matrix. Taken together, these effects are consistent with a plasticizing behavior that manifests as a reduction in G′ (firmness), despite the pronounced occlusive character of VitCOil observed in permeation and swelling assays.
By contrast, OilSerum and EyeCr contain humectants (e.g., glycerin) and partially water-miscible components, which are expected to interact differently with the polymer network. Humectant–polymer hydrogen bonding may increase local cohesion and transiently stiffen the matrix, while water retention induced by hygroscopic agents can promote micro-swelling that tightens the network at low strain, leading to an increase in G′. These hypotheses provide a mechanistic framework linking formulation composition with the divergent firmness profiles observed among the tested FCPs.
Elasticity, measured as maximum strain at 1 Hz in the plateau region, was highest for EyeCr at 0.024% in 3L (27%) and in the top layer (34%), with no effect at 2.4% (Figure 7 and Figure 9). OilSerum showed modest elasticity at 8.3% (2.6%) and reduced effect when diluted (0.92%). VitCOil exhibited no measurable change. Top-layer application generally enhanced elasticity, particularly at lower concentrations for EyeCr (Figure 10).
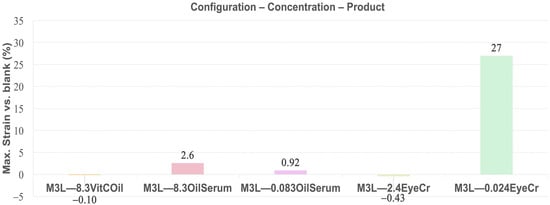
Figure 9.
Mean max. Strain (%) in the plateau for membranes containing the three cosmetic products in the three layers (3L) normalized vs. blank membranes. Primary measurement variability (mean max. Strain ± SD, Pa) is provided in Supplementary Table S5.
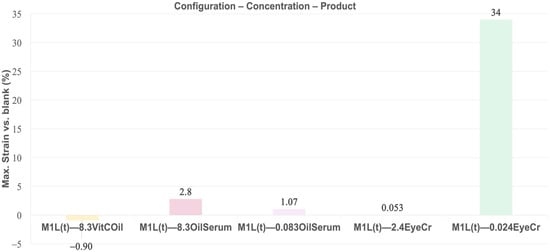
Figure 10.
Mean max. Strain (%) in the plateau for membranes containing the three cosmetic products in top layer (1L(t)) normalized vs. blank membranes. Primary measurement variability (mean max. Strain ± SD, Pa) is provided in Supplementary Table S5.
Elasticity trends closely followed those of firmness. EyeCr at 0.024% produced the highest enhancement in both the three-layer and top-layer models, showing excellent agreement with reported clinical findings. OilSerum elicited only marginal increases, whereas VitCOil showed negligible effects. The pronounced elasticity gain observed for low-dose EyeCr—particularly in the top-layer configuration—suggests the existence of an optimal concentration range for achieving concurrent firming and elastic responses. This outcome reinforces the predictive value of the multilayer in vitro system for assessing cosmetic performance related to viscoelastic improvement.
Table 3 summarizes preliminary outcomes for firmness and elasticity for two of the products, using the lower concentration values, as these are of the same order of magnitude as the in vivo results [76]. Skin firmness and elasticity were measured in volunteers by the use of a Cutometer [77,78,79].
Table 3.
Performance of FCPs in firming and elastic properties at concentrations exhibiting trend-level alignment with clinical results.
It is also worth noting that the most reliable indicator of physicochemical behavior is the instant (time 0) response, where no biological contribution is possible. The brand reports an immediate +29% increase in firmness for OilSerum, a change that can only arise from surface physicochemical mechanisms. The membrane reproduces a comparable effect (+32% vs. blank), reinforcing the interpretation that early in vivo firmness changes may be predominantly governed by superficial physicochemical processes [40]. This instant correspondence provides a strong reference point supporting the relevance of the membrane model for capturing early physicochemical-driven anti-aging responses. It should be noted that the correspondence with clinical instrumental data refers to qualitative and magnitude-level agreement only, and is not intended to represent statistical clinical equivalence.
The mechanical-related behavior observed in the membrane reflects only physicochemical responses within a multilayer polymeric system and is not intended to represent any specific skin layer or biological aging mechanism.
The preliminary trends observed at 0.083% OilSerum in 3L and at 0.024% EyeCr in both 3L and the top layer closely aligned with clinical findings, suggesting that these lower concentrations more accurately simulate real skin performance in terms of firmness and elasticity.
Overall, only EyeCr at 0.024% provided clear, positive outcomes for both firmness and elasticity versus the blank in either 3L or top layer, whereas higher concentrations for OilSerum and EyeCr were generally less effective. Although these effects were not consistently stronger in the top layer, the closer trend-level agreement observed at lower doses (particularly for EyeCr) suggests that this configuration can, in some cases, better approximate topical exposure conditions, making it a relevant complementary in vitro set-up for cosmetic product testing.
The stronger firming and elasticity observed at lower concentrations of OilSerum and EyeCr can be explained by humectant-induced tightening of the chitosan network through hydrogen bonding and moderate water retention, which transiently increases cohesion. At higher concentrations, these same components act as plasticizers, increasing polymer chain mobility and reducing the effective crosslink density and firmness. This dual behavior is consistent with previous reports for humectant–biopolymer systems, where hydrogen bonding and concentration-dependent plasticization govern the viscoelastic response of chitosan-based matrices [80].
3.5. Swelling Tests
The Swelling Index (SI) of tri-layered crosslinked base membranes was calculated (Equation (14)) at 20 ± 3 °C, using the dry membrane as reference. Differences versus the blank (Equation (15)) are shown in Figure 11 and Figure 12.
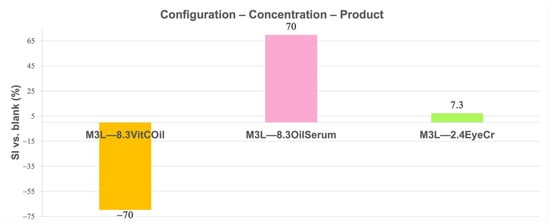
Figure 11.
Mean Swelling Index (SI) (%) for membranes containing the different cosmetic products at different concentrations in three layers (3L) normalized vs. blank membranes. Primary measurement variability (mean dry weight ± SD, g, SI ± SD, %) is provided in Supplementary Table S6.
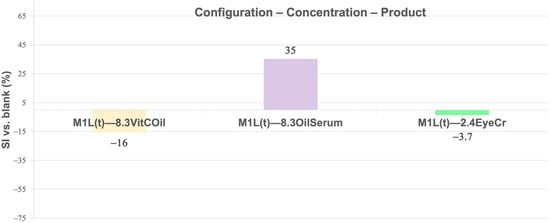
Figure 12.
Mean Swelling Index (SI) (%) for membranes containing the different cosmetic products at different concentrations in the top layer (1L(t)) normalized vs. blank membranes. Primary measurement variability (mean dry weight± SD, g, SI ± SD, %) is provided in Supplementary Table S6.
In 3L (Figure 11), the highest swelling was observed for 8.3% OilSerum (+70%), followed by slight swelling for 2.4% EyeCr (+7.3%), while 8.3% VitCOil reduced swelling markedly (−70%). In the top layer (Figure 12), swelling was greatest for 8.3% OilSerum (+35%) and lowest for 8.3% VitCOil (−16%).
Oil-based products in the membrane generally reduced swelling due to water rejection; however, VitCOil in the top layer slightly increased swelling, compared to its inclusion in 3L, as it allowed water retention in the inner layers. OilSerum consistently produced the highest swelling, particularly in 3L, likely due to its high humectant (e.g., glycerin) and solvent (e.g., butylene glycol, dipropylene glycol) content, which promotes water uptake and rapid PBS absorption.
EyeCr induced slight swelling when included in 3L, potentially due to its high glycerin and propylene glycol content. When confined to the top layer, EyeCr did not significantly affect swelling, likely due to insufficient concentration to drive water uptake.
Swelling behavior was strongly dependent on formulation type and layer distribution. VitCOil markedly reduced swelling, particularly in 3L configuration, consistent with its hydrophobic and occlusive character that limits water uptake. The occlusive oil phase likely decreases water mobility within the polymeric network by forming hydrophobic domains that act as diffusion barriers, thereby further restricting hydration and swelling. In contrast, OilSerum induced pronounced swelling—up to +70% in 3L—due to its humectant and solvent components that enhance hydration and PBS absorption. EyeCr produced moderate swelling only in 3L, aligning with its glycerin-based formulation and suggesting concentration-dependent water retention effects.
Swelling responses thus reflected the balance between hydrophobicity and humectant content among the formulations. These findings highlight how formulation composition and layer localization jointly influence membrane water uptake dynamics, offering a mechanistic basis for predicting swelling behavior or occlusive performance in topical systems.
Recent studies have shown that the swelling behavior of chitosan-based membranes varies widely depending on composition, crosslinking and hydrophilicity. Highly hydrophilic systems incorporating polyols or blended biopolymers typically show large swelling values, as reported by Iqbal et al. [81], who observed swelling ratios of up to ~366% in chitosan–aloe vera membranes. Popov et al. [82] demonstrated that pectin–chitosan hydrogels can increase their swelling by more than two-fold when the pH shifts from 5.0 to 7.4, highlighting the strong sensitivity of chitosan networks to environmental hydration. In contrast, hydrophobically modified or coated chitosan membranes generally display markedly reduced swelling, as shown by Meshram et al. [83], where graphene-coated Ch/PVA membranes exhibited minimal expansion despite high water uptake, and by Abd-elnaeem et al. [84], who reported swelling ratios as low as 13.6% in sulfonated chitosan formulations. Against this background, the behavior of our tri-layered membranes aligns with these trends: OilSerum, rich in humectants and solvents, produced a swelling increase of +70% in 3L and +35% in 1L(t), consistent with the upper range of hydrophilic Ch systems; EyeCr induced moderate swelling (+7.3% in 3L) similar to moderately hydrophilic formulations; and VitCOil, dominated by hydrophobic components, caused strong swelling suppression (−70% in 3L; −16% in 1L(t)), fully consistent with the reduced swelling reported for hydrophobic or crosslinked Ch membranes. These comparisons reinforce that the membrane response is governed by the balance between hydrophilicity and hydrophobicity in each formulation.
3.6. Moisture Retention Tests
The results obtained from the moisture retention (MR) analysis clearly differentiate the hydric behavior of the FCP-based formulations under accelerated dehydration conditions (100 °C, 0–30 min) (Equation (16)). These conditions are designed to accelerate water loss for comparative assessment and are not intended to mimic physiological transepidermal water loss (TEWL), which occurs at ambient temperature. The blank membrane, used as the control, exhibited significant water loss (WL) of 60 ± 4% at 15 min and 80 ± 1% at 30 min, confirming its unprotected and porous nature. When functional complex phases (FCPs) were incorporated, distinct MR profiles were observed, governed by formulation polarity and phase composition (Figure 13).
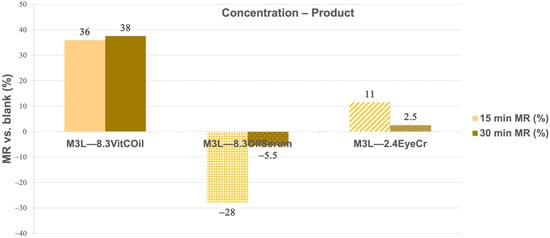
Figure 13.
Mean Moisture Retention (MR) (%) at 15 and 30 min of the three cosmetic products with liquid formulas included at 8.3% and solid formula at 2.4% in the three layers (3L) normalized vs. blank membrane. Primary measurement variability (mean water loss ± SD, %) is provided in Supplementary Table S7.
The 8.3% VitCOil formulation exhibited the highest moisture retention (MR) capacity, maintaining 36% and 38% higher water content than the blank at 15 and 30 min, respectively. This sustained barrier effect is attributed to the oil-rich matrix, which forms an occlusive film that reduces vapor permeability and mimics the inhibition of transepidermal water loss (TEWL). Comparable behavior was reported in our previous work [45], where elastin-loaded tri-layered chitosan membranes reduced water loss through hydrophobic chain interactions that could constrain water evaporation. Both systems share a common mechanism of occlusion and hydrophobic network stabilization, supporting the notion that MR efficiency increases when such mechanisms are present.
EyeCr at 2.4% provided a modest barrier effect at 15 min (11%) and minimal MR at 30 min (2.5%).
In contrast, the 8.3% OilSerum formulation displayed negative MR values (−28% at 15 min and −5.5% at 30 min), suggesting that its hydrophilic–humectant composition enhanced water mobility rather than limiting evaporation. This observation aligns with the performance of hydrolyzed collagen (HC) in the same tri-layered chitosan system, where water evaporation was slightly promoted at some concentrations of 2.6% and 4% HC. These formulations promote superficial hydration by increasing swelling and surface water availability, without forming a continuous hydrophobic barrier.
A broader comparison with Galán-Navea et al. [20] further contextualizes these findings. The tri-layered collagen membranes crosslinked with glutaraldehyde exhibited enhanced MR and reduced evaporative losses due to increased network density and chemical stabilization. This behavior closely parallels the occlusive effect observed for VitCOil, where the lipid phase effectively reproduces the barrier performance of covalently crosslinked collagen networks.
Overall, the collective evidence indicates that MR performance is primarily governed by the hydrophobic–hydrophilic balance and the degree of network organization—whether established through crosslinking chemistry (as in collagen and chitosan membranes) or via phase separation (as in oil-based formulations). The results reaffirm that oil-rich systems such as VitCOil operate through an occlusive mechanism analogous to elastin- or collagen-reinforced biopolymeric membranes, providing effective water-loss protection under dehydrating conditions. Conversely, humectant-rich systems (OilSerum, EyeCr) facilitate transient hydration without establishing a sustained barrier. These findings highlight the critical role of formulation polarity, structural cohesion, and layer organization as key determinants of in vitro hydration dynamics and cosmetic efficacy.
Furthermore, it should be acknowledged that the magnitude of the membrane responses may exceed or differ from those observed in clinical studies. This behavior arises from the simplified physicochemical nature of the model, which lacks the structural complexity and compositional barriers of human skin. The tri-layered chitosan scaffold does not contain lipids, keratinized layers, or sebaceous components that in vivo contribute to surface occlusion, tortuous diffusion pathways, and viscoelastic damping. Consequently, water mobility and mass transfer are inherently higher, and the polymeric network responds more directly to mechanical or compositional perturbations. These characteristics can amplify the apparent magnitude of biophysical changes while preserving the directionality of formulation-dependent trends observed clinically.
4. Conclusions
Tri-layered membranes incorporating three finished cosmetic products—VitCOil (oil-based), OilSerum (hydrophilic serum), and EyeCr (oil-in-water emulsion)—were evaluated to simulate in vitro skin-related functions relevant to anti-aging performance, including pore variation, water permeation, firmness, elasticity, swelling, and moisture retention.
Membrane behavior depended strongly on the formulation type, concentration, and layer distribution. VitCOil exhibited the most effective occlusive and moisture-retention properties, significantly reducing water loss and pore area. OilSerum promoted hydration and firmness through humectant-driven water flux, while EyeCr showed balanced effects, enhancing elasticity and firmness at low concentrations.
Across parameters, formulation polarity and oil–water balance were identified as primary factors determining hydration, firmness, and barrier performance. The results confirm that occlusive oil-rich systems provide durable protection against water loss, whereas humectant-rich formulations offer transient hydration without long-term retention.
Overall, the multilayer membrane model proved useful for predicting physicochemical-driven trends in topical behavior, aligning with in vivo instrumental data and providing mechanistic insight into the formulation–performance relationship.
Because the membrane is a physicochemical scaffold without biological activity, findings should be interpreted as biophysical indicators of topical efficacy rather than biological responses.
Global Anti-Aging Performance
EyeCr at 2.4% in three layers achieved the most positive overall outcomes compared to the other FCPs, whereas EyeCr at 0.024%, tested only for firmness and elasticity, excelled in these aspects, particularly in the top layer application. These results emphasize the importance of optimizing both concentration and layer placement to approximate the directional trends observed in instrumental clinical measurements and support anti-aging claims (Supplementary Table S8).
The main limitations of this study include the intrinsic temperature sensitivity of the membranes during rheological testing, which requires a strictly controlled range (±1 °C) to ensure reproducibility; the absence of lipid layers and cellular structure, meaning that the model cannot reproduce biological mechanisms such as collagen synthesis, barrier lipid organization, or cell–matrix interactions; and the fact that the correspondence between instrumental membrane responses and clinical outcomes is qualitative rather than quantitative, reflecting only directional agreement in physicochemical trends. Consequently, the model should be interpreted as a predictive physicochemical platform for early-stage formulation screening, not as a biological or quantitative clinical surrogate.
Future work will focus on improving the biomimetic fidelity of the model by (i) optimizing cosmetic product concentrations and their distribution across layers to better correlate with in vivo outcomes; (ii) enhancing the blank membrane through incorporation of biopolymers (e.g., collagen, elastin, hyaluronic acid, ceramides, fatty acids); (iii) applying ionic–covalent crosslinking strategies and 3D bioprinting to increase structural precision; and (iv) integrating skin cells or biochemical markers to extend its applicability toward biological efficacy assessment.
To support future industrial or regulatory adoption, targeted validation studies will also be required. Key steps include: (i) standardizing membrane preparation and test conditions; (ii) demonstrating intra- and inter-laboratory reproducibility; (iii) benchmarking performance against established in vitro skin models; and (iv) conducting correlation studies using formulations with known instrumental or clinical profiles to confirm predictive capacity. These efforts will help define the model’s applicability domain and strengthen its suitability as a potential non-animal test method.
Supplementary Materials
The following supporting information can be downloaded at: https://www.mdpi.com/article/10.3390/cosmetics12060277/s1. Table S1. Full Ingredient List of the Three Tested Cosmetic Products; Table S2. Best global anti-aging properties obtained for the membrane containing the EyeCr in both 3L and 1L(t); Table S3. Mean water permeation (w perm, g) and SD after 1 min through the activated different tri-layered crosslinked membranes: the blank membrane and the membranes containing the different FCPs and the difference in w perm (%) vs. the blank; Table S4. Mean G′ of membranes containing the different FCPs in 3L and 1L(t) with SD and variation in G′ vs. the blank at 19 ± 1 °C; Table S5. Mean max. strain in the plateau (with SD) and difference in max. strain between membranes containing the different FCPs in percentage vs. the blank in 3L and 1L(t) at 19 ± 1 °C; Table S6. Mean dry weight, SI (%), and SI vs. the blank (%) for the different FCPs in 3L and 1L(t); Table S7. Mean water loss % of membranes containing three different FCPs with SD in 3L and their MR % vs. the blank at 15 and 30 min; Table S8. Best global anti-aging properties obtained for the membrane containing the EyeCr in both 3L and 1L(t); Figure S1. Different types of membranes created; Figure S2. Visual appearance of the three cosmetic products (from left to right): Anti-aging Vitamin C Oil face oil; Anti-aging face Oil Serum; Anti-aging Eye Contour Cream; Figures S3–S5. Schemes of solutions preparation and addition of liquid and semisolid cosmetic products; Supplementary Materials and Methods (S2). Stock solution preparation, incorporation of semisolid FCPs, membrane formation, and curing processes.
Author Contributions
Conceptualization, R.G.-C. and A.B.-C.; methodology, R.G.-C. and A.B.-C.; validation, R.G.-C. and A.B.-C.; investigation, R.G.-C. and A.B.-C.; writing—original draft preparation, R.G.-C.; writing—review and editing, R.G.-C. and A.B.-C.; supervision, A.B.-C. All authors have read and agreed to the published version of the manuscript.
Funding
This research received no external funding.
Institutional Review Board Statement
Not applicable.
Data Availability Statement
No new data were created or analyzed in this study. Data supporting the findings of this work are contained within the article and its Supplementary Materials.
Conflicts of Interest
Rocío Guerle-Cavero is an employee of Rofersam S.A. The authors declare no other conflicts of interest.
Abbreviations
The following abbreviations are used in this manuscript:
| NAMs | New Approach Methodologies |
| Ch | Chitosan |
| GAGs | Glycosaminoglycans |
| DDA | Degree of deacetylation |
| FCPs | Finished cosmetic products |
| VitCOil | Anti-aging vitamin C face oil |
| OilSerum | Anti-aging face oil serum |
| EyeCr | Anti-aging eye contour cream |
| OECD | Organization for Economic Co-operation and Development |
| AcOH | Acetic Acid |
| NaOH | Sodium Hydroxide |
| TPP | Sodium tripolyphosphate |
| EEOO | Electroendosmosis |
| PBS | Phosphate-buffered saline tablets |
| O/W | Oil-in-water |
| SD | Standard deviation |
| G’ | Storage modulus |
| WHO | World Health Organization |
| EPA | Effective pore area |
| RPA | Real pore area |
| TEWL | Transepidermal water loss |
| SI | Swelling Index |
| MR | Moisture Retention |
References
- Gupta, M.A.; Gilchrest, B.A. Psychosocial Aspects of Aging Skin. Dermatol. Clin. 2005, 23, 643–648. [Google Scholar] [CrossRef]
- Mohiuddin, A.K. Skin Aging & Modern Age Anti-Aging Strategies. Int. J. Clin. Dermatol. Res. 2019, 7, 209–240. [Google Scholar] [CrossRef]
- Humphrey, S.; Manson Brown, S.J.; Cross, S.; Mehta, R. Defining Skin Quality: Clinical Relevance, Terminology, and Assessment. Dermatol. Surg. 2021, 47, 982–983. [Google Scholar] [CrossRef]
- Yang, L.J.; Knoll, J.; Kundu, R.V. Consumer Attitudes toward Aging Skin during the COVID-19 Pandemic. Int. J. Women’s Dermatol. 2023, 9, e095. [Google Scholar] [CrossRef]
- Statista Most Common Skin Concerns Among Us Skincare Shoppers by Generation. Available online: https://www.statista.com/statistics/1334325/most-common-skin-concerns-among-us-skin-care-shoppers-by-generation/ (accessed on 1 November 2025).
- European Commission. Ban on Animal Testing. Available online: https://single-market-economy.ec.europa.eu/sectors/cosmetics/ban-animal-testing_en (accessed on 1 November 2025).
- Silva, R.J.; Tamburic, S. A State-of-the-Art Review on the Alternatives to Animal Testing for the Safety Assessment of Cosmetics. Cosmetics 2022, 9, 90. [Google Scholar] [CrossRef]
- Suhail, S.; Sardashti, N.; Jaiswal, D.; Rudraiah, S.; Misra, M.; Kumbar, S.G. Engineered Skin Tissue Equivalents for Product Evaluation and Therapeutic Applications. Biotechnol. J. 2019, 14, 1900022. [Google Scholar] [CrossRef] [PubMed]
- Risueño, I.; Valencia, L.; Jorcano, J.L.; Velasco, D. Skin-on-a-Chip Models: General Overview and Future Perspectives. APL Bioeng. 2021, 5, 030901. [Google Scholar] [CrossRef]
- Shahabeddin, L.; Berthod, F.; Odile Damour, C.C. Characterization of Skin Reconstructed on a Chitosan-Cross-Linked Collagen-Glycosaminoglycan Matrix. Skin. Pharmacol. 1997, 3, 107–114. [Google Scholar] [CrossRef] [PubMed]
- Indrani, D.J.; Lukitowati, F.; Yulizar, Y. Preparation of Chitosan/Collagen Blend Membranes for Wound Dressing: A Study on FTIR Spectroscopy and Mechanical Properties. IOP Conf. Ser. Mater. Sci. Eng. 2017, 202, 012020. [Google Scholar] [CrossRef]
- Ramasamy, P.; Shanmugam, A. Characterization and Wound Healing Property of Collagen-Chitosan Film from Sepia Kobiensis (Hoyle, 1885). Int. J. Biol. Macromol. 2015, 74, 93–102. [Google Scholar] [CrossRef]
- Liu, H.; Yin, Y.; Yao, K. Construction of Chitosan-Gelatin-Hyaluronic Acid Artificial Skin in Vitro. J. Biomater. Appl. 2007, 21, 413–430. [Google Scholar] [CrossRef] [PubMed]
- Nevena, K.; Lazic, V.; Petrovic, L.; Gvozdenovic, J.; Pejic, D. Properties of Chitosan-Laminated Collagen Film. Food Technol. Biotechnol. 2012, 50, 483–489. [Google Scholar]
- Mao, J.; Zhao, L.; De Yao, K.; Shang, Q.; Yang, G.; Cao, Y. Study of Novel Chitosan-Gelatin Artificial Skin in Vitro. J. Biomed. Mater. Res. A 2003, 64, 301–308. [Google Scholar] [CrossRef]
- Campos, M.G.N.; Mei, L.H.I.; Santos, A.R. Sorbitol-Plasticized and Neutralized Chitosan Membranes as Skin Substitutes. Mater. Res. 2015, 18, 781–790. [Google Scholar] [CrossRef]
- Hu, Z.; Hong, P.; Liao, M.; Kong, S.; Huang, N.; Ou, C.; Li, S. Preparation and Characterization of Chitosan-Agarose Composite Films. Materials 2016, 9, 816. [Google Scholar] [CrossRef]
- Ismarul, I.N.; Ishak, Y.; Ismail, Z.; Shalihuddin, W.M.M. Characterization of Collagen/Chitosan Films for Skin Regenerating Scaffold. Med. J. Malays. 2004, 59, 57–58. [Google Scholar] [PubMed]
- Lu, T.; Li, Y.; Chen, T. Techniques for Fabrication and Construction of Three-Dimensional Scaffolds for Tissue Engineering. Int. J. Nanomed. 2013, 8, 337–350. [Google Scholar] [CrossRef] [PubMed]
- Galán-Navea, L.; Guerle-Cavero, R.; Balfagón-Costa, A.; Artalejo-Ortega, B. Creation of Chemically Tri-Layered Collagen Crosslinked Membranes and Their Comparison with Ionically Tri-Layered Chitosan Crosslinked Membranes to Study Human Skin Properties. Int. J. Mol. Sci. 2023, 24, 13443. [Google Scholar] [CrossRef]
- Parenteau-Bareil, R.; Gauvin, R.; Berthod, F. Collagen-Based Biomaterials for Tissue Engineering Applications. Materials 2010, 3, 1863–1887. [Google Scholar] [CrossRef]
- Smirnova, N.V.; Kolbe, K.A.; Dresvyanina, E.N.; Grebennikov, S.F.; Dobrovolskaya, I.P.; Yudin, V.E.; Luxbacher, T.; Morgantie, P. Effect of Chitin Nanofibrils on Biocompatibility and Bioactivity of the Chitosan-Based Composite. Materials 2019, 12, 1874. [Google Scholar] [CrossRef] [PubMed]
- Bian, S.; Hu, X.; Zhu, H.; Du, W.; Wang, C.; Wang, L.; Hao, L.; Xiang, Y.; Meng, F.; Hu, C.; et al. 3D Bioprinting of Artificial Skin Substitute with Improved Mechanical Property and Regulated Cell Behavior through Integrating Patterned Nanofibrous Films. ACS Nano 2024, 18, 18503–18521. [Google Scholar] [CrossRef] [PubMed]
- Liu, J.; Zhou, Z.; Zhang, M.; Song, F.; Feng, C.; Liu, H. Simple and Robust 3D Bioprinting of Full-Thickness Human Skin Tissue. Bioengineered 2022, 13, 10087–10097. [Google Scholar] [CrossRef] [PubMed]
- Phang, S.J.; Basak, S.; The, H.X.; Packirisamy, G.; Fauzi, M.B.; Kuppusamy, U.R.; Neo, Y.P.; Looi, M.L. Advancements in Extracellular Matrix-Based Biomaterials and Biofabrication of 3D Organotypic Skin Models. ACS Biomater. 2022, 8, 3220–3241. [Google Scholar]
- Perez-Valle, A.; del Amo, C.; Andia, I. Overview of Current Advances in Extrusion Bioprinting for Skin Applications. Int. J. Mol. Sci. 2020, 21, 6679. [Google Scholar] [CrossRef]
- Struszczyk, M.H. Chitin and Chitosan. Part I. Properties and Production. Polimery 2002, 5, 316–325. [Google Scholar] [CrossRef]
- Croisier, F.; Jérôme, C. Chitosan-Based Biomaterials for Tissue Engineering. Eur. Polym. J. 2013, 49, 780–792. [Google Scholar] [CrossRef]
- Domalik-Pyzik, P.; Chłopek, J.; Pielichowska, K. Chitosan-Based Hydrogels: Preparation, Properties, and Applications BT–Cellulose-Based Superabsorbent Hydrogels; Mondal, Md.I.H., Ed.; Springer International Publishing: Cham, Switzerland, 2019; pp. 1665–1693. ISBN 978-3-319-77830-3. [Google Scholar]
- Sheikholeslam, M.; Wright, M.E.E.; Jeschke, M.G.; Amini-Nik, S. Biomaterials for Skin Substitutes. Adv. Healthc. Mater. 2018, 7, 1700897. [Google Scholar] [CrossRef]
- Ahmed, S.; Ahmad, M. Chitosan Based Dressings for Wound Care. Immunochem. Immunopathol. 2015, 1, 1–6. [Google Scholar] [CrossRef]
- Ahmadi, F.; Oveisi, Z.; Samani, M.; Amoozgar, Z. Chitosan Based Hydrogels: Characteristics and Pharmaceutical Applications. Res. Pharm. Sci. 2015, 10, 1–16. [Google Scholar]
- Chaudhari, A.A.; Vig, K.; Baganizi, D.R.; Sahu, R.; Dixit, S.; Dennis, V.; Singh, S.R.; Pillai, S.R. Future Prospects for Scaffolding Methods and Biomaterials in Skin Tissue Engineering: A Review. Int. J. Mol. Sci. 2016, 17, 1974. [Google Scholar] [CrossRef]
- Ma, L.; Gao, C.; Mao, Z.; Zhou, J.; Shen, J.; Hu, X.; Han, C. Collagen/Chitosan Porous Scaffolds with Improved Biostability for Skin Tissue Engineering. Biomaterials 2003, 24, 4833–4841. [Google Scholar] [CrossRef]
- Dash, M.; Chiellini, F.; Ottenbrite, R.M.; Chiellini, E. Chitosan—A Versatile Semi-Synthetic Polymer in Biomedical Applications. Prog. Polym. Sci. 2011, 36, 981–1014. [Google Scholar] [CrossRef]
- Sousa, M.P.; Cleymand, F.; Mano, J.F. Elastic Chitosan/Chondroitin Sulfate Multilayer Membranes. Biomed. Mater. 2016, 11, 035008. [Google Scholar] [CrossRef] [PubMed]
- Ma, J.; Wang, H.; He, B.; Chen, J. A Preliminary in Vitro Study on the Fabrication and Tissue Engineering Applications of a Novel Chitosan Bilayer Material as a Scaffold of Human Neofetal Dermal Fibroblasts. Biomaterials 2001, 22, 331–336. [Google Scholar] [CrossRef] [PubMed]
- Huq, T.; Khan, A.; Brown, D.; Dhayagude, N.; He, Z.; Ni, Y. Sources, Production and Commercial Applications of Fungal Chitosan: A Review. J. Bioresour. Bioprod. 2022, 7, 85–98. [Google Scholar] [CrossRef]
- Guerle-Cavero, R.; Lleal-Fontàs, B.; Balfagón-Costa, A. Creation of Ionically Crosslinked Tri-Layered Chitosan Membranes to Simulate Different Human Skin Properties. Materials 2021, 14, 1807. [Google Scholar] [CrossRef]
- Pensalfini, M.; Rotach, M.; Hopf, R.; Bielicki, A.; Santoprete, R.; Mazza, E. How Cosmetic Tightening Products Modulate the Biomechanics and Morphology of Human Skin. Acta Biomater. 2020, 115, 299–316. [Google Scholar] [CrossRef] [PubMed]
- European Commission. Glossary and Acronyms Related to Cosmetics Legislation. Available online: https://ec.europa.eu/docsroom/documents/13021/attachments/1/translations/en/renditions/pdf (accessed on 1 November 2025).
- OECD. Skin Absorption: In Vivo Method. In OECD 427 Guideline for the Testing of Chemicals; OECD: Paris, France, 2004. [Google Scholar]
- OECD. Skin Absorption: In Vitro Method. In OECD 428 Guideline for the Testing of Chemicals; OECD: Paris, France, 2004. [Google Scholar]
- Hewitt, N.J.; Grégoire, S.; Cubberley, R.; Duplan, H.; Eilstein, J.; Ellison, C.; Lester, C.; Fabian, E.; Fernandez, J.; Géniès, C.; et al. Measurement of the Penetration of 56 Cosmetic Relevant Chemicals into and through Human Skin Using a Standardized Protocol. J. Appl. Toxicol. 2020, 40, 403–415. [Google Scholar] [CrossRef]
- Guerle-Cavero, R.; Balfagón-Costa, A. Study of Elastin, Hydrolyzed Collagen and Collagen-like Products in a Tri-Layered Chitosan Membrane to Test Anti-Aging Skin Properties. Int. J. Mol. Sci. 2023, 24, 11016. [Google Scholar] [CrossRef]
- Scientific Committee on Consumer Safety. Basic Criteria for the In Vitro Assessment of Dermal Absorption of Cosmetic Ingredients; Scientific Committee on Consumer Safety: Luxembourg, 2010; Volume SCCS/1358. [Google Scholar]
- Ivanova, Z.; Aleksiev, T.; Dobrev, H.; Atanasov, N. Use of a Novel Indentometer to Evaluate Skin Stiffness in Healthy and Diseased Human Skin. Skin. Res. Technol. 2023, 29, e13384. [Google Scholar] [CrossRef]
- Koch, V.; Wilke, J. Reliability of a New Indentometer Device for Measuring Myofascial Tissue Stiffness. J. Clin. Med. 2022, 11, 5194. [Google Scholar] [CrossRef] [PubMed]
- Microcaya IDM. El Indentometer IDM 800 IDM 2–Información General Sobre La Medición; Microcaya IDM: Bilbao, Spain, 2019; pp. 1–7. [Google Scholar]
- Kalra, A.; Lowe, A. An Overview of Factors Affecting the Skins Youngs Modulus. J. Aging Sci. 2016, 4, 1000156. [Google Scholar] [CrossRef]
- Hussain, S.H.; Limthongkul, B.; Humphreys, T.R. The Biomechanical Properties of the Skin. Dermatol. Surg. 2013, 39, 193–203. [Google Scholar] [CrossRef] [PubMed]
- Gosline, J.; Lillie, M.; Carrington, E.; Guerette, P.; Ortlepp, C.; Savage, K. Elastic Proteins: Biological Roles and Mechanical Properties. Philos. Trans. R. Soc. B Biol. Sci. 2002, 357, 121–132. [Google Scholar] [CrossRef]
- Bouwstra, J.A.; De Graaff, A.; Gooris, G.S.; Nijsse, J.; Wiechers, J.W.; Van Aelst, A.C. Water Distribution and Related Morphology in Human Stratum Corneum at Different Hydration Levels. J. Investig. Dermatol. 2003, 120, 750–758. [Google Scholar] [CrossRef]
- Norlén, L.; Emilson, A.; Forslind, B. Stratum Corneum Swelling. Biophysical and Computer Assisted Quantitative Assessments. Arch. Dermatol. Res. 1997, 289, 506–513. [Google Scholar] [CrossRef]
- Firooz, A.; Sadr, B.; Babakoohi, S.; Sarraf-Yazdy, M.; Fanian, F.; Kazerouni-Timsar, A.; Nassiri-Kashani, M.; Naghizadeh, M.M.; Dowlati, Y. Variation of Biophysical Parameters of the Skin with Age, Gender, and Body Region. Sci. World J. 2011, 2012, 386936. [Google Scholar] [CrossRef]
- Verdier-Sévrain, S.; Bonté, F. Skin Hydration: A Review on Its Molecular Mechanisms. J. Cosmet. Dermatol. 2007, 6, 75–82. [Google Scholar] [CrossRef]
- Draelos, Z.D. The Science behind Skin Care: Moisturizers. J. Cosmet. Dermatol. 2018, 17, 138–144. [Google Scholar] [CrossRef]
- Balfagón-Costa, A.; Guerle-Cavero, R.; Monteagudo-Quintás, A.; Marimón-Margarit, N. Cuantificación de La Capacidad Hidratante de Las Cremas. Clasificación de Las Cremas Hidratantes. Not. Cosmética Perfum. 2012, 326, 5–13. [Google Scholar]
- Flament, F.; Francois, G.; Qiu, H.; Ye, C.; Hanaya, T.; Batisse, D.; Cointereau-Chardon, S.; Seixas, M.D.G.; Dal Belo, S.E.; Bazin, R. Facial Skin Pores: A Multiethnic Study. Clin. Cosmet. Investig. Dermatol. 2015, 8, 85–93. [Google Scholar] [CrossRef]
- Miyamoto, K.; Dissanayake, B.; Omotezako, T.; Takemura, M.; Tsuji, G.; Furue, M. Daily Fluctuation of Facial Pore Area, Roughness and Redness among Young Japanese Women; Beneficial Effects of Galactomyces Ferment Filtrate Containing Antioxidative Skin Care Formula. J. Clin. Med. 2021, 10, 2502. [Google Scholar] [CrossRef]
- Dong, J.; Lanoue, J.; Goldenberg, G. Enlarged Facial Pores: An Update on Treatments. Cutis 2016, 98, 33–36. [Google Scholar]
- Hameed, A.; Akhtar, N.; Khan, H.M.S.; Asrar, M. Skin Sebum and Skin Elasticity: Major Influencing Factors for Facial Pores. J. Cosmet. Dermatol. 2019, 18, 1968–1974. [Google Scholar] [CrossRef]
- Lee, S.J.; Seok, J.; Jeong, S.Y.; Park, K.Y.; Li, K.; Seo, S.J. Facial Pores: Definition, Causes, and Treatment Options. Dermatol. Surg. 2016, 42, 277–285. [Google Scholar] [CrossRef]
- Sugiyama-Nakagiri, Y.; Sugata, K.; Hachiya, A.; Osanai, O.; Ohuchi, A.; Kitahara, T. Ethnic Differences in the Structural Properties of Facial Skin. J. Dermatol. Sci. 2009, 53, 135–139. [Google Scholar] [CrossRef] [PubMed]
- Joodaki, H.; Panzer, M.B. Skin Mechanical Properties and Modeling: A Review. Proc. Inst. Mech. Eng. Part H 2018, 232, 323–343. [Google Scholar] [CrossRef] [PubMed]
- Zhang, X.; Kinnick, R.R.; Pittelkow, M.R.; Greenleaf, J.F. Skin Viscoelasticity with Surface Wave Method. In Proceedings of the IEEE Ultrasonics Symposium, Beijing, China, 2–5 November 2008; IEEE: Piscataway, NJ, USA, 2008; pp. 651–653. [Google Scholar]
- Moon, S.; Kim, D.H.; Shin, J.U. In Vitro Models Mimicking Immune Response in the Skin. Yonsei Med. J. 2021, 62, 969–980. [Google Scholar] [CrossRef] [PubMed]
- Elango, J.; Zamora-Ledezma, C.; Maté-Sánchez de Val, J.E. Natural vs. Synthetic Polymers: How Do They Communicate with Cells for Skin Regeneration—A Review. J. Compos. Sci. 2023, 7, 385. [Google Scholar] [CrossRef]
- Hofmann, E.; Schwarz, A.; Fink, J.; Kamolz, L.P.; Kotzbeck, P. Modelling the Complexity of Human Skin In Vitro. Biomedicines 2023, 11, 794. [Google Scholar] [CrossRef]
- Parvini, C.H.; Cartagena-Rivera, A.X.; Solares, S.D. Viscoelastic Parameterization of Human Skin Cells Characterize Material Behavior at Multiple Timescales. Commun. Biol. 2022, 5, 17. [Google Scholar] [CrossRef]
- Dunn, M.G.; Silver, F.H. Viscoelastic Behavior of Human Connective Tissues: Relative Contribution of Viscous and Elastic Components. Connect. Tissue Res. 1983, 12, 59–70. [Google Scholar] [CrossRef]
- Tonge, T.K.; Atlan, L.S.; Voo, L.M.; Nguyen, T.D. Full-Field Bulge Test for Planar Anisotropic Tissues: Part I-Experimental Methods Applied to Human Skin Tissue. Acta Biomater. 2013, 9, 5913–5925. [Google Scholar] [CrossRef] [PubMed]
- Bader, D.L.; Bowker, P. Mechanical Characteristics of Skin and Underlying Tissues in Vivo. Biomaterials 1983, 4, 305–308. [Google Scholar] [CrossRef] [PubMed]
- Sanders, R. Torsional Elasticity of Human Skin in Vivo. Pflugers Arch. 1973, 342, 255–260. [Google Scholar] [CrossRef] [PubMed]
- Biesiekierski, A.; Munir, K.; Li, Y.; Wen, C. Material Selection for Medical Devices; Elsevier: Amsterdam, The Netherlands, 2021; ISBN 9780081029657. [Google Scholar]
- Janine, S.; Everett, M.S.S. Skin Viscoelasticity: Physiologic Mechanisms, Measurement Issues, and Application to Nursing Science. Biol. Res. Nurs. 2013, 4, 338–346. [Google Scholar] [CrossRef]
- Monteiro Rodrigues, L.; Fluhr, J.W. EEMCO Guidance for the in Vivo Assessment of Biomechanical Properties of the Human Skin and Its Annexes: Revisiting Instrumentation and Test Modes. Skin Pharmacol. Physiol. 2020, 33, 44–60. [Google Scholar] [CrossRef]
- Microcaya IDM. Manual de Usuario Para La Sonda Cutometer® MPA 580; Microcaya IDM: Bilbao, Spain, 2020; pp. 1–56. [Google Scholar]
- Ryu, H.S.; Joo, Y.H.; Kim, S.O.; Park, K.C.; Youn, S.W. Influence of Age and Regional Differences on Skin Elasticity as Measured by the Cutometer®. Skin Res. Technol. 2008, 14, 354–358. [Google Scholar] [CrossRef]
- Vieira, M.G.A.; Da Silva, M.A.; Dos Santos, L.O.; Beppu, M.M. Natural-Based Plasticizers and Biopolymer Films: A Review. Eur. Polym. J. 2011, 47, 254–263. [Google Scholar] [CrossRef]
- Iqbal, D.N.; Munir, A.; Abbas, M.; Nazir, A.; Ali, Z.; Alshawwa, S.Z.; Iqbal, M.; Ahmad, N. Polymeric Membranes of Chitosan/Aloe Vera Gel Fabrication With Enhanced Swelling and Antimicrobial Properties for Biomedical Applications. Dose-Response 2023, 21, 15593258231169387. [Google Scholar] [CrossRef]
- Popov, S.; Paderin, N.; Chistiakova, E.; Sokolova, A.; Konyshev, I.V.; Belozerov, V.S.; Byvalov, A.A. Swelling, Protein Adsorption, and Biocompatibility of Pectin–Chitosan Hydrogels. Gels 2024, 10, 472. [Google Scholar] [CrossRef] [PubMed]
- Meshram, S.M.M.; Gonugunta, P.; Taheri, P.; Jourdin, L.; Pande, S. Preparation of Biodegradable Membrane Utilizing Chitosan and Polyvinyl Alcohol, and Assessment of Its Performance after Coating with Graphene Conductive Ink. Front. Membr. Sci. Technol. 2025, 4, 1552368. [Google Scholar] [CrossRef]
- Abd-elnaeem, S.G.; Hafez, A.I.; El-khatib, K.M.; Abdallah, H.; Fouad, M.K.; Abadir, E.F. Innovative Sulfonated Chitosan Membranes: Bridging the Gap in Fuel Cell Technology. Mater. Renew. Sustain. Energy 2025, 14, 52. [Google Scholar] [CrossRef]
Disclaimer/Publisher’s Note: The statements, opinions and data contained in all publications are solely those of the individual author(s) and contributor(s) and not of MDPI and/or the editor(s). MDPI and/or the editor(s) disclaim responsibility for any injury to people or property resulting from any ideas, methods, instructions or products referred to in the content. |
© 2025 by the authors. Licensee MDPI, Basel, Switzerland. This article is an open access article distributed under the terms and conditions of the Creative Commons Attribution (CC BY) license (https://creativecommons.org/licenses/by/4.0/).