Abstract
Background: Melasma is a chronic hyperpigmentation disorder, often therapy-resistant. Minimally invasive combinations of chemical stimulators and serums show promise. This study evaluated trichloroacetic acid stabilized with hydrogen peroxide and kojic acid, plus a serum with niacinamide, tranexamic acid, lactoferrin, ferulic acid, alpha-lipoic acid, and physic acid. Methods: Ten female volunteers with clinically diagnosed melasma underwent six treatment sessions. Each procedure involved application of the chemical stimulator followed by the serum, with strict photoprotection advised. Clinical improvement was assessed using the modified Melasma Area and Severity Index (mMASI) by three independent experts. Objective analysis of pigmentation and texture was performed with photographic documentation processed by the Grey Level Co-Occurrence Matrix (GLCM), measuring contrast and homogeneity in selected facial regions. Results: After six treatments, significant improvement was observed. Mean mMASI scores decreased by 62.3% after 2 weeks and 62.9% after 8 weeks. GLCM confirmed pigmentation reduction, showing decreased contrast and increased homogeneity across all regions, with the chin responding best. Correlation analysis indicated a positive trend between mMASI reduction and contrast changes. No serious adverse events or post-inflammatory hyperpigmentation were reported. Conclusions: The combined protocol significantly reduced melasma hyperpigmentation both clinically and objectively. GLCM analysis complements traditional scales and may provide a valuable quantitative tool for future research.
1. Introduction
Skin discoloration is one of the most common aesthetic defects in patients of dermatology, cosmetology and esthetic medicine practices. One of the most difficult to treat hyperpigmentation lesions is melasma, i.e., irregular discoloration spots, well demarcated from the surroundings, which occupy the face, often located on the forehead, around the mouth and in the upper part of the cheekbones. The lesions intensify under the influence of ultraviolet radiation. They often develop during pregnancy and in women using hormonal contraception [1,2,3,4]. Melasma may occur after the administration of photosensitizing drugs or be the first symptom of endocrine disorders or even an ovarian tumor [4]. Dysfunction of fine capillaries may play a role in the development of melasma. Increased vascularization may be one factor in the development of melasma. It is suspected that significantly increased levels of vascular endothelial growth factor (VEGF) may be the main angiogenic factor of altered skin vessels in melasma [3,4,5].
Achieving long-lasting lightening of melasma-like hyperpigmentation is particularly difficult. Performing invasive procedures with both high-energy light and chemical peels can secondarily cause post-inflammatory hyperpigmentation (PIH) and subsequent deterioration of the skin. Therefore, minimally invasive procedures with reduced inflammation are currently being sought to reduce melasma-like lesions [6,7,8,9,10].
Minimally invasive treatments that have found use in melasma reduction include superficial chemical peels with lactic, mandelic, glycolic, phytic or kojic acids, among others, and chemical skin stimulators based on trichloroacetic acid [6,7,8,9,10,11,12,13]. The mechanism of action of chemical skin stimulators differs from that of classic chemical peels. Stabilization of trichloroacetic acid (TCA) with hydrogen peroxide (H2O2) reduces the aggressiveness of TCA within the epidermis and has a very limited exfoliating effect (no coagulation of epidermal proteins) [14,15]. In the tested formulation, the action of TCA on the epidermis is partially neutralized by hydrogen peroxide while the remaining hydrogen ions move to the dermis where they promote cell proliferation and neocollagenesis [15]. At the level of the dermis, TCA stimulates fibroblasts to produce collagen and extracellular matrix components. Studies have shown that low concentrations of H2O2 (at 0.1–0.3%) have a strong stimulating effect on fibroblasts, increasing the number and affinity of receptors on fibroblasts for growth factors. It also stimulates fibroblasts to synthesise extracellular matrix components [16,17]. In addition, H2O2 at low concentrations reduces the intensity of inflammation [16], which could exacerbate melanogenesis and increase the intensity of melasma in predisposed individuals. The kojic acid present in selected chemical skin stimulators penetrates more easily into the dermal-epidermal junction due to the penetration-promoting action of TCA [18]. The mechanism of action of kojic acid is based on the inhibition of tyrosinase activity, a key enzyme of melanogenesis. Its action is particularly important during the inhibition of post-inflammatory melanogenesis. In addition, kojic acid has the ability to chelate heavy metal ions, including cooper, which is essential in the melanogenesis process. It also has a strong antioxidant effect [19,20]. Studies by Deo et al. have shown that the use of a cream with 1% kojic acid reduces melasma by over 58% (MASI scale) [21].
It is believed that tranexamic acid can prevent the activation of melanocytes by sunlight by inhibiting the plasminogen activation system. It is a synthetic analogue of lysine, and by blocking lysine binding sites in plasminogen molecules, it inhibits the formation of plasmin, which in turn leads to a decrease in the production of prostaglandins, reduces the activity of tyrosinase in melanocytes and inhibits melanogenesis. It therefore acts at various stages of melanogenesis [19,21,22,23,24]. Similarly to UV radiation, an increase in plasminogen concentration can be caused by hormonal contraceptives or hormonal changes during pregnancy. In addition to its effect on melanocytes, plasmin also plays an important role in angiogenesis. Plasmin also plays a role in the release of basic fibroblast growth factor (bFGF), which is a powerful growth factor for melanocytes. All these processes contribute to increased melanin production in the skin [3,4,5]. Tranexamic acid, as a plasmin inhibitor, prevents the activation of melanocytes induced by UV radiation, but also induced by hormones, as well as damaged keratinocytes (after UV exposure, peeling, polychromatic light treatments or laser therapy) [21,22,23,24,25].
Ferulic acid can be used in the skin care of individuals affected by melasma due to its strong antioxidant properties and very weak irritating properties. Its depigmenting effect is based on the competitive inhibition of tyrosinase in the melanogenesis process. In addition, ferulic acid neutralizes free radicals, and prevents lipid peroxidation of cell membranes. It increases the antioxidant potential of vitamins C and E and protects against ultraviolet radiation. It inhibits the process of protein glycation, and has strong anti-inflammatory effects [26,27]. Due to its low irritating properties, ferulic acid can also be successfully used in the delicate eye area [28].
Substances with proven lightening effects also include alpha-lipoic acid, which reduces the activity of tyrosinase by chelating copper ions necessary for the proper activity of this enzyme. Lactoferrin has a similar effect and also has anti-inflammatory and antioxidant properties [25].
Compounds with depigmenting activity also include glabridin, which reduces tyrosinase activity and exhibits strong antioxidant properties [29,30].
Niacinamide can also be found in products that reduce hyperpigmentation, which, similarly to tranexamic acid, inhibits the transfer of melanosomes from melanocytes to keratinocytes [20,26,27].
The aim of this study is to evaluate the efficacy of a treatment using a mixture of trichloroacetic acid stabilized with hydrogen peroxide and kojic acid and a serum for continuing therapy at home containing tranexamic acid, ferulic acid, alpha-lipoic acid, glabridin, lactoferrin and niacinamide in reducing melasma.
2. Materials and Methods
2.1. Study Participants
The preliminary study included 10 female volunteers (Fitzpatrick II) who struggled with hyperpigmentation lesions diagnosed as mixed type melasma (epidermal-dermal). Among the patients, two had Hashimoto’s disease, two others were diagnosed with polycystic ovary syndrome, and four patients were taking oral hormonal contraceptives. The mean age of the volunteers was 39.80 ± 9.41 years, the mean duration of melasma persistence in the volunteers was 3.50 ± 1.18 years. Exclusion criteria included pregnancy and breastfeeding, use of hormone therapy, use of steroid drugs up to three months before treatment, use of vitamin A derivatives topically up to one month before treatment, orally up to six months before treatment, performance of chemical peels up to one month before treatment, use of arbutin and/or hydroquinone up to three months before treatment, use of laser treatments up to three months before treatment, inflammatory skin conditions, autoimmune conditions, renal disorders. The study was approved by the Bioethics Committee (Medical University of Silesia KNW/0022/KB1/27/16).
2.2. Procedure of Melasma Reduction Treatment
The procedures to reduce hyperpigmentation were carried out six times, according to the manufacturer’s recommendations using a preparation containing hydrogen peroxide-stabilised trichloroacetic acid at a concentration of 33% and kojic acid at a concentration of 5% (PRX-T 33, WiQO, Trieste, Italy) and a preparation containing niacinamide, tranexamic acid, lactoferrin, ferulic acid, alpha-lipoic acid, phytic acid (INCI: Aqua, Glycerin, Niacinamide, Ethoxydiglycol, Tranexamic Acid, Propanediol, Macadamia Ternifolia Seed Oil, Lactoferrin, Ferulic Acid, Thioctic Acid, Sodium Hyaluronate, Tamarindus Indica Seed Gum, Phytic Acid, Tocopherol, Glycyrrhiza Glabra (Licorice) Root Extract, Hydrogenated Rapeseed Oil, Helianthus Annuus (Sunflower) Seed Oil, Sclerotium Gum, Sodium Hydroxide, Hydrolyzed Algin, Aminoethylphosphinic Acid, Dehydroacetic Acid, Butylene Glycol, Benzyl Alcohol, Citric Acid (Lightening serum, WiQO, Trieste, Italy). After initial degreasing of the skin with a preparation lowering the skin’s pH, three layers of a product containing trichloroacetic acid, hydrogen peroxide and kojic acid were applied in the first step. Each layer was massaged into specific areas of the face, such as the forehead, nose, left cheek, right cheek, chin, and the area above the upper lip. The next layer was applied after the product was fully absorbed during massage (massage until the glove was dry). After applying three layers, any remaining product was rinsed off with cold water. In the second step, a serum containing niacinamide, tranexamic acid, lactoferrin, ferulic acid, alpha-lipoic acid, phytic acidwas applied only in areas with hyperpigmented lesions. At the end of the treatment, a sunscreen with SPF 50+ was applied. The volunteers were advised to use the whitening serum twice a day only in areas with hyperpigmented lesions. The volunteers were also informed about the need to use sunscreens. The treatments were performed with an interval of 7–14 days depending on the individual skin reaction (redness, epidermal irritation, exfoliation of the epidermis).
2.3. Photographic Documentation
Each volunteer had skin images acquired using the Fotomedicus system version 1 (Elfo, Łódź, Poland) before the first treatment (T0), 2 weeks after the 6th treatment (T1) and 8 weeks after the 6th treatment (T2). Study participants had a series of clinical photographs taken in non-polarized light for documentation purposes, and in cross-polarized light for further image processing and analysis. This system provides standardized lighting conditions through built-in LED light sources housed in a photographic bowl mounted on a column-shaped stand, eliminating variability associated with natural lighting. Cross-polarization eliminates surface reflections from the sebum layer, enabling better visualization of pigmentation changes in the epidermis and dermis. Before the study began, the system was colorimetrically calibrated using a standard ColorChecker target (X-Rite), according to procedures used in dermatological photography. Calibration included optimizing the color temperature of the LED light source (CCT ≈ 5500–6000 K), setting white balance using a neutral gray reference (L* = 50, a* = 0, b* = 0), and verifying exposure parameters (shutter speed, ISO sensitivity, aperture) to ensure repeatability and consistency of colorimetric measurements. A color temperature close to daylight (~5500 K) is recommended in guidelines for standard dermatological photography because it ensures natural skin color reproduction and minimizes chromatic shifts. All patient images were taken under identical conditions: constant distance from the subject, constant camera angle relative to the patient’s face, identical exposure and white balance settings, ensuring high measurement repeatability. The Fotomedicus system automatically stores photographic metadata (date, time, technical parameters) for each image, enabling precise temporal comparisons and data quality control. Using a specialized, calibrated photographic system instead of standard consumer cameras significantly reduces colorimetric deviations (ΔE*) and improves the accuracy of the analysis of objective pigmentation indices, as demonstrated in comparative studies of dermatological imaging systems. The photographic documentation obtained using the FOTOMEDICUS system was subjected to GLCM (Grey Level Co-Occurrence Matrix) analysis.
2.4. Image Processing and Analysis
In the first stage, the RGB images were recorded and decomposed to individual channels: red, green and blue (ImageJ version 1.52a). Then the output image (RGB) and its individual channels were transformed into images in shades of gray (Matlab Version 7.11.0.584 (R2010b), 2018). The next step was image normalization, i.e., broadening the dynamic range to increase the contrast of the images. Normalization was performed for the entire set of 520 recorded images. It consisted in identifying the brightest pixel in the whole set of images, which was given the brightness of 255, and the darkest pixel which was given the brightness of 0. The remaining pixels were assigned the appropriate gray levels in the range from 0 to 255. The GLCM algorithms operating in the MATLAB Version 7.11.0.584 (R2010b) environment were used for the quantitative analysis of vascular lesions.
2.5. GLCM Analysis
GLCM (Grey Level Co-Occurrence Matrix) analysis, i.e., the so-called grey levels co-occurrence matrix, determines how many times a pixel of an image with a given brightness is adjacent to a pixel with a different brightness. The hyperpigmentation lesion is most visible when the contrast between the lesion and healthy skin is the highest. Thus, the subjective perception of hyperpigmentation lesions is affected by: the number of hyperpigmentation lesions in a particular spot, the color of the lesion and the contrast between the lesion and healthy skin [31,32]. In the GLCM, the number of columns and rows equals the number of gray levels (G). Image analysis can be performed in different directions: vertically (90°), horizontally (0°) and diagonally (45° or 135°). In this study, pixels in the horizontal direction (θ = 0°), located in the immediate vicinity (d = 1), were examined.
2.6. The Performed GLCM Analysis Included Contrast and Homogeneity
GLCM contrast according to Formula (1) is a measure of the local brightness variation among pixels in an image. The result of the analysis is an assessment of how many times pixels of a defined brightness are adjacent to each other. For example, Figure 1 shows how many times in the matrix—in a horizontal projection—pixels with a brightness of 1 and 2 appear next to each other. For the examined images the matrix had a size of 256 × 256—the analyses were carried out for 8-bit color depth (Figure 1).
where
i—brightness of the tested pixel,
j—brightness of the adjacent pixel.

Figure 1.
Figure illustrates how a gray-level co-occurrence matrix (GLCM) is constructed from a small grayscale image (a). In panel (b), the blue ellipses indicate all horizontally adjacent pixel pairs with gray levels (1,2). In panel (c), the red circle marks the GLCM element for the pair (1,2), whose value (3) shows that this pair appears three times in the image for the chosen offset.
In patients’ photos the spots including hyperpigmentation lesions (ROI) were identified arbitrarily and were a subject for further analysis. The analysis of the GLCM homogeneity of the image was aimed at determining the homogeneity of pixels brightness within the entire ROI—i.e., the intensity of lesions in the entire studied spot. Homogeneity in the adopted research model was understood as:
where
i—brightness of the tested pixel,
j—brightness of the adjacent pixel.
The greater the homogeneity and the lower the contrast, the more consistent the skin color, which means less change or no change inhyperpigmentation. Contrast and homogeneity are given in relative units (as above).
Four ROI areas were delineated in the GLCM image analysis: forehead, left cheek, right cheek and chin. The analysis of the impact of the treatments on the individual facial zones used the values obtained in each ROI area, and the analysis of the whole face used the values calculated from the formula: Face contrast = 0.3 × ROI contrast, forehead + 0.3 ROI contrast, left cheek + 0.3 ROI contrast, right cheek + 0.1 ROI contrast, chin. Face homogeneity = 0.3 × ROI homogeneity, forehead + 0.3 ROI homogeneity, left cheek + 0.3 ROI homogeneity, right cheek + 0.1 ROI homogeneity, chin.
2.7. The Modified Melasma Area and Severity Index (mMASI)Scale
The mMASI (modified Melasma Area and Severity Index)scale was also used to assess the severity of the lesions. The mMASI scale is a modification of the MASI scale, which takes into account the area of the lesions and the degree of pigmentation intensity to assess the severity of melasma. The mMASI is calculated as follows: a value of 30% (0.30) of the total is assigned to each cheek and the forehead, and 10% (0.10) to the chin. A (area) parameter that indicates the involvement of the area in each section, from 0 to 6. 0 = 0% no pigmentation, 1 = <10%, 2 = from 10 to 29%, 3 = from 30 to 49%, 4 = from 50% to 69%, 5 = from 70% to 89%, 6 = from 90% to 100%. D (darkness) indicates the intensity of the pigmentation from 0 to 4. 0 = pigmentation absent, 1 = slight, 2 = mild, 3 = marked, 4 = severe. mMASI total: range from 0 to 24 (Table 1). The evaluation of melasma reduction based on analysis of pre- and post-treatment photographs was carried out by three independent experts.

Table 1.
Modified Melasma Area and Severity Index.
2.8. Statistical Analysis
Statistical analysis was carried out using STATISTICA 13. The following variables were included in the analysis: the expert mean of the A × D product for the four facial areas before (T0) and after (T1—2 weeks, T2—8 weeks) the treatments in 10 subjects, the expert mean of the mMASI of the whole face before and after the treatments in 10 subjects, the GLCM contrast of the 4 facial areas of the ROI before (T0) and after (T1, T2) the treatments in 10 subjects, the GLCM contrast of the whole face before (T0) and after (T1, T2) the treatments in 10 subjects, the GLCM homogeneity of the 4 facial areas of the ROI before (T0) and after (T1, T2) the treatments in 10 subjects, the GLCM homogeneity of the whole face before and after the treatments in 10 subjects.
The normality of the distribution of the variables was analysed on histograms and using the Shapiro–Wilk test. Most variables, except for one (mean variable A × D forehead before treatments), met the criteria for a normal distribution, and therefore the results are presented as mean ± standard deviation. Given that one variable deviated from normality and the sample size was small, more conservative nonparametric tests—the ANOVA Friedman (post hoc Dunn) test and Spearman rank correlation—were chosen for statistical analysis. In the figures, the data are presented in box-plots with the central measure in the form of median and mean. A statistical significance level of α = 0.05 was adopted.
3. Results
After a series of six treatments using a preparation for chemical skin stimulation containing trichloroacetic acid, hydrogen peroxide and kojic acid and a serum reducing hyperpigmentation containing niacinamide, tranexamic acid, lactoferrin, ferulic acid, alpha-lipoic acid, phytic acid, significant clinical improvement was observed in the volunteers participating in the study (Figure 2, Figure 3, Figure 4 and Figure 5). Evaluation by three independent experts using the mMASI scale showed a reduction in the intensity of hyperpigmentation changes at the level of 62.3% after 2 weeks and 62.9% after 8 weeks (Figure 6).
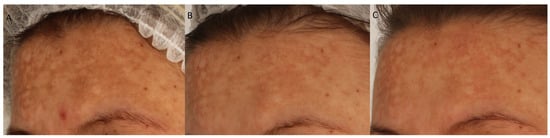
Figure 2.
Change in the intensity of melasma on the forehead of Volunteer 1 (A), 2 weeks after (B) and 8 weeks after (C) a series of 6 treatments, left side.
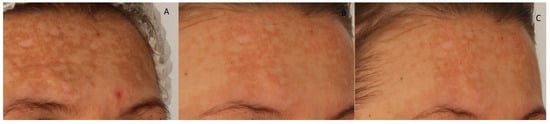
Figure 3.
Change in the intensity of melasma on the forehead of Volunteer 1 before (A), 2 weeks after (B) and 8 weeks after (C) a series of 6 treatments, right side.
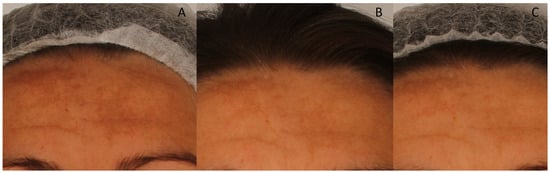
Figure 4.
Change in the intensity of melasma on the forehead of Volunteer 2 before (A),2 weeks after (B) and 8 weeks after (C) a series of 6 treatments.
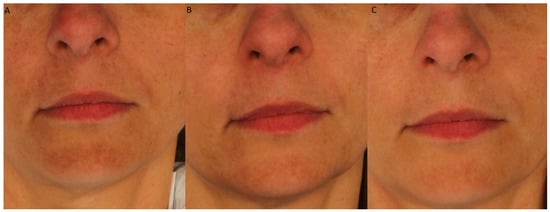
Figure 5.
Change in the intensity of melasma on the chin and around the mouth of Volunteer 3 before (A), 2 weeks after (B) and 8 weeks after (C) a series of 6 treatments.
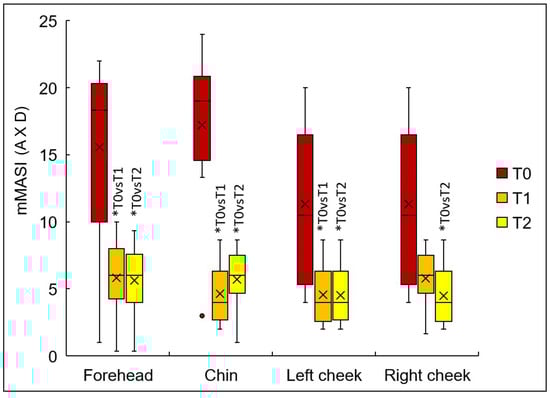
Figure 6.
The product of the A and D values of the mMASI scale in different facial areas (not including the coefficients of 0.3 and 0.1) before (T0), 2 weeks (T1) and 8 weeks (T2) after the treatments, calculated based on the mean score of three experts; x-mean, ―median, box-interquartile range, mustache—minimum maximum non-extending, point- outlier, * p < 0.05.
The subjective assessment of the doctors is confirmed by the results of the GLCM analysis.
The mean severity of hyperpigmentation (A × D) assessed by the three experts in each facial zone decreased in a statistically significant manner after six treatments (Figure 6). The mean values and standard deviation of the severity of hyperpigmentation (A × D) in each zone before and after the treatments were as follows: forehead 15.6 ± 7.0 (T0), 5.8 ± 2.9 (T1), 5.5 ± 2.9 (T2) (p < 0.001, post hoc T0 vs. T1, T0 vs. T2), chin 17.2 ± 5.9 (T0), 4.6 ± 2.2 (T1), 5.7 ± 2.2 (T2) (p < 0.001, post hoc T0 vs. T1, T0 vs. T2), left cheek 11.3 ± 5.7 (T0), 4.6 ± 2.3 (T1), 4.5 ± 2.2 (T2) (p < 0.001, post hoc T0 vs. T1, T0 vs. T2), right cheek 11.3 ± 5.7 (T0), 5.8 ± 2.1 (T1), 4.5 ± 2.3 (T2) (p = 0.004, post hoc T0 vs. T2). A reduction in the severity of hyperpigmentation following the treatments after 2 weeks (T1) occurred in all subjects on the forehead, chin and left cheek, while on the right cheek, a reduction in the severity of hyperpigmentation was observed in 8 out of 10 subjects. After 8 weeks (T2) reduction occurred in all subjects in all zones. The greatest improvement was observed in the chin area, which at baseline showed the highest intensity of hyperpigmentation in the entire group of female volunteers.
The GLCM contrast after the treatments decreased in all facial areas tested in all subjects compared to baseline (Figure 7). The mean and standard deviation of the GLCM contrast before and after the treatmentswere, respectively: forehead 3.1 ± 0.5 (T0), 2.4 ± 0.3 (T1), 2.4 ± 0.3 (T2) (p < 0.001, post hoc T0 vs. T1, T0 vs. T2), chin 7.9 ± 1.6 (T0), 6.8 ± 1.4 (T1), 6.8 ± 1.4 (T2) (p < 0.001, post hoc T0 vs. T1, T0 vs. T2), left cheek 2.5 ± 0.4 (T0), 1.9 ± 0.2 (T1), 1.9 ± 0.2 (T2) (p < 0.001, post hoc T0 vs. T1, T0 vs. T2), right cheek 2.4 ± 0.2 (T0), 1.9 ± 0.1 (T1), 1.9 ± 0.1 (T2) (p < 0.001, post hoc T0 vs. T1, T0 vs. T2). The greatest decrease in GLCM contrast was observed on the chin, objectively confirming the experts’ observations.
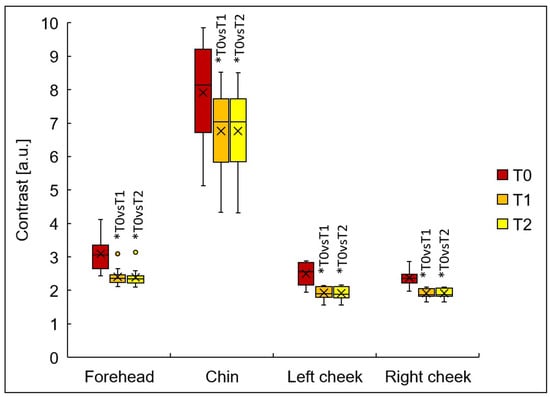
Figure 7.
The GLCM contrast in different facial areas before (T0), 2 weeks (T1) and 8 weeks (T2) after treatments; x-mean, ―median, box-interquartile range, mustache—minimum maximum non-extending, point- outlier, * p < 0.05.
The GLCM homogeneity after the treatments increased in all facial areas tested in all subjects compared to baseline (Figure 8). The mean and standard deviation of GLCM homogeneity before and after the treatments were, respectively: forehead 0.63 ± 0.02 (T0), 0.74 ± 0.03 (T1), 0.74 ± 0.03 (T2) (p < 0.001, post hoc T0 vs. T1, T0 vs. T2), chin 0.61 ± 0.03 (T0), 0.72 ± 0.03 (T1), 0.72 ± 0.03 (T2) (p < 0.001, post hoc T0 vs. T1, T0 vs. T2) left cheek 0.64 ± 0.04 (T0), 0.75 ± 0.04 (T1), 0.75 ± 0.04 (T2) (p < 0.001, post hoc T0 vs. T1, T0 vs. T2) right cheek 0.65 ± 0.03 (T0), 0.74 ± 0.04 (T1), 0.75 ± 0.04 (T2) (p < 0.001, post hoc T0 vs. T1, T0 vs. T2).
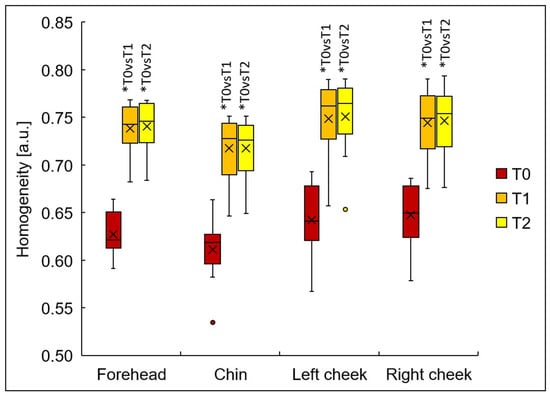
Figure 8.
The GLCM homogeneity in different facial areas before (T0), 2 weeks (T1) and 8 weeks (T2) after treatments; x-mean, ―median, box-interquartile range, mustache—minimum maximum non-extending, point- outlier, * p < 0.05.
Considering the whole face, regardless of the method used to assess the intensity of hyperpigmentation, the treatments resulted in a reduction in unwanted hyperpigmentation in all subjects (Figure 9). The mean expert mMASI value decreased from 13.2 ± 3.3 (T0) to 5.1 ± 2.2 (T1) and 5.0 ± 2.0 (T2) (p < 0.001, post hoc T0 vs. T1, T0 vs. T2), which translated into an average 62.3% and 62.9% improvement compared to the baseline. The contrast value decreased from 3.2 ± 0.4 (T0) to 2.5 ± 0.2 (T1) and 2.5 ± 0.2 (T2) (p < 0.001, post hoc T0 vs. T1, T0 vs. T2), which translates into an average 19.5% and 19.8% improvement compared to the baseline. The homogeneity value increased from 0.636 ± 0.03 (T0) to 0.741 ± 0.03 (T1) and 0.743 ± 0.03 (T2) (p < 0.001, post hoc T0 vs. T1, T0 vs. T2), which translated into an average 16.5% and 16.8% improvement.
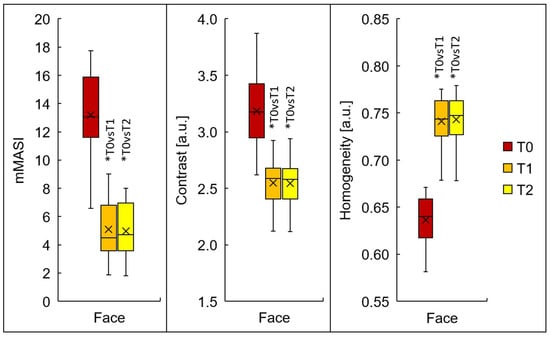
Figure 9.
Assessment of whole-face hyperpigmentation before (T0), 2 weeks (T1) and 8 weeks (T2) after treatments using the mMASI scale (average of three experts) and the GLCM method (contrast, homogeneity), where the values of the different facial zones were multiplied by factors and their sums calculated (forehead × 0.3 + right cheek × 0.3 + left cheek × 0.3 + chin × 0.1) x-mean, ―median, box- interquartile range, mustache—minimum maximum non-extending, point- outlier, * p < 0.05.
The mMASI values obtained before (T0) the treatments were correlated with the GLCM contrast and GLCM homogeneity values for the whole face before (T0) the treatments, and no statistically significant correlations were found between these parameters (Table 2). Similarly, the mMASI values obtained after the treatments (T1, T2) were correlated with the GLCM contrast and GLCM homogeneity values for the whole face after the treatments (T1, T2), also showing no statistically significant association between these parameters.
Table 2.
Correlations of mMASI values for the whole face and GLCM contrast and homogeneity for the whole face before (T0), 2 weeks (T1) and 8 weeks (T2) after treatments.
In each subject, the percentage change in the final value obtained after the treatments (T1, T2) compared to the initial value (T0) for the whole face of the mMASI, GLCM contrast and GLCM homogeneity parameters was calculated. Then, the percentage of change in mMASI was correlated with the percentage of change in GLCM parameters, and a tendency towards a positive correlation was demonstrated between the changes in mMASI and GLCM contrast as a result of the treatments after 2 weeks (T0-T1%) (R = 0.62, p = 0.056) (Table 3). A statistically significant relationship between the change in treatment effect after two weeks between mMASI and GLCM homogeneity was not demonstrated. Changes in GLCM contrast and GLCM homogeneity parameters observed after 8 weeks (T0-T2%) did not correlate with changes in mMASI in a statistically significant manner.
Table 3.
Correlation of the change in whole face mMASI values occurring 2 weeks (T0–T1%) and 8 weeks (T0–T2%) after the treatments with the change in contrast values and whole face GLCM homogeneity occurring 2 weeks (T0–T1%) and 8 weeks (T0–T2%) after the treatments.
4. Discussion
The lack of complications in the form of post-inflammatory hyperpigmentation (PIH) typical after aggressive lightening treatments, suggests that TCA H2O2 modification is safer than traditional chemical peels (e.g., with 92% lactic acid), which are associated with a risk of irritation especially in people with phototype III–IV. Stabilization of the TCA with hydrogen peroxide (H2O2) reduced the inflammatory response, which may have reduced the risk of post-inflammatory hyperpigmentation, which is crucial in melasma therapy. Furthermore, H2O2 at a concentration of 0.1–0.3% was shown to stimulate fibroblasts to synthesize collagen without inducing excessive melanogenesis [14,15].
The use of a modified TCA combination with depigmenting substances such as tranexamic acid (plasminogen inhibition), ferulic acid (antioxidation) or alpha-lipoic acid (copper chelation) has allowed the synergistic inhibition of melanogenesis at various stages and is increasingly being used in the reduction in hormonal, vascular or post-inflammatory hyperpigmentation, including melasma. The studies by Furmanczyk et al. [26] have shown that combining ingredients that interact with one or more steps in the melanogenesis pathway is an effective method of pigmentation control due to the potential synergies it offers.
As the transepidermal penetration of tranexamic acid and other lightening substances may be limited in the scientific literature, studies can be found using the application of lightening products in combination protocols with micro-needle mesotherapy or laser therapy, among others [33,34,35,36,37,38,39].
Kaur et al. [35] showed that the use of 10% tranexamic acid in combination with micro-needle mesotherapy resulted in a melasma reduction (mMASI) of 65.92% on the side of the face to which tranexamic acid was applied compared to 20.75% for the side of the face receiving micro-needle mesotherapy alone. The studies by Ebrahim et al. [36] showed that both the use of classic needle mesotherapy and micro-needle mesotherapy with tranexamic acid resulted in a significant reduction in melasma. The researchers recorded a 74.8% and 73.6% reduction in mMASI scale lesions on the side of needle mesotherapy and microneedling administered, respectively. Similar results were obtained by Poostiyan et al. [37], who also demonstrated similar efficacy of classic needle mesotherapy and micro-needle mesotherapy. However, patient satisfaction was significantly higher with TXA mezoneedling compared to TXA microinjection.
The split-face studies conducted by Zhou et al. [38] showed that the use of a combination of topical tranexamic acid application and a picosecond laser at 755 nm had significantly better results than laser therapy of melasma alone (41.9% versus 24.9%) reduction in hyperpigmentation on the mMASI scale). Hawwam et al. [39] in their split-face study showed that the combination of a Q-switched Nd:Yag laser with intradermal tranexamic acid injections yielded a greater reduction in melasma after 12 weeks of therapy than intradermal tranexamic acid injection alone.
In our studies of the effectiveness of melasma reduction, instead of micro-needle mesotherapy or laser therapy, a chemical skin stimulator containing TCA, H2O2 and kojic acid was used as a penetration promoter. The reduction in the intensity of hyperpigmented melasma-type lesions (mMASI) averaged 62.3% 2 weeks after the end of therapy and 62.9% after 8 weeks after the end of therapy.
The use of TCA in improving the condition of skin affected by melasma is well documented. A study by Kumari et al. [40] demonstrated that both a gradual increase in TCA concentration (from 10% to 20%) in chemical peels and a gradual increase in glycolic acid concentration (from 20% to 35%) in subsequent treatments yields good melasma reduction results while minimizing the risk of PIH. Soliman et al. demonstrated that topical application of ascorbic acid between peels with 20% TCA can significantly improve the final melasma reduction result [41]. Dorgham et al. [42], in a systematic review of the efficacy and tolerability of chemical peels in reducing melasma, noted that TCA monotherapy carries a slightly higher risk of PIH and erythema than glycolic acid or Jessner’s solution. The study by Prasad et al. [43] demonstrated that both a superficial peel with 15% TCA can significantly lighten melasma (mean mMASI reduction of 8.5 points) and a mixture of 15% TCA with 15% phenol and 2% glycolic acid (mean mMASI reduction of 6 points). However, the use of TCA alone significantly increased the risk of PIH compared to the use of a combination of peels (9 of 10 patients using TCA alone developed redness and PIH, compared to 1 of 10 patients in the combined group). Studies indicate that combining several chemical peels or chemical peels with depigmenting agents may be more effective due to their ability to target melasma in different skin layers and provide a synergistic effect. Furthermore, the use of lower TCA concentrations or its stabilization with H2O2 may reduce the risk of persistent erythema or PIH. In our study, we did not observe PIH or persistent erythema during the 8-week follow-up after the completion of the treatment series. During the study, two patients experienced skin irritation after the first treatment, manifesting as redness lasting several hours and a burning sensation during the procedure. In five patients, minor, bran-like exfoliation was observed after the first treatment on days 3 and 4. No exfoliation was observed after subsequent treatments.
The use of GLCM (contrast and homogeneity) algorithms provided quantitative data on stain reduction, complementing the subjective mMASI scale. Grey Level Co-Occurrence Matrix (GLCM) analysis is increasingly used in cosmetology, dermatology and esthetic medicine as a tool for the objective assessment of skin lesions. It is used to assess both skin tone and texture [32,44,45,46,47]. GLCM analysis is applicable in the evaluation of erythema reduction after dermatological therapies [45]. Almeida et al. [32] proposed the use of GLCM algorithms in the analysis of nevus images to increase the chance of melanoma detection from images by artificial intelligence. They pointed out that color is one of the important features in the study of skin lesions, and that the homogeneity of pigmentation in particular can be crucial. K V. and Selvakumar [47] proposed the use of GLCM algorithms as part of image analysis for machine learning to increase the chance of detecting skin cancers at an early stage.
The study by Wawrzyk-Bochenek et al. [48] showed that GLCM analysis can be successfully used to assess the reduction in skin hyperpigmentation after micro-needle mesotherapy with 12% vitamin C. A 10.7% reduction in contrast and a 14.5% increase in homogeneity were observed. In an in-house study evaluating the efficacy of a treatment combining a chemical skin stimulator with a lightening serum in melasma reduction, a slightly greater reduction in GLCM contrast (19.5%) and a similar increase in homogeneity (16.5%) were obtained 2 weeks after the end of the treatments and this effect was also maintained 8 weeks after the end of the treatments: contrast (19.8%), homogeneity (16.8%). The subjective mMASI scale and the objective GLCM contrast and homogeneity parameters are useful in monitoring the effects of hyperpigmentation reduction. Both assessment methods demonstrated statistically significant improvements in skin tone. However, due to the lack of significant correlations between the above methods, it is advisable to use them complementarily.
The lesser reduction in hyperpigmentation on the right cheek (8/10 patients) may be due, among other things, to increased UV exposure while driving (this needs to be verified in studies with sun exposure monitoring) or insufficient sun protection of the skin. Regardless of the melasma treatment used, photoprotection is one of the key elements of skin care both after treatments and in the post-treatment period.
Testing Limitations
Limitations of the study are the small sample size (n = 10) and the lack of a control group (e.g., using only serums) make it impossible to isolate the contribution of individual components. Double-blind studies are needed, which we plan to perform in the future. The short follow-up time (8 weeks) for patients is also a limitation. At the next stage, we plan a 12-month follow-up period with appropriate photoprotection.
5. Conclusions
A series of 6 treatments using a mixture of alpha-hydroxy acids with tranexamic acid appears to be sufficient to achieve a reduction in hyperpigmented lesions of the melasma type. The effects of the therapy were maintained 8 weeks after the completion of the series of 6 treatments, as demonstrated by the subjective mMASI expert scale and objective GLCM image analysis techniques. In addition to the commonly used mMASI scale, GLCM analysis can be an effective method for assessing the effectiveness of therapies aimed at reducing hyperpigmented lesions. These preliminary findings provide proof-of-concept for the combined treatment protocol and warrant validation through larger, randomized, double-blind, controlled trials with extended follow-up periods and objective monitoring of UV exposure and treatment compliance. The current results should be interpreted as hypothesis-generating rather than definitive evidence of efficacy.
Author Contributions
Conceptualization, A.D. and M.H.-P.; methodology, A.D.; software, A.D.; validation, A.D., M.H.-P. and D.W.-D.; formal analysis, A.D.; investigation, A.D.; resources, A.L.; data curation, A.D.; writing—original draft preparation, A.D.; writing—review and editing, M.H.-P., D.W.-D. and S.W.; visualization, A.D.; supervision, D.W.-D. and S.W.; project administration, M.H.-P.; funding acquisition, S.W. All authors have read and agreed to the published version of the manuscript.
Funding
The project ‘Objective evaluation of the effectiveness of light therapy or treatments with active substances in the treatment of dermatological disorders and/or esthetic defects located in the area of exposed body parts’ was funded by the Upper Silesian-Zagłębie Metropolis within the framework of the ‘Metropolitan Science Support Fund’ programme. Agreement number RW/23/2025.
Institutional Review Board Statement
The study was conducted in accordance with the Declaration of Helsinki, and approved by the Bioethics Committee of the Medical University of Silesia (PCN/0022/KB1/11/I/20) of 19 May 2020.
Informed Consent Statement
Informed consent was obtained from all subjects involved in the study. Written informed consent has been obtained from the patients to publish this paper.
Data Availability Statement
Dataset available on request from the authors.
Conflicts of Interest
The authors declare no conflicts of interest.
References
- Ogbechie-Godec, O.A.; Elbuluk, N. Melasma: An Up-to-Date Comprehensive Review. Dermatol. Ther. 2017, 7, 305–318. [Google Scholar] [CrossRef] [PubMed]
- Kwon, S.H.; Hwang, Y.J.; Lee, S.K.; Park, K.C. Heterogeneous Pathology of Melasma and Its Clinical Implications. Int. J. Mol. Sci. 2016, 17, 824. [Google Scholar] [CrossRef]
- Kwon, S.H.; Na, J.I.; Choi, J.Y.; Park, K.C. Melasma: Updates and perspectives. Exp. Dermatol. 2019, 28, 704–708. [Google Scholar] [CrossRef] [PubMed]
- Artzi, O.; Horovitz, T.; Bar-Ilan, E.; Shehadeh, W.; Koren, A.; Zusmanovitch, L.; Mehrabi, J.N.; Salameh, F.; Isman Nelkenbaum, G.; Zur, E.; et al. The pathogenesis of melasma and implications for treatment. J. Cosmet. Dermatol. 2021, 20, 3432–3445. [Google Scholar] [CrossRef] [PubMed]
- Gautam, M.; Patil, S.; Nadkarni, N.; Sandhu, M.; Godse, K.; Setia, M. Histopathological comparison of lesional and perilesional skin in melasma: A cross-sectional analysis. Indian J. Dermatol. Venereol. Leprol. 2019, 85, 367–373. [Google Scholar] [CrossRef]
- Piętowska, Z.; Nowicka, D.; Szepietowski, J.C. Understanding Melasma—How Can Pharmacology and Cosmetology Procedures and Prevention Help to Achieve Optimal Treatment Results? A Narrative Review. Int. J. Environ. Res. Public Health 2022, 19, 12084. [Google Scholar] [CrossRef]
- Neagu, N.; Conforti, C.; Agozzino, M.; Marangi, G.F.; Morariu, S.H.; Pellacani, G.; Persichetti, P.; Piccolo, D.; Segreto, F.; Zalaudek, I.; et al. Melasma treatment: A systematic review. J. Dermatol. Treat. 2022, 33, 1816–1837. [Google Scholar] [CrossRef]
- Zhou, L.L.; Baibergenova, A. Melasma: Systematic review of the systemic treatments. Int. J. Dermatol. 2017, 56, 902–908. [Google Scholar] [CrossRef]
- Babbush, K.M.; Babbush, R.A.; Khachemoune, A. The Therapeutic Use of Antioxidants for Melasma. J. Drugs Dermatol. 2020, 19, 788–792. [Google Scholar] [CrossRef]
- Sarkar, R.; Bansal, A.; Ailawadi, P. Future therapies in melasma: What lies ahead? Indian J. Dermatol. Venereol. Leprol. 2020, 86, 8–17. [Google Scholar] [CrossRef]
- Sarkar, R.; Garg, V.; Bansal, S.; Sethi, S.; Gupta, C. Comparative Evaluation of Efficacy and Tolerability of Glycolic Acid, Salicylic Mandelic Acid, and Phytic Acid Combination Peels in Melasma. Dermatol. Surg. 2016, 42, 384–391. [Google Scholar] [CrossRef] [PubMed]
- Sarkar, R.; Katoch, S. Chemical Peels in Treatment of Melasma. Dermatol. Clin. 2024, 42, 21–32. [Google Scholar] [CrossRef] [PubMed]
- Albzea, W.; AlRashidi, R.; Alkandari, D.; Sadan, M.; Alkandari, A.; Alkanderi, J.J.; AlHajri, M.T.; Almutairi, S.N.; Alenzi, A.; Alanazi, S.; et al. Azelaic Acid Versus Hydroquinone for Managing Patients with Melasma: Systematic Review and Meta-Analysis of Randomized Controlled Trials. Cureus 2023, 15, e41796. [Google Scholar] [CrossRef]
- Castellana, R.; De Sa Viana, A.C.; Rizzi, L. Fibroblast stimulation through the activation of the endocrine system for the application of trichloroacetic acid. La Med. Estet. 2013, 3, 188–193. [Google Scholar]
- Gold, M.H.; Wilson, A.; Biron, J.A. Treatment of Mild to Moderate Facial Chrono- and Photodamage with a Novel Intense Liquid Trichloroacetic Acid Peel. J. Clin. Aesthet. Dermatol. 2022, 15, E61–E65. [Google Scholar]
- Roy, S.; Khanna, S.; Nallu, K.; Hunt, T.K.; Sen, C.K. Dermal wound healing is subject to redox control. Mol. Ther. 2006, 13, 211–220. [Google Scholar] [CrossRef]
- Sen, C.K.; Khanna, S.; Babior, B.M.; Hunt, T.K.; Ellison, E.C.; Roy, S. Oxidant-induced vascular endothelial growth factor expression in human keratinocytes and cutaneous wound healing. J. Biol. Chem. 2002, 277, 33284–33290. [Google Scholar] [CrossRef]
- Sitohang, I.B.S.; Legiawati, L.; Suseno, L.S.; Safira, F.D. Trichloroacetic Acid Peeling for Treating Photoaging: A Systematic Review. Dermatol. Res. Pract. 2021, 30, 3085670. [Google Scholar] [CrossRef]
- Desai, S.; Ayres, E.; Bak, H.; Manco, M.; Lynch, S.; Raab, S.; Du, A.; Green, D.; Skobowiat, C.; Wangari-Talbot, J.; et al. Effect of a Tranexamic Acid, Kojic Acid, and Niacinamide Containing Serum on Facial Dyschromia: A Clinical Evaluation. J. Drugs Dermatol. 2019, 18, 454–459. [Google Scholar]
- González-Molina, V.; Martí-Pineda, A.; González, N. Topical Treatments for Melasma and Their Mechanism of Action. J. Clin. Aesthet. Dermatol. 2022, 15, 19–28. [Google Scholar]
- Deo, K.S.; Dash, K.N.; Sharma, Y.K.; Virmani, N.C.; Oberai, C. Kojic Acid vis-a-vis its Combinations with Hydroquinone and Betamethasone Valerate in Melasma: A Randomized, Single Blind, Comparative Study of Efficacy and Safety. Indian J. Dermatol. 2013, 58, 281–285. [Google Scholar] [CrossRef] [PubMed]
- Gaćina, K.; Krstanović Ćosić, A. The Use of Tranexamic Acid in Dermatology. Acta Clin. Croat. 2023, 62, 368–372. [Google Scholar] [CrossRef] [PubMed]
- Mahjoub, T.T.; Milibary, H.H. Oral tranexamic acid in the treatment of hyperpigmentation disorder beyond melasma: A review. J. Cosmet. Dermatol. 2023, 22, 1157–1162. [Google Scholar] [CrossRef] [PubMed]
- Chen, T.; Xue, J.; Wang, Q. Tranexamic Acid for the Treatment of Hyperpigmentation and Telangiectatic Disorders Other Than Melasma: An Update. Clin. Cosmet. Investig. Dermatol. 2024, 17, 2151–2163. [Google Scholar] [CrossRef]
- Konisky, H.; Balazic, E.; Jaller, J.A.; Khanna, U.; Kobets, K. Tranexamic acid in melasma: A focused review on drug administration routes. J. Cosmet. Dermatol. 2023, 22, 1197–1206. [Google Scholar] [CrossRef]
- Furmanczyk, M.; Brown, A.; Bustos, J.; de Henestrosa, A.R.F.; Trullas, C.; Granger, C.; Jourdan, E. Efficacy and tolerability of a depigmenting gel serum comprising tranexamic acid, niacinamide, 4-butylresorcinol, phytic acid, and a mixture of hydroxy acids. J. Cosmet. Dermatol. 2024, 23, 2058–2065. [Google Scholar] [CrossRef]
- Babbush, K.M.; Babbush, R.A.; Khachemoune, A. Treatment of melasma: A review of less commonly used antioxidants. Int. J. Dermatol. 2021, 60, 166–173. [Google Scholar] [CrossRef]
- Dayal, S.; Sangal, B.; Sahu, P. Ferulic acid 12% peel: An innovative peel for constitutional type of periorbital melanosis-Comparing clinical efficacy and safety with 20% glycolic peel and 15% lactic peel. J. Cosmet. Dermatol. 2020, 19, 2342–2348. [Google Scholar] [CrossRef]
- Kang, M.H.; Jang, G.Y.; Ji, Y.J.; Lee, J.H.; Choi, S.J.; Hyun, T.K.; Kim, H.D. Antioxidant and Anti-Melanogenic Activities of Heat-Treated Licorice (Wongam, Glycyrrhiza glabra × G. uralensis) Extract. Curr. Issues Mol. Biol. 2021, 43, 1171–1187. [Google Scholar] [CrossRef]
- Liu, J.; Xu, X.; Jian, M.; Guo, Y.; Zhai, L.; Sun, G.; Sun, L.; Jiang, R. Glycyrrhiza glabra extract as a skin-whitening agent: Identification of active components and CRTC1/MITF pathway-inhibition mechanism. J. Ethnopharmacol. 2025, 349, 119948. [Google Scholar] [CrossRef]
- Kikuchi, K.; Masuda, Y.; Yamashita, T.; Kawai, E.; Hirao, T. Image analysis of skin color heterogeneity focusing on skin chromophores and the age-related changes in facial skin. Skin Res. Technol. 2015, 2, 175–183. [Google Scholar] [CrossRef]
- Ou, X.; Pan, W.; Xiao, P. In vivo skin capacitive imaging analysis by using grey level co-occurrence matrix (GLCM). Int. J. Pharm. 2014, 460, 28–32. [Google Scholar] [CrossRef]
- Brasil Dos Santos, J.; Nagem Lopes, L.P.; de Lima, G.G.; Teixeira da Silva, R.; da Silva E Souza Lorca, B.; Miranda Pinheiro, G.; Faria de Freitas, Z.M. Microneedling with cutaneous delivery of topical agents for the treatment of melasma: A systematic review. J. Cosmet. Dermatol. 2022, 21, 5680–5695. [Google Scholar] [CrossRef] [PubMed]
- Liu, Z. Treatment of Melasma with Q-Switched Laser in Combination with Tranexamic Acid. Dermatol. Res. Pract. 2025, 2025, 1883760. [Google Scholar] [CrossRef] [PubMed]
- Kaur, A.; Bhalla, M.; Pal Thami, G.; Sandhu, J. Clinical Efficacy of Topical Tranexamic Acid with Microneedling in Melasma. Dermatol. Surg. 2020, 46, e96–e101. [Google Scholar] [CrossRef] [PubMed]
- Ebrahim, H.M.; Said Abdelshafy, A.; Khattab, F.; Gharib, K. Tranexamic Acid for Melasma Treatment: A Split-Face Study. Dermatol. Surg. 2020, 46, e102–e107. [Google Scholar] [CrossRef]
- Poostiyan, N.; Alizadeh, M.; Shahmoradi, Z.; Fatemi Naeini, F. Tranexamic acid microinjections versus tranexamic acid mesoneedling in the treatment of facial melasma: A randomized assessor-blind split-face controlled trial. J. Cosmet. Dermatol. 2023, 22, 1238–1244. [Google Scholar] [CrossRef]
- Zhou, N.; Tao, J.; Yi, Z.; Wu, L.; Liu, Z.; Yang, B. Safety and efficacy of a picosecond 755-nm alexandrite laser combined with topical tranexamic acid in the treatment of melasma. J. Cosmet. Dermatol. 2024, 23, 3579–3584. [Google Scholar] [CrossRef]
- Hawwam, S.A.; Ismail, M.; El-Attar, Y.A. Split-face comparative study between intradermal tranexamic acid injection alone versus combined with Q-switched Nd:YAG laser in melasma treatment. Lasers Med. Sci. 2022, 37, 2193–2201. [Google Scholar] [CrossRef]
- Kumari, R.; Thappa, D.M. Comparative study of trichloroacetic acid versus glycolic acid chemical peels in the treatment of melasma. Indian J. Dermatol. Venereol. Leprol. 2010, 76, 447. [Google Scholar] [CrossRef]
- Soliman, M.M.; Ramadan, S.A.; Bassiouny, D.A.; Abdelmalek, M. Combined trichloroacetic acid peel and topical ascorbic acid versus trichloroacetic acid peel alone in the treatment of melasma: A comparative study. J. Cosmet. Dermatol. 2007, 6, 89–94. [Google Scholar] [CrossRef] [PubMed]
- Dorgham, N.A.; Hegazy, R.A.; Sharobim, A.K.; Dorgham, D.A. Efficacy and tolerability of chemical peeling as a single agent for melasma in dark-skinned patients: A systematic review and meta-analysis of comparative trials. J. Cosmet. Dermatol. 2020, 19, 2812–2819. [Google Scholar] [CrossRef] [PubMed]
- Prasad, N.; Singh, M.; Malhotra, S.; Singh, N.; Tyagi, A.; Tyagi, S. Comparative Efficacy of Chemical Peeling Agents in the Treatment of Melasma. Cureus 2023, 15, e47312. [Google Scholar] [CrossRef]
- Saknite, I.; Zavorins, A.; Jakovels, D.; Spigulis, J.; Kisis, J. Comparison of single-spot technique and RGB imaging for erythema index estimation. Physiol. Meas. 2016, 37, 333–346. [Google Scholar] [CrossRef] [PubMed]
- Odrzywołek, W.; Deda, A.; Zdrada, J.; Wilczyński, S.; Błońska-Fajfrowska, B.; Lipka-Trawińska, A. Quantitative Evaluation of the Effectiveness of Chemical Peelings in Reducing Acne Lesions Based on Gray-Level Co-Occurrence Matrix (GLCM). Clin. Cosmet. Investig. Dermatol. 2022, 15, 1873–1882. [Google Scholar] [CrossRef]
- Almeida, M.A.M.; Santos, I.A.X. Classification Models for Skin Tumor Detection Using Texture Analysis in Medical Images. J. Imaging 2020, 6, 51. [Google Scholar] [CrossRef]
- K.V, S.P.R.; Selvakumar, M. Personalized recommendation system to handle skin cancer at early stage based on hybrid model. Network 2025, 1–40. [Google Scholar] [CrossRef]
- Wawrzyk-Bochenek, I.; Rahnama, M.; Wilczyński, S.; Wawrzyk, A. Quantitative Assessment of Hyperpigmentation Changes in Human Skin after Microneedle Mesotherapy Using the Gray-Level Co-Occurrence Matrix (GLCM) Method. J. Clin. Med. 2023, 12, 5249. [Google Scholar] [CrossRef]
Disclaimer/Publisher’s Note: The statements, opinions and data contained in all publications are solely those of the individual author(s) and contributor(s) and not of MDPI and/or the editor(s). MDPI and/or the editor(s) disclaim responsibility for any injury to people or property resulting from any ideas, methods, instructions or products referred to in the content. |
© 2025 by the authors. Licensee MDPI, Basel, Switzerland. This article is an open access article distributed under the terms and conditions of the Creative Commons Attribution (CC BY) license (https://creativecommons.org/licenses/by/4.0/).