Abstract
In the context of manufacturing logistics, this study sheds light on the difficult task of concurrently optimizing cost, time, influence on sustainability, and spatial efficiency. Specifically, this addresses the integrated challenge of material handling equipment selection and facility space allocation, a crucial decision-making domain where conventional single-objective methodologies frequently overlook vital considerations. While recent research predominantly relies on meta-heuristics and simulation-based solution methodologies, they do not guarantee a global optimum solution space. To effectively address this multifaceted decision environment, a Mixed-Integer Linear Programming (MILP) model is developed and resolved utilizing two distinct scalarization methodologies: the conventional ϵ-constraint method and the augmented ϵ-constraint method (AUGMECON2). The comparative analysis indicates that although both methods effectively identify the Pareto front, the AUGMECON2 approach offers a more robust assurance of solution efficiency by incorporating slack variables. The results illustrate a convex trade-off between capital expenditure and operational flow time, indicating that substantial reductions in time necessitate strategic investments in higher-capacity equipment fleets. Furthermore, the analysis underscores a significant conflict between achieving extreme operational efficiency and adhering to facility design standards, as reducing time or energy consumption beyond a specific point requires deviations from optimal space allocation policies. Ultimately, a “Best Compromise Solution” is determined that harmonizes near-optimal operational efficiency with strict compliance to spatial constraints, providing a resilient framework for sustainable manufacturing logistical planning.
1. Introduction
The global manufacturing sector has a crucial role in global development. According to the World Bank (2023) [1], the global manufacturing sector is responsible for approximately 15% of the world’s GDP between 2010 and 2025. Furthermore, the global manufacturing employment rate was between 14.3% and 13.6% between 2015 and 2021 [2]. Material flows and logistics operations within the manufacturing environments, e.g., material handling, inventory management, intra-facility transportation, and spatial coordination of the manufacturing area, represent a crucial efficiency frontier. Logistics and inventory costs are a substantial portion of total expenses for manufacturers. Coyle et al. (2017) underline that logistics can account for approximately 5% of total revenue and inventory carrying costs, encompassing transportation, storage, and order fulfillment activities [3]. Furthermore, the annual cost of inventory management, including investment costs, storage, insurance, taxes, and obsolescence, adds approximately 20% to the value of the held items, which indicates the importance of effective inventory management in a manufacturing environment [4]. The integration of efficient inbound logistics and material handling systems management is essential to minimize costs and maintain a competitive edge. Furthermore, manufacturing logistics contributes to carbon footprints as industrial material handling and logistics operations are estimated to generate significant portions of carbon emissions [5]. These challenges highlight the need for robust optimization approaches that can address economic, temporal, environmental, and spatial design considerations for the decision-makers.
Traditional cost-minimizing- or profit-maximizing-centered single-objective optimization methods have dominated manufacturing logistics studies. However, the recent literature highlights that such cost- or profit-centered single-objective studies lead to suboptimal system performance when evaluated against extensive sustainability metrics [6]. The conflicting objectives of manufacturing logistics, e.g., reducing costs may increase emissions, or minimizing flow time could require spatial compromises, may require Pareto-optimal decision space with multi-objective optimization techniques. Recent industry analyses indicate that a majority of manufacturing executives report challenges in balancing competing efficiency and resilience [7].
Haimes (1971) formalized the ϵ-constraint method as a prominent approach for multi-objective optimization in the engineering context [8]. By transforming the objectives into constraints with various ϵ levels, it generates Pareto-optimal solutions through strategic parameter variation. However, several studies, such as Mavrotas (2009), identify significant limitations in the traditional ϵ-constraint method, including uneven solution distribution, computational inefficiency for problems with more than three objectives, and the potential generation of weakly efficient solutions [9]. These limitations play a crucial role in manufacturing logistics modeling as decision-makers require comprehensive trade-off information across multiple conflicting objectives. Mavrotas and Florios (2013) proposed the AUGMECON2 method, an enhanced ϵ-constraint method incorporating several improvements [10]. These improvements include integrating an augmented objective function with lexicographic optimization, slack variables for constraint analysis, and a payoff table for bound determination into the mathematical model. The application of AUGMECON2 to intra-facility manufacturing logistics provides an efficient solution method for addressing cost, time, emission, and spatial efficiency for managing the conflicting goals efficiently.
The intra-facility manufacturing logistics optimization problem presents unique difficulties. Manufacturing environments exhibit constrained spatial configurations, with material flow routes competing for limited space availability. Facility-planning literature underlines that suboptimal layout and material route design significantly influence material handling cost and operational time [11]. In addition, growing legislative pressure and corporate sustainability regulations require careful consideration of environmental impacts. The World Economic Forum (2024) reports that many manufacturers are targeting significant reductions in Scope 1 and 2 emissions by 2050 [12]. These conflicting objectives create a complex multi-dimensional optimization space to identify balanced and implementable solutions.
This study proposes three major contributions to intra-facility manufacturing optimization literature. First, a comprehensive four-objective optimization model is developed, addressing cost minimization, time reduction, emission control, and spatial design efficiency. Second, a comprehensive and comparative methodological analysis of the ϵ-constraint and AUGMECON2 approaches is conducted. Third, managerial implications of and practical insights into conflicting goals for decision-makers in the manufacturing logistics environment are proposed.
2. Literature Review
The optimization of logistics operations, including material handling and inventory management within a manufacturing environment, has been a crucial problem in real-life industry cases and has been a focal point of recent research. The need to reconcile the conflicting goals, such as cost minimization and managing sustainability impact, requires a comprehensive managerial and technical understanding for the decision-makers. The existing literature in manufacturing logistics optimization studies can be broadly discussed under two methodological streams: Simulation-based approaches, which contain the layout and flow analysis studies, and meta-heuristics-based approaches, which deal with dynamic vehicle routing and scheduling problems.
2.1. Simulation and Layout Optimization
Early research in simulation and layout optimization in manufacturing environments in the last decade heavily focused on the physical design and arrangement of production facilities and the validation of material flow strategies through simulation models. Zhang et al. (2015) developed a dynamical optimization model and implemented an analytic hierarchy process (AHP)-based multi-criteria decision-making (MCDM) approach for the shopfloor material-handling design problem [13]. Centobelli et al. (2016) utilized a Discrete Event Simulation (DES) model in digital factories for layout design and production lead time management [14]. Building on this, Drastich (2017) investigated the transition from push to pull systems, employing KANBAN-based simulation methodology in a production environment to minimize the waste time in material flow operations [15]. Focusing on human logistics, Mårdberg et al. (2018) implemented a priority-rule-based scheduling heuristic (PRBSH) model to optimize the walking routes within a production facility [16]. More recently, Zuniga et al. (2020) used a simulation-based optimization methodology to optimize facility layout design in a manufacturing environment [17]. These studies highlight that while simulation models are effective tools for production facility layout design problems, they often rely on iterative testing rather than mathematically optimal outcomes.
2.2. Meta-Heuristics in AGV Scheduling
With the rise of Industry 4.0/5.0 and AI, studies in the logistics optimization of manufacturing facilities have shifted toward dynamic scheduling of Automated Guided Vehicles (AGVs) using meta-heuristic algorithms. Wang et al. (2019) developed a genetic algorithm (GA)-based heuristic model for multi-AGV network design in a manufacturing environment [18]. Similarly, Bányai (2021) proposed a hybrid black hole and flower pollination-based metaheuristic algorithm to solve NP-hard routing and scheduling problems in a smart manufacturing environment [19]. Ant colony optimization (ACO) has become a dominant method in this domain due to its performance and adaptability. Wang et al. (2022) used an ACO model to design an AGV collision detection system in a production area to minimize maximum transportation time [20]. Wu et al. (2023) developed a conflict-free path optimization model using ACO for intelligent manufacturing environments [21]. Expanding into multi-objective problems, Cheng and Meng (2024) implemented ACO to minimize total processing time and power consumption in a manufacturing environment [22]. Most recently, Zhu et al. (2025) proposed an ACO-based heuristic model to optimize the milk run route of AGVs, minimizing the overall distribution time [23].
In parallel, various studies investigated the integration of shop-floor logistics and warehouse operations management in dynamic manufacturing environments. Poon et al. (2011a) developed an RFID-integrated genetic algorithm (GA) model for managing small-batch material demand [24]. Furthermore, Poon et al. (2011b) proposed a real-time RFID-GA integrated warehouse operation planning framework to support frequent replenishment decisions [25]. Han et al. (2013) examined cycle-time reduction in manufacturing systems, highlighting the trade-offs between time efficiency and resource utilization. More recent studies have extended the research line by incorporating intelligent decision support systems and data-driven optimization [26]. Li et al. (2020) developed a two-period analytical framework to determine an optimal online coupon pricing strategy [27]. On the other hand, Zhou et al. (2022) investigated the impact of recommendation systems and pricing strategies on operational efficiency in digitally enabled supply chains [28]. Similarly, Yu et al. (2022) analyzed strategic mode selection under brand competition in e-commerce platforms [29].
Apart from simulation-based layout optimization and AGV scheduling problems, out-of-stock (OOS) management plays a crucial role in supply chain design and operational performance. Recent studies employ advanced statistical analysis, and machine- and deep learning-based approaches, to mitigate stockout risks. Montoya and Gonzalez (2019) propose a hidden Markov model (HMM) to identify on-shelf and out-of-stock by detecting changes in the sales patterns [30]. Andaur et al. (2021) developed Random Forest- and Ensemble classifier-based machine learning approaches to predict out-of-stock items in a retail packaged foods manufacturing company [31]. Among deep learning-based approaches, Giaconia and Chamas (2023) utilize a Deep Temporal Convolutional Neural Network System (TCN) for predicting the residual stocks in e-commerce platforms [32]. Similarly, Xu et al. (2025) proposed a Neural Network-based deep learning methodology to predict the out-of-stock risk in retail logistics [33].
2.3. Research Gap and Contribution
Table 1 demonstrates that the vast majority of studies between 2015 and 2025 rely on (meta) heuristics (e.g., ACO, GA) or simulation (e.g., DES) methodologies to handle the complexity of the logistics optimization of manufacturing systems. While these methods are effective in providing near-optimal solutions, they do not guarantee a global optimum. Furthermore, common scalarization techniques such as the Weighted Sum method are limited by their inability to present Pareto-optimal solutions in non-convex objective spaces. This study underlines this gap by proposing a multi-objective Mixed-Integer Linear Programming (MILP) model by employing ϵ-constraint and AUGMECON2 methods to optimize the logistics operation of a manufacturing environment. Unlike heuristic approaches, this research utilizes an exact method to provide a global optimum solution for conflicting goals (e.g., cost, time, layout, and sustainability).

Table 1.
Summary of the literature on logistics optimization in the manufacturing environment.
3. Methodology and Problem Formulation
3.1. Mathematical Model Formulation
The proposed MILP model is developed based on a real-world lean manufacturing logistics design case study of a multinational firm located in Türkiye (Figure 1). The mathematical model encapsulates vital operational aspects of the manufacturing logistics process, such as material flow routes and volumes, material handling equipment speeds, capacities and emissions, operational costs, and rigorous facility space allocation arrangements. These factors exemplify the strategic- and tactical-level decisions experienced by manufacturing managers in various sectors. The input data used as the parameters of the presented model were sourced from company-supplied operation records (e.g., handling times, fleet configurations, material flow routes, and space policies) and publicly available and industry-standard resources (e.g., emission factors and energy-related operational costs). In order to ensure analytical feasibility, particular components of the case study are systematically simplified. Demand and material flows are considered deterministic, while emissions and operating costs of material handling equipment are presumed to increase linearly with running time. The parameters of the proposed model are presented in Table 2, Table 3 and Table 4, Appendix A (Table A1, Table A2 and Table A3) and the Supplementary Materials sections. In the proposed mathematical model, operational parameters, e.g., demand, loading and unloading (setup) times, travel distances, spatial variables, and cost items were obtained from the manufacturer’s internal database. Emission factors, material handling equipment speeds, and material handling capacities were collected from open sources such as equipment manuals. Policy targets and managerial parameters were identified through discussions with technical and managerial teams.
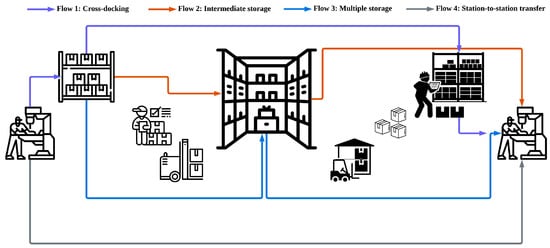
Figure 1.
Material flow routes of the intra-facility manufacturing environment.
Table 2.
Nomenclature table of indices.
Table 3.
Nomenclature table of parameters.
Table 4.
Nomenclature table of decision variables.
The multi-objective mathematical model seeks to determine optimal resource utilization with conflicting criteria, characterized by the following points:
- 1.
- Space Allocation Ratios: The continuous proportions of total facility space (TS) allocated to distinct departments (e.g., base floor, front, and workspace), adhering to mandated boundary constraints.
- 2.
- Material Handling Equipment Allocation: The integer fleet size for each equipment type, representing light, medium, and heavy machinery.
- 3.
- Material Allocation Decisions: The binary decision to assign a specific item to a location using a defined equipment type.
Objective functions
Constraints
Equation (1) represents the total life cycle cost of the inbound logistics operations in the manufacturing environment. The objective function aims to minimize operating cost and fixed cost due to the material handling equipment units. Equation (2) aims to minimize the total minutes of handling, transportation, and setup for all WIP items in the manufacturing environment. Equation (3) minimizes equipment and station-specific emissions due to the material handling equipment type. Equation (4) minimizes absolute deviations of the shares from policy targets scaled by the total available area. Equation (5) computes the time of serving one trip that includes setup, loading, unloading, and traveling times. Equation (6) ensures that each item is assigned to only one material handling equipment . Equation (7) ensures the time-dependent capacity constraints for the material handling equipment . It enforces the model to assign a feasible fleet size to fulfil the designated tasks. Equation (8) designs the space allocations of the B (Bulk Storage), F (Forward Reserve Zone) and W (Workstation Zone) areas. Equations (9)–(11) ensure the physical upper and lower bounds of B, F, and W areas. Equations (12)–(14) ensure linear representation of the absolute deviation of the space allocations between allocated and target space levels through the use of positive and negative deviation parameters. Equations (15)–(18) are the domain constraints of the mathematical model.
3.2. ϵ-Constraint Multi-Objective Modeling
Equations (19)–(22) treat cost as the primary objective while restricting the other objectives (time, energy, and space allocation) by the upper bounds. The ϵ-constraint multi-objective modeling approach generates Pareto-efficient solution fronts due to performance limits set by the decision-makers:
3.3. Augmented ϵ-Constraint (AUGMECON2) Multi-Objective Modeling
Equations (23)–(28) utilize the AUGMECON2 multi-objective modeling approach by enhancing the classical ϵ-constraint approach by using non-negative slack variables. The augmented objective penalizes slack variables with small weights to ensure strong efficiency:
4. Results and Discussion
This study employs a dual-methodological approach with standard ϵ–constraint and augmented ϵ-constraint (AUGMECON2) multi-objective mathematical modeling methods. Both methods culminate in the same set of five non-dominated Pareto-optimal solutions as listed in Table 1. This study is implemented in a 2.3 GHz 8-Core Intel Core i9 laptop. The mathematical models are solved to optimality in Python 3.12 programming language in Google Colab IDE. Pandas (v2.x), Numpy (v1.26), Matplotlib (v3.8), Seaborn (v0.13), and Pyomo (v6.7) are utilized with the HiGHS (v1.6) mixed-integer programming solver packages.
4.1. Comparative Analysis of ϵ-Constraint and AUGMECON2 Methods
The comparative analysis of ϵ-constraint and the AUGMECON2 methods presents significant insights into multi-objective optimization outcomes, as presented in Table 2 and Table 3. Both methods generate Pareto-optimal outcomes with various trade-offs between the objective functions and decision variables. As presented in Table 2, the ϵ-constraint method generates five Pareto-optimal solutions, whereas AUGMECON2 generates twelve Pareto-optimal solutions, as listed in Table 3. Furthermore, Pareto-front comparisons of the ϵ-constraint and AUGMECON2 methods are visualized in Figure 2 and Figure 3.
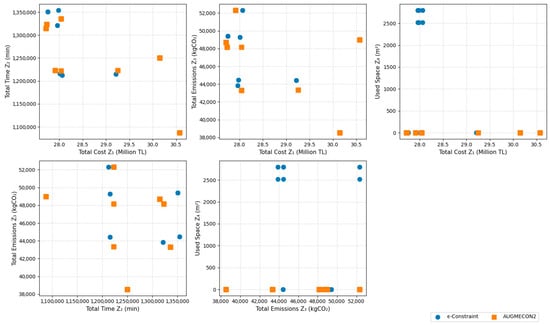
Figure 2.
Pareto-front comparison of objective functions for ϵ-constraint and AUGMECON2.
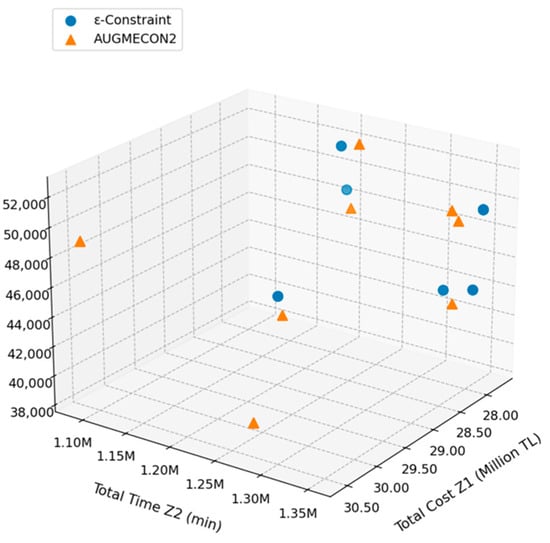
Figure 3.
Pareto frontier of three objective functions for ϵ-constraint and AUGMECON2.
Pareto-front comparisons of the objective functions in Figure 2 and Figure 3 visualize that there is a multi-layered structure of trade-offs in the case study. Across the projections in Figure 2 and Figure 3, the AUGMECON2 method produces a denser and more coherent approximation of the Pareto frontier, whereas the ϵ-constraint method shows significant discontinuities, particularly in the cost−emission and time−space comparisons. In contrast, AUGMECON2 projects a convex frontier that highlights the nonlinear association between cost, time, and environmental performance. Furthermore, Pareto-frontier figures display that most of the ϵ–constraint outcomes are dominated by the AUGMECON2 outcomes, which shows AUGMECON2’s superior search capability. AUGMECON2 produces a more concentrated and uniformly dispersed set of non-dominated solutions. This suggests that managers have more flexibility in making operational and strategic decisions that reconcile cost efficiency and sustainability simultaneously. From a managerial perspective, the distribution of AUGMECON2 solutions near low-level emission and low time zones shows that the AUGMECON2 model is particularly more effective for identifying environmentally efficient and time-responsive logistics configurations. Furthermore, Figure 2 shows that there is a wide dispersion of space utilization. This suggests that space allocation policies play a crucial role in absorbing performance trade-offs through layout configurations rather than relying on financial investments solely.
Table 5 highlights that the outcomes of the standard ϵ-constraint method illustrate monotonic trade-offs between total cost (Z1) and flow time (Z2). For instance, in the minimum time solution (S1), Z1 obtains the highest cost value of TRY 29.21 million with a fleet configuration of () 5,1,1. In contrast, the scenario with the minimum cost (S5) reduces the cost (Z1) to TRY 27.75 million but increases flow time (Z2) to approximately 1.351 million minutes. This trade-off highlights that time compression requires greater resource intensity and higher operational and investment costs. Furthermore, non-zero space deviations (Z4 = 2520 m2) lead to a more imbalanced space allocation (, e.g., 0.31, 0.56, and 0.13. Conversely, the AUGMECON2 produces significantly more continuous Pareto-frontier solutions as listed in Table 6. The augmented formulation eliminates weakly efficient solutions to ensure a more comprehensive exploration of the objective space. Table 2 shows that space slack () is 0.00 in all scenarios. Time and energy slacks ( and ) display significant variation. Large slack values (e.g., = 108,942 in scenario A7) indicate that the corresponding ϵ-constraint value is non-binding, and the objective can be relaxed without penalty. In contrast, small slack values (e.g., = 4.47 in scenario A4) display solutions operating at the limit of an environmental constraint, representing efficient and non-redundant configurations.
Table 5.
Pareto-optimal solution vectors for the standard ϵ-constraint model.
Table 6.
Pareto-optimal solution vectors for the AUGMECON2 model.
In terms of cost vs. time trade-off, the AUGMECON2 displays solutions with lower flow time minimization (Z1= TRY 27,713,901 in scenario A10) compared to the ϵ-constraint frontier. With regard to environmental performance, AUGMECON2 finds solutions with significantly lower emission minimization values (e.g., Z3 = 38,532 kgCO2 in scenario A7 and Z3 = 43,859 kgCO2 in scenario S4). In the role of spatial efficiency, the ϵ-constraint method proposes solutions with deviation (2520 m2), while the AUGMECON2 consistently obtains Z4 = 0 across the frontier. The AUGMECON2 enhances more efficient space utilization across a wide range of cost, time, and emission levels. Considering the diversity in fleet configurations, the AUGMECON2 and ϵ-constraint methods show similar patterns, as obtains the largest and the smallest in both scenario analyses.
4.2. Managerial Implications and Future Directions
The Pareto frontiers listed in Table 2 and Table 3 depict an explicit quantification of inter-objective trade-offs that provide an evidence-based framework to support decision-makers in strategic planning of the manufacturing logistics. For instance, a reduction of 11% in total flow time results in a 5.4% cost increase, while achieving a 12.3% reduction in emissions requires a 1% increase in operational and fixed costs. This provides the decision-makers with a road map for robust scenario planning and allows decision-makers to dynamically shift between time-optimized, cost-sensitive, and low-emission configurations regarding market demands, regularity constraints, and resource capabilities. At a tactical level, the repeating fleet compositions in the best-performing solutions highlight that the mix of material handling units emerges as a robust and high-performance baseline for normal operations. On the other hand, evenly distributed material handling units provide a flexible alternative for fluctuating demands and uncertain times. Similarly, the spatial allocation of 0.40, 0.35, and 0.25 displays two key implications. First, cutting the Bulk Storage Zone rate below 40% systematically worsens overall logistics performance. Second, it indicates that the Forward Reserve Zone acts as the pressure valve of the manufacturing logistics system. While the optimal distribution rate is 35%, the Pareto-optimal solutions show that this zone can expand to over 50% in high-pressure scenarios. The decision-makers should prioritize securing the 40% distribution rate of the Bulk Storage Zone and design the remaining storage areas with inherent flexibility, e.g., mobile equipment and multi-purpose stations to stretch during the peak terms.
The sensitivity analysis results presented in Figure 4 demonstrate that the proposed multi-objective model exhibits robustness under parameter uncertainty for the AUGMECON2 model. The baseline of the sensitivity analysis corresponds to nominal (0%) parameter adjustment. Figure 4 shows that variations in demand have a negligible impact on all three objective functions while demand is varied by 30%. This indicates that the Pareto-optimal solutions are stable with respect to fluctuations in the demand. This suggests that the internal manufacturing logistics configuration is flexible to tolerate demand uncertainties. In contrast, a change in the material handling equipment speed yields a significant and systematic effect on operational and environmental performance. A ±30% change in material handling equipment speed results in an approximately ±3% fluctuation in total time. Furthermore, it yields almost ±20% variation in total emission and ±0.5% variation in total cost. These results indicate that investments in faster material handling equipment can contribute to both operational productivity and sustainability in the manufacturing environment. Finally, the operating cost rate predominantly affects total cost, displaying a near-linear response, while its effect on time and emission is minimal. A ±30% variation in the operating cost rates yields approximately ±1.5% change in total cost. However, it shows an insignificant impact on time and emissions objectives. This indicates that the financial vulnerability within the system is predominantly influenced by energy and labor costs, rather than operational delays or environmental inefficiencies. Therefore, decision-makers are expected to emphasize expense management strategies in their decisions, such as energy-efficient material handling equipment and cost-effective energy contracts.
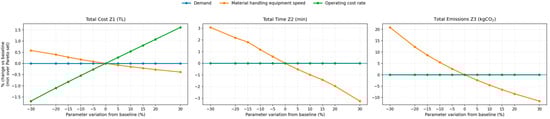
Figure 4.
Sensitivity analysis of total cost (Z1), total time (Z2), and total emissions (Z3) based on variations in demand, material handling equipment speed, and operating cost rate.
Apart from sensitivity analysis, a robustness analysis was performed utilizing various ϵ-grid resolutions. Table 7 summarizes the results of the analysis for both models across various ϵ-grid resolutions. AUGMECON2 consistently yields a greater proportion of non-dominated solutions compared to the standard ϵ-constraint model for both 3 × 3 × 3 and 5 × 5 × 5 grids. While the conventional ϵ-constraint method outperforms AUGMECON2 computationally, it is more sensitive to grid selection and often produces weakly dominated solutions. On the other hand, AUGMECON2 preserves Pareto-front stability across various grid configurations.
Table 7.
ϵ-grid resolution-based robustness comparison of AUGMECON2 and the standard ϵ-constraint methods.
This study makes a novel contribution to the manufacturing logistics optimization literature by developing an integrated MILP model that captures conflicting objectives such as cost, time, emission, and space allocation simultaneously within a manufacturing environment. Unlike the dominant methodologies in the literature, such as simulation- and heuristics-based approaches, the proposed mathematical model guarantees global optimality via conventional ϵ-constraint and AUGMECON2 methods. The empirical case study conducted at a multinational manufacturer in Türkiye demonstrates that the model remains robust under parameter uncertainty.
While the simplifying assumptions of the ϵ-constraint and AUGMECON2 models lead to a manageable and globally optimum outcome, they may impose limitations on accurately capturing operational uncertainties in the real-world manufacturing supply chain environment. Particularly, relaxing the assumptions of deterministic demand, linear emission patterns, and constant operational costs could impact the absolute values of the objective functions. Nevertheless, such relaxations are expected to shift the Pareto frontiers rather than alter their structure or the qualitative characteristics of inter-objective trade-offs. The fundamental managerial insights, such as the convex trade-off between cost and material flow time, the significance of spatial flexibility in mitigating the performance pressures, and the superior Pareto-front coverage offered by the AUGMECON2 method, are primarily impacted by capacity, space, and routing constraints of the mathematical model. The empirical basis of the robustness of the proposed model is supported by the sensitivity analysis, demonstrating that Pareto-optimal designs maintain their stability regardless of variations in demand, material handling equipment speed, and operating cost parameters. Future studies could incorporate stochastic demand, nonlinear emission functions, and time-dependent cost items, allowing further validation of the model under uncertain conditions.
This study establishes a stepping stone for several crucial research directions. Methodologically, future studies could employ hybrid approaches that integrate machine learning and deep learning methods with optimization to enable real-time decision-making in a dynamic environment. Furthermore, fuzzy and stochastic versions of AUGMECON2 could be explored by future research studies to enhance the resilience of optimal outcomes under uncertain demand and supply variability. In addition, this model can be enriched by incorporating additional objectives and decision variables such as social sustainability metrics, quality-based KPIs, and circular economy considerations. As manufacturing evolves within Industry 4.0/5.0, blockchain, IoT, and AI, the development of interactive decision support systems with advanced visualization and preference-elicitation capabilities could bridge the gap between algorithmic output and managerial implementation. The synthesis of advanced mathematical modeling methods with emerging technologies and sustainability standards reveals a transformative strategy for manufacturing logistics, incorporating efficiency, adaptability, and responsibility through mathematically robust yet pragmatically actionable insights.
Supplementary Materials
The following supporting information can be downloaded at: https://www.mdpi.com/article/10.3390/systems14020126/s1, Table S1: 3D parameters and Pareto fronts. 3D parameters and Pareto fronts for the ϵ-constraint and AUGMECON2 models are available in the Supplementary Material.
Funding
This research received no external funding.
Data Availability Statement
Data generated and used in this study are available from the corresponding author upon a reasonable request.
Acknowledgments
The author acknowledges the use of ChatGPT 5.2 to avoid grammatical issues.
Conflicts of Interest
The author declares no conflicts of interest.
Appendix A
Table A1.
Indices.
Table A1.
Indices.
| Sets | Value Range |
|---|---|
| [1,19] | |
| [1,4] | |
| [1,3] |
Table A2.
Scalar parameters.
Table A2.
Scalar parameters.
| Parameter | Value |
|---|---|
| 1000 (m2) | |
| 1500 (m2) | |
| 800 (m2) | |
| 6000 (m2) | |
| 3000 (m2) | |
| 3500 (m2) | |
| 2500 (m2) | |
| 0.4 | |
| 0.35 | |
| 0.25 | |
| 0.03, 0.045, 0.05 (kgCO2/min) | |
| 150,000, 350,000, 400,000 (min) | |
| 629.49, 41,794.22, 83,588.44 (₺) |
Table A3.
2D parameters.
Table A3.
2D parameters.
| (m/min) | 1 | 2 | 3 | 4 |
| 1 | 15 | 12 | 11 | 15 |
| 2 | 220 | 200 | 180 | 220 |
| 3 | 250 | 230 | 220 | 250 |
| (₺/min) | 1 | 2 | 3 | 4 |
| 1 | 0.83 | 1.03 | 1.03 | 0.83 |
| 2 | 1.08 | 1.29 | 1.29 | 1.08 |
| 3 | 1.34 | 1.55 | 1.55 | 1.34 |
| (₺/trip) | 1 | 2 | 3 | 4 |
| 1 | 257.99 | 263.92 | 297.98 | 268.31 |
| 2 | 144.99 | 151.18 | 150.87 | 150.15 |
| 3 | 154.79 | 158.92 | 158.66 | 158.15 |
| 4 | 264.18 | 213.1 | 263.66 | 317.84 |
| 5 | 423.82 | 428.78 | 439.61 | 427.8 |
| 6 | 493.17 | 470.57 | 471.6 | 500.5 |
| 7 | 158.82 | 157.37 | 160.99 | 161.55 |
| 8 | 493.17 | 470.57 | 471.6 | 500.5 |
| 9 | 493.17 | 470.57 | 471.6 | 500.5 |
| 10 | 423.82 | 428.78 | 439.61 | 427.75 |
| 11 | 144.99 | 151.18 | 150.87 | 150.15 |
| 12 | 493.17 | 470.57 | 471.6 | 500.5 |
| 13 | 154.79 | 158.92 | 158.66 | 158.15 |
| 14 | 264.18 | 213.1 | 263.66 | 317.84 |
| 15 | 158.82 | 157.37 | 160.99 | 161.5 |
| 16 | 144.99 | 151.18 | 150.87 | 150.15 |
| 17 | 493.17 | 470.57 | 471.6 | 500.5 |
| 18 | 423.82 | 428.78 | 439.61 | 427.75 |
| 19 | 158.82 | 157.37 | 160.99 | 161.5 |
References
- World Bank. Manufacturing, Value Added (% of GDP). Available online: https://data.worldbank.org/indicator/NV.IND.MANF.ZS (accessed on 10 December 2025).
- United Nations. SDG Indicators. Available online: https://unstats.un.org/sdgs/report/2023/Goal-09/ (accessed on 10 December 2025).
- Coyle, J.J.; Langley, C.J.; Novack, R.A.; Gibson, B.J. Supply Chain Management: A Logistics Perspective, 10th ed.; Cengage Learning: Boston, MA, USA, 2017. [Google Scholar]
- Chopra, S. Supply Chain Management: Strategy, Planning, and Operation, 7th ed.; Pearson: New York, NY, USA, 2016. [Google Scholar]
- United States Environmental Protection Agency. Sources of Greenhouse Gas Emissions. Available online: https://www.epa.gov/ghgemissions/sources-greenhouse-gas-emissions (accessed on 10 December 2025).
- Marler, R.T.; Arora, J.S. Survey of multi-objective optimization methods for engineering. Struct. Multidiscip. Optim. 2004, 26, 369–395. [Google Scholar] [CrossRef]
- Deloitte. 2023 Manufacturing Industry Outlook. Available online: https://www.deloitte.com/global/en/Industries/industrial-construction/analysis/gx-manufacturing-industry-outlook.html (accessed on 10 December 2025).
- Haimes, Y. On a Bicriterion Formulation of the Problems of Integrated System Identification and System Optimization. IEEE Trans. Syst. Man Cybern. 1971, SMC-1, 296–297. [Google Scholar]
- Mavrotas, G. Effective implementation of the ε-constraint method in Multi-Objective Mathematical Programming problems. Appl. Math. Comput. 2009, 213, 455–465. [Google Scholar] [CrossRef]
- Mavrotas, G.; Florios, K. An improved version of the augmented ε-constraint method (AUGMECON2) for finding the exact pareto set in multi-objective integer programming problems. Appl. Math. Comput. 2013, 219, 9652–9669. [Google Scholar] [CrossRef]
- Tompkins, J.A.; White, J.A.; Bozer, Y.A.; Tanchoco, J.M.A. Facilities Planning, 4th ed.; John Wiley & Sons: Hoboken, NJ, USA, 2010. [Google Scholar]
- World Economic Forum. Net-Zero Industry Tracker 2024. Available online: https://www.weforum.org/publications/net-zero-industry-tracker-2024/ (accessed on 10 December 2025).
- Zhang, Y.; Zhang, G.; Du, W.; Wang, J.; Ali, E.; Sun, S. An optimization method for shopfloor material handling based on real-time and multi-source manufacturing data. Int. J. Prod. Econ. 2015, 165, 282–292. [Google Scholar]
- Centobelli, P.; Cerchione, R.; Murino, T. Layout and Material Flow Optimization in Digital Factory. Int. J. Simul. Model. 2016, 15, 223–235. [Google Scholar] [CrossRef]
- Drastich, A. Optimization of Material Flow by Simulation Methods. Acta Logist. 2017, 4, 23–26. [Google Scholar] [CrossRef]
- Mårdberg, P.; Fredby, J.; Engström, K.; Li, Y.; Bohlin, R.; Berglund, J.; Carlson, J.S.; Vallhagen, J. A novel tool for optimization and verification of layout and human logistics in digital factories. Procedia CIRP 2018, 72, 545–550. [Google Scholar] [CrossRef]
- Zuniga, E.R.; Moris, M.U.; Syberfeldt, A.; Fathi, M.; Rubio-Romero, J.C. A Simulation-Based Optimization Methodology for Facility Layout Design in Manufacturing. IEEE Access 2020, 8, 163818–163828. [Google Scholar] [CrossRef]
- Wang, F.; Zhang, Y.; Su, Z. A novel scheduling method for automated guided vehicles in workshop environments. Int. J. Adv. Robot. Syst. 2019, 16. [Google Scholar] [CrossRef]
- Bányai, T. Optimization of Material Supply in Smart Manufacturing Environment: A Metaheuristic Approach for Matrix Production. Machines 2021, 9, 220. [Google Scholar] [CrossRef]
- Wang, Y.J.; Liu, X.Q.; Leng, J.Y.; Wang, J.J.; Meng, Q.N.; Zhou, M.J. Study on scheduling and path planning problems of multi-AGVs based on a heuristic algorithm in intelligent manufacturing workshop. Adv. Prod. Eng. Manag. 2022, 17, 505–513. [Google Scholar] [CrossRef]
- Wu, C.; Xiao, Y.; Zhu, X. Research on Optimization Algorithm of AGV Scheduling for Intelligent Manufacturing Company: Taking the Machining Shop as an Example. Processes 2023, 11, 2606. [Google Scholar] [CrossRef]
- Cheng, W.; Meng, W. Collaborative algorithm of workpiece scheduling and AGV operation in flexible workshop. Robot. Intell. Autom. 2024, 44, 34–47. [Google Scholar] [CrossRef]
- Zhu, Y.; Song, Q.; Li, M. Multi-AGV multitask collaborative scheduling based on an improved ant colony algorithm. Int. J. Adv. Robot. Syst. 2025, 22. [Google Scholar] [CrossRef]
- Poon, T.C.; Choy, K.L.; Lau, H.C.W. An efficient production material demand order management system for a mould manufacturing company. Prod. Plan. Control 2011, 22, 754–766. [Google Scholar]
- Poon, T.C.; Choy, K.L.; Chan, F.T.S.; Ho, G.T.S.; Gunasekaran, A.; Lau, H.C.W.; Chow, H.K.H. A real-time warehouse operations planning system for small batch replenishment problems in production environment. Expert Syst. Appl. 2011, 38, 8524–8537. [Google Scholar] [CrossRef]
- Han, K.H.; Lee, G.; Choi, S.H. Manufacturing cycle time reduction for batch production in a shared worker environment. Int. J. Prod. Res. 2013, 51, 1–8. [Google Scholar] [CrossRef]
- Li, C.; Chu, M.; Zhou, C.; Zhao, L. Two-period discount pricing strategies for an e-commerce platform with strategic consumers. Comput. Ind. Eng. 2020, 147, 106640. [Google Scholar] [CrossRef]
- Zhou, C.; Leng, M.; Liu, Z.; Cui, X.; Yu, J. The impact of recommender systems and pricing strategies on brand competition and consumer search. Electron. Commer. Res. Appl. 2022, 53, 101144. [Google Scholar] [CrossRef]
- Yu, J.; Zhao, J.; Zhou, C.; Ren, Y. Strategic business mode choices for e-commerce platforms under brand competition. J. Theor. Appl. Electron. Commer. Res. 2022, 17, 1769–1790. [Google Scholar] [CrossRef]
- Montoya, R.; Gonzalez, C. A hidden Markov model to detect on-shelf out-of-stocks using point-of-sale data. Manuf. Serv. Oper. Manag. 2019, 21, 932–948. [Google Scholar] [CrossRef]
- Andaur, J.M.R.; Ruz, G.A.; Goycoolea, M. Predicting out-of-stock using machine learning: An application in a retail packaged foods manufacturing company. Electronics 2021, 10, 2787. [Google Scholar] [CrossRef]
- Giaconia, C.; Chamas, A. Innovative out-of-stock prediction system based on data history knowledge deep learning processing. Computation 2023, 11, 62. [Google Scholar] [CrossRef]
- Xu, L. Predicting out-of-stock risk under delivery schedules using neural networks. Electronics 2025, 14, 3012. [Google Scholar] [CrossRef]
Disclaimer/Publisher’s Note: The statements, opinions and data contained in all publications are solely those of the individual author(s) and contributor(s) and not of MDPI and/or the editor(s). MDPI and/or the editor(s) disclaim responsibility for any injury to people or property resulting from any ideas, methods, instructions or products referred to in the content. |
© 2026 by the author. Licensee MDPI, Basel, Switzerland. This article is an open access article distributed under the terms and conditions of the Creative Commons Attribution (CC BY) license.