Abstract
Mixed traffic flow composed of connected and automated vehicles (CAVs) and human-driven vehicles (HDVs) represents a core characteristic of intelligent transportation systems. However, its operational efficiency is significantly constrained by lane management strategies and CAV cooperative driving behaviors. To investigate this, a cellular automata-based simulation model is developed that integrates multiple car-following rules, a lane-changing strategy, and a platoon coordination mechanism. Through a systematic comparison of 13 lane management strategies in one-way two-lane and three-lane configurations, this study analyzes the influence mechanisms of lane allocation and cooperative driving on traffic flow, considering fundamental diagram characteristics, operating speed, CAV degradation behavior, and maximum platoon size. The results indicate that the performance of different strategies exhibits phased evolution with increasing CAV penetration rates. At low penetration rates, providing relatively independent space for HDVs effectively suppresses random disturbances and improves throughput. At medium to high penetration rates, dedicated CAV lanes—especially those with spatial continuity—enable cooperative platoons to fully leverage their advantages, leading to significant improvements in traffic capacity and operational stability. These findings demonstrate an optimal alignment between cooperative driving mechanisms and lane configurations, offering theoretical support for highway lane management in mixed traffic environments.
1. Introduction
With the rapid advancement of communication and autonomous driving technologies, connected and automated vehicles (CAVs) are being increasingly integrated into existing transportation systems [1,2]. This trend is driving a crucial transition in road traffic flow: from the traditional, human-driven dominant mode to a mixed traffic flow composed of CAVs and human-driven vehicles (HDVs). Benefiting from their high-precision environmental perception and V2V/V2X communication capabilities [3,4], the introduction of CAVs profoundly restructures the microscopic interaction mechanisms within traffic flow. Consequently, this has a significant impact on macroscopic traffic efficiency, stability, and safety [5,6,7]. In the foreseeable future, mixed traffic flow is expected to dominate intelligent transportation systems. Therefore, a core scientific challenge in transportation research is to investigate the characteristics of mixed traffic flows and their evolution under varying CAV penetration rates and lane management strategies. Addressing this challenge requires urgent breakthroughs in the field.
Within the management framework for mixed traffic flow, lane management strategies are a key means to mitigate conflicts among heterogeneous vehicle types and optimize system performance. Existing simulation studies using cellular automata have confirmed that rational lane allocation can effectively improve traffic flow characteristics [8,9,10,11,12,13]. Current research has primarily focused on the feasibility of dedicated CAV lanes and their impact on traffic flow [14,15,16]. Studies indicate that, at high penetration rates, physically segregated dedicated lanes can effectively suppress interference from HDV stochastic behavior in CAV cooperative driving. This, in turn, enhances road capacity and alleviates congestion [17]. However, significant limitations persist in existing studies. Firstly, they are often confined to single-road scenarios—such as two-lane configurations—or to limited strategy comparisons that merely examine the presence or absence of dedicated lanes. Consequently, there is a lack of systematic quantitative evaluation across diverse lane management strategies, such as a comprehensive analysis of 13 distinct strategies in both two-lane and three-lane scenarios [18,19,20]. Secondly, existing models often overlook the cooperative behavior of CAV platoons. While a limited number of studies do incorporate this factor, they tend to treat it in an oversimplified manner. As a result, they fail to adequately reveal the nonlinear coupling mechanism between maximum platoon size and lane strategies [21,22].
To address the aforementioned challenges, this study develops a mixed traffic flow model based on cellular automata, integrating multiple car-following rules, lane-changing strategies, and a platoon coordination mechanism. This study systematically compares 13 lane management strategies in both one-way two-lane and three-lane scenarios. Based on this comparison, it analyzes in depth the mechanisms underlying the influence of CAV penetration rate and platoon size on traffic capacity, average speed distribution, speed variance, and CAV degradation rate. The main contributions are as follows:
- (1)
- A cellular automata model is proposed that integrates multiple car-following rules, lane-changing strategies, and CAV platoon cooperation, enabling a more accurate depiction of the spatiotemporal interaction behaviors of heterogeneous vehicles.
- (2)
- A systematic evaluation conducted of 13 strategies within both two-lane and three-lane frameworks, elucidating the dynamic influence patterns of CAV penetration rate and platoon length on traffic performance.
- (3)
- The intrinsic relationship between lane strategies and microscopic platoon dynamics is revealed, finding that reasonably setting dedicated lanes under medium-to-high densities can not only generate a significant positive speed difference effect but also effectively reduce the CAV degradation rate, thereby enhancing traffic flow stability.
The remainder of the paper is organized as follows. Section 1 is the introduction. Section 2 systematically reviews the literature on mixed traffic flow modeling and dedicated lane strategies. Section 3 details the rule design of the proposed cellular automata model. Section 4 presents the simulation experiment design and result analysis. Section 5 summarizes the main conclusions.
2. Literature Review
The deep integration of autonomous driving and vehicular networking technologies is driving transportation systems towards greater intelligence and coordination through CAVs. Research indicates that CAVs, by eliminating human driving errors, reducing reaction times, and enabling high-precision control, significantly enhance road safety and operational efficiency [23,24]. Their cooperative mechanisms, which are based on Cooperative Adaptive Cruise Control (CACC) and Vehicle-to-Vehicle (V2V) communication, optimize microscopic car-following behavior and enhance longitudinal stability. Additionally, these mechanisms effectively smooth traffic flow and increase road capacity [25,26,27]. Notably, the cooperative benefits of CAVs are highly dependent on the penetration rate. At high penetration rates, their role in improving traffic flow stability and road capacity is prominent. In contrast, during low-penetration phases, the cooperative effect remains relatively limited [5,28]. This characteristic establishes a new research paradigm for the theoretical modeling and engineering optimization of complex traffic flows [24].
In the field of lane management strategy research, existing work primarily focuses on macro-level benefit assessment and the optimization of dedicated CAV lane configurations. The optimization model for the number of dedicated CAV lanes proposed by Ghiasi [29] demonstrates that establishing dedicated lanes within reasonable penetration rates can significantly enhance highway capacity. Through cellular automata simulations of three-lane roads, Ye and Yamamoto [18] found that blindly installing dedicated lanes under low CAV penetration rates may result in wasted lane resources or even induce new forms of congestion. From the perspective of driving behavior modeling, Talebpour and Mahmassani [1] note that CAV distribution characteristics and the non-divisibility of lane resources are core constraints that affect traffic efficiency. From a traffic safety perspective, Razmi Rad [30] confirms that rational lane allocation can effectively reduce interaction interference between CAVs and HDVs, thereby improving platoon stability. Jiang [31] further proposes that establishing dedicated HDV lanes during low-penetration phases can avoid efficiency losses caused by HDVs being suppressed by CAVs. Although Hua et al. [21] explored the synergistic effects of mixed dedicated-lane strategies on operational efficiency and safety, existing research still has significant limitations in several key areas. First, there is a lack of systematic quantitative comparison of 13 distinct lane strategies across multiple scenarios, including both two-lane and three-lane configurations [18,19,20]. Second, the characterization of CAV platoon cooperative behavior is often oversimplified, failing to deeply reveal the nonlinear coupling mechanism between the maximum platoon size and lane strategies [21,22].
Platoon cooperation represents the most distinctive form of cooperative control in CAVs. Through V2V communication, it enables longitudinal coordination among multiple vehicles, maintaining close spacing and consistent speeds. As a result, it enhances both traffic flow stability and efficiency [32,33]. Real-vehicle test data indicate that CACC platoons can maintain string stability with shorter safe headways. This capability effectively suppresses the amplification of speed disturbances during longitudinal propagation. Consequently, their performance is significantly superior to that of traditional Adaptive Cruise Control (ACC) systems [33,34]. Related studies further confirm that high-density CAV platoons can significantly increase lane capacity, reduce fuel consumption, and smooth traffic flow while reducing shockwave propagation in highway or dedicated-lane environments [22,31,32,35]. However, the existing literature predominantly focuses on idealized single-lane scenarios. Consequently, it lacks an in-depth investigation into the systematic comparison of different lane strategies under mixed traffic flow. Furthermore, the impact mechanism of platoon length limits on macroscopic flow characteristics remains underexplored.
Based on the aforementioned research gaps, this paper aims to construct a cellular automata model integrating multiple car-following rules, lane-changing strategies, and a CAV platoon cooperation mechanism. This study will systematically compare 13 lane management strategies in both one-way two-lane and three-lane scenarios. It will further conduct an in-depth analysis of the coupled effects of maximum platoon size on traffic capacity, average speed distribution, and CAV degradation rate. This work seeks to address the current research void in multi-scenario cooperative optimization and the linkage between microscopic and macroscopic mechanisms.
3. Methodology
3.1. Car Following Mode
When CAVs coexist with traditional HDVs in the same road system, car-following behaviors vary significantly due to differences in automation and connectivity levels. To accurately model the microscopic interaction mechanisms among heterogeneous vehicles in mixed traffic, this paper classifies car-following modes into three categories based on the controlling entity, information acquisition method, and cooperative capability of the following vehicle: HDV mode, Autonomous Vehicle (AV) mode, and CAV mode. These three modes differ fundamentally in their reaction mechanisms, control logic, and levels of cooperation, as illustrated in Figure 1.
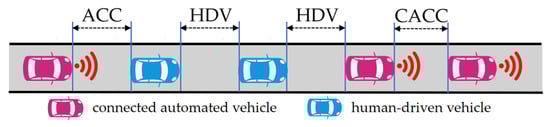
Figure 1.
Car-following modes in mixed traffic flow.
3.1.1. HDV Mode
In the HDV car-following mode, the following vehicle is driven by a human. This mode can be divided into two scenarios based on the type of the preceding vehicle: a CAV or another HDV. In both scenarios, the car-following behavior of an HDV relies on the driver’s visual perception and subjective judgment of the preceding vehicle’s motion. Due to physiological and psychological delays in human perception, cognition, and action, the vehicle’s response to changes in the preceding vehicle’s state has a noticeable reaction time. Furthermore, driving behavior is influenced by factors such as attention level and driving habits, which can lead to unnecessary random deceleration.
3.1.2. AV Mode
In the AV car-following mode, the following vehicle is a CAV, while the preceding vehicle is an HDV. The CAV uses onboard sensors (e.g., radar, cameras) to obtain real-time information about the preceding vehicle’s position, speed, and acceleration. Its control system then makes autonomous decisions based on preset car-following algorithms. Compared to HDVs, the AV system has faster response capabilities, with a significantly reduced reaction time. Its control process is fully deterministic and does not introduce random behavior.
3.1.3. CAV Mode
In this mode, both the follower and the leader are CAVs. Vehicles can achieve real-time synchronization and sharing of driving information via Vehicle-to-Vehicle (V2V) communication. The follower can not only perceive the leader’s real-time state but also obtain its intended driving behavior for the next time step. This allows the vehicles to form a coordinated “platoon.” Within a platoon, vehicles can maintain synchronized driving behavior with a very small, constant spacing . The reaction time in this mode is considered negligible (approximately zero).
To distinguish the car-following mode of vehicle , we define three binary variables , as shown in Equations (1)–(4). Here, indicates vehicle is in HDV mode, indicates AV mode, and indicates CAV mode. Only one mode is active for a vehicle at any given time.
3.2. Safety Distance Model
To ensure vehicles maintain a safe following distance and avoid collisions, the model defines specific safety distance calculations for each car-following mode. The concept of safety distance originates from the classical Gipps model. It refers to the minimum distance required for the following vehicle to avoid a collision when the leader brakes suddenly, as illustrated in Figure 2.
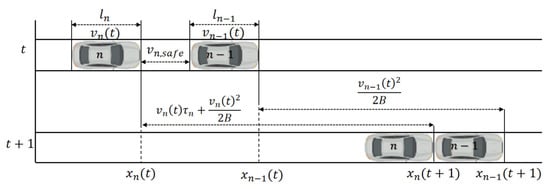
Figure 2.
The illustration of safe distance.
The calculation of safety distance depends on the vehicle’s reaction time and speed difference. For HDV and AV modes, the safety distance is calculated using Equation (5). This formula considers the vehicle’s own speed , the leader’s speed , the reaction time ( or ), and the maximum deceleration . When the follower’s speed is less than the leader’s, , the required safety distance is less than . When speeds are equal, this term is zero, and the safety distance equals . When the follower’s speed is greater, , a larger safety distance is required. This method dynamically adjusts spacing based on relative speed while ensuring safety. It helps improve road capacity and average speed.
For CAV mode, vehicles can achieve real-time information synchronization and cooperative braking via V2V communication. Thus, the required safe spacing is significantly reduced. For simplicity, this study sets the safety distance in CAV mode to a constant value . This represents the desired spacing vehicles must maintain within a platoon. It can also be viewed as the minimum distance required for CAVs to form a “platoon.”
Integrating the three modes, the safety distance for vehicle at time is given by Equation (5).
where is the safety distance for vehicle at time . and are the speeds of vehicle and the leader at time , respectively. and are the reaction times for HDVs and AVs (s), respectively. is the maximum deceleration of the vehicle . is the desired spacing within a CAV platoon .
3.3. Car-Following Model Based on the Cellular Automata Model
The Cellular Automaton model simulates complex traffic flow dynamics using simple local rules: acceleration, deceleration, randomization, and position update. This subsection constructs car-following rules tailored to the characteristics of the three defined modes.
3.3.1. Acceleration
The acceleration rule describes how a vehicle increases its speed when the spacing is sufficient, aiming for a higher speed or faster travel.
- (1)
- HDV Mode and AV Mode
In HDV and AV modes, vehicles cannot know the leader’s speed at the next time step in advance. When the net spacing between vehicle and its leader is greater than the safety distance , the vehicle will attempt to accelerate. The acceleration process must satisfy three constraints: (a) vehicle dynamics constraint—speed increase is limited by the maximum acceleration ; (b) road regulation constraint—speed must not exceed the maximum speed limit ; (c) safety constraint—the vehicle’s position at the next time step cannot surpass the leader’s current position. This is equivalent to requiring the next speed to satisfy . Therefore, the speed update is the minimum of these three values, as shown in Equation (6).
where is the net spacing between vehicle n and its leader at time . and are the positions of vehicle and the leader at time , respectively. is the length of the leader vehicle. is the simulation time step . is the maximum acceleration of the vehicle .
- (2)
- CAV Mode
In CAV mode, vehicles can know the leader’s speed at the next time step, , in advance via V2V communication. When the net spacing is greater than the platoon’s desired spacing , the CAV adjusts its speed to form a stable platoon with the leader as soon as possible. The goal is to reduce the spacing to by the next time step, satisfying . Combining kinematic equations, the required speed can be derived as . This speed is also subject to the vehicle’s acceleration capability and the speed limit. Therefore, the acceleration rule for CAV mode is given by Equation (7).
3.3.2. Deceleration
The deceleration rule describes how a vehicle reduces its speed to ensure safety when the spacing is insufficient.
- (1)
- HDV Mode and AV Mode
When the net spacing is less than or equal to the safety distance , the vehicle must decelerate for safety. Its speed at the next time step should not exceed its current speed . It must also satisfy the safety constraint . Thus, the deceleration rule is given by Equation (8).
- (2)
- CAV Mode
In CAV mode, the acceleration rule (Equation (7)) is designed to make the spacing approach . Therefore, under normal conditions, does not occur. When , the vehicle is in a stable platoon state. Its speed should be fully synchronized with the leader to achieve coordinated platoon driving. Therefore, the deceleration (actually synchronization) rule for CAV mode is given by Equation (9).
3.3.3. Randomization
The randomization rule simulates unnecessary deceleration caused by human driver distractions, driving habit variations, or other uncertain factors. This is a key mechanism for spontaneous congestion and “stop-and-go” waves in traffic flow.
The randomization process applies only to HDV mode. A binary variable indicates whether vehicle performs a random deceleration at time means it does). Considering the continuity of human driver reaction, we assume a vehicle’s random deceleration state remains constant within one reaction time period . At the beginning of each reaction time period (i.e., when ), the value of is redetermined based on a predefined random deceleration probability . At other times, retains its value from the previous time step. This rule is described by Equation (10).
where is a random number uniformly distributed in [0, 1]. is the random deceleration probability for HDVs.
If , an additional deceleration of magnitude is applied to the speed already calculated by the acceleration/deceleration rules for HDV mode vehicles, as shown in Equation (11). Where is the random deceleration rate . The final speed must be non-negative.
3.3.4. Position Update
In all modes, after determining the speed for the next time step , the vehicle’s position is updated assuming uniform motion, as shown in Equation (12).
where is the position of vehicle at the next time step .
3.4. Lane-Changing Model
The lateral lane-changing model describes how vehicles select lanes based on traffic conditions, efficiency needs, and safety constraints. The model comprehensively considers lane-changing incentives and safety constraints, with distinct decision logic for different driving modes.
In HDV mode, drivers change lanes primarily based on “improving travel efficiency” and “avoiding risk.” If the following three conditions are met simultaneously, a lane change is executed with probability .
Efficiency Incentive 1: The net spacing to the leader in the current lane is insufficient for the vehicle to accelerate to its desired speed. The desired speed is the smaller of the speed achievable with maximum acceleration and the road’s maximum speed limit .
where is the maximum acceleration of the vehicle , and is the road’s maximum speed limit .
Efficiency Incentive 2: The net spacing to the leader in the target lane, is greater than the net spacing in the current lane . This indicates more space in the target lane.
Safety Constraint: The lane change must not force the following vehicle in the target lane to brake abruptly. This requires that the distance to the following vehicle in the target lane, minus the vehicle length , is greater than a safety distance based on speed difference and a safety margin .
where is the speed of the following vehicle in the target lane at time . is the lane-changing safety margin . is the vehicle length .
In AV mode, lane-changing motivations include efficiency improvement and platoon formation, with the decision process more strictly considering the dynamic information of surrounding vehicles. Equations (16) and (17) represent the lane-changing incentive conditions under efficiency motivation, Equation (18) is the safety constraint condition, and Equation (19) is the incentive condition under platoon-formation motivation.
In CAV mode, leveraging V2V/V2I information enables anticipatory lane-changing to minimize unnecessary lateral interference. If the time headway between the subject vehicle and its leader satisfies the platoon stability condition , the vehicle maintains its current lane. If this condition is not met, the vehicle will execute a synchronized lane change with its leader: . This mechanism helps limit isolated lane-changing behavior, enhancing the overall stability of the traffic flow.
3.5. Platoon Formation
The platoon formation mechanism describes the process of dynamic grouping among CAVs, serving as the core foundation for CAVs to exert their cooperative effects. This mechanism enables dynamic expansion and maintenance of platoons by identifying adjacent CAVs that can stably maintain cooperative spacing and merging them into the same platoon when constraints are met. The formation of a CAV platoon requires satisfying the following four conditions:
- (1)
- The current vehicle is CAV.
- (2)
- The net spacing to the preceding vehicle satisfies .
- (3)
- The preceding vehicle is also CAV.
- (4)
- The merged platoon size does not exceed the maximum size .
Within each simulation time step, the model determines the platoon affiliation of vehicle via a dynamic update function. If a vehicle satisfies the above conditions, its platoon leader ID inherits the preceding vehicle’s leader ID, enabling platoon continuation and expansion. If any condition is not met, the vehicle is considered a new platoon leader and forms an independent platoon. Based on this, the platoon size is updated in real time by counting all CAVs with the same leader ID. This mechanism enables real-time identification, splitting, and reconstruction of platoons, providing fundamental support for the analysis of CAV cooperative behavior and traffic flow stability.
4. Analysis of Different Lane Management Strategies
To systematically evaluate the impact of dedicated lane configurations on mixed traffic flow, this study categorizes highway lanes into three types: CAV-dedicated lanes (C), HDV-dedicated lanes (H), and general-purpose lanes (G). This classification supports a structured analysis of their operational characteristics. General-purpose lanes permit mixed operation of CAVs and HDVs, while dedicated lanes restrict usage to their designated vehicle type. Based on common highway lane configurations, this study develops 13 lane management strategies for both one-way two-lane and one-way three-lane environments. Their specific layouts are illustrated in Figure 3a–m.
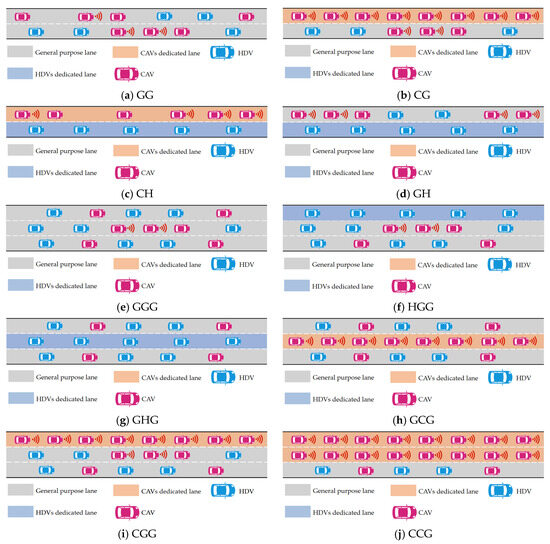
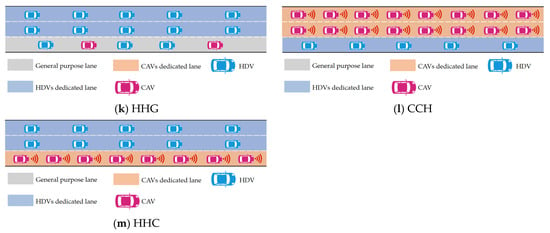
Figure 3.
Different lane management strategies.
In the context of a one-way two-lane highway, four typical lane configuration strategies are designed: GG strategy (Figure 3a): Both lanes are general-purpose lanes. CAVs and HDVs operate in a mixed manner, with free lane-changing permitted, resulting in a fully mixed traffic flow. CG strategy (Figure 3b): The left lane is a CAV-dedicated lane, and the right lane is a general-purpose lane. CH strategy (Figure 3c): The left lane is a CAV-dedicated lane, and the right lane is an HDV-dedicated lane. Vehicles travel in separate lanes by type, minimizing interference. GH strategy (Figure 3d): The left lane is a general-purpose lane, and the right lane is an HDV-dedicated lane.
In a one-way, three-lane highway environment, nine feasible lane configuration strategies are designed: the GGG strategy (Figure 3e), in which all three lanes are general-purpose lanes, allowing free lane-changing and forming a completely mixed traffic flow. HGG strategy (Figure 3f): The leftmost lane is an HDV-dedicated lane, and the remaining two lanes are general-purpose lanes. CAVs are restricted to the two right lanes. GHG strategy (Figure 3g): The middle lane is an HDV-dedicated lane, flanked by general-purpose lanes on both sides. CAVs can only use the two outer general-purpose lanes. GCG strategy (Figure 3h): The middle lane is a CAV-dedicated lane, flanked by general-purpose lanes on both sides. CGG strategy (Figure 3i): The leftmost lane is a CAV-dedicated lane, and the remaining two lanes are general-purpose lanes. HDVs can only use the two right general-purpose lanes. CCG strategy (Figure 3j): The left two lanes are CAV-dedicated lanes, and the rightmost lane is a general-purpose lane. HDVs are restricted to the rightmost general-purpose lane. HHG strategy (Figure 3k): The left two lanes are HDV-dedicated lanes, and the rightmost lane is a general-purpose lane. CAVs are restricted to the rightmost general-purpose lane. CCH strategy (Figure 3l): Two CAV-dedicated lanes flank a single HDV-dedicated lane, enforcing strict separation of CAVs and HDVs. HHC strategy (Figure 3m): Two HDV-dedicated lanes flank a single CAV-dedicated lane, also enforcing separated travel by vehicle type.
To ensure that the research conclusions offer clear practical guidance and engineering feasibility, this paper selects and excludes certain lane layout types when comparing lane management strategies. First, dedicated lanes solely for connected and automated vehicles (CAV-only, CCC) or for human-driven vehicles (HDV-only, HHH) correspond to traffic environments dominated by a single vehicle type. These scenarios deviate from the mixed traffic flow context studied here and therefore fall outside the scope of this paper.
Second, for layout forms where dedicated lanes of the same type are separated by general-purpose lanes (e.g., CGC, HGH), these configurations significantly increase lateral weaving and lane-changing demands between lanes. This raises operational complexity and compromises traffic safety. These layouts are inconsistent with the principles of continuity and recognizability typically followed in current highway lane function allocation. Consequently, they lack engineering feasibility.
Moreover, mixed layouts with different types of dedicated lanes (e.g., CGH and CHG) impose excessive physical separation between traffic streams. This restricts the dynamic adjustment capacity of vehicles across lanes. It also reduces the system’s adaptability and operational robustness under changing traffic conditions. Such layouts are not conducive to achieving overall operational efficiency in mixed traffic environments.
It is worth noting that existing research outcomes and related engineering pilots on dedicated lane settings generally adopt continuous or adjacent arrangements rather than discrete layouts. These further limit the practical applicability of the aforementioned strategies in real-world contexts. Based on these considerations, this paper focuses on continuous lane management strategies that have clear engineering implementation significance and are more likely to be deployed in actual highway scenarios. This ensures that the research conclusions provide more targeted references for future lane planning and management in mixed-traffic environments.
5. Simulation Analysis
5.1. Simulation Settings
To systematically evaluate the macroscopic characteristics of mixed traffic flow under different lane management strategies, this paper conducts numerical simulations using the cellular automaton model developed in Section 4. The simulation adopts periodic boundary conditions, meaning that vehicles exiting the end of a road segment of length re-enter from the starting point. This setup simulates the steady-state operation of an infinitely long traffic stream on a finite-length road.
The model parameters and their values used in the numerical simulation are listed in Table 1, primarily following the settings of Jiang and Wang [31,36]. The road length is set to , divided into 1500 cells, with each cell being 1 m long. The total simulation duration is 1500-time steps, with a time step of . The first 500 steps serve as a warm-up phase to eliminate transient effects from the initial distribution. The subsequent 1000 steps are used to collect steady-state traffic flow data. In the initial state, vehicle positions are uniformly distributed, and their speeds are randomly generated within the permitted range. The vehicle length is , and the road’s maximum speed limit is . The vehicle’s maximum acceleration is , and its maximum deceleration is . The random deceleration probability for HDVs is , with a random deceleration magnitude of . The reaction times for HDV, AV, and CAV modes are set to and , respectively. The CAV mode is considered to have an instantaneous response () due to cooperative communication. The desired intra-platoon spacing for CAVs is . In lane-changing decisions, the lane-changing probability for HDVs is , the lane-changing safety margin is .

Table 1.
Parameters for the simulation.
The traffic state is jointly controlled by the global density and the CAV penetration rate . The density ranges from 0 to 150 veh/km, increasing in increments of 7.5 veh/km, resulting in 21 density levels. The CAV penetration rate takes values of 0%, 20%, 40%, 60%, 80%, and 100%. This covers the full transition from pure MV traffic to pure CAV traffic. To mitigate the effects of randomness, each simulation scenario was run 20 times independently. In each run, a different random number seed was used to initialize vehicle distributions and random deceleration events. The final outputs, including flow rate, average speed, and CAV degradation rate, were obtained by averaging the results from these 20 runs. This approach ensures the robustness and reliability of the statistical outcomes.
5.2. Fundamental Diagram Under Different Lane Management Strategies
Figure 4a–d and Figure 5a–i present the flow–density (k–q) relationships for the mixed traffic flow under the 13 lane management strategies, corresponding to one-way two-lane and three-lane highway scenarios, respectively. These strategies can be categorized into four groups based on the number of dedicated lanes: none, one, two, or three. The following analysis examines differences in the shapes of the fundamental diagrams under different strategies and their underlying mechanisms, focusing on changes in the CAV penetration rate.
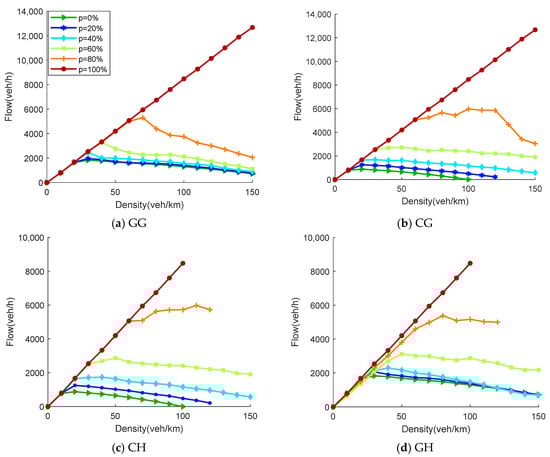
Figure 4.
Flow–density relationships under different lane management strategies for the two-lane configuration.
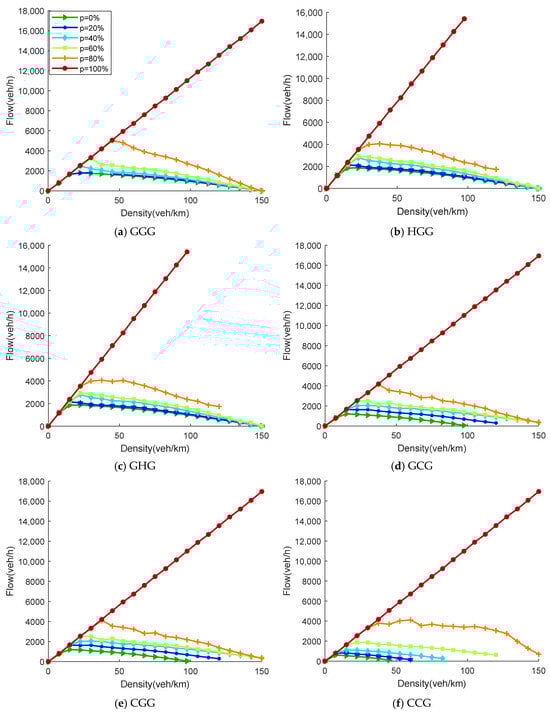
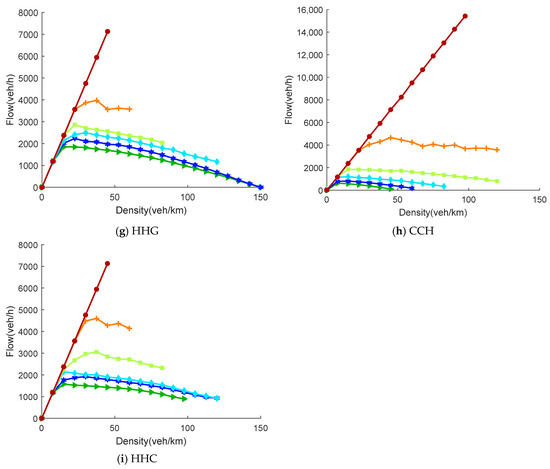
Figure 5.
Flow–density relationships under different lane management strategies for the three-lane configuration.
5.2.1. Two-Lane Highway
The k–q curves for the four two-lane strategies all exhibit the typical “first increase then decrease” shape. However, as the CAV penetration rate increases, the curves gradually transition from a sharp-peaked shape to a more plateau-like form, manifested by increased peak flow, a rightward shift in the optimal density, and enhanced overall stability.
In the GG strategy with no dedicated lanes, traffic flow improvement relies entirely on increasing the number of CAVs to enhance system performance. In the low-penetration phase, traffic flow is still dominated by HDV randomness, resulting in limited capacity gains. Only when does the cooperative advantage of CAVs become fully realized, leading to a noticeable increase in peak flow.
The two strategies with one dedicated lane present a sharp contrast. In the CG strategy, CAVs are assigned a dedicated lane in a stable environment. At medium-to-high densities, this strategy significantly suppresses random disturbances and delays the emergence of bottlenecks, resulting in a more gradual decline in flow. However, when , the insufficient number of CAVs leads to underutilization of the dedicated lane resource. Meanwhile, HDVs that concentrate in the mixed lane prematurely induce local congestion, resulting in a slightly lower peak flow than in GG. This disadvantage disappears rapidly as increases. The GH strategy confines CAVs to the mixed lane, hindering their ability to form stable platoons. Its overall performance is significantly weaker than CG at medium-to-high penetration rates. At high densities, a brief flow recovery and oscillation are observed. This stems from HDVs maintaining higher speeds in their dedicated lanes, while the greater speed difference between lanes amplifies disturbance propagation, undermining system stability.
In the CH strategy with two dedicated lanes, HDVs and CAVs are completely segregated, minimizing external interference. The fundamental diagram exhibits high stability. However, since the two vehicle types occupy separate, independent lanes, the system cannot cross-lane adjust. The overall capacity is constrained by the local saturation characteristics of each vehicle type, especially evident in the medium penetration range, where the flow exhibits a distinct “plateau”. This indicates that while dual dedicated lanes enhance stability, they limit the dynamic utilization efficiency of road resources.
Overall, appropriately setting up CAV-dedicated lanes is key to improving capacity; however, more dedicated lanes are not necessarily better. The CG strategy achieves the optimal balance between resource utilization and cooperative efficiency, making it the optimal scheme for the two-lane structure. If the dedicated lane configuration does not match the vehicle composition, such as GH (compressing CAV space) or CH (weakening elastic adjustment), it may lead to limited capacity or even amplified disturbances.
5.2.2. Three-Lane Highway
Figure 5a–i show the flow–density relationship curves for the nine lane management strategies in the one-way three-lane scenario. The three-lane structure provides more space for overtaking and adjustment, making the performance differences between strategies more pronounced than in the two-lane case.
In the GGG strategy with no dedicated lanes, the overall trend is similar to GG. However, the lateral mobility provided by multiple lanes significantly delays the decline in flow, maintaining higher flows in the high-density region. However, due to fully mixed operation, HDV randomness still induces a fluctuating decrease in the high-density phase.
When a dedicated lane is set, performance differences diverge significantly by dedicated lane type. Both the HGG and GHG strategies compress the available lanes for CAVs, restricting their platoon formation. Under medium-to-high densities, their flows are generally lower than GGG. Particularly for GHG, where the middle lane is HDV-dedicated, it blocks the CAV overtaking path, causing bottlenecks to form earlier and resulting in lower peak flow and a leftward shift in the saturation density. Conversely, the GCG and CGG strategies establish CAV-dedicated lanes. Once CAVs gain dedicated space, their cooperative driving capability is significantly enhanced, leading to a noticeable lift in the medium-to-high density region. CGG shows a decisive advantage when , as CAVs concentrate in a continuous dedicated lane band to form stable platoons, further unleashing the capacity benefit from shorter following headways. However, a slight performance lag due to the underutilization of the dedicated lane still occurs when .
When strategies include two dedicated lanes, performance divergence intensifies further. The CCG strategy provides continuous space for CAVs, facilitating the most complete platoon formation. When , its fundamental diagram shows a step-like increase, making it one of the optimal three-lane strategies. However, the HHG strategy allocates two HDV-dedicated lanes, leaving the sole mixed lane for CAVs. At high , congestion peaks emerge earlier, and the flow in the high-density region declines rapidly with oscillations, leading to significantly degraded performance. On the other hand, the CCH and HHC strategies, while achieving fully segregated layouts, allocate a large portion of lane resources to a single vehicle type, leading to underutilization. HHC exhibits an anomalous drop in peak flow at high because the sole CAV-dedicated lane saturates quickly, while the two HDV-dedicated lanes remain underused. Conversely, at low , the system can fully leverage the advantage of the two general-purpose lanes, resulting in a higher peak flow.
Overall, in the three-lane environment, the continuity of CAV-dedicated lanes and the matching between their number and the vehicle composition are dominant factors determining performance. The optimal strategies are CCG (high ) and CGG (medium-high ). The worst-performing strategies are GHG and HHG (bottlenecking CAV movement space). This indicates that providing CAVs with continuous, prioritized space is key to unlocking cooperative benefits, while excessively compressing CAV space results in significant system performance degradation.
5.2.3. Traffic Capacity
Table 2 compares the peak flow rates of different strategies across varying levels. Red cells indicate the optimal strategy for the corresponding .
Table 2.
Peak flow rates and optimal densities under different .
In the two-lane scenario, when , the GG and GH strategies show similar peak flows, both slightly outperforming strategies with CAV-dedicated lanes. The reason is that at low penetration rates, CAVs cannot form stable platoons, leading to underutilization of dedicated lanes. When , CG and CH are clearly superior to GG and GH. Dedicated lanes provide a more stable driving environment for CAVs, improving platoon formation and car-following stability, thereby significantly boosting peak flow.
In the three-lane environment, at lower , strategies like HGG and GHG, which establish HDV-dedicated lanes, often achieve higher peak flows, with minor differences between them. At this stage, CAVs are a minority, and allocating more resources to HDVs can effectively suppress random disturbances. As increases further, the performance of strategies containing CAV-dedicated lanes rises rapidly. Among them, CCH achieves the highest peak flow across all strategies when . This is because it provides CAVs with relatively continuous space, allowing platoons to maintain short headways even at high densities. In comparison, CCG, despite having similarly continuous dedicated lanes, confines HDVs to a single lane, making the system more prone to saturation at medium densities, resulting in a slightly lower peak flow than CCH.
5.3. Average Speed Difference Under Different Lane Management Strategies
To further analyze the impact of different lane management strategies on vehicle operational efficiency, this section examines the performance of strategies such as CG, CH, GH, GCG, CGG, CCG, HHG, CCH, and HHC using the average speed difference between CAVs and HDVs as an indicator. The GG and GGG strategies, where CAVs and HDVs are fully mixed and exhibit nearly identical average speeds with minimal type-based distinction, are excluded from this analysis. The absolute value of the speed difference is defined as:
Figure 6a–c and Figure 7a–f illustrate the two-dimensional distribution of the speed difference across varying CAV penetration rates and traffic densities. Overall, the strategies demonstrate a highly consistent fundamental pattern: in the low-density regime, both vehicle types operate under free-flow conditions, resulting in a speed difference approaching zero. As density increases to a moderate level, the speed difference grows rapidly because the frequency of random deceleration by HDVs rises. At the same time, CAVs can form cooperative platoons when sufficiently penetrated, leading to their speeds diverging. As traffic density increases further and the system gradually transitions into a congested flow state, vehicle speeds generally decrease, and the speed difference converges again. Despite this shared trend, significant variations exist among strategies in the peak magnitude of the speed difference, its persistence range, and their sensitivity to the penetration rate. These variations reflect the modulating effects of different lane-allocation structures on cooperative driving behavior and vehicle interaction processes.
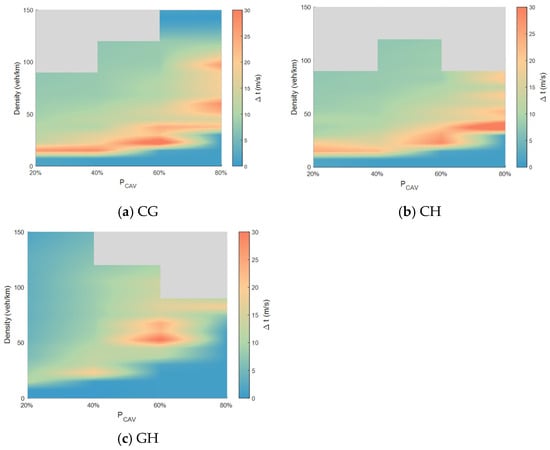
Figure 6.
Analysis of average speed difference for the two-lane configuration.
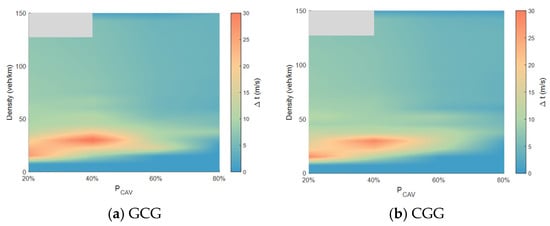
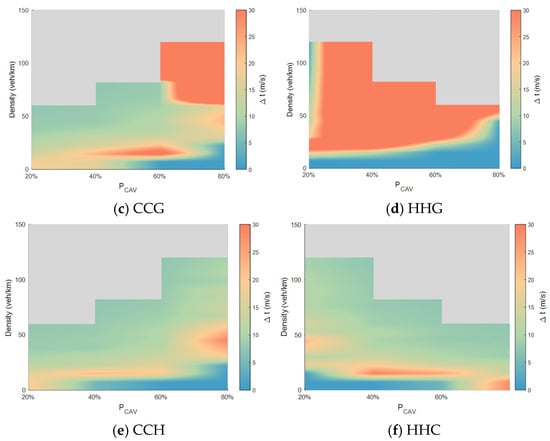
Figure 7.
Analysis of average speed difference for the three-lane configuration.
5.3.1. Speed Difference Under Two-Lane Strategies
In the two-lane scenario, the CG strategy provides CAVs with relatively stable dedicated space, allowing them to maintain stable platoon structures under medium densities and higher penetration rates. Consequently, a pronounced region of high-speed difference values forms under these conditions. In the GH strategy, CAVs must operate alongside HDVs in the mixed lane, where their cooperative structures are frequently disrupted. Meanwhile, HDVs maintain relatively stable free-flow speeds in their dedicated lane, keeping the speeds of the two vehicle types similar over a wide parameter range and resulting in generally low speed differences. In the CH strategy, where the two vehicle types operate separately in isolated lanes, the speed difference exhibits an increasing trend in the medium-density range, similar to that in CG. However, due to the inherent stability of both vehicle types in their respective lanes, the peak speed difference value is significantly lower than in CG. In summary, in the two-lane environment, whether a dedicated, stable space is provided for CAVs is the key determinant of speed difference performance. Among these, the CG strategy is most effective in unleashing the cooperative advantages of CAV platoons.
5.3.2. Speed Difference Under Three-Lane Strategies
In the three-lane environment, with more available space and greater flexibility in vehicle distribution, the speed difference exhibits more distinct structural features. Strategies with a single CAV-dedicated lane (GCG and CGG) show highly consistent performance, indicating that the placement of the dedicated lane (center or edge) has limited influence on the resulting speed difference. At medium densities and higher penetration rates, a single dedicated lane is sufficient to create a sustained region of high-speed difference. When CAVs can utilize two consecutive dedicated lanes, their cooperative capability is further enhanced, as reflected by the largest magnitude and widest extent of the high-speed-difference region, making this the most distinct category among all strategies. Comparing CCG and HHG reveals that the HHG strategy exhibits a larger high-speed-difference region at low penetration rates, whereas this relationship reverses under high penetration conditions. Among the fully segregated three-dedicated-lane strategies (e.g., CCH, HHC), where CAVs and HDVs operate independently, the speed difference primarily reflects the inherent speed characteristics of the two vehicle types.
It is difficult to directly conclude whether a larger speed difference indicates an optimal traffic system. However, from the perspective of CAV adoption, a greater relative speed advantage could enhance CAVs’ market appeal. This, in turn, may increase the penetration rate of automated vehicles.
5.4. Analysis of CAV Degradation
The CAV degradation rate reflects the proportion of CAVs that, due to changes in the type of the preceding vehicle in a mixed traffic environment, are unable to maintain their cooperative state and are forced to operate in AV mode. It serves as a crucial metric for evaluating whether CAVs cooperative capability can be effectively utilized. This section presents statistical analysis of the average degradation level under different CAV penetration rates and lane strategies, based on the bar charts shown in Figure 8a–h. In the figures, “CAV” indicates that the preceding vehicle remains a connected and automated vehicle, while “AV” indicates that the preceding vehicle is an HDV. Therefore, the occurrence of AV mode can be regarded as a manifestation of degradation resulting from perturbation of the cooperative relationship.
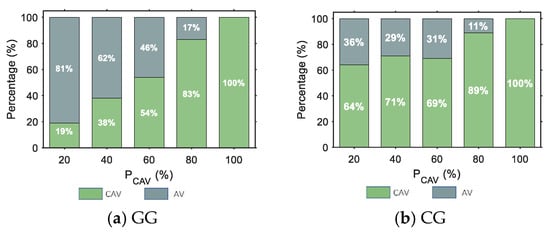
Figure 8.
Percentage of CAV degradation rate.
The following main patterns can be observed from Figure 8: (1) Under the CH and CCH strategies, CAVs are completely segregated from HDVs. Since the preceding vehicle of any CAV is invariably another CAV, no degradation phenomenon occurs. (2) In the GG and GGG strategies, where CAVs and HDVs are fully mixed, frequent random deceleration and car-following disturbances occur. This makes it difficult for CAVs to sustain stable cooperative car-following relationships over extended periods, resulting in relatively high degradation rates across all penetration levels. (3) Implementing dedicated lanes can significantly reduce the CAV degradation rate. Generally, a greater number of dedicated lanes and/or a higher proportion of CAVs correspond to a lower degradation rate. (4) Comparing the CG and GH strategies reveals that CAV-dedicated lanes are more effective than HDV-dedicated lanes. The former provides a stable, isolated environment for platoon formation, substantially reducing interference from heterogeneous vehicles, while the latter still struggles to ensure the continuity of CAV cooperative structures within the mixed lane. (5) For strategies containing only a single CAV-dedicated lane, the degradation rate exhibits some fluctuation in the low-to-medium penetration range. When , a relatively higher number of CAVs actively change lanes to access the dedicated lane, thereby reducing their probability of interference in the mixed lane and leading to a relatively lower degradation rate. However, as the penetration rate increases further, the density in the dedicated lane rises quickly, forcing some CAVs to continue operating in the mixed lane. This subjects them to renewed interference from HDVs, causing a temporary increase in the degradation rate within the medium penetration range. As the penetration rate continues to rise, the distribution of CAVs across the two-lane types stabilizes again, and the degradation rate decreases once more.
5.5. Sensitivity Analysis of Maximum Platoon Size
The maximum platoon size is a key parameter in the CAV cooperative control mechanism, directly determining the maximum number of CAVs that can be accommodated within a single platoon. An overly small platoon size can undermine the benefits of cooperative car-following, limiting improvements in road capacity. In contrast, a considerable platoon size may amplify the propagation of internal disturbances, affecting traffic flow stability. Therefore, this section conducts a sensitivity analysis at a CAV penetration rate of 100%, systematically comparing the impact of increasing S from 1 to 16 on the morphology of the fundamental diagram across different lane management strategies. Figure 9a–j illustrate the flow–density relationships for different values of under each strategy.
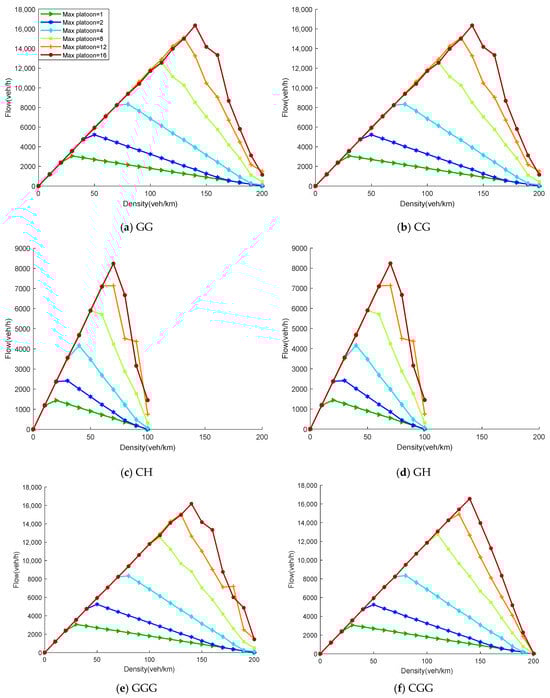
Figure 9.
Sensitivity analysis of maximum CAV platoon size.
Figure 9 indicates that, across all lane strategies, the flow exhibits the characteristic pattern of first increasing and then decreasing with density. As density increases, vehicles transition gradually from free flow to synchronized flow until reaching their respective optimal densities. Thereafter, as local headways fall below the CACC safe headway, vehicles begin to decelerate, and the flow enters a declining phase. Variations in the maximum platoon size significantly modulate this process: when increases, more CAVs can merge into stable platoons, thereby reducing the overall average headway. This results in a rightward shift in the optimal density and a general increase in peak flow—a trend consistent across all strategies.
Notably, in the environment assumed in this section, no HDV is present on the road. Consequently, heterogeneous conflicts or degradation behaviors between vehicles no longer exist. Therefore, the fundamental diagram morphologies of different lane strategies do not exhibit significant differences. The only distinction among strategies lies in the variation in the maximum achievable density due to differing numbers of usable lanes. Specifically, in the two-lane environment, both lanes are accessible to CAVs under the GG and CG strategies, resulting in identical maximum densities. In contrast, only one lane is available for CAV use in the GH and CH strategies, resulting in a maximum density approximately half that of the former. In the three-lane environment, all three lanes are usable under the GGG and CGG strategies; only two lanes can accommodate CAVs under the HGG and CCH strategies; and only one lane is available under the HHG and HHC strategies. Consequently, the maximum densities for these scenarios are approximately two-thirds and one-third, respectively, of that of the GGG strategy.
6. Conclusions and Future Work
6.1. Conclusions
This study develops a cellular automaton modeling framework for mixed traffic flow. It comprehensively integrates heterogeneous car-following rules, lane-changing strategies, and the cooperative driving behavior of CAV platoons. The framework aims to provide decision support for evaluating and designing lane management schemes in mixed traffic environments. Based on this framework, this study systematically analyzes and compares the operational performance of 13 representative lane management strategies. These strategies are examined under one-way, two-lane, and three-lane highway conditions. Such road configurations possess strong engineering representativeness in actual highway operations.
Through a joint analysis of multiple key operational indicators—including traffic capacity, speed structure, CAV degradation behavior, and the impact of maximum platoon size—this paper quantitatively reveals the interaction between different lane configurations and CAV cooperative mechanisms. It further explains how these interactions affect the overall operational efficiency and stability of the traffic system. The findings provide practical reference for setting up CAV-dedicated lanes or mixed-use lanes. They also offer guidance for formulating platoon management rules during the early stages of CAV deployment. The main conclusions of this study are as follows.
(1) Significant differences exist in the fundamental diagram characteristics across different lane management strategies, and their performance undergoes phased transitions with changes in . Under low penetration rates, the stochastic behavior of HDVs remains the dominant factor affecting system stability. In this regime, setting up HDV-dedicated lanes (e.g., GH, HGG, GHG) can effectively dampen disturbances, allowing the system to maintain relatively higher peak flows. Conversely, prematurely establishing CAV-dedicated lanes because they are underutilized tends to trigger localized congestion.
(2) As increases, strategies incorporating CAV-dedicated lanes begin to demonstrate superiority. Particularly when the dedicated lanes are contiguous, CAVs can form cooperative platoons more stably, maintaining shorter headways within medium to high-density ranges. This significantly elevates peak flow and delays the onset of the optimal density. This trend is more pronounced in three-lane scenarios. Under high penetration rates, strategies with two continuous CAV-dedicated lanes (e.g., CCG, CCH) show optimal performance in both capacity and stability.
(3) From the perspective of speed difference, different strategies significantly influence the divergence in vehicle efficiency. Providing CAVs with relatively stable, continuous driving space (e.g., CG, GCG, CGG, CCG) can markedly amplify CAVs’ speed advantage in medium-density regions. In contrast, under strategies without dedicated space or where CAVs are confined to mixed lanes (e.g., GH, HHG), the speed difference remains consistently low. This indicates disrupted cooperative structures and unrealized efficiency advantages.
(4) The degradation rate analysis further indicates that the ability of CAVs to maintain a cooperative car-following state over extended periods is highly correlated with the lane structure. Under fully mixed strategies (GG, GGG), CAVs are prone to frequent degradation due to HDVs’ random behavior. Implementing CAV-dedicated lanes can substantially reduce the degradation rate. Strategies such as CH, CG, GCG, CGG, and CCG demonstrate strong resilience to interference, with CCG being the most prominent.
(5) Under the condition where reaches 100%, the maximum platoon size exerts a common influence on the overall shape of the fundamental diagram. Larger platoon sizes correspond to smaller average headways, higher optimal densities, and greater peak flows. In this ideal environment, free of heterogeneous interference, differences among strategies are primarily determined by the number of usable lanes, not their types. This demonstrates that the cooperative control mechanism governs traffic flow performance.
6.2. Future Work
Synthesizing the above findings, this study clearly indicates that, in the two-lane scenario, the CG strategy is optimal for medium-to-high penetration rates. In the three-lane scenario, the CCG strategy demonstrates stable and optimal performance across key metrics, including capacity, speed structure, degradation rate, and stability. Therefore, it represents the overall optimal lane management strategy.
Although this study systematically analyzes the impact of different lane management strategies and CAV platoon cooperative behavior on the operational characteristics of mixed traffic flow, certain research limitations remain.
(1) The research object primarily focuses on basic sections of one-way highways. It does not account for complex traffic scenarios, such as ramps, bottlenecks, or multi-section coupling. The applicability of its conclusions in more complex road network environments requires further validation.
(2) The study employs a cellular automaton model to characterize traffic flow evolution. Necessary simplifying assumptions were made regarding the continuity of vehicle motion and fine-grained differences in driving behavior.
(3) The model assumes CAVs possess ideal information acquisition and cooperative control capabilities. It does not explicitly account for real-world factors such as communication delays or control errors.
Future research can further expand upon this work in two main directions. On one hand, the research scope can be extended to more complex highway network structures, incorporating more refined models of vehicle behavior and communication constraints. On the other hand, in-depth studies can be conducted on issues such as cooperative lane-changing in CAV platoons, trajectory optimization, and the optimization of dedicated lane quantity and layout. These efforts aim to enhance the applicability and engineering value of the findings for practical traffic planning and management.
Author Contributions
Z.Y., writing—original draft, writing—review and editing. Y.W. (Yumei Wu), writing—original draft, writing—review and editing. J.W., writing—original draft, methodology, visualization, writing—review and editing. Y.W. (Yi Wang), writing—review and editing. G.L., conceptualization, funding acquisition, writing—review and editing. Y.J., resources, software, project administration, supervision, writing—review and editing. All authors have read and agreed to the published version of the manuscript.
Funding
This work was supported in part by the Humanities and Social Science Foundation of the Ministry of Education in China 25YJCZH339, in part by the National Natural Science Foundation of China 72471200, in part by the Sichuan Science and Technology Program 2024NSFSC0179, 2025NSFSC2000, and in part by the Fundamental Research Funds for the Central Universities 2682025GH023.
Data Availability Statement
The original contributions presented in this study are included in the article. Further inquiries can be directed to the corresponding author(s).
Conflicts of Interest
The authors declare no conflicts of interest.
References
- Talebpour, A.; Mahmassani, H.S. Influence of Connected and Autonomous Vehicles on Traffic Flow Stability and Throughput. Transp. Res. Part C Emerg. Technol. 2016, 71, 143–163. [Google Scholar] [CrossRef]
- Cai, L.; Lv, W.; Xiao, L.; Xu, Z. Total Carbon Emissions Minimization in Connected and Automated Vehicle Routing Problem with Speed Variables. Expert Syst. Appl. 2021, 165, 113910. [Google Scholar] [CrossRef]
- Carlson, R.C.; Papamichail, I.; Papageorgiou, M. Integrated Feedback Ramp Metering and Mainstream Traffic Flow Control on Motorways Using Variable Speed Limits. Transp. Res. Part C Emerg. Technol. 2014, 46, 209–221. [Google Scholar] [CrossRef]
- Carlson, R.C.; Papamichail, I.; Papageorgiou, M.; Messmer, A. Optimal Motorway Traffic Flow Control Involving Variable Speed Limits and Ramp Metering. Transp. Sci. 2010, 44, 238–253. [Google Scholar] [CrossRef]
- Ye, L.; Yamamoto, T. Modeling Connected and Autonomous Vehicles in Heterogeneous Traffic Flow. Phys. A Stat. Mech. Its Appl. 2018, 490, 269–277. [Google Scholar] [CrossRef]
- Stern, R.E.; Cui, S.; Delle Monache, M.L.; Bhadani, R.; Bunting, M.; Churchill, M.; Hamilton, N.; Haulcy, R.; Pohlmann, H.; Wu, F.; et al. Dissipation of Stop-and-Go Waves via Control of Autonomous Vehicles: Field Experiments. Transp. Res. Part C Emerg. Technol. 2018, 89, 205–221. [Google Scholar] [CrossRef]
- Santa, J.; Gómez-Skarmeta, A.F.; Sánchez-Artigas, M. Architecture and Evaluation of a Unified V2V and V2I Communication System Based on Cellular Networks. Comput. Commun. 2008, 31, 2850–2861. [Google Scholar] [CrossRef]
- Chen, B.; Sun, D.; Zhou, J.; Wong, W.; Ding, Z. A Future Intelligent Traffic System with Mixed Autonomous Vehicles and Human-Driven Vehicles. Inf. Sci. 2020, 529, 59–72. [Google Scholar] [CrossRef]
- Yu, H.; Tak, S.; Park, M.; Yeo, H. Impact of Autonomous-Vehicle-Only Lanes in Mixed Traffic Conditions. Transp. Res. Rec. J. Transp. Res. Board 2019, 2673, 430–439. [Google Scholar] [CrossRef]
- Yao, Z.; Fu, C.; Wang, Y.; Wu, Y.; Jiang, Y.; Ran, B. Optimal Lane Management Model for Mixed Traffic Flow With Connected Automated Vehicles on Freeways. IEEE Trans. Veh. Technol. 2024, 73, 18134–18145. [Google Scholar] [CrossRef]
- Yao, Z.; Ren, T.; Wang, Y.; Xu, Z.; Jiang, Y. Fundamental Diagram of Mixed Traffic Flow Considering Dedicated and Shared Lanes Management Policies for CAVs. IEEE Trans. Transp. Electrif. 2024, 10, 6964–6978. [Google Scholar] [CrossRef]
- Laan, Z.V. Operational Performance of a Congested Corridor with Lanes Dedicated to Autonomous Vehicle Traffic. Int. J. Transp. Sci. Technol. 2017, 6, 42–52. [Google Scholar] [CrossRef]
- Zong, F.; Wang, S.-Q.; Qin, Y.-Z.; Zeng, M. Analyzing the Short- and Long-Term Car-Following Behavior in Multiple Factor Coupled Scenarios. Expert Syst. Appl. 2025, 272, 126724. [Google Scholar] [CrossRef]
- Amirgholy, M. Traffic Automation and Lane Management for Communicant, Autonomous, and Human-Driven Vehicles. Transp. Res. Part C Emerg. Technol. 2020, 111, 477–495. [Google Scholar] [CrossRef]
- Xiang, J.; Wang, Z.; Mi, Q.; Wen, Q.; Xu, Z. Cooperative Lane-Change Control Method for Freeways Considering Dynamic Intelligent Connected Dedicated Lanes. Electronics 2024, 13, 1625. [Google Scholar] [CrossRef]
- Zong, F.; Yue, S.; Zeng, M.; He, Z.; Ngoduy, D. Platoon or Individual: An Adaptive Car-Following Control of Connected and Automated Vehicles. Chaos Solitons Fractals 2025, 191, 115850. [Google Scholar] [CrossRef]
- Chen, D.; Ahn, S.; Chitturi, M.; Noyce, D.A. Towards Vehicle Automation: Roadway Capacity Formulation for Traffic Mixed with Regular and Automated Vehicles. Transp. Res. Part B Methodol. 2017, 100, 196–221. [Google Scholar] [CrossRef]
- Ye, L.; Yamamoto, T. Impact of Dedicated Lanes for Connected and Autonomous Vehicle on Traffic Flow Throughput. Phys. A Stat. Mech. Its Appl. 2018, 512, 588–597. [Google Scholar] [CrossRef]
- Carrone, A.P.; Rich, J.; Vandet, C.A.; An, K. Autonomous Vehicles in Mixed Motorway Traffic: Capacity Utilisation, Impact and Policy Implications. Transportation 2021, 48, 2907–2938. [Google Scholar] [CrossRef]
- Ma, K.; Wang, H. Influence of Exclusive Lanes for Connected and Autonomous Vehicles on Freeway Traffic Flow. IEEE Access 2019, 7, 50168–50178. [Google Scholar] [CrossRef]
- Hua, X.; Yu, W.; Wang, W.; Xie, W. Influence of Lane Policies on Freeway Traffic Mixed with Manual and Connected and Autonomous Vehicles. J. Adv. Transp. 2020, 2020, 3968625. [Google Scholar] [CrossRef]
- Chen, T.; Wang, Z.; Xiang, J.; Li, H. Analysis of Mixed Traffic Flow Characteristics Based on Cellular Automata Model under Lane Management Measures. Phys. A Stat. Mech. Its Appl. 2024, 654, 130177. [Google Scholar] [CrossRef]
- Fagnant, D.J.; Kockelman, K. Preparing a Nation for Autonomous Vehicles: Opportunities, Barriers and Policy Recommendations. Transp. Res. Part A Policy Pract. 2015, 77, 167–181. [Google Scholar] [CrossRef]
- Mahmassani, H.S. 50th Anniversary Invited Article—Autonomous Vehicles and Connected Vehicle Systems: Flow and Operations Considerations. Transp. Sci. 2016, 50, 1140–1162. [Google Scholar] [CrossRef]
- Shladover, S.E.; Su, D.; Lu, X.-Y. Impacts of Cooperative Adaptive Cruise Control on Freeway Traffic Flow. Transp. Res. Rec. J. Transp. Res. Board 2012, 2324, 63–70. [Google Scholar] [CrossRef]
- Van Arem, B.; Van Driel, C.J.G.; Visser, R. The Impact of Cooperative Adaptive Cruise Control on Traffic-Flow Characteristics. IEEE Trans. Intell. Transp. Syst. 2006, 7, 429–436. [Google Scholar] [CrossRef]
- Kesting, A.; Treiber, M.; Helbing, D. Enhanced Intelligent Driver Model to Access the Impact of Driving Strategies on Traffic Capacity. Philos. Trans. A Math. Phys. Eng. Sci. 2010, 368, 4585–4605. [Google Scholar] [CrossRef] [PubMed]
- Arnaout, G.M.; Arnaout, J.-P. Exploring the Effects of Cooperative Adaptive Cruise Control on Highway Traffic Flow Using Microscopic Traffic Simulation. Transp. Plan. Technol. 2014, 37, 186–199. [Google Scholar] [CrossRef]
- Ghiasi, A.; Hussain, O.; Qian, Z.S.; Li, X. A Mixed Traffic Capacity Analysis and Lane Management Model for Connected Automated Vehicles: A Markov Chain Method. Transp. Res. Part B Methodol. 2017, 106, 266–292. [Google Scholar] [CrossRef]
- Razmi Rad, S.; Farah, H.; Taale, H.; Van Arem, B.; Hoogendoorn, S.P. The Impact of a Dedicated Lane for Connected and Automated Vehicles on the Behaviour of Drivers of Manual Vehicles. Transp. Res. Part F Traffic Psychol. Behav. 2021, 82, 141–153. [Google Scholar] [CrossRef]
- Jiang, Y.; Wang, S.; Yao, Z.; Zhao, B.; Wang, Y. A Cellular Automata Model for Mixed Traffic Flow Considering the Driving Behavior of Connected Automated Vehicle Platoons. Phys. A Stat. Mech. Its Appl. 2021, 582, 126262. [Google Scholar] [CrossRef]
- Shladover, S.E. Connected and Automated Vehicle Systems: Introduction and Overview. J. Intell. Transp. Syst. 2018, 22, 190–200. [Google Scholar] [CrossRef]
- Milanés, V.; Shladover, S.E.; Spring, J.; Nowakowski, C.; Kawazoe, H.; Nakamura, M. Cooperative Adaptive Cruise Control in Real Traffic Situations. IEEE Trans. Intell. Transp. Syst. 2014, 15, 296–305. [Google Scholar] [CrossRef]
- Xiao, L.; Wang, M.; Van Arem, B. Realistic Car-Following Models for Microscopic Simulation of Adaptive and Cooperative Adaptive Cruise Control Vehicles. Transp. Res. Rec. J. Transp. Res. Board 2017, 2623, 1–9. [Google Scholar] [CrossRef]
- Wu, W.; Liu, Y.; Xu, Y.; Wei, Q.; Zhang, Y. Traffic Control Models Based on Cellular Automata for At-Grade Intersections in Autonomous Vehicle Environment. J. Sens. 2017, 2017, 9436054. [Google Scholar] [CrossRef]
- Wang, Y.; Jiang, Y.; Wu, Y.; Yao, Z. Mitigating Traffic Oscillation through Control of Connected Automated Vehicles: A Cellular Automata Simulation. Expert Syst. Appl. 2024, 235, 121275. [Google Scholar] [CrossRef]
Disclaimer/Publisher’s Note: The statements, opinions and data contained in all publications are solely those of the individual author(s) and contributor(s) and not of MDPI and/or the editor(s). MDPI and/or the editor(s) disclaim responsibility for any injury to people or property resulting from any ideas, methods, instructions or products referred to in the content. |
© 2026 by the authors. Licensee MDPI, Basel, Switzerland. This article is an open access article distributed under the terms and conditions of the Creative Commons Attribution (CC BY) license.