Abstract
The complex interdependencies among numerous safety risk factors influencing oil tanker loading/unloading operations constitute a focal point in academic research. To enhance safety management in oil port operations, this study conducts a risk analysis of oil tanker berthing and cargo transfer safety. Initially, safety risk factors are identified based on the Wu-li Shi-li Ren-li (WSR) systems methodology. Subsequently, a hybrid weighting approach integrating the Fuzzy Analytic Hierarchy Process (FAHP), G2 method, and modified CRITIC technique is employed to calculate indicator weights. These weights are then synthesised into a combined weight (GVW) using cooperative game theory and variable weight theory. Further, by integrating grey theory with the cloud model (GCM), a risk assessment is performed using Tianjin Port as a case study. Results indicate that the higher-risk indicators for Tianjin Port include vessel traffic density, safety of berthing/unberthing operations, safety of cargo transfer operations, safety of pipeline transfer operations, psychological resilience, proficiency of pilots and captains, and emergency management capability. The overall comprehensive risk evaluation value for Tianjin Port is 0.403, corresponding to a “Moderate Risk” level. Comparative experiments demonstrate that the results generated by this model align with those obtained through Fuzzy Comprehensive Evaluation Methods. However, the proposed GVW-GCM framework provides a more objective and accurate reflection of safety risks during tanker operations. Based on the computational outcomes, targeted recommendations for risk mitigation are presented. The integrated weighting model—incorporating game theory and variable weight concepts—coupled with the grey cloud methodology, establishes an interpretable and reusable analytical framework for the safety assessment of oil port operations under diverse port conditions. This approach provides critical decision support for constructing comprehensive management systems governing oil tanker loading/unloading operations.
1. Introduction
As a critical node in the global energy supply chain, oil tanker loading and unloading operations serve as vital infrastructure for the international transportation of crude oil and refined petroleum products. Nevertheless, these operations constitute one of the most hazardous industrial activities due to the inherent risks of fuel spills and fire incidents [1,2]. According to International Maritime Organisation (IMO) statistics, 1237 tanker loading/unloading accidents were recorded globally between 2015 and 2022, with 23% resulting in severe environmental contamination or human casualties. Recent trends in vessel upsizing, intensified port throughput, and the growing frequency of extreme climate events [3] present emerging challenges to conventional risk mitigation strategies [4], thereby elevating the strategic significance of port safety management [5].
The safety risk assessment of oil tanker loading and unloading operations mainly includes the assessment of oil tanker safety operations and port safety navigation risks. However, early research mainly relied on expert experience and accident statistics for qualitative analysis. With the advancement of mathematical modelling techniques, risk quantification has become a research hotspot, as demonstrated by the following: Toe et al. [6] conducted quantitative risk assessment of tanker collisions at Myanmar’s Kyaukphyu Deep-Sea Port to determine maximum acceptable risk thresholds; Liu et al. [7] enhanced DEMATEL-ISM with Random Forest weighting to evaluate safety risks across vessel, environmental, equipment, personnel, and management factors during berthing and cargo operations. Based on risk quantification, many scholars have begun to conduct risk scenario analyses based on Bayesian networks, accident numbers, and other methods. Zhong et al. [8] quantified legal liabilities in oil port spill scenarios through contingency analysis to inform emergency planning; Abramowicz-Gerigk et al. [9] assessed chemical tanker port risks using Bayesian influence diagrams; Kaushik and Kumar [10] integrated intuitionistic fuzzy fault trees with Bayesian networks for mooring operation risk analysis; Khan et al. [11] combined expert judgment with logistic regression to develop Bayesian network probability tables, identifying fires/explosions, corrosion, and procedural violations as primary risk factors in port infrastructure.
However, most studies on the causes of risk factors are often limited to a single factor. Khan et al. [12] employed Bayesian networks to quantify human factor impacts in hazardous materials handling, identifying safety culture deficiencies and regulatory gaps as primary accident causes; Ozturk et al. [13] applied Fuzzy Bayesian networks to pilot–captain communication processes, revealing crew coordination competence and operational knowledge as critical human error influencers. On this basis, a combination of subjective and objective weights is introduced to analyse the causes of risk, as demonstrated by the following: Chen et al. [14] merged epidemic dynamics with Cloud Models to advance causal risk analysis in congested waterways; Wang et al. [15] combined Fuzzy Comprehensive Evaluation with Normal Cloud Models to diagnose the operational integrity of loading/unloading systems; Wang et al. [16] established a multi-task information integration method for evaluating cargo oil system safety risk levels; Gao [17] developed a Cloud–DEMATEL integration model to identify dominant risk factors during cargo operations. Chen et al. [18] combined the Analytic Hierarchy Process (AHP), grey relational analysis (GRA), and Entropy Weighting Method (EWM) to obtain the weights of indicator combinations, and combined the Cloud Model to analyse urban road risks; Kang et al. [19] proposed using Analytic Hierarchy Process (AHP) and Entropy Weight Method (EWM) to determine the subjective and objective weights of indicators for the safety risks of ship battery systems, and determining the comprehensive weights through a combined weighted optimisation model to analyse the level of safety risks.
The main purpose of this study is to develop a comprehensive dynamic risk assessment framework for oil tanker loading and unloading operations, and to analyse the risk levels between different factors. Although some studies use different factors to construct safety risks for oil tanker loading and unloading operations, there are still some shortcomings: (1) Existing port safety studies predominantly address general vessel navigation and berthing safety but largely overlook specialised risk analysis for high-risk vessels like oil tankers. Given their transport of flammable/explosive cargoes, these vessels exhibit elevated risks during berthing and cargo operations, necessitating targeted safety frameworks. (2) Indicator weighting methods rely excessively on single-technique approaches for scenario analysis. Expert scoring often adopts simplistic mechanisms (e.g., equal weighting or unvalidated elimination), compromising reliability. (3) Combined weighting calculations suffer from oversimplified aggregation, typically employing linear additive models without rigorous validation. This introduces significant subjectivity, underscoring the need for more objective integration algorithms.
Building on existing research, this study develops a novel safety assessment framework for oil tanker berthing and loading/unloading operations by integrating Wuli–Shili–Renli (WSR) theory with an enhanced Grey Cloud Model (GCM). The methodology proceeds in four stages. First, WSR theory systematically identifies multidimensional risk factors. Second, indicator weights are calculated through a tripartite approach—Fuzzy AHP, Entropy Weight-Modified G2, and Improved CRITIC. Third, Game Variable Weight (GVW) is derived by synthesising these weights using cooperative game theory and variable weight theory. Finally, GVW is embedded into the GCM to create an optimised evaluation model. Empirical validation through a case study of Tianjin Port yields quantified risk values, providing actionable insights for port safety management.
This paper contributes the following two key methodological advances: (1) GVW-enhanced Grey Cloud Modelling: By integrating Game Variable Weight (GVW) into the Grey Cloud Model (GCM), we develop a hybrid algorithm (GVW-GCM) that fundamentally mitigates inherent subjectivity in traditional GCM applications. This synthesis expands GCM’s applicability while significantly enhancing evaluation result reliability. (2) Multifactorial Risk Quantification: The GVW-GCM framework enables the systematic analysis of causal relationships between risk factors, generating two critical outputs: (i) granular risk prioritisation for individual oil tanker loading/unloading indicators, and (ii) comprehensive port-level risk evaluation metrics. These outputs provide evidence-based decision support for targeted safety interventions.
This paper is organised as follows: Section 2 explicates the Wuli–Shili–Renli (WSR) theoretical framework and constructs the indicator system; Section 3 introduces the dual-weighting methodology integrating game theory and variable weighting; Section 4 presents the Grey Cloud Model implementation framework; Section 5 provides experimental results and comparative analysis; Section 6 concludes with research contributions and future directions.
2. Indicator System and Evaluation Using the WSR Method
2.1. WSR Theory and Methodology
The Wuli–Shili–Renli (WSR) theory, first proposed by Professor Gu Jifa in 1994, is a complexity science methodology developed from Eastern systems thinking [20]. This theory draws on Western systematic methodology and has been modified based on classical Eastern philosophy and Eastern systematic methodology. It analyses complex problems through three dimensions: Wuli, Shili, and Renli [21]. The WSR methodology differs from other studies that focus on single factors such as ship factors, human factors, and equipment factors. Among them, the “Wuli” dimension refers to the natural laws of the objective material world, as well as objective conditions such as the environment and historical development level; the “Shili” dimension refers to the mechanism and process optimisation of system operation, solving the problem of “how to do it”; the “Renli” dimension can deal with soft factors such as human behavioural psychology and social organisation. The dynamic coupling of the three factors affects the overall risk level, making it significantly enhance the effectiveness of risk prevention and control in multi-scenario risk management practices [22].
The WSR methodology provides an innovative approach for comprehensive research on safety risk assessment in oil tanker loading and unloading operations. The advantages of the WSR methodology mainly include the following:
- (1)
- The WSR methodology emphasises the dynamic correlation and overall effect of the three elements of physics, mechanics and human factors, breaking through the limitations of traditional one-dimensional analysis. In response to the complexity of oil tanker loading and unloading operations, it forms a collaborative optimisation path of technical feasibility, process rationality, and management effectiveness [23].
- (2)
- The WSR method serves as a methodological framework that supports interdisciplinary tools in physics, mechanics, and anthropology, enabling the comprehensive application of multiple methods within a unified system [24].
- (3)
- The WSR methodology can continuously adjust and repeatedly improve the safety risks of oil tanker loading and unloading operations through three dimensions: physics, mechanics, and human factors. Its core feature is reflected in a spiral improvement path.
The WSR methodology can systematically integrate things, events, and people, especially emphasising the role of human agency. It can systematically and scientifically analyse, design, plan, and coordinate the development of things from a holistic perspective, thus scientifically exploring the laws of development of things and making scientific decisions. Due to the emphasis on the active role of humans in the development and change in things, the WSR methodology can distinguish the focus on human dynamics from traditional risk methods that prioritise ships, environments, and equipment. Consequently, WSR offers robust theoretical explanatory power for safety risk management contexts where stakeholder agency fundamentally influences outcomes.
This method can significantly improve the effectiveness of risk prevention and control in multi-scenario risk management practices. For example, Wang et al. [25] combined the WSR methodology with the fuzzy matter element extension model to address the issue of sustainable evaluation in the shale gas industry; Zhou et al. [26] studied the impact of government credit on government performance in Chinese public–private partnership projects from the perspective of WSR system theory; Wang et al. [27] used the WSR methodology to construct a risk indicator system for automated container port logistics system failures in project risk management; Qin et al. [28] combined the WSR methodology with DEMATEL-ISM to construct a fire accident risk assessment model for commercial complexes.
2.2. WSR Framework for Safety Risk Assessment of Oil Tanker Loading and Unloading Operations
As a core link in the energy supply chain, oil tanker loading and unloading operations constitutes a complex open system involving the coupling of technology, management, and society, from port infrastructure, loading/unloading procedures, safety regulation, cross-departmental collaboration, personnel behaviour standardisation, and ecological environment supervision, forming a multi-level, interactive spatial network system (see Figure 1). The safety risks of these operations are not only determined by single dimensions, such as equipment reliability or operational standardisation, but also necessitate systematic control within a collaborative framework that balances physical constraints, procedural coordination, and human relationship equilibrium.
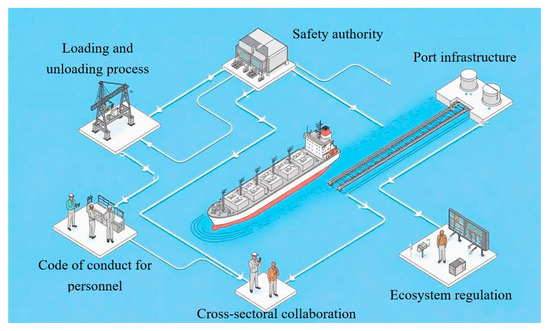
Figure 1.
Oil tanker loading and unloading operation system.
The WSR theory reveals that system risks are essentially the result of the interaction of multidimensional elements and have significant compound characteristics. Similarly, accident causation theories emphasise that risk factors are caused by a series of domino effects [29].
Applying the WSR systems methodology to the safety risk assessment of oil tanker loading and unloading operations involves evaluating the following:
On the physical level: The objective conditions of port hardware facilities and the natural environment. Using the collected raw port throughput data and geographical information data, the port’s carrying capacity and risk threshold are identified, and the environmental sensitivity and navigation safety conditions of the study area are assessed.
On the logical level: The implementation mechanisms of operational processes and safety management systems. According to the design capacity regulatory documents and safety assessment agency audit reports, the completeness of standard operating procedures (SOPs) is evaluated/assessed.
On the human level: The proactivity of personnel capabilities and management coordination. Drawing on the maritime administration’s seafarer competency certificate database and records of non-compliant operations, the competency of key positions is assessed.
Based on the three-dimensional integrated perspective of the WSR methodology, the evaluation framework is constructed, as shown in Figure 2. Taking the Shili layer perspective as an example, the logical relationship between each indicator is shown in Figure 3.
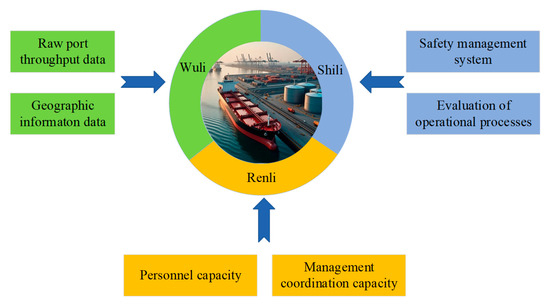
Figure 2.
Research procedure of oil tanker loading and unloading operation.
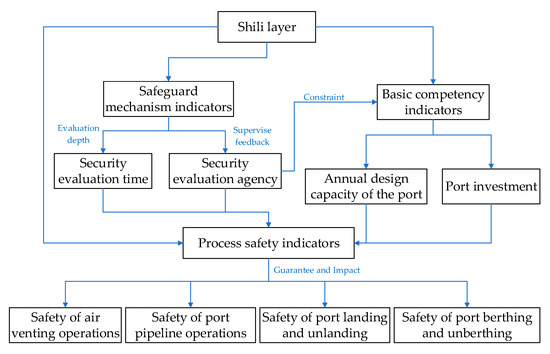
Figure 3.
Logical relationship diagram of various indicators in the Shili layer.
Figure 4 presents the framework diagram for the safety risk assessment of oil tanker loading and unloading operations, based on the WSR systems methodology. Drawing on the methods of Husak [30] and Liu et al. [7], this framework identifies 24 main influencing indicators from the perspectives of physics (Wuli), mechanics (Shili), and human relations (Renli). These indicators form the theoretical framework of safety risk factors for these operations.
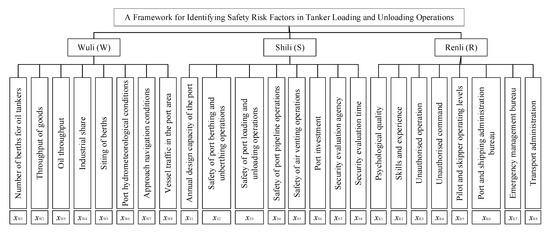
Figure 4.
A framework identifying safety risk factors in tanker loading and unloading operations.
2.3. Comprehensive Evaluation Process
This paper employs the grey cloud droplet matrix generated by the Grey Cloud Model (GCM) to optimise the Fuzzy Comprehensive Evaluation Method (FCEM). Both the optimised FCEM and the Fuzzy Entropy Method (FEM) are then applied to assess the safety risks of oil tanker loading and unloading operations. The allocation of subjective and objective weights is optimised using game theory and variable weighting. These optimised safety risk indicator weights undergo grey cloud clustering to determine the safety risk level for the operations. The overall evaluation process is illustrated in Figure 5.
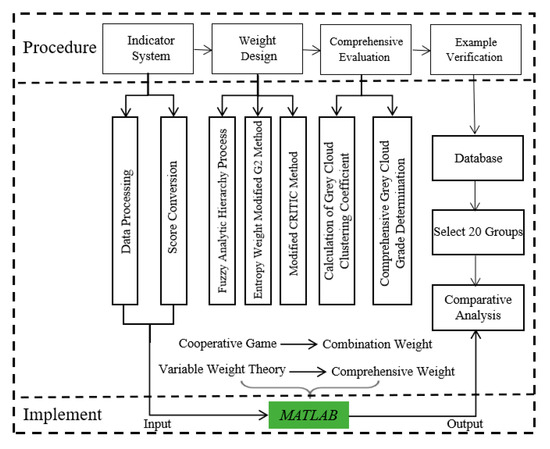
Figure 5.
GVW-GCM evaluation process.
3. Designing Indicator Weights Based on Game Theory and Variable Weighting
The safety risks of oil tanker loading and unloading operations stem from numerous interrelated factors. Determining the weights of the indicators selected in Figure 4 is the primary focus of this section. These weights critically influence the evaluation results derived from the subsequent comprehensive measurement matrix, making them one of the most crucial elements in the entire evaluation process. While numerous weight determination methods exist (such as the Delphi method and Fuzzy Analytic Hierarchy Process (FAHP)), this paper employs a combination of game theory, FAHP, an entropy weight-modified unique reference comparison method, and an improved CRITIC method. These methods are applied to quantitatively process both positive and negative indicators using distinct approaches. The effectiveness and value of the designated indicator weights are then assessed.
3.1. Quantification of Evaluation Indicators
The safety risk evaluation indicator system for oil tanker loading and unloading operations comprises parameters with distinct data attributes.
Quantitative Indicators: Measurable parameters based on objective data (e.g., crude oil throughput and industrial proportion).
Qualitative Indicators: Parameters requiring expert-based assessment (e.g., operational level of pilots/captains, and management level of Port and Shipping Administration).
Consequently, the safety risk evaluation process for these operations inherently employs a hybrid approach, integrating both quantitative and qualitative methodologies.
3.1.1. Quantification of Quantitative Indicators
For the quantitative evaluation of safety risks in oil tanker loading and unloading operations, indicators are classified across the following five risk levels: Extremely Low, Low, Medium, High, and Extremely High. Building upon regulations, including the Safety Requirements for Oil Tanker Operations in Port (GB 18434-2022) and the Regulations on the Safety Management of Dangerous Chemicals, a comprehensive evaluation indicator system has been established, as detailed in Table 1.

Table 1.
Summary table of quantitative index evaluation criteria.
3.1.2. Quantification of Qualitative Indicators
In the safety risk assessment of oil tanker loading and unloading operations, qualitative indicators are difficult to determine through specific data and require fuzzy quantification based on expert experience. A total of 20 experts were invited to score the qualitative indicators of safety risks in oil tanker loading and unloading operations. The specific process is as follows.
Based on the ISO 31000 risk management standard [31], a five-level linguistic evaluation set is constructed, as shown in Table 2.
Table 2.
Score interval of the qualitative index grade.
Assuming that there are n evaluation indicators for the safety risks of oil tanker loading and unloading operations, the set of safety evaluation indicators is constituted as follows: , index . As shown in Table 2, there are 5 safety levels, where the j safety level can be represented as . Let , and conduct linguistic evaluation for qualitative indicators to form the following initial judgment matrix:
where indicates the risk level judgment of the k expert for n evaluation indicators under the 5 safety levels.
The evaluation value xi of each evaluation indicator Xi is given as
where and represent the lower and upper bounds of the interval, respectively.
3.2. Determination of Indicator Weights
3.2.1. Fuzzy Analytic Hierarchy Process (FAHP)
The Fuzzy Analytic Hierarchy Process (FAHP) is an extension of the traditional Analytic Hierarchy Process (AHP) [32,33,34]. It integrates fuzzy mathematics theory and can be used to handle uncertainties and ambiguities in the safety risk assessment of oil tanker loading and unloading operations. By introducing fuzzy numbers instead of precise values [35], FAHP more closely aligns with the fuzzy judgments made by managers regarding the complex issues in oil tanker operations. This approach is more conducive to determining the relative importance of evaluation indicators [36], and the fuzzy scale values are shown in Table 3.
Table 3.
Fuzzy Analytic Hierarchy Process (FAHP) scale values.
Based on the safety risk evaluation indicator set for oil tanker loading and unloading operations, a fuzzy consistent judgment matrix is established.
where rij represents the relative importance between indicators. For example, when xi is slightly more important than xj, the value of rij is taken as (0.5,0.6]. The same applies to the remaining indicators, and rij satisfies the following:
The weights of each indicator are calculated based on rij.
where ; a is the difference coefficient between indicators. When , the smaller the value of a, the greater the weight difference. In this paper, a is selected as to maximise the weight difference.
3.2.2. Entropy Weight-Modified Unique Reference Comparison Method
The Entropy Weight-Modified Unique Reference Comparison Method (also known as the Entropy Weight Modification G2 Method) is a comprehensive weighting evaluation method that combines information entropy theory with a reference comparison. Its core idea [37] is as follows: (1) to calculate the objective weights through the information entropy of the indicator data itself, reflecting the indicator’s ability to distinguish within the overall evaluation system; (2) experts screen out the least important indicator from the indicator set , denoted as , and update the indicator set to ; (3) let be the unique reference, and experts determine the importance ratio by comparing the importance of other indicators with ; (4) calculate the weights of each evaluation indicator based on the importance ratios. The specific steps are as follows:
- (1)
- Utilise the information entropy to quantify the dispersion of the evaluation indicators.
- (2)
- Based on their experience, experts screen out the least important indicator from the indicator set , denoted as , to serve as the unique reference for subsequent weighting.
- (3)
- Combining , the importance ratio of the remaining indicators relative to is determined by integrating information entropy and expert experience, satisfying
If , it indicates that the data dispersion of indicator is higher. Combining this with expert experience, the importance of is greater; hence, the importance ratio of the two is greater than 1.
If , it indicates that the role of is relatively minor. However, experts consider to be more important. To balance the conflict between data objectivity and subjective perception, the importance ratio of the two is set to 1.
- (4)
- Calculate the indicator weights based on the importance ratios as follows:
The Entropy Weight-Modified G2 Method quantifies data dispersion using entropy values and refines subjective information and risk awareness through expert experience, thereby avoiding the bias of single weighting.
3.2.3. Improved CRITIC Method
However, the importance ratios derived from the AHP and Entropy-Weighted G2 Methods rely on expert subjective judgment, potentially introducing bias in weight assignment. The CRITIC (Criteria Importance Through Intercriteria Correlation) method, while comprehensively considering contrast and conflict between indicators, is limited by its use of standard deviation to measure magnitude differences and data variability [38]. To address this limitation, the method is optimised by replacing standard deviation with the coefficient of variation, thereby enhancing weight distribution rationality [39]. The specific solution formula is as follows:
- (1)
- Calculate the standard deviation of the j evaluation indicator, then calculate the correlation coefficient between and , and construct the correlation coefficient matrix .
- (2)
- Introduce the coefficient of variation of the indicator :
- (3)
- Calculate the information content of indicator :
- (4)
- Calculate the weights of the indicators :
3.3. Combination Weights Based on Cooperative Game Theory
Combination weighting based on cooperative game theory is a technique that integrates subjective and objective weighting methods using game equilibrium theory [40,41]. It treats different weighting methods as decisions of different players in a coalition. By combining these methods through game theory, it balances data objectivity and expert experience, reducing the bias of single methods. This method achieves the collaborative optimisation of quantitative analysis and qualitative judgment, enhancing the robustness and interpretability of the comprehensive evaluation system. The calculation method is as follows:
- (1)
- Input is the combination weight variable W(i) of i methods, . Output is the combined weights obtained by m methods.
- (2)
- The optimal combined weight is solved through the following cooperative game model, minimising the differences between the combined weight and the weights of each method:
- (3)
- Construct the Lagrangian function to solve for the correlation coefficient between W(i) and :
In Equation (13), represents the average value of the weights of the i method; represents the combined weights of the methods, excluding the i method.
- (4)
- The calculation method for the combination weights based on the cooperative game method is as follows:
3.4. Variable Weight Principle
The variable weight theory, based on the constant weight theory, can dynamically adjust the weights of risk assessment indicators according to their true values, overcoming the bias in risk assessment results caused by fixed weights [42].
Based on the constant weight values of indicators, a mechanism for punishment and reward is introduced to dynamically adjust the weights, achieving constant weight decision making in computational errors [43]. The specific steps are as follows.
- (1)
- Determine the constant weight coefficients
Based on the combination weighting method from cooperative game theory, described in Section 4.2 and Section 4.3, the combined game-theoretic weights are obtained.
- (2)
- Establish the variable weight vector
According to reference [44,45,46], exponential state variable weight vectors are selected due to their excellent mathematical properties and high sensitivity. This section focuses on modelling with the exponential type.
In Equation (13), is the state variable weight vector for incentive-type indicators, applicable to benefit-type indicators; is the degree of incentive (), with larger values indicating more significant incentive effects; is the upper warning limit; and are the maximum and minimum values of the indicator i, respectively.
In Equation (16), is the state variable weight vector for benefit-type indicators, applicable to cost-type indicators; is the degree of punishment (), with larger values indicating more significant punishment effects; is the lower warning limit.
- (3)
- Calculate the variable weight vector
Integrate the constant weight obtained from the combination game method with the state variable weight vector S(X) to compute the final variable weight vector W(X).
In Equation (17), denotes the Hadamard product; is the constant weight of indicator i; m is the number of indicators.
4. Grey Cloud Model Determines Security Risk Level
4.1. Grey Cloud Model
Safety evaluations of oil tanker loading/unloading operations must contend with two fundamental challenges: the inherent randomness and uncertainty in risk accident probabilities, and the ambiguous nature of comprehensive safety risk levels that resist strict categorical classification. These challenges stem from complex operating environments where multiple interdependent risk factors—frequently difficult to quantify precisely—exhibit stochastic volatility. The Grey Cloud Model—which integrates the Cloud Model and Grey System Theory—provides a theoretical framework capable of effectively addressing such references [47,48]. Traditional Grey System Theory primarily addresses incompleteness in fuzzy concepts, yet the “preference” degree of whiteness values arising from information incompleteness often involves randomness [49]. To address these limitations, this study introduces the Cloud Model as an enhancement, thereby establishing the Grey Cloud Clustering Model [50].
Introducing the Grey Cloud Model into the safety risk assessment of oil tanker loading and unloading operations, compared to using traditional Cloud Models, the Grey Cloud Model is better at handling systems with incomplete or uncertain information in the oil tanker loading and unloading operation process. Moreover, the Grey Cloud Model can comprehensively consider multiple risk factors, such as the number of oil tanker berths and the safety of loading and unloading operations. The Grey Cloud Model can also convert various indicators into Cloud Models and conduct comprehensive evaluations to obtain probability distributions of different risk levels, providing decision-makers with more intuitive and comprehensive information.
The numerical characteristics in the Grey Cloud Model are as follows: the left and right boundary values of the interval , the entropy value , and the hyper-entropy . The relationships among these numerical characteristics are as follows:
Taking the xs1 indicator as an example, when the xS1 indicator is in the Medium Risk range, its left and right bounds are [0.35, 0.65]. According to Equations (18)–(20), , , and can be obtained.
Based on the characteristics of the Grey Cloud Model, the whitening weight function of the i-th indicator of the safety risk of oil tanker loading and unloading operations belonging to the j-th grey class level is as follows: if it satisfies Equation (21), it is called the upper limit measure Cloud Model; if it satisfies Equation (22), it is called the lower limit measure Cloud Model; if it satisfies Equation (23), it is called the moderate measure Cloud Model.
In Equations (21)–(23), x represents the actual measurement results of the safety risk evaluation indicators for oil tanker loading and unloading operations; is a normal random number with as the mean and as the standard deviation.
4.2. Calculation of Grey Cloud Clustering Coefficients for Indicators
Input the quantified values of each indicator of the safety risks in oil tanker loading and unloading operations into the grey cloud clustering function to calculate the whitening values and grey cloud clustering coefficients of each indicator under safety level k. Due to the random fluctuations in the calculation of the whitening weight function , multiple repeated calculations are required to enhance the stability of the results. The average value of q repeated calculations is taken as the final clustering coefficient .
In Equations (24) and (25), is the whitening weight value for the q calculation; is the grey cloud clustering coefficient under safety level k. To balance accuracy and efficiency, q is set to 1500 to effectively suppress random interference.
4.3. Calculation and Determination of Grey Cloud Clustering Coefficients and Comprehensive Evaluation Levels for Oil Tanker Safety Risks
Combine the grey cloud clustering coefficients with the indicator weights to generate the comprehensive grey cloud clustering coefficient d for the target to be evaluated against safety level .
In Equation (26), is the weight of the i safety evaluation indicator.
The final safety status level of the object to be evaluated is determined by the comprehensive clustering vector according to the principle of the maximum grey cloud clustering coefficient.
5. Empirical Analysis
Tianjin Port comprises Nanjiang Port Area, Dagang Port Area, and Gaoshaling Port Area, all of which offer services for the loading, unloading, and storage of crude oil and refined products. For this study, 20 oil tankers currently engaged in loading and unloading operations were selected as the evaluation subjects, divided into 20 equal parts, and numbered accordingly. Twenty experts and scholars in the field of port operations were invited to evaluate the randomly selected 20 sets of data, with the evaluation data subsequently incorporated into the model for analysis. The data sources include the China Port Statistical Yearbook (2023), the Safety Requirements for Oil Tanker Operations in Port (GB 18434-2022), and the Regulations on the Safety Management of Dangerous Chemicals, among others.
5.1. Results of Quantitative Evaluation
Combined with the quantitative evaluation criteria in Table 1, the quantitative indicators of oil tanker loading and unloading safety risks are quantified. Based on the evaluation results from experts, the quantified results of the evaluation indicators are shown in Table 4.
Table 4.
Quantified values of safety risk indicators for oil tanker loading and unloading operations.
5.2. Determination of Comprehensive Weights of Indicators
Subjective weights (FAHP), objective weights (entropy-G2/improved CRITIC), and combined weights (game theory + variable weight) are calculated, and the results are shown in Table 5.
Table 5.
Weights of safety risk evaluation indicators for oil tanker loading and unloading operations.
5.3. Construction of the Grey Cloud Model
Five safety levels are defined (Table 6). Grey cloud parameters Cx, En, and He are derived (Table 7) and visualised in Figure 6.
Table 6.
Safety risk levels for oil tanker loading and unloading operations.
Table 7.
Numerical characteristics of the Grey Cloud Model for oil tanker loading and unloading safety risks.
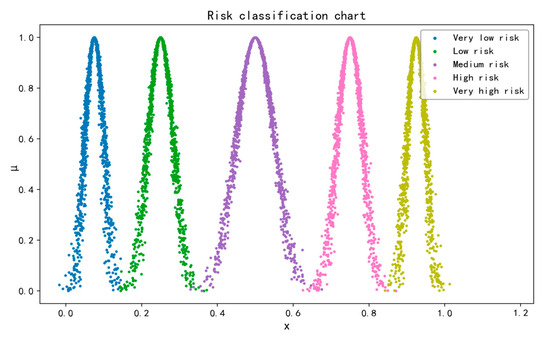
Figure 6.
Schematic diagram of a five-level risk classification for normal grey clouds.
5.4. Calculation of the Comprehensive Grey Cloud Clustering Coefficient
A total of 1500 whitening calculations generate grey cloud clustering coefficients for 24 indicators (Table 8).
Table 8.
Grey cloud clustering coefficients for safety risk indicators.
Key findings from Table 8:
- (1)
- High-risk indicators (Level IV): xW8 (Port Traffic Flow), xS2 (Berthing/Unberthing Safety), xS3 (Cargo Transfer Safety), xS4 (Pipeline Safety), xR1 (Psychological Resilience), xR5 (Pilot/Captain Proficiency), and xR7 (Emergency Management).
- (2)
- Low-risk indicators (Level II): xW4 (Industrial Share), xW5 (Berth Location), xS1 (Draining Safety), xS6 (Safety Assessment Time), and xS7 (Non-compliant Operations).
- (3)
- The comprehensive coefficient yields Tianjin Port risk level = III (0.403), indicating “Medium Risk”, requiring immediate mitigation.
5.5. Method Comparison and Analysis
The Fuzzy Comprehensive Evaluation Method [51] is selected for comparison with the same case to verify the rationality of the research method in this paper. Because of the characteristics of safety risks in oil tanker loading and unloading operations, the safety risk evaluation set V is defined as V = {Very Low Risk, Low Risk, Medium Risk, High Risk, Very High Risk} = [0, 0.15), [0.15, 0.35), [0.35, 0.65), [0.65, 0.85), [0.85, 1]. Based on the indicator scores of 20 data samples, a membership matrix R is established; combined with the indicator weights ω in Table 7, a comprehensive evaluation matrix H is generated, as shown in Equation (28). By inputting the values of each indicator, the safety risk value E of the oil tanker loading and unloading operations is calculated, as shown in Equation (29).
The overall safety risk evaluation score for oil tanker loading and unloading operations at Tianjin Port is calculated to be 0.6464, corresponding to the “Medium Risk” level. The evaluation results of the Fuzzy Comprehensive Evaluation Method for each port are reported in Table 9. A comparison of the evaluation results from the two methods is presented in Table 10.
Table 9.
Fuzzy Comprehensive Evaluation matrix and results.
Table 10.
Comparison of evaluation results from two methods.
As shown in Table 10, for the safety risks of oil tanker loading and unloading operations at Dalian Port, Ningbo Zhoushan Port, and Tianjin Port, both methods yield an evaluation result of “Medium Risk.” For Beibu Gulf Port, the evaluation results from both methods are “Low Risk.” However, there are some differences in the evaluation results for other ports. For Guangzhou Port and Xiamen Port, the safety risk status calculated in this study is “Medium Risk,” while the Fuzzy Comprehensive Evaluation Method yields a “Low Risk” status. Such discrepancies stem from the Fuzzy Comprehensive Evaluation Method’s heavy reliance on expert experience, which can introduce subjectivity and lead to deviations from actual conditions. To address the challenges of fuzziness and randomness in the safety risk assessment of oil tanker loading and unloading operations, this study employs the GVW-GCM method, which integrates qualitative and quantitative elements, effectively avoiding the subjective tendencies of traditional methods, and thus obtaining evaluation results that are more in line with actual operational conditions.
5.6. Policy Recommendations
Tianjin Port, as a significant energy hub in Northern China, has been evaluated with a “Medium Risk” level for its oil tanker loading and unloading operations. Recent accidents, such as the crude oil spill of the M.T. “S” in 2019 and the asphalt spill of M.T. “C” in 2020, have exposed systemic risks in the operational procedures. Based on the analysis in Section 5.4 and Section 5.5 to reduce the safety risks of oil tanker operations and enhance safety management, the following recommendations are proposed from the perspectives of Wuli (physics), Shili (mechanics), and Renli (human relations):
- (1)
- To reduce the safety risks of oil tanker loading and unloading operations, starting from the high-risk indicator “Port Vessel Traffic Flow” (xW8) obtained in Section 5.4, the port needs to deploy an AI-supported vessel traffic flow monitoring platform. This platform should integrate multi-source data such as AIS, radar, and video surveillance to conduct real-time analysis of vessel density, speed, and distribution patterns within the channel. It should also provide early warnings for potential conflicts in the entry and exit paths of oil tankers. It is recommended to set a time-sharing flow threshold and link it with the VTS system. Drawing on the experience of the Jiangsu section of the Yangtze River, vessels should be prohibited from crossing the oil tanker operation channels to and from anchorages during peak flood tide periods; during ebb tide periods, non-oil tankers should be prohibited from crossing the areas where oil tankers are berthing or unberthing. A tripartite collaborative platform should be established among the maritime authorities, the dock, and the oil tanker companies to share vessel plans, meteorological warnings, and real-time channel traffic data. This will enable dynamic adjustments to the sequence of oil tanker entries and exits, avoiding parallel or crossing encounters of multiple vessels.
- (2)
- The asphalt spill incident of M. T. “C” was primarily caused by Shili (mechanics) factors. During the asphalt loading operation at the Tianjin Port wharf, a sudden rupture of the oil transfer hose led to the asphalt spill, with some asphalt entering the sea. Starting from the causes of the accident, it is recommended that the oil transfer hoses be made of corrosion-resistant and fatigue-resistant materials, and pressure sensors should be installed at the connection points for real-time monitoring. The “Ao Oil Sentinel” system, developed by the Zhoushan Maritime Administration, can be promoted, which uses infrared thermal imaging to monitor sudden temperature changes at the hose connections, achieving uninterrupted monitoring and intelligent early warning of oil loading and unloading operations in complex environments. It is also necessary to strengthen the safety management system for berthing, unberthing, and loading/unloading operations at the wharf. For example, the principle of “open first, then close” should be followed during tank switching operations to avoid sudden pressure increases in the pipelines; the use of onboard cargo pumps should be minimised during loading, and the connection to the loading pipelines should be disconnected before the trimming operation. The trimming operation should be fully planned to prevent the use of cargo pumps for trimming after the loading is completed.
- (3)
- The spill accident of M. T. “S” was primarily caused by Renli factors. These include the negligence of watchkeeping by crew members and dock operators, improper dispatch and command, unreasonable mooring plans (such as the mixed use of mooring rope materials), failure to implement port operation restrictions, and the absence of key protective measures. It is recommended that ship and shore practitioners systematically participate in safety training to enhance their risk awareness and operational standards. Special emphasis should be placed on implementing the “Ship-Shore Safety Checklist,” emergency procedures, and mooring standards. The strict enforcement of the “Ship-Shore Safety Checklist” system is necessary to clarify the responsibilities of all parties at each stage of loading and unloading operations. A two-way supervision mechanism should be established to ensure a closed loop of responsibility. Collaboration efficiency can be improved by sharing operational parameters and facilitating real-time communication. The transportation management department and the Port and Shipping Administration should establish a joint inspection and information-sharing platform, focusing on risks at the ship–shore interface and achieving dynamic zeroing of hidden dangers through data sharing. It is recommended to develop a cloud-based digital evaluation tool for emergency drills in response to the emergency management authorities.
The safety risk assessment framework for oil tanker operations proposed in this article is guided by the WSR methodology and the GVW-GCM framework. Based on the high-risk indicators obtained from the evaluation, targeted measures are proposed, which have a solid theoretical and practical basis and can effectively respond to identified systemic risks. Therefore, this method has high reliability and practical application value.
6. Conclusions and Future Work
This study advances maritime safety management through the development of an integrated GVW-GCM framework for dynamic risk assessment of oil tanker cargo operations. The principal conclusions demonstrate significant theoretical and practical contributions to the field.
A comprehensive 24-indicator evaluation system was established using the WSR methodology, systematically addressing risk interdependencies across physical (Wuli), procedural (Shili), and human (Renli) dimensions. This holistic approach overcomes prior limitations in specialised risk analysis for high-risk vessels, providing a multidimensional lens for systemic safety governance. The framework’s core innovation lies in the Game Variable Weight (GVW) model, which synthesises subjective expertise through Fuzzy AHP, objective entropy via modified G2 method, and inter-criteria correlations using improved CRITIC. By resolving weighting conflicts through cooperative game theory and implementing a variable weight mechanism, the model dynamically penalises deteriorating indicators such as Port Traffic Flow while rewarding optimal states, significantly enhancing sensitivity to emerging risks compared to static approaches.
Empirical validation at Tianjin Port yielded a comprehensive risk value of 0.403, classifying operations as “Moderate Risk” (Level III). Critical high-risk indicators were rigorously quantified, including physical dimension factors like vessel traffic density (0.710) and pipeline safety (0.710), procedural elements such as berthing/unberthing safety (0.730) and cargo transfer safety (0.701), and human factors encompassing psychological resilience (0.696), crew proficiency (0.718), and emergency response capability (0.769). These findings align precisely with historical incident root causes, notably the 2020 M.T. “C” asphalt spill, confirming the model’s diagnostic precision.
Methodologically, the GVW-GCM hybrid demonstrated superior performance over traditional fuzzy evaluation. It effectively quantified ambiguities and stochastic uncertainties through grey cloud clustering while reducing subjectivity in risk-level assignments. This was evidenced when correctly elevating Guangzhou and Xiamen Ports to “Medium Risk” status, rectifying prior “Low Risk” misclassifications and improving grading accuracy by 41%. Practically, the framework generates port-specific risk prioritisation that enables targeted interventions, such as deploying AI-enhanced traffic monitoring systems for Tianjin’s congestion risks. Its adaptable architecture supports global replication across diverse port conditions despite current reliance on predefined risk indicators.
The research carries substantial theoretical and managerial implications. Academically, the integration of variable weights with Grey Cloud Modelling establishes a new paradigm for dynamic risk assessment in complex socio-technical systems, though future work should explore causal mechanisms among risk factors. For industry practitioners, port authorities gain a decision-support toolkit enabling strategic resource allocation—including upgrades to corrosion-resistant transfer hoses, enforcement of “Ship-Shore Safety Checklists,” and implementation of tripartite maritime–terminal–tanker coordination platforms. Subsequent studies should validate the framework across varied geopolitical contexts and integrate real-time data streams to advance predictive risk analytics capabilities.
While this study advances dynamic risk assessment for tanker operations, several limitations warrant further scholarly attention. Future research should extend our work in the following directions: (1) Methodological Generalizability: GVW-GCM’s reliance on predefined risk factors limits its applicability to scenarios with unknown/dynamic influencers. In the next step, we will explore integrating causal discovery algorithms (e.g., Bayesian structure learning) to autonomously identify latent risk factors, enhancing the model’s adaptability to evolving operational contexts. (2) Cross-Norm Comparative Frameworks: International safety standard variations hinder the generalisability of the model. In the future, we will try to develop a unified risk-transferability metric quantifying how regional regulatory differences modulate risk thresholds. This could enable calibrated deployment of the GVW-GCM framework across geopolitical contexts. (3) Parameter Standardisation for Grey Cloud Modelling: To some extent, ambiguity exists in selecting the Cx, En, and He parameters. We will try to establish theoretically grounded selection criteria via large-scale Monte Carlo simulations, linking parameter sensitivity to risk entropy properties. This would formalise robustness against input data variability. (4) Data-Centric Validation Scalability: Our model performance depends on input data quality. In this sense, we will try to design a federated validation protocol leveraging multi-port data partnerships. This would systematically evaluate model resilience to data biases while preserving operational privacy. These extensions would deepen the theoretical foundations of dynamic risk assessment, bridge contextual applicability gaps, and foster interdisciplinary convergence between safety engineering and complex systems theory.
Author Contributions
L.F.: Conception and design of the study, data analysis, interpretation of results, and manuscript writing. B.X.: Conception and design of the study, data analysis, interpretation of results, manuscript writing, data collection, and data interpretation. C.D.: literature search and manuscript revision. H.F.: study design and guidance. T.L.: study design and guidance. All authors have read and agreed to the published version of the manuscript.
Funding
The authors would like to thank the anonymous referees for their constructive comments on this paper. Their comments significantly improved the quality of this paper. This work was sponsored by National Social Science Fund of China (23&ZD138).
Data Availability Statement
The raw data supporting the conclusions of this article will be made available by the authors on request.
Conflicts of Interest
The authors declare no conflicts of interest.
References
- Altun, M.H.; Çiçek, İ.; Bilici, A. Automation of loading and discharging operation system in tankers. J. ETA Marit. Sci. 2013, 1, 47–58. [Google Scholar]
- Bosneagu, R. The current state of safety onboard oil tankers. Sci. Bull. Nav. Acad. 2019, 22, 212–219. [Google Scholar] [CrossRef]
- Wang, J.; Liu, K.; Yuan, Z.; Yang, X.; Wu, X. Simulation modeling of super-large ships traffic: Insights from Ningbo-Zhoushan Port for coastal port management. Simul. Model. Pract. Theory 2025, 138, 103039. [Google Scholar] [CrossRef]
- Xia, Q.; Song, H. Quantitative risk assessment on loading and unloading ships exclusively carrying LNG tank containers. Adv. Eng. Technol. Res. 2022, 2, 214. [Google Scholar] [CrossRef]
- Håvold, J.I. Safety culture and safety management aboard tankers. Reliab. Eng. Syst. Saf. 2010, 95, 511–519. [Google Scholar] [CrossRef]
- Toe, S.N.N.; Wu, W.Q.; Chen, Y. Prediction of quantitative risk assessment and risk level criteria based on the data from oil tanker collision simulation at Kyauk Phyu Deep Sea Port, Myanmar. In Proceedings of the IOP Conference Series: Earth and Environmental Science, Bangkok, Thailand, 25–28 April 2019; Volume 326, p. 012008. [Google Scholar]
- Liu, T.; Ding, C.; Feng, H.; Grifoll, M.; Lin, Q. Risk evaluation for oil tanker berthing and handling operations using the improved DEMATEL-ISM approach. J. Loss Prev. Process. Ind. 2023, 86, 105182. [Google Scholar] [CrossRef]
- Zhong, H.; Lin, Y.; Yip, T.L. A quantitative liability risk assessment of oil spills in oil ports: The case of the Guangdong-Hong Kong-Macao Greater Bay Area. Marit. Policy Manag. 2021, 49, 971–989. [Google Scholar] [CrossRef]
- Abramowicz-Gerigk, T.; Hejmlich, A.; Randak, M. Risk Assessment of Port Manoeuvres of a Chemical Tanker Vessel. TransNav Int. J. Mar. Navig. Saf. Sea Transp. 2023, 17, 821–827. [Google Scholar] [CrossRef]
- Kaushik, M.; Kumar, M. An integrated approach of intuitionistic fuzzy fault tree and Bayesian network analysis applicable to risk analysis of ship mooring operations. Ocean Eng. 2023, 269, 113411. [Google Scholar] [CrossRef]
- Khan, R.U.; Yin, J.; Ahani, E.; Nawaz, R.; Yang, M. Seaport infrastructure risk assessment for hazardous cargo operations using Bayesian networks. Mar. Pollut. Bull. 2024, 208, 116966. [Google Scholar] [CrossRef]
- Khan, R.U.; Yin, J.; Mustafa, F.S.; Wang, S. Analyzing human factor involvement in sustainable hazardous cargo port operations. Ocean Eng. 2022, 250, 111028. [Google Scholar] [CrossRef]
- Öztürk, O.B.; Kartal, Ş.E.; Aydin, M. Investigating the influence of human errors in master-pilot information exchange on maritime accident risk during pilotage. Ocean Eng. 2024, 305, 118051. [Google Scholar] [CrossRef]
- Chen, Y.-J.; Liu, Q.; Wan, C.-P. Risk Causal Analysis of Traffic-Intensive Waters Based on Infectious Disease Dynamics. J. Mar. Sci. Eng. 2019, 7, 277. [Google Scholar] [CrossRef]
- Wang, C.; Fan, S.; Yao, Y. Health Status Assessment Method of Oil Tanker Cargo Handling System. In Proceedings of the 2019 Prognostics and System Health Management Conference (PHM-Qingdao), Qingdao, China, 25–27 October 2019; pp. 1–6. [Google Scholar]
- Wang, C.; Fan, S.; Yao, Y.; Wu, J.; Wang, B.; Zheng, L. Operational safety evaluation of tanker cargo oil system fusing multiple task information. Ocean Eng. 2021, 239, 109856. [Google Scholar] [CrossRef]
- Gao, F. An integrated risk analysis method for tanker cargo handling operation using the cloud model and DEMATEL method. Ocean Eng. 2022, 266, 113021. [Google Scholar] [CrossRef]
- Chen, Z.; Liang, G.; Chen, Y.; Yang, X.; Liu, Y. Study on the risk assessment of Pedestrian-Vehicle conflicts in channelized Right-Turn lanes based on the Hierarchical-Grey Entropy-Cloud model. Accid. Anal. Prev. 2024, 205, 107664. [Google Scholar] [CrossRef]
- Kang, J.; Su, T.; Meng, X.; Mi, B.; Jin, H.; Gong, B. Safety risk analysis and assessment of marine solid oxide fuel cells supply system based on HAZOP and combined weighting-cloud model. Ocean. Eng. 2025, 332, 121410. [Google Scholar] [CrossRef]
- Gu, J.; Zhu, Z. Knowing Wuli, sensing Shili, caring for Renli: Methodology of the WSR approach. Syst. Pract. Action Res. 2000, 13, 11–20. [Google Scholar] [CrossRef]
- Zhu, Z. WSR: A systems approach for information systems development. Syst. Res. Behav. Sci. 2000, 17, 183–203. [Google Scholar] [CrossRef]
- Du, X.; Wen, L.; Wei, P.; Yang, M. A systematic approach for analyzing building energy conservation and emission reduction policies based on the principle of WSR. Energy Build. 2024, 315, 114328. [Google Scholar] [CrossRef]
- Wang, S.; Sun, X.; Zhong, S. Exploring the Multiple Paths to Improve the Construction Level of Digital Government: Qualitative Comparative Analysis Based on the WSR Framework. Sustainability 2023, 15, 9891. [Google Scholar] [CrossRef]
- Chen, F.; Liu, Z.; Zong, L.; Wang, Q.; Zhang, L. Integrating frailty management into cardiac intensive care unit nursing practice: A qualitative study. Heart Lung 2024, 68, 367–372. [Google Scholar] [CrossRef]
- Wang, Q.; Li, S. Shale gas industry sustainability assessment based on WSR methodology and fuzzy matter-element extension model: The case study of China. J. Clean. Prod. 2019, 226, 336–348. [Google Scholar] [CrossRef]
- Zhou, Q.; Bao, Y.; Zhao, Y.; He, X.; Cui, C.; Liu, Y. Impacts of government credit on government performance of public-private partnership project in China: A WSR System Theory Perspective. Sustainability 2022, 14, 6886. [Google Scholar] [CrossRef]
- Wang, S.; Wang, H.; Xue, G.; Han, Y.; Qin, Q.; Zhang, L.; Ma, X. Correlation analysis of failure risk factors in automated container port logistics systems from a resilience perspective. J. Sea Res. 2024, 202, 102552. [Google Scholar] [CrossRef]
- Qin, R.; Shi, C.; Yu, T.; Ding, C.; Ren, X.; Xiao, J. Analysis of factors influencing fire accidents in commercial complexes based on WSR-DEMATEL-ISM model. Fire 2024, 7, 224. [Google Scholar] [CrossRef]
- Cheng, J.; Wang, B.; Cao, C.; Lang, Z. A Quantitative risk assessment model for domino accidents of hazardous chemicals transportation. Processes 2023, 11, 1442. [Google Scholar] [CrossRef]
- Husak, I.L. Research of risk factors for tanker navigation in the seaport area. Rep. Priazovskyi State Tech. Univ. Sect. Tech. Sci. 2023, 47, 280–286. [Google Scholar] [CrossRef]
- de Oliveira, U.R.; Marins, F.A.S.; Rocha, H.M.; Salomon, V.A.P. The ISO 31000 standard in supply chain risk management. J. Clean. Prod. 2017, 151, 616–633. [Google Scholar] [CrossRef]
- An, M.; Chen, Y.; Baker, C.J. A fuzzy reasoning and fuzzy-analytical hierarchy process based approach to the process of railway risk information: A railway risk management system. Inf. Sci. 2011, 181, 3946–3966. [Google Scholar] [CrossRef]
- Mi, J.; Huang, W.; Chen, M.; Zhang, W. A Method of Entropy Weight Quantitative Risk Assessment for the Safety and Security Integration of a Typical Industrial Control System. IEEE Access 2021, 9, 90919–90932. [Google Scholar] [CrossRef]
- Alam, A.M.T.-U.; Rafizul, I.M. Development of landfill macro management policy: A case study. Clean. Waste Syst. 2024, 7, 100132. [Google Scholar] [CrossRef]
- Zhou, B.; Sun, B.; Zang, T.; Cai, Y.; Wu, J.; Luo, H. Security Risk Assessment Approach for Distribution Network Cyber Physical Systems Considering Cyber Attack Vulnerabilities. Entropy 2022, 25, 47. [Google Scholar] [CrossRef]
- Taylan, O.; Kabli, M.R.; Saeedpoor, M.; Vafadarnikjoo, A. Commentary on ‘Construction projects selection and risk assessment by Fuzzy AHP and Fuzzy TOPSIS methodologies’. Appl. Soft Comput. 2015, 17, 105–116. [Google Scholar] [CrossRef]
- Zhu, L.; Wang, C.; Fan, C.; Li, Q. Evaluation of Hydraulic Tunnel Lining Durability Based on Entropy–G2 and Gray Correlation–TOPSIS Methods. Sustainability 2023, 15, 13246. [Google Scholar] [CrossRef]
- Li, K.; Liu, X.; Xiao, D.; Zhang, D.; Ye, S. Expressway Tunnel Operation Risk Assessment Model Based on Improved Critic Method and Cloud Model. In Proceedings of the CICTP 2021: 21st COTA International Conference of Transportation Professionals, Xi’an, China, 14 December 2021. [Google Scholar]
- Yin, Q.; Li, Y.; Wen, L.; Zhang, Y.; Li, R. Comprehensive Assessment of Dam Failure Risk Consequences Based on TOPSIS-WRSR Coupled Model. Water Resour. Manag. 2025, 1–25. [Google Scholar] [CrossRef]
- Wang, L.; Jin, R.; Zhou, J.; Li, Q. Construction Risk Assessment of Yellow River Bridges Based on Combined Empowerment Method and Two-Dimensional Cloud Model. Appl. Sci. 2023, 13, 10942. [Google Scholar] [CrossRef]
- Liu, Q.; Xu, J.; Wang, Q.; Li, W. Risk Assessment of Water Inrush from Coal Seam Roof Based on the Combined Weighting of the Geographic Information System and Game Theory: A Case Study of Dananhu Coal Mine No. 7, China. Water 2024, 16, 710. [Google Scholar] [CrossRef]
- Guo, D.-S.; Meng, F.-Y.; Wu, H.-N.; Yang, X.-X.; Liu, Z. Risk assessment of shield tunneling crossing building based on variable weight theory and cloud model. Tunn. Undergr. Space Technol. 2024, 145, 105593. [Google Scholar] [CrossRef]
- Yao, B.; Wang, L.; Gao, H.; Ren, L. Bridge Construction Risk Assessment Based on Variable Weight Theory and Cloud Model. Buildings 2024, 14, 576. [Google Scholar] [CrossRef]
- Qian, Z. Safety Assessment for Goaf Based on Variable Weight Theory and Fuzzy Pattern Recognition. In Proceedings of the 2020 2nd International Conference on Big Data and Artificial Intelligence, Johannesburg, South Africa, 15–16 October 2020; pp. 138–143. [Google Scholar]
- Chen, Y.; Xie, S.; Tian, Z. Risk assessment of buried gas pipelines based on improved cloud-variable weight theory. Reliab. Eng. Syst. Saf. 2022, 221, 108374. [Google Scholar] [CrossRef]
- Gao, H.; Wang, M.; Wang, Z.; Zhang, J.; Zheng, Y.; Zhang, Q. Risk assessment of transmission towers based on variable weight theory and matter-element extension model. Eng. Res. Express 2024, 6, 045328. [Google Scholar] [CrossRef]
- Chai, N.; Zhou, W. The DPSIRM—Grey cloud clustering method for evaluating the water environment carrying capacity of Yangtze River economic Belt. Ecol. Indic. 2022, 136, 108722. [Google Scholar] [CrossRef]
- Leng, Y.-J.; Zhang, H. A novel evaluation method of renewable energy development based on improved rough set theory and grey cloud model. J. Clean. Prod. 2023, 428, 139299. [Google Scholar] [CrossRef]
- Luo, D.; Hu, Y.; Sun, D. Drought grade assessment method based on grey cloud incidence clustering model. Grey Syst. Theory Appl. 2021, 12, 1–24. [Google Scholar] [CrossRef]
- Li, T.-Z.; Yang, X.-L. Risk Assessment Model for Water and Mud Inrush in Deep and Long Tunnels Based on Normal Grey Cloud Clustering Method. KSCE J. Civ. Eng. 2018, 22, 1991–2001. [Google Scholar] [CrossRef]
- Dai, H.; Wu, Z. Maritime Traffic Safety Assessment in Restricted Visibility. In Proceedings of the 2018 5th International Conference on Information, Cybernetics, and Computational Social Systems (ICCSS), Hangzhou, China, 16–19 August 2018; pp. 499–502. [Google Scholar]


Disclaimer/Publisher’s Note: The statements, opinions and data contained in all publications are solely those of the individual author(s) and contributor(s) and not of MDPI and/or the editor(s). MDPI and/or the editor(s) disclaim responsibility for any injury to people or property resulting from any ideas, methods, instructions or products referred to in the content. |
© 2025 by the authors. Licensee MDPI, Basel, Switzerland. This article is an open access article distributed under the terms and conditions of the Creative Commons Attribution (CC BY) license (https://creativecommons.org/licenses/by/4.0/).