Abstract
As the scale of missions continues to expand, equipment support has emerged as a critical component of military combat effectiveness. Consequently, the supportability of a system of systems (SOS) for equipment has become as essential quality requirement alongside its performance metrics. This study systematically assessed the effectiveness of equipment SOS support through a task-driven methodology. Initially, a model for generating equipment support tasks was developed to translate the operational requirements into a sequence of support tasks. Subsequently, a simulation model was constructed to evaluate the equipment SOS support system, and solutions were derived for the corresponding SOS-level support effectiveness indexes. Finally, the feasibility and characteristics of the proposed models and simulation methodology were validated through a case study involving an emergency operational mission for an air combat group formation. The results indicate that the increased reliability of the equipment system correlates with a reduced failure rate and lower resource consumption for maintenance and support per device, thereby improving support efficiency. The methodology presented in this article provides a framework for evaluating the effectiveness of equipment SOS support while facilitating informed decision-making in information warfare conditions.
1. Introduction
With the rapid development of information technology, the applications and complexity of weapon SOSs have considerably increased, thereby necessitating a comprehensive study of whole-weapon SOSs [1,2]. Indeed, the operational effectiveness of a weapon SOS operational network directly affects the outcome of a conflict [3]. As equipment support represents a critical component of combat power, the supportability of an equipment SOS has become as essential a quality requirement as the performance of equipment itself. Software can be employed to simulate realistic and dynamic systems while conducting various tests on system models, thereby facilitating the evaluation and improvement of system performance. Such simulations are user-friendly, require a short time period for analysis, and incur low costs [4,5,6]. References [7,8,9,10,11] examined the planning and scheduling challenges associated with support tasks, primarily concentrating on the single success measurement of the support task itself, with less consideration given to multi-element and multi-process support driven by combat training tasks. Gao et al. [7] established a distributed support task allocation framework, where the allocation model constructed is of good scalability and robustness. Wang et al. [9] constructed a mathematical model with complex constraints and a mechanism for updating the capability of equipment support formations for collaborative task planning, along with a proposed method for task planning. Xing et al. [10] constructed a network model of an equipment support system and conducted task attribute analysis on different nodes in different networks. Using task success as a metric, the task robustness of the equipment support system was analyzed. References [12,13,14,15,16] studied the problem of determining and optimizing the allocation of guarantee resource requirements, primarily focusing on the optimization of a single resource allocation or a single job guarantee resource. Efficiency measurement was often based on the completion of the guarantee process or behavior itself. Wang et al. [14] established a success assessment model for naval fleet missions and provided methods for optimizing the configuration of spare parts. Sheng et al. [15] studied the analysis method for utilizing support work by basic combat units, established an evaluation index system for coordinating and matching the utilization of support resources by basic combat units, and studied the model of average utilization support delay time model for basic combat units. Other scholars [17,18,19,20,21] studied the implementation and optimization of equipment maintenance, with a focus on the planning, allocation, and evaluation of maintenance tasks for basic combat units. However, research on optimizing the relevant elements and processes of task-oriented equipment systems for maintenance is relatively limited. Han et al. [17] proposed a method for evaluating the success of equipment tasks considering maintenance work, and studied the reliability evaluation method for functional unit tasks under the condition of incomplete maintenance, as well as the maintenance evaluation method for repairable unit combination tasks during operational maintenance. Cao et al. [18] proposed a maintenance strategy centered on task success and established an evaluation index system that reflecting their task success. The evaluation assessed the success of training and combat tasks. Guo et al. [19] proposed a simulation model of the preventive maintenance process for basic combat units, which can be used to model and analyze preventive maintenance support plans during the equipment usage stage. Other researchers [22,23,24,25,26,27,28,29,30] studied simulation technology for equipment support, but from the perspective of completing the equipment system’s tasks, the solutions for the entire process and all the elements involved were less comprehensive. Yang et al. [27] proposed a method of determining input parameters based on simulation entities, studied the principles of input parameter sampling experimental design and sensitivity analysis methods, and proposed an input parameter optimization method. Therefore, this article studies the simulation evaluation modeling and case verification of equipment system support effectiveness under task-driven conditions, which has significant practical engineering significance.
These previously published studies indicate that there are three general shortcomings in current equipment support research. Firstly, there is no comprehensive model that covers the entire range from equipment operational training tasks to support activities. There is a particular lack of models that take into account failures, usage support, MX support, and supply support. Secondly, due to the need for complex calculations, the simulation evaluation process is often simplified, but the process data records lack a clear design model. Thirdly, in the simulation process, task-oriented system-level support effectiveness evaluation indicators are relatively scarce, and there are also few corresponding case verifications, analyses, and discussions. Indeed, from the perspective of completing the task of the equipment system, it is urgently needed to pay more attention to building a comprehensive solution that covers the entire process and all relevant elements. Therefore, task-driven modeling should be conducted using the method of simulated case studies to evaluate the effectiveness of equipment SOS support.
This study proposes a method for evaluating the effectiveness of equipment SOS support using military aviation as a target application. Therefore, the primary contribution of this study is to establish a task-driven simulation method for evaluating the effectiveness of equipment SOS support. The core innovation of this contribution lies in designing a support task generation model and an event and state recording model for the quantitative analysis of the dynamic task processes of equipment systems. To simplify the study of this problem, the following assumptions are made in the modeling process: (1) The system task is a multi-stage continuous task that will not be interrupted during the analysis period. (2) Only equipment unit random failures are considered, and damage caused by attacks is not taken into account. (3) Only repair MX is considered in the MX process, not preventive MX, and once repaired, the old equipment is considered new.
The simulation and evaluation of the SOS support effectiveness of task-driven equipment in this study mainly includes the following stages. Firstly, the equipment SOS support task generation model is developed to effectively map the tasks of the equipment system to their corresponding support elements. Secondly, the model employed to evaluate the effectiveness of equipment system SOS is constructed, with the core comprising the recording and calculation of time-series state data; subsequently, system level indicators of support effectiveness are calculated. Finally, a case study is carried out to verify specific tasks, calculate the corresponding indicators, and conduct a sensitivity analysis. This study demonstrates the complex system modeling and simulation technology that can achieve the effectiveness evaluation of device SOS support and assist decision-making in an information-driven environment.
The most important contributions of this paper are that it establishes the mapping relationship between combat mission and support business for the equipment SOS, designs the simulation calculation method of system-level support efficiency indicators, verifies the feasibility of the proposed method, and provides help for system support effectiveness evaluation and auxiliary decision-making, so that system managers can better grasp and guide the realization of system functions.
2. Support Task Generation Modeling
Equipment SOS support task modeling is a discrete, dynamic, complex, and evolutionary process. This study employs an analytical model that organically combines the relevant elements based on the actual operation logic of the system to accurately reflect the state and behavior of the system during the simulation process. From the perspective of systems engineering and based on the construction of a ‘structure and process model’, the simulation modeling method is used to generate and describe the support tasks. A hierarchical structure analysis is employed to decompose and map the system tasks, equipment unit tasks, and support tasks. The equipment SOS considered in this study comprises various types and quantities of basic equipment units (specific pieces of equipment such as aircraft) along with associated support systems that are intricately coupled. The derivation of the support task model begins with the definition of the mission for the equipment SOS, which is subsequently decomposed and distributed to the equipment units, thereby triggering failure, OP, MX, or supply activities as appropriate during the mission. Each of these activities is described by a corresponding task model. The resultant SOS support task generation model is shown in Figure 1.
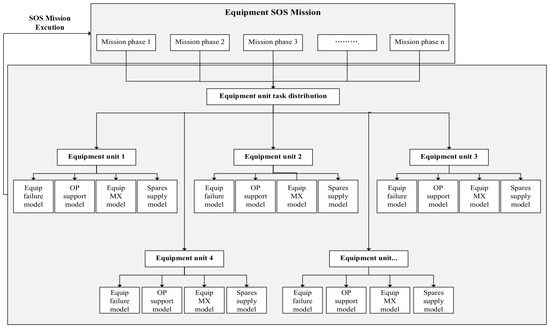
Figure 1.
SOS support business generation model.
In the proposed model, the mission is decomposed and mapped to the basic equipment units in a layer-by-layer approach, taking the equipment SOS that completes the mission as the object of study and assuming multi-phase mission advancement as its logical progression. As the mission time advances, the equipment SOS will be adjusted according to the mission requirements. Therefore, the support task generation process takes the operation mission scenario as the beginning point for input and dynamically couples mission-related elements, such as MX support organization, equipment unit MX control, support action implementation, support resource utilization, and support command, to facilitate the study of the emergence and evolution rules.
The design of the support service execution and simulation evaluation is shown in Figure 2. During the execution of an aviation mission, the support system implements MX support, completes MX tasks, and transforms the equipment unit requiring repair to meet the specified technical conditions for each unit within the SOS. The support system additionally provides resources such as aviation spare parts, accessory oil, and information describing environmental conditions. As mission time progresses and events unfold, support decisions and adjustments are made in accordance with the support requirements of the basic equipment units and the evolution of the entire support situation. Once an equipment unit is repaired, it is returned to service until the equipment SOS mission is completed. The internal state change in the support task process occurs at discrete time points or quantized intervals. The primary objective of this process modeling is to describe the events that cause changes in the SOS state and determine their logical relationships. The logical progression of the simulation triggers changes in the SOS state according to the logical relationships among various events within the considered time-wise sequences, thereby representing the SOS state dynamically and facilitating the study of evolution and emergence patterns.
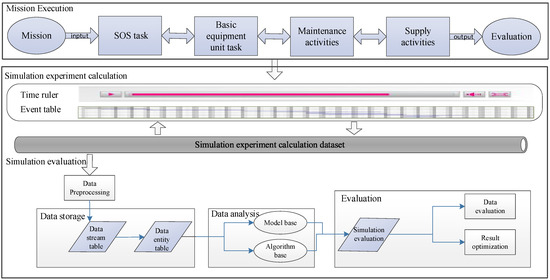
Figure 2.
Support service execution and simulation evaluation design.
3. Support Effectiveness Evaluation Model
Corresponding to the support task logic, the support effectiveness evaluation model incorporates a promotion mechanism based on the general time cycle and a trigger mechanism based on the event. The promotion mechanism represents the primary thread of guaranteed task operation. The basic time slice is set according to the time characteristics of the guaranteed task. As the primary thread progresses, events generated within each time period are continuously completed, and as the continuous time slice advances, equipment support tasks are completed. Consequently, the equipment support task process accordingly represents a typical discrete event occurrence and processing process that employs the continuous time slice to drive the activities for different tasks and change the relevant statuses. The fundamental aspect of designing support effectiveness evaluation models is the accurate recording and interpretation of time-series state data.
A complete set of indexes is required to characterize equipment SOS support effectiveness. Previous studies [31,32] constructed a four-level supportability index system for equipment SOSs and provided the equations for three secondary SOS-level indices: equipment SOS RR, OA, and MCP (equipment SOS Reliability Rate (RR), Operational Availability (OA), and Maintenance Completion Percentage (MCP)). This study, therefore, developed a simulation evaluation model for these three indices.
The resulting model for equipment SOS evaluation includes the recording of equipment SOS states and the calculation of SOS supportability indices, each comprising five distinct steps, as shown in Figure 3: (1) recording of time-wise sequence state data for a basic equipment unit within a meta-state cycle; (2) recording of time-wise sequence state data for a basic equipment unit within a mission cycle; (3) recording of time-wise sequence state data for the equipment SOS and equipment unit within the mission cycle; (4) in the device SOS task cycle, use of time-sequenced states and timing data to generate the maintainability index; and (5) computational simulation of the SOS supportability indices. The steps are described in detail as follows.
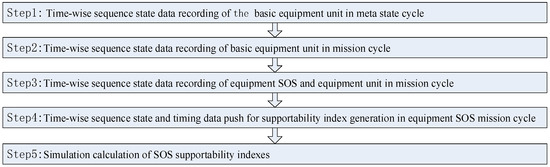
Figure 3.
Equipment SOS support simulation evaluation steps.
Step 1 is to record time-series state data for the basic equipment units according to the meta-state cycle shown in Figure 4, guided by the model. The meta-state cycle refers to the complete process of equipment normal operation, failure, maintenance start (MX), and restart. The events and times recorded during this cycle provide the basis for subsequent statistical calculations. The meta-state cycle of the basic equipment unit is denoted by , and for an aircraft, it describes the entire process from operation to failure, to maintenance start, waiting for spare parts, and completion of maintenance. The value depends on the failure probability, MX time, spare part supply time, and the available operating time (OP) of the aircraft.
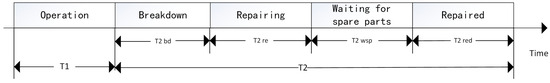
Figure 4.
Time-wise sequence state data recording model of a basic equipment unit in the meta-state cycle.
In Figure 4, denotes the normal working time of the equipment unit; denotes the time when the equipment cannot operate normally, defined as ; denotes the equipment failure time; denotes the equipment MX time; denotes the equipment waiting time for spare parts; and denotes the MX time after the arrival of spare parts.
Step 2 records the time-wise sequence state data of the basic equipment unit in a mission cycle using the model shown in Figure 5. The basic equipment unit’s task cycle refers to the total time required for the equipment to complete its assigned task. Recording the various state changes in the equipment unit during the task cycle is the basis for the subsequent statistical and calculation of the resource consumption of this type of equipment. The time-wise sequence state of a basic equipment unit during the mission cycle is composed of several , with the total record time being the simulation time corresponding to the aircraft mission period. The basic states to be recorded include tasks, equipment, organization, personnel, resources, and events.
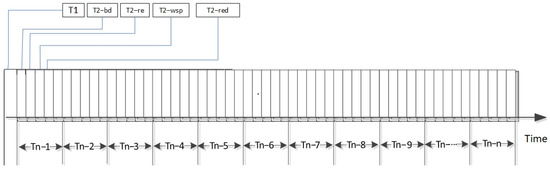
Figure 5.
Time-wise sequence state data recording model of a basic equipment unit in a mission cycle.
In Figure 5, denotes the number of state cycles for the basic equipment unit, and a combination of cycles provides different state time sequences throughout the entire mission period.
During the simulation propagation process, various basic equipment unit states occur according to their corresponding probabilities. For the application considered in this study, the basic equipment unit may be in one of the twelve states listed in Figure 6, where the normal shutdown and normal operation of an aircraft represent readiness states and the remaining states represent unreadiness states.
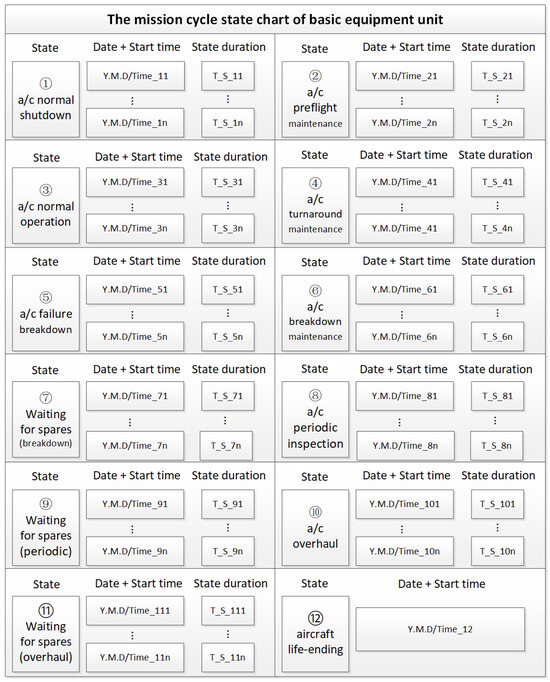
Figure 6.
Mission cycle state chart for a basic equipment unit.
In Figure 6, denotes the start time of the n-th state of the n-th equipment unit, and denotes the duration of the n-th state of the n-th equipment unit.
Step 3 records the time-wise sequence state data of the equipment SOS and equipment units within a mission cycle using the model shown in Figure 7. An equipment SOS comprises several basic equipment units in actual tasks, such as ten aircraft equipment units of the same type. The equipment system considered in this study consists of ten aircraft equipment units from two distinct types. The time-wise sequence states of the equipment SOS are determined by the combination of the time-wise sequence states of its basic equipment units, with the recording rate established based on the minimum time step of the simulation. In accordance with the requirements of simulation granularity, the recording mode can be adjusted along the event time. The SOS state at time () is represented as and the equipment unit state at time () is represented as .
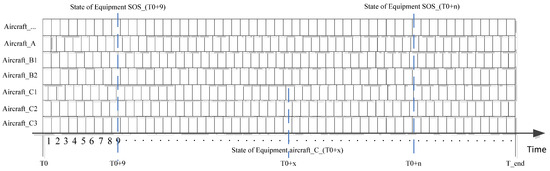
Figure 7.
Time-wise sequence state data recording model for equipment SOS and basic equipment units in a mission cycle.
Step 4 involves a time-wise sequence state and timing data analysis to generate the supportability indices for the equipment SOS mission cycle. The calculation of system supportability indices are the core work of the equipment SOS support simulation evaluation; it is based on the process data recorded in Steps 1 to 3. Here, the calculation program is designed to read the initial static basic information describing the equipment unit, as well as the time and state characteristic data describing the equipment system simulation process data, subsequently pushing them to the state judgment module for each unit (aircraft) type. The main judging items include whether the equipment unit is available and whether the equipment SOS is available. This information will be provided to the calculation module for each system level indicator, for the purpose of indicator calculation and analysis.
The index calculation utilizes mission data and equipment data, with the judgment logic encompassing the aircraft type, aircraft mission state, and SOS mission state. If the mission requires the dispatch of aircraft from a certain type of equipment unit to perform tasks during a certain mission phase, then n aircraft () should be dispatched; if there are always more than aircraft operating normally during the mission phase, both the aircraft type and SOS will be regarded as available.
When the number of available aircraft is less than k, the aircraft type is deemed unavailable and the SOS is consequently defined as unavailable. If any aircraft type is classified as unavailable, then the equipment SOS comprising all aircraft types will also be considered unavailable. To determine this availability, recorded time-wise sequence states and timing data are pushed to the simulation calculation module, which identifies the status and timing, and converts them into logic judgment results for simulation counting and timing, thereby informing the analytical calculation of system supportability indices.
Finally, Step 5 calculates the SOS supportability indices—the MSR, RR, OA, and MCP—through simulations. The SOS MSR and MCP are extracted from the simulation result data at the end of the mission and used to calculate the final indices; the SOS RR and OA are extracted from the simulation result data collected both during the mission and at its conclusion, facilitating the calculation of statistical indicators for the mission process.
The SOS MSR (or mission completion rate) is defined as:
where is the number of simulation runs in which the SOS mission configuration meets the criteria in each phase (i.e., the minimum number of aircraft sorties required to meet the intensity requirements of the combat units during each phase) and denotes the total number of mission simulation runs.
The equipment SOS RR can be determined by
where is the readiness number of basic equipment units of type , is the total number of basic equipment units of type , and is the total number of aircraft available for the equipment SOS mission.
The SOS OA is given be
where denotes the simulation time when the configuration reaches the standard state in each phase of the equipment SOS mission (i.e., the time accumulated when the required number of aircraft are always available during the mission phase) and is the mission simulation duration.
Finally, the SOS MCP is given by
where denotes the absolute frequency with which the configuration in the i-th mission phase reaches the corresponding criteria, and is the absolute frequency of statistical time points in the i-th mission phase.
4. Case Study
4.1. Mission Background
Let us consider a mission in which the commander of an air combat group orders that an air formation comprising over 40 A-, B-, C-, D-, and E-type fighter aircraft carry out an emergency operation, assembling at area H at 00:00 on 1 February 2025, for early warning and detection tasks. The chief of staff at the group command center orders the support commander to immediately activate the MX support system to ensure that the aircraft continued to perform their mission, and issued a command to issue a warning order for the mission. The support commander decides to quickly organize support personnel, develop a plan based on the equipment configuration requirements for each stage of the mission, and make recommendations for decision-making. The corresponding mission equipment configuration parameters are shown in Table 1.

Table 1.
Mission equipment configuration parameters.
In Table 1, the equipment SOS configurations CF1, CF2, and CF3 correspond to the equipment dispatch intensity required for the first, second, and third phases of the mission, respectively; for example, CF1 indicates that during the initial phase of the mission, two A-type aircraft are dispatched, with at least one maintaining normal working condition.
4.2. Simulation Result Analysis
(1) Single Aircraft Elements: Over the entire in the mission cycle (from 0:00 on 1 February 2025 to 02:00 on 2 February 2025), the states of aircraft A01–A06 are recorded as shown in Figure 8, Figure 9, Figure 10, Figure 11, Figure 12 and Figure 13.
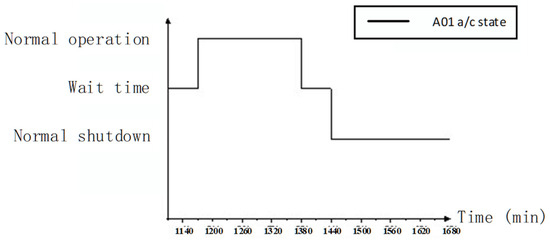
Figure 8.
States of aircraft A01.
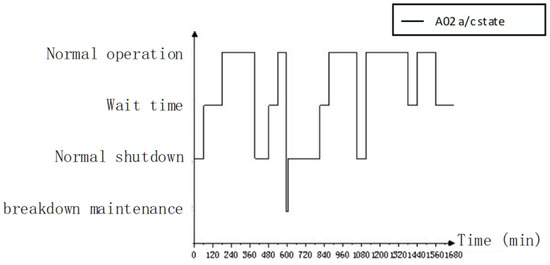
Figure 9.
States of aircraft A02.
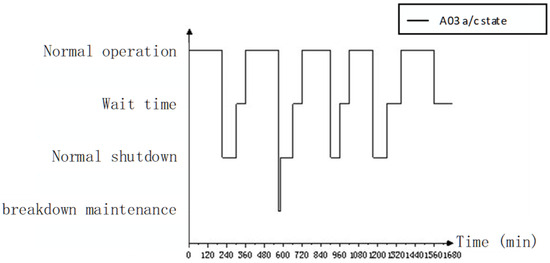
Figure 10.
States of aircraft A03.
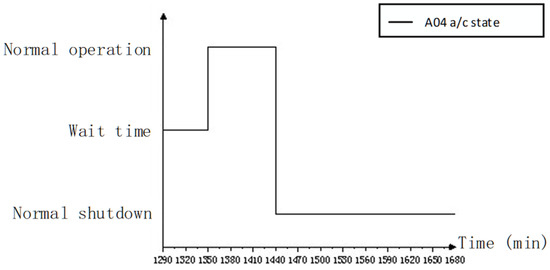
Figure 11.
States of aircraft A04.
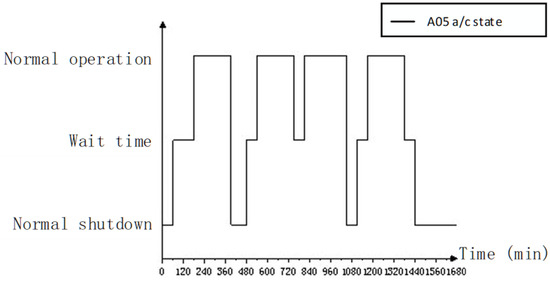
Figure 12.
States of aircraft A05.
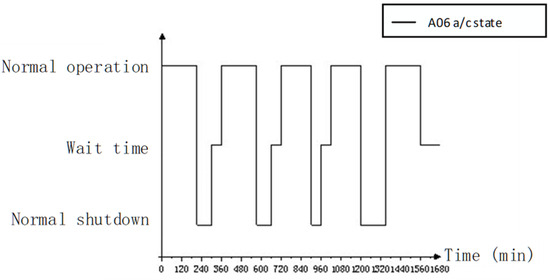
Figure 13.
States of aircraft A06.
In fact, from the perspective of the completion of the SOS task, more attention is paid to the state of the fleet, that is, with the support of the support system, whether the fleet can meet a certain proportion of aircraft integrity. Of course, the operations of each aircraft are determined by three factors: one is the mission attribute of the aircraft, the second is the failure rate of the aircraft, and the third is the efficiency of the support system, which are, respectively, reflected in the task input, fault parameters, and support equipment and behavior in the article.
The results indicate that, for example, aircraft A02 has a total readiness time of 1547 min and a mission time of 770 min, and performs five sorties during the mission. It fails at 9:50 on 1 February 2025 and returns to a state of readiness at 10:03 on the same day. Consequently, the development of a support plan and the allocation of support resources can be augmented based on these statistical results. The fuel consumption of aircraft A02 can be calculated according to the mission duration using these results. Based on the simulation data of the states of each individual aircraft, further calculations can be made to produce statistical information including the number of sorties, combat action OA, and mission times for the aircraft. Figure 14, Figure 15 and Figure 16 show the per-aircraft breakdown of sorties, OA, and mission time.
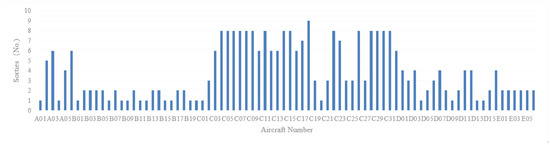
Figure 14.
Per-aircraft sorties.
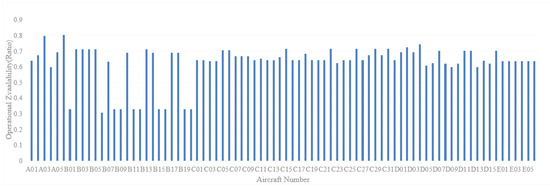
Figure 15.
Per-aircraft OA.
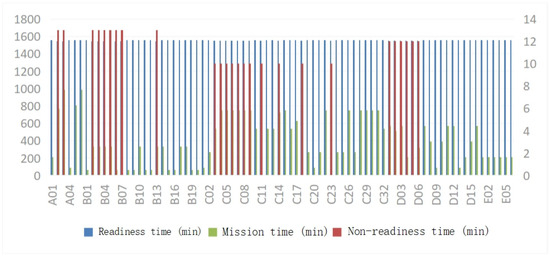
Figure 16.
Per-aircraft mission time.
The per-aircraft state data indicate that the range of single aircraft sorties is [1,9]. Among them, C18 participates in the maximum of nine sorties, while D14 participates in the minimum of one sortie. Notably, the proportion of aircraft with two sorties is the largest, accounting for 25% of all aircraft. The overall support resources can thereby be configured by considering the intensity of only two aircraft (C18 and D18), with particular emphasis on aircraft C18 to ensure the adequate provision of support resources. The range of single aircraft readiness time is [1547, 1560] minutes; aircraft with a readiness time of 1547 min accounted for 11.2% of all aircraft, while those with a readiness time of 1560 min accounted for 67.5%. Owing to the short mission time, most aircraft remained in good condition during the mission cycle; the range of single aircraft mission time is [60, 989] minutes, and aircraft with a mission time of 750 min comprised the largest proportion at 16.2% of all aircraft. Given the model and task requirements, the distribution of task durations is scattered, which is in line with the actual mission configuration.
These statistical results provide a quantitative basis for the pre-configuration of support resources based on the equipment SOS status and can be applied to reduce shortages or surpluses of support resources during missions. For example, the overall support resource requirements for an aircraft fleet are measured by the number of missions the aircraft performs, while fuel and ammunition consumption during the mission period is measured by the mission time of the aircraft.
(2) SOS Elements: Within the mission cycle, the OA for all types of aircraft, as well as the SOS OA and the SOS MCP, consistently reached 100%. By the conclusion of the simulation, the RR values for both the SOS and all aircraft types were also all 100%. For example, although the flight tasks of the A-type aircraft covered all three phases of the mission, and the subsequent failures and repairs of aircraft A03 and A02 occurred at 9:30 and 9:50 on 1 February 2025, respectively, the task intensity requirements were adequately met for each phase. In other words, the requisite number of aircraft was fully available in each phase, thereby ensuring that the OA for A-type aircraft remained at a consistent 100%. This analysis indicates that the initial configuration of the support system effectively supports equipment in accomplishing tasks across all phases, while the support resource configuration is sufficient. These findings are consistent with the redundancy characteristics inherent to integrated systems and form a premise and foundation for the subsequent system optimization.
(3) RMS Sensitivity Analysis: Based on the basic data input, both single and compound parameters for LRU components (including critical and general parts) can be adjusted to perform a sensitivity analysis [33]. The fundamental capabilities of support systems for operational missions can be evaluated by analyzing the effect of the resultant changes in SOS supportability indices. Taking the A-type aircraft as an example, adjustments to the RMS values for the “a/c engine” parameter, as presented in Table 2, result in corresponding changes to the supportability indices. The resulting trends in RR, OA, and SOS supportability for the A-type aircraft are illustrated in Figure 17, Figure 18, and Figure 19, respectively.
Table 2.
Adjustment values of RMS parameters of A-Type aircraft engine.
Figure 17.
Change trend in aircraft RR (RMS adjustments to the A-type “a/c engine” parameter).
Figure 18.
Change trend in aircraft OA (RMS adjustments to the A-type “a/c engine” parameter).
Figure 19.
Change trend in SOS supportability (RMS adjustments to the A-type “a/c engine” parameter).
(4) Sensitivity Analysis of Support Actions: The resilience of the support systems for operational missions can be evaluated by adjusting the OP action parameters and support resource parameters of the basic equipment units, followed by an analysis of the sensitivity of the SOS supportability indices. The adjusted support action parameters are defined in Table 3; the change trend in RR for A-type aircraft due to these adjustments is shown in Figure 20, while Figure 21 presents the corresponding trend in OA, and Figure 22 depicts the changes in SOS supportability indices.
Table 3.
Adjusted values of support action parameters.
Figure 20.
Change trend in aircraft RR (adjustment to support actions).
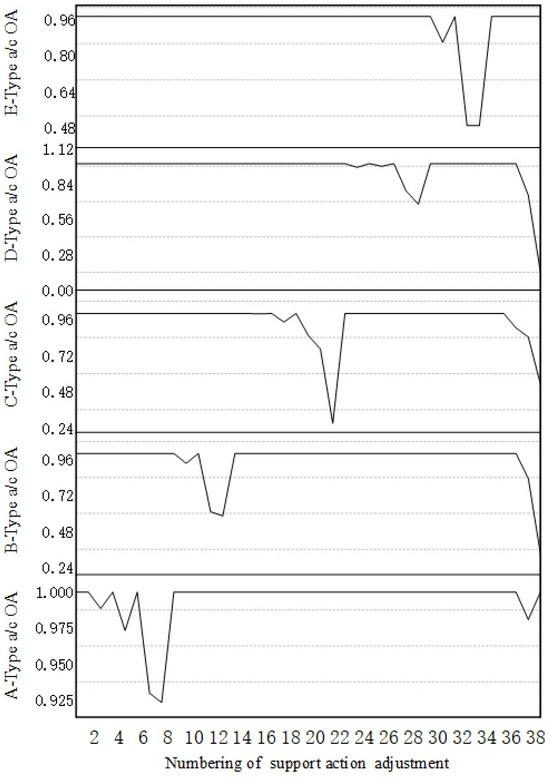
Figure 21.
Change trend in aircraft OA (adjustment to support actions).
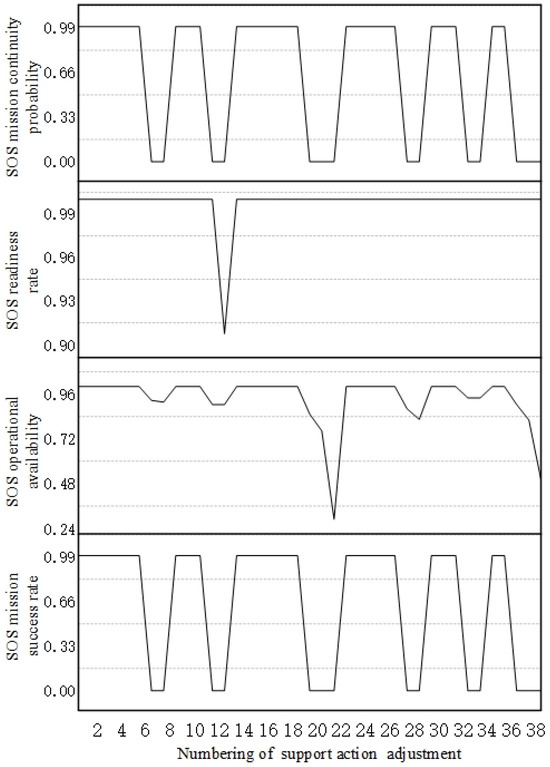
Figure 22.
Change trend in SOS supportability indexes (adjustment to support actions).
It is evident that the RR values for various aircraft remained constant at 100% by the conclusion of the mission, with one notable exception: when the number of B-type power vehicles was reduced by 80%, the corresponding RR decreased from 100% to 95%.
This analysis indicates that adjustments to OP actions generally exerted minimal impact on the OA of each aircraft type. For example, when the direct MX time for A-type aircraft was increased by 40%, the aircraft OA decreased to 98.85%; when the turnaround time for A-type aircraft was increased by 60%, the aircraft OA decreased to 97.31%.
However, the adjustment to support resources had a significant impact on the OA of each aircraft type. Specifically, when the number of A-type power vehicles was decreased by 90%, the aircraft OA decreased to 92.31%. In particular, when the number of accessory oil vehicles (which serve as general vehicles for all five aircraft types) was decreased by 80%, the OA of A-type aircraft decreased to 98.08%. Furthermore, when this number was decreased by 90%, the OA for B- and C-type aircraft reached its minimum values of 33.33% and 14.29%, respectively. Furthermore, when the number of E-type power vehicles was decreased by 80%, the corresponding aircraft OA reached its lowest value of 57.14%. Thus, general-purpose and specialized support resources with the same configuration can have different effects on the occurrence of minimum OA across different aircraft types.
The adjustments to aircraft OP actions for various types of aircraft had minimal effect on the SOS supportability indexes; however, the adjustments to support resources had significant impact, and the change trends in the SOS MSR, OA, and MCP were similar. Indeed, when the number of C-type power vehicles was decreased by 90%, the SOS OA decreased from 100% to 28.85%, representing the minimum SOS OA and indicating that the SOS mission could not continuously advance, ultimately resulting in failure. Generally, the adjustment to the number of C-type aircraft power vehicles exerted the greatest impact on the SOS OA. When the number of B-type power vehicles was decreased by 80%, the SOS RR decreased from 100% to 98.75%, whereas adjustments to other parameters had no effect on the SOS RR. Furthermore, when the number of accessory oil vehicles (general-purpose support resources) was adjusted to 60%, the SOS OA began to decline, hindering the continuous advancement of the SOS mission. This highlights the importance of monitoring the operation of accessory oil vehicles during missions and ensuring timely supplementation to prevent adverse impacts.
(5) Sensitivity Analysis of Mission Intensity: The sensitivity of each supportability index can also be analyzed by adjusting the task intensity for each aircraft type across each different mission phase, as listed in Table 4. In this table, the letter designates the aircraft type, while the numerical value corresponds to the sequence of mission phases. For example, A-1 refers to the first mission phase of the A-type aircraft. Simulations were conducted based on these adjusted values, yielding the resulting change trends in aircraft OA (task intensity adjustment) shown in Figure 23. Additionally, the change trends in the SOS supportability indexes (task intensity adjustment) were obtained and are shown in Figure 24.
Table 4.
Adjusted values of task intensity parameters.
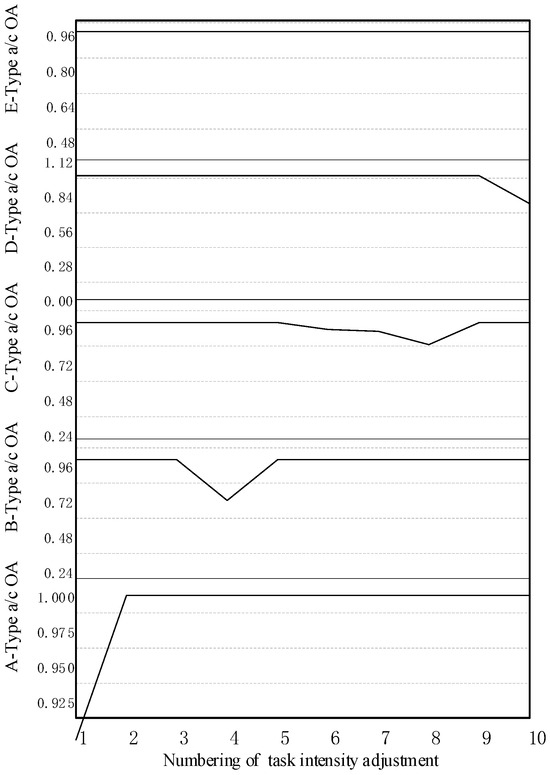
Figure 23.
Change trend in aircraft OA (task intensity adjustment).
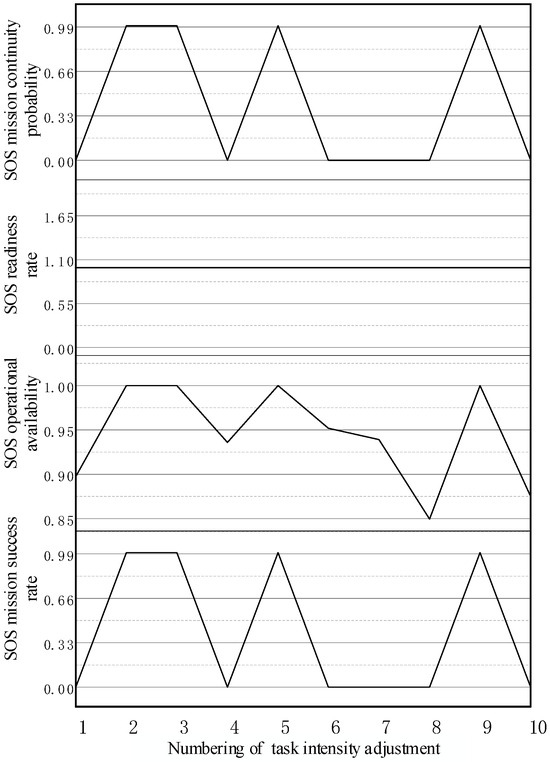
Figure 24.
Change trend in SOS supportability indexes (task intensity adjustment).
The analysis indicates that the six E-type aircraft required are in a state of operational readiness during the third mission phase; i.e., the OA of E-type aircraft remained unchanged, indicating a high level of configuration redundancy for this aircraft type. The task intensity adjustments in A-1 decreased the OA of A-type aircraft to its minimum value of 89.74%, while those in B-3 decreased the OA of B-type aircraft to 72.22%, those in C-3 decreased the OA of C-type aircraft to 84.94%, and those in D-3 decreased the OA of D-type aircraft to 77.39%.
The change trends in the SOS MSR, OA, and MCP exhibited similar patterns, indicating that the SOS mission could be successfully completed. Notably, the SOS RR was maintained at 100%, demonstrating that all basic equipment units were restored to a state of readiness by the end of the mission. Adjustments in the mission intensities for A-1, B-3, C-1, C-2, C-3, and D-3 resulted in a reduction in both SOS MSR and MCP to 0%. Furthermore, the adjustment in C-3’s mission intensity led to a decrease in SOS OA to its lowest value of 84.94%, indicating that the continuous advancement of the mission was not feasible. Consequently, it was imperative to enhance the monitoring of C-type aircraft operations during the third phase and develop a comprehensive plan aimed at improving operational efficiency and MX support.
The simulations presented in this paper are relatively complex due to the involvement of numerous elements in the calculations, including tasks, equipment, MX, and support. When an equipment fault occurred during the calculation process, MX support and supply behaviors were activated. Consequently, as mission time progressed, it became essential to continuously record and access an increasing quantity of process data for further calculations of the relevant indicators. Thus, the evaluation and analysis required a considerable number of parameter adjustments and repeated calculations, resulting in a time-consuming simulation method. However, after building a set of models, setting the parameters, and executing the simulation in this study, the calculation time was approximately 10 min, meeting the basic requirements of case verification. The main objective of this study was to build a simulation evaluation model and calculate and analyze the evaluation index results, so further discussion on the efficiency and running time of the simulation is no longer necessary.
4.3. Experimental Comparison and Verification
The task generation model established in this paper was shown to align with the actual equipment SOS support process; the results of the case study indicated that the model is both reasonable and provides suitable accuracy. However, the missions undertaken by the considered equipment SOS can be complex, involving numerous equipment systems and units, while the statistical data describing these systems remain inadequate to reflect the aspects of a real mission. Therefore, a comparative analysis and verification of the proposed model was undertaken using similar scenario examples and relevant conclusions available in the literature [34]. The following aspects were revealed by this comparison:
- (a)
- As the mean time between failures (MTBF) for each aircraft type increased by a step size of 20%, the MSR for aircraft types A, B, C, D, and E within the system support index increased by 9.6%, 8.3%, 10.4%, 20.8%, and 2.1%, respectively, indicating an upward trend. Conversely, as the mean time to repair (MTTR) for each model increased by a step size of 20%, the MSR for aircraft types A, B, C, D, and E in the system support index decreased by 8.3%, 10.4%, 12.5%, 18.8%, and 14.6%, respectively, indicating a downward trend.
- (b)
- As the mission intensity for aircraft types A, B, C, D, and E decreased by a step size of 20%, the MSR of the equipment system support index increased by 25.8%, 6.9%, 16.7%, 35.4%, and 6.3%, respectively, indicating an upward trend.
- (c)
- For each task, it is possible to take a comprehensive approach to considering constraints to adjust the input of the optimization system, such as adjusting the phase task time as demonstrated in the literature [30]. The first, second, and third task success rates increased by 8.3%, 4.2%, and 2.1%, respectively, when the time for each task was reduced by 20%. If the task time in each stage is unsuitable for adjustment, the adjustment of task intensity can also help to improve the MSR. For example, when the task intensity for the E-type aircraft was decreased by 20%, the MSR increased by 6.3%. From a system optimization perspective, the optimal operation state of the system is often difficult to obtain, but the impact of local factor adjustment on the operation of the system can be effectively measured.
These three points demonstrate that the relevant case verification based on mission-driven simulations of support effectiveness, using the SOS evaluation model proposed in this study, is basically consistent with various conclusions obtained in previous research [30]. Therefore, the proposed mission-driven simulation using the support effectiveness evaluation model can be considered reasonable.
5. Conclusions
Research on simulation-based assessment of equipment SOS support has become an important topic in the field of support. Therefore, this study developed and demonstrated a simulation method for evaluating the effectiveness of equipment SOS support. The method innovatively combines the shortcomings of the task model, data recording, and system-level index calculation to simulate equipment SOS support. First, a task generation model was developed to map combat tasks to support tasks. Second, a model was developed to evaluate the effectiveness of equipment SOS support, and a simulation method was proposed for calculating the effectiveness index of SOS-level support. Finally, a case study was conducted using an emergency action task for an air combat formation to verify the feasibility of the method. This study evaluated a specific equipment support system and conducted sensitivity analysis on various parameter variables to derive several useful conclusions.
The method proposed in this study can support SOS effectiveness assessment and decision-making under different information conditions. Furthermore, the method has the potential to be extended to similar equipment and other complex systems. However, due to the complexity of SOS simulation research, further in-depth exploration of related algorithms will be needed through comparisons and model validation in the future.
Author Contributions
Conceptualization, G.D. and L.C.; methodology, G.D.; software, F.Z.; validation, C.S. and X.W.; formal analysis, X.T.; investigation, L.C.; resources, G.D.; data curation, L.C.; writing—original draft preparation, G.D.; writing—review and editing, G.D.; visualization, X.W.; supervision, F.Z.; project administration, G.D. All authors have read and agreed to the published version of the manuscript.
Funding
This research received no external funding.
Data Availability Statement
Due to the confidential nature of the project, the data supporting the findings of this study cannot be shared. We adhere to strict privacy and ethical guidelines that prevent the dissemination of sensitive information. While we understand the importance of data transparency, we must prioritize the security and integrity of the program and all parties involved. We assure you that all analyses were conducted rigorously and that the results reported are an accurate reflection of the work performed.
Conflicts of Interest
The authors declare no conflicts of interest.
Nomenclature
| No. | Abbreviation/Variables | Description |
| 1 | A, B, C, D, E | Aircraft type |
| 2 | a/c | Aircraft (in figures and tables) |
| 3 | A-MLDT | Mean logistics delay time of the A-type aircraft |
| 4 | A-MTBF | Mean time between failures of the A-type aircraft |
| 5 | A-MTTR | Mean time to repair of the A-type aircraft |
| 6 | LRU | Line replaceable unit |
| 7 | MCP | Mission completion probability |
| 8 | MLDT | Mean logistics delay time |
| 9 | MSR | Mission success rate |
| 10 | MTBF | Mean time between failure. |
| 11 | MTTR | Mean time to repair |
| 12 | MX | Maintenance |
| 13 | OP | Operational support |
| 14 | OA | Operational availability |
| 15 | RMS | Reliability, maintainability, and supportability |
| 16 | RR | Reliability rate |
| 17 | SOS | System of systems |
References
- You, G.R.; Chu, J.T.; Lu, S.Q. Research on Weapon Equipment System. Mil. Oper. Res. Syst. Eng. 2010, 24, 15–22. [Google Scholar]
- Zio, E. Prognostics and Health Management Methods for Reliability Prediction and Predictive Maintenance. IEEE Trans. Reliab. 2024, 73, 41. [Google Scholar] [CrossRef]
- Tan, Y.; Yang, K.; Zhao, Q.; Jiang, J.; Ge, B.; Zhang, X.; Shang, H.; Li, J. Operational Effectiveness Evaluation Method of Weapon Equipment System Combat Network Based on Combat Ring. China. CN201510386251.2, 13 September 2019. [Google Scholar]
- Ding, G.; Cui, L.J.; Zhang, L.; Li, Z.P. Research on key issues in simulation deduction of aviation maintenance support mode. Ship Electron. Eng. 2020, 40, 8–12. [Google Scholar]
- Trivedi, K. Reliability and Availability Assessment. IEEE Trans. Reliab. 2024, 73, 17–18. [Google Scholar] [CrossRef]
- Feng, Z.; Okamura, H.; Dohi, T.; Yun, W.Y. Reliability Computing Methods of Probabilistic Location Set Covering Problem Considering Wireless Network Applications. IEEE Trans. Reliab. 2024, 73, 290–303. [Google Scholar] [CrossRef]
- Gao, L.; Cao, J.; Song, T.; Xing, B.; Yan, X. Distributed equipment support system task allocation model. J. Armored Forces Eng. Acad. 2018, 32, 13–21. [Google Scholar] [CrossRef]
- Luo, L.Z.; Chakraborty, N.; Sycara, K. Multi-robot assignment algorithm for tasks with set precedence constraints. In Proceedings of the 2011 IEEE International Conference on Robotics and Automation, Shanghai, China, 9–13 May 2011; IEEE: Piscataway, NJ, USA, 2011; pp. 2526–2533. [Google Scholar]
- Wang, J.H.; Zhang, L.; Shi, C.; Che, F.; Zhang, P.T. Cooperative mission planning for equipment support marshalling based on the optimization of the invading weed bat twin group. Control. Decis. 2019, 34, 1375–1384. [Google Scholar] [CrossRef]
- Xing, B.; Cao, J.H.; Song, T.L.; Chen, S.H.; Liu, F.S. Robustness analysis of complex network of equipment support system for mission success. Comput. Appl. Res. 2018, 35, 475–478. [Google Scholar] [CrossRef]
- Song, T.L.; Xing, L.D. Mission need-based system supportability objectives determination. In Proceedings of the 2011 Proceedings—Annual Reliability and Maintainability Symposium, Lake Buena Vista, FL, USA, 24–27 January 2011. [Google Scholar]
- Li, D. Simulation Modeling and Optimization of the Use of Support Resources for Basic Combat Units Based on Petri Nets. Master’s Thesis, National University of Defense Technology, Changsha, China, 2013. [Google Scholar]
- Li, L.; Xu, C.; Tao, M. Resource Allocation in Open Access OFDMA Femtocell Networks. IEEE Wirel. Commun. Lett. 2012, 1, 625–628. [Google Scholar] [CrossRef]
- Wang, R.; Lei, H.W.; Peng, Y.W. Optimization of multi-level spare parts for naval equipment under wartime mission conditions. J. Shanghai Jiaotong Univ. 2013, 47, 398–403. [Google Scholar]
- Sheng, J.Y. Research on Coordination Evaluation Index of Support Resources Used by Basic Combat Units. Master’s Thesis, National University of Defense Technology, Changsha, China, 2012. [Google Scholar]
- Hooks, D.C.; Rich, B.A. Open systems architecture for integrated RF electronics. Comput. Stand. Interfaces 1999, 21, 147. [Google Scholar] [CrossRef]
- Han, X.Z.; Zhang, Y.H.; Wang, S.H.; Zhang, S.X. Evaluation method of equipment mission success considering maintenance work. Syst. Eng. Electron. Technol. 2017, 39, 687–692. [Google Scholar]
- Cao, L.J. Maintenance decision-making method and application centered on mission success. Firepower Command. Control. 2007, 6, 97–101. [Google Scholar]
- Guo, L.H.; Kang, R. Modeling and simulation of the preventive maintenance support process of basic combat units. Comput. Simul. 2007, 4, 36–39. [Google Scholar]
- Liu, B. Ship Equipment Support Resources and Maintenance Strategy Optimization and Effectiveness Evaluation. Master’s Thesis, Northwestern Polytechnical University, Xi’an, China, 2006. [Google Scholar]
- Zhang, T. Modeling and Analysis of Maintenance Support Capability Assessment During the Use Phase of Equipment. Ph.D. Thesis, National University of Defense Technology, Changsha, China, 2004. [Google Scholar]
- Mahulkar, V.; McKay, S.; Adams, D.E.; Chaturvedi, A.R. System-of-Systems Modeling and Simulation of a Ship Environment with Wireless and Intelligent Maintenance Technologies. IEEE Trans. Syst. Man Cybern. Part A Syst. Hum. 2009, 39, 1255–1270. [Google Scholar] [CrossRef]
- Yang, L.B.; Xu, T.H.; Wang, Z.X. Agent based heterogeneous data integration and maintenance decision support for high-speed railway signal system. In Proceedings of the 2014 IEEE 17th International Conference on Intelligent Transportation Systems (ITSC), Qingdao, China, 8–11 October 2014; pp. 1976–1981. [Google Scholar]
- Cao, Y.; Peng, Y.L.; Wang, T.N. Research on Equipment Support Process Model Based on Multi-Agent System. In Proceedings of the 2009 International Conference on Information Management, Innovation Management and Industrial Engineering, Xi’an, China, 26–27 December 2009; pp. 574–576. [Google Scholar]
- Panteleev, V.; Kamaev, V.; Kizim, A. Developing a Model of Equipment Maintenance and Repair Process at Service Repair Company Using Agent-based Approach. Procedia Technol. 2014, 16, 1072–1079. [Google Scholar] [CrossRef][Green Version]
- Du, X.; Pei, G.; Xue, Z.; Zhu, N. An Agent-Based Simulation Framework for Equipment Support Command. In Proceedings of the 9th International Symposium on Computational Intelligence and Design, Hangzhou, China, 10–11 December 2016; pp. 12–16. [Google Scholar]
- Yang, Y.; Yu, Y.; Zhang, L.; Zhang, W. Sensitivity analysis and parameter optimization of equipment maintenance support simulation system. Syst. Eng. Electron. Technol. 2016, 38, 575–581. [Google Scholar]
- Miranda, P.A.; Tapia-Ubeda, F.J.; Hernandez, V.; Cardenas, H.; Lopez-Campos, M. A Simulation Based Modelling Approach to Jointly Support and Evaluate Spare Parts Supply Chain Network and Maintenance System. IFAC-PapersOnLine 2019, 52, 2231–2236. [Google Scholar] [CrossRef]
- Petrovic, S.; Milosavljevic, P.; Sajic, J.L. Rapid Evaluation of Maintenance Process Using Statistical Process Control and Simulation. Int. J. Simul. Model. 2018, 17, 119–132. [Google Scholar] [CrossRef]
- Pang, S.; Jia, Y.; Liu, X.; Deng, Y. Study on simulation modeling and evaluation of equipment maintenance. J. Shanghai Jiaotong Univ. (Science) 2016, 21, 594–599. [Google Scholar] [CrossRef]
- Ding, G.; Cui, L.J.; Shi, C.; Ding, E.Q. Research on the Construction of Supportability Index of Aviation Equipment System. J. Air Force Eng. Univ. 2019, 19, 55–59. [Google Scholar] [CrossRef]
- Ding, G.; Cui, L.J.; Wang, L.Y.; Hu, R.; Qian, G. Research on the construction of supportability index of aviation equipment system of systems. IOP Conf. Ser. Mater. Sci. Eng. 2021, 1043, 022008. [Google Scholar] [CrossRef]
- Liao, H. Accelerated Testing and Smart Maintenance: History and Future. IEEE Trans. Reliab. 2023, 73, 33–37. [Google Scholar] [CrossRef]
- Ding, G.; Cui, L.J.; Han, C.; Wang, X.H.; Zhang, F. Simulation and evaluation analysis of aviation weapon and equipment system support based on multi agent. J. Beijing Univ. Aeronaut. Astronaut. 2022, 49, 1–15. [Google Scholar] [CrossRef]


Disclaimer/Publisher’s Note: The statements, opinions and data contained in all publications are solely those of the individual author(s) and contributor(s) and not of MDPI and/or the editor(s). MDPI and/or the editor(s) disclaim responsibility for any injury to people or property resulting from any ideas, methods, instructions or products referred to in the content. |
© 2025 by the authors. Licensee MDPI, Basel, Switzerland. This article is an open access article distributed under the terms and conditions of the Creative Commons Attribution (CC BY) license (https://creativecommons.org/licenses/by/4.0/).