Abstract
Service design often involves using diverse business and process modelling notations to represent strategic and operational aspects of services. Although complementary, no modelling environment currently enables integrated use of these notations. This paper addresses this gap by proposing a model-driven solution that supports multiple modelling notations within a unified environment. The research is guided by the following question: To what extent can a modelling environment that integrates multiple business and process modelling notations benefit service designers? To answer it, the study adopts Design Science Research (DSR) methodology and develops a prototype integrating several graphical Domain-Specific Languages (DSLs), along with mechanisms for model transformation, traceability, and validation. The prototype was evaluated through a two-phase process: (1) a laboratory case study applying the double diamond model of service design to a real-world scenario, and (2) an empirical study involving nine service design professionals who assessed the usability of the tool, efficiency, and completeness of generated models. Results show that integrating heterogeneous modelling notations through Model-Driven Engineering (MDE) can reduce modelling effort by up to 36.4% and generate models with up to 97.7% completeness, demonstrating not only technical benefits but also contributions to the well-being of designers by reducing cognitive load, fostering consistency, and improving communication among the stakeholders involved in the designing process.
1. Introduction
Business models can be defined as a tool that “allows us to identify the ways in which an organisation delivers value to its customers, attracts them to pay for that value, and ultimately converts that payment into profit for the organisation” [1], “describes the basis on which organisations create, deliver and capture value” [2,3], or “provides a representation of a plan for making a profit” [4]. Some authors distinguish four categories of business models, namely business process models, business motivation models, business organisation models and business rule models [5,6,7].
Two of these perspectives (business organisation models and business process models) form part of the core of service design [8,9], a discipline that aims to help develop or improve proposals for delivering user-centred services, focusing on the interactions that take place between the service provider and the consumer [10]. Popularised by IDEO1 [11], service design eventually became the gateway to service development for any organisation seriously concerned with user experience, digital transformation, designer well-being [12], and a range of related factors. In this regard, recent studies show that digital transformation is reshaping service design by introducing technologies such as AI, IoT, and cloud computing, which demand new approaches to user experience, transparency, and co-creation in service delivery [13]. Also, Design Thinking has gained prominence as a strategic methodology in service design, enabling organizations to address complex challenges through empathy, iteration, and collaborative problem-solving [14].
Business and process modelling play a key role in service design because they help to understand, conceptualise and represent the services that bring value to an organisation. For example, any organisation that wants to adopt a service delivery approach needs to constantly redesign its business model [15]. To do this, all members or departments of the organisation should have a clear and shared vision of the model, even if they use different notations to represent it [16], which can otherwise lead to cognitive overload and communication issues for designers.
Indeed, several techniques for business and process modelling are used in the context of service design. For instance, some notations such as the Business Model Canvas (BMC) [2] or the value model [17] are used to provide a general and strategic vision of the organisation. On the other hand, business process modelling notations such as Business Process Model and Notation (BPMN) [18], Process Chain Network (PCN) [19], or Service Blueprint (SBP) [11] are key to showing the details of the delivery of a particular service offering. Note that recent adaptations of the SBP technique incorporate digital frontstage and backstage elements, enabling better representation of multi-actor and technology-mediated interactions in complex service ecosystems [20].
It is worth noting that the information provided by these notations can be complementary, so it is possible to identify relationships between models expressed using different techniques, which can allow these techniques to be integrated. For example, most existing notations clearly state who the consumers or providers of a service are. It is therefore interesting to identify these correspondences, as it is common for partners working together to provide a service to use one or more of these techniques, with the resulting communication problems. In this regard, collaborative design environments are increasingly recognised as essential for aligning diverse stakeholders in service design, especially in distributed teams, where shared understanding and co-creation are critical [12], and where such environments can positively influence the well-being of designers by reducing stress and improving engagement [21].
On the other hand, although there are technological tools that support some of the outlined notations, none of them enable an integrated approach to service design in their current state in October 2025. Existing solutions such as Miro, Canvanizer, Bizagi, or Strategyzer focus on isolated notations and lack mechanisms for transformations, traceability, and formal validation, which can increase cognitive load and negatively affect designer well-being in complex projects. Generic diagrammers like MS Visio (https://www.microsoft.com/en-us/microsoft-365/visio, accessed on 9 October 2025) or Lucidchart (https://www.lucidchart.com/pages, accessed on 9 October 2025) allow quick sketching but do not adopt a model-centric approach, making it impossible to process or reuse the information contained in diagrams. As a result, service designers must resort to multiple tools without any systematic way to link models, which hinders consistency, increases effort, and negatively affects their workflow and well-being. This gap highlights the need for an environment that supports heterogeneous notations in an integrated way, enabling tasks such as the transformation of models to ease the process of designing a service, traceability across models, or validation of models, while also reducing cognitive load and improving the overall experience of service designers [22]. Initiatives such as the Open Models Initiative LABoratory (OMiLAB) [23] promote the development of domain-specific modelling environments, but none currently address this challenge in the context of service design.
Therefore, this work proposes a model-centric approach that exploits the benefits of MDE in service design, not only to improve modelling efficiency but also to support the well-being of service designers by reducing fragmentation and cognitive effort [24]. To this end, it relies on the creation of a graphical Domain Specific Language (DSL) for each of the business and process modelling notations listed above. The choice of the MDE approach is motivated by its ability to provide formal, processable representations of models. An alternative approach could involve the development of mechanisms to bridge some of the existing modelling solutions. However, the development of an editor from scratch that leverages MDE principles allows for deeper integration of the included notations, which can simplify the modelling workflow and reduce stress associated with switching between disconnected tools. To justify this, firstly, it enables the establishment of correspondences based on the metamodels of each DSL. Secondly, it facilitates the automation of tasks related to processing the information gathered in the models, such as validation, transformation, and traceability. This is due to the fact that a wide range of languages and tools have been specifically developed to perform model-related tasks within the MDE context [25].
As a result, this work aims to determine to what extent it would be beneficial to address the lack of technological support for the integrated use of business and process models in the context of service design by introducing INNoVaServ2: a tool designed not only to improve modelling capabilities but also to enhance the experience and well-being of service designers. Thus, INNoVaServ is an open source prototype that provides a set of modelling tools with which it is possible to work, in an integrated way, with different business and process modelling notations. To this end, INNoVaServ integrates a set of DSLs, as well as the necessary tools to register and manage the relationships between the models elaborated with these DSLs in the context of a service design project. Therefore, in addition to five graphical DSLs (BMC, value, SBP, PCN and BPMN), INNoVaServ provides a dashboard that facilitates the semi-automatic generation of partial models from models expressed in a different notation, including a trace model to capture the relationships between input and output models. In addition, INNoVaServ enables automatic model validation and correction, and provides formal model validation capabilities for certain notations such as SBP and PCN, which helps to reduce the cognitive load on service designers.
Finally, it should be noted that some details of INNoVaServ have been previously published in [26]. The delta of this work with respect to that publication consists of (1) a more comprehensive study of related works, (2) a more detailed description of the design and development of the tool, (3) a completed evaluation consisting of a case study together with empirical validation and discussion of results, and (4) a description of potential threats to the validity of the study. Also, this work consolidates the research questions of [26] into a single overarching question to provide a clearer and more coherent focus. On the other hand, this work succinctly presents the main contributions of the doctoral thesis “INNoVaServ: un entorno de modelado para el diseño de servicios” [27] and aligns its content with the scientific publication format according to international best practice recommendations for the publication of doctoral theses in scientific journals [28,29].
Additionally, it is worth mentioning that this work is not intended to innovate in the field of MDE, but to show its usefulness in service design, since it is based on the idea that MDE techniques have reached a high level of maturity, but they need a more applied or realistic point of view [30]. Therefore, this work aims to extend its scope to other areas, such as business domains, where both modelling and automation can significantly contribute to solving problems of interest to experts in these domains.
The rest of this paper is organised as follows: Section 2 reviews existing technological support for business and process modelling, as well as prior work on the integration of heterogeneous modelling notations. Section 3 presents the research question and the methodology adopted to answer it. Section 4 describes the design and development of the proposed modelling environment, including its architecture, the justification of the supported notations, and transformation mechanisms. Section 5 presents the validation process, divided into two complementary parts: a laboratory case study and an empirical study involving service design professionals. This section also contains a discussion of results in the form of validation findings. Section 6 discusses the main threats to the validity of the study, grouped into the categories of construct, internal, conclusion, and external validity. Finally, Section 7 outlines the conclusions and future research directions.
2. Related Works
This section presents an analysis of related works regarding technological solutions for business and process modelling in the context of service design. Furthermore, a number of studies addressing the relationships between different business and process modelling techniques are also examined.
2.1. Existing Technological Support
As regards technological support for business and process modelling, there are currently in October 2025 a number of solutions that allow working with specific notations. For example, the Miro tool can be used for SBP diagrams, Canvanaizer for BMC diagrams or the value editor for value diagrams. However, in many cases, these software solutions only enable working with a single notation, while it is harder to find a tool that supports multiple notations for business and process modelling in an integrated way. We can also find generic diagrammers that can be used for any notation, such as MS Visio or Lucidchart, which may be good options for quick sketches, but are not designed to facilitate the processing of the information gathered in the models produced.
Therefore, what follows is an analysis of existing technical support for business and process modelling that allows working with different notations and, ideally, can automate complex tasks such as validations or model transformations. However, as this would be a never-ending task due to the fact that new business and process modelling tools are constantly being developed, this analysis is limited to the tools found at the time of its execution and which appear in certain academic works. Furthermore, in order to carry out this analysis, several criteria were established to classify the proposals identified.
The first criterion used in the analysis relates to the supported notations by the identified tools. In this respect, the large number of solutions available for BPMN is remarkable. See, for example, the tools Bizagi [31], BonitaSoft [32], bpmn.io [33], or Signavio [34]. It is also worth noting that none of the tools analysed support PCN notation, despite the fact that diagrams of this type could be created using generic process modelling tools such as Draw.io [35], Gliffy and Lucidchart [36], or MS Visio [37]. In any case, these solutions obviously cannot ensure that the models created conform to the formal specification of such notation. On the other hand, one tool was found that supports BMC notation (Strategyzer [38]), and two others that offer SBP support in addition to BMC (Canvanizer [39] and Miro—formerly Realtime Board [40]). Finally, only the value editor [17] was found to support value. In conclusion, after analysing the various proposals according to the first criterion, it is possible to state that, at the time of this study, there are tools that support all the notations considered in this work, with the only exception of PCN.
The second criterion of the analysis relates to the capacity of the identified tools to manage different business and process models with an integrated approach. In this sense, as we have already seen, there are several tools that support more than one notation: those that allow the design of BMC and SBP diagrams (Canvanizer and Miro) and those that serve as generic diagrammers (Draw.io, Gliffy, Lucidchart, MS Visio). However, despite supporting different notations, these tools treat each model in isolation and do not allow any kind of relationship to be specified between them. It can therefore be concluded that no tool has been found that enables working with different notations for business and process modelling in an integrated way.
The third criterion relates to whether the reviewed tools use suitable post-processing formats to work with the models. In this sense, all the tools analysed allow saving the models for further editing, and it is also possible to export the diagrams as images in several formats. In addition, some tools support formats that allow collaborative work on the models created, such as Canvanizer, Lucidchart, Miro, Signavio, Strategyzer or Gliffy, the latter also allowing models to be exported in formats compatible with other tools such as MS Visio. In this regard, recent developments in collaborative modelling environments have introduced cloud-based platforms that support multi-user editing, version control, and integration with service design workflows, enhancing the co-creation process in distributed teams [12].
The fourth criterion seeks to determine whether the tools analysed support complex operations on models, such as validations, simulations or transformations. Here, a number of tools were identified that allow model simulations or validations to be performed. For example, Bizagi, BonitaSoft or Lucidchart allow for the simulation of BPMN processes by defining the number of instances of the process or the branching probabilities at each gate. MS Visio supports model validation to ensure that the models created comply with the specifications of the corresponding notation. Finally, the value editor has a simulation system allowing for the estimation of the gains of the actors involved in different value exchanges by defining the number of exchanges and the value exchanged in each one. It can therefore be concluded that some of the tools analysed allow complex tasks such as validations or simulations to be carried out on the business and process models built, although none were found to support transformations between notations, i.e., the generation of models in one notation from another model built with a different notation.
Finally, the fifth criterion for the analysis of the proposals aims to determine whether the tools analysed comply with the formal specification of the supported notations. It was found that most of the tools claim to be faithful to the principles of the notations they support, although this is not the case for the generic diagrammers (Draw.io, Gliffy and Lucidchart). It should be noted that both Strategyzer and value editor are tools developed by the creators of the corresponding notations (BMC and value respectively), so they offer greater guarantees with regard to the specification followed in the built models.
On the other hand, recent literature also highlights the importance of considering human factors in modelling environments. Fragmented workflows and tool-switching are associated with cognitive overload and stress, which can undermine designer performance and satisfaction. Studies on digital well-being [22] and workplace ergonomics [21] suggest that integrated platforms can reduce these risks by simplifying tasks and fostering a sense of control. However, none of the reviewed tools explicitly address these aspects, leaving a gap that this work aims to fill.
As a general conclusion, it is possible to state that, during this analysis, no tool for service design has been found that allows us to work in an integrated way with all the notations considered in this work, performing tasks such as model transformations, and to comply with the formal specification of each supported notation. Furthermore, in the case of the PCN notation, the proposal of this work is the first tool to provide technological support. Finally, there are other features that would be desirable to include in the proposed artefact, such as collaborative working capabilities, which some of the alternatives analysed already support. This way, recent literature emphasizes the importance of integrated modelling platforms that support traceability, transformation, and collaborative editing across heterogeneous modelling languages [41].
2.2. Correspondences Between Modelling Notations
On the other hand, to develop the modelling environment proposed in this work, it is also essential to identify existing studies that explore the relationships and correspondences between the supported notations. It is therefore useful to examine previous research that has addressed similar tasks, focusing specifically on the notations considered in this study.
In an initial approach, we identify works that, although they do not directly analyse the existing correspondences between different notations, they do combine several modelling techniques such as BMC and SBP during the design of a service [42]. Others, pursuing a more comprehensive approach, emphasise the necessity of aligning business models with business process models to facilitate more informed decision-making in dynamic environments [43,44,45].
If we focus on the analysis of correspondences, we find several works that consider some of the selected notations. For example, in [46], a conceptual comparison is made between the business process modelling notations BPMN and SBP, including a series of tables with the identified correspondences. Also, recent research has proposed extensions to Service Blueprinting that incorporate digital frontstage and backstage elements, enabling better alignment with BPMN and other process-oriented notations in complex service ecosystems [20].
Similarly, in [47,48], a conceptual analysis is executed this time for the PCN and SBP notations, while in [49], the same analysis is carried out for the PCN and BPMN notations. Finally, in [50], the correspondences between the value and BPMN notations are analysed, which represents a point of connection between the notations for business modelling and those for business process modelling. To conclude, it should be noted that all of the aforementioned works have been taken into account as a starting point for the correspondence analysis presented in Section 4.2.
3. Method
The analysis of related works presented in Section 2 reveals a lack of technological solutions that support the integrated use of multiple business and process modelling notations in the context of service design. To address this gap, this section introduces the research question that guides the study, along with the methodology adopted to answer it. The research question is as follows:
- RQ: To what extent can a modelling environment that integrates multiple business and process modelling notations benefit service designers?
To answer the above question, this work adopted the methodology of Design Science Research (DSR). According to [51], DSR can be described as the “generation of knowledge from the design, construction and evaluation of an artifact, which can be anything artificial or synthetic, from a methodology to a software product”. Furthermore, this artifact must be “an innovative solution to a non-trivial problem”. In this study, the artifact is the modelling environment that will be built and analysed. Figure 1 shows how the DSR methodology was instantiated in the case of this work, following the three-cycle model proposed by [52]. As can be seen, certain previous experiences allowed us to identify the need to build and analyse such an artifact.
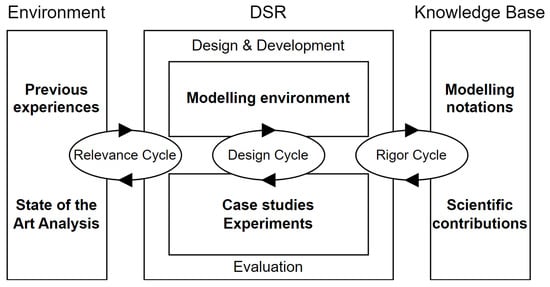
Figure 1.
Instantiation of DSR throughout this work. Reproduced from [27].
These previous experiences can be divided into two groups. On the one hand, the professors of the Business Process Engineering course of the Degree in Science, Management and Service Engineering of the Universidad Rey Juan Carlos in Spain noticed that there was no environment that allowed for working with several process modelling notations, especially those most popular in the context of service design. On the other hand, the research group to which the authors of this paper belong had started to work on the specification of a methodological proposal for service design. During the first discussions on how to approach the specification of this methodological proposal, it became clear that it would be desirable to have a technological support that would allow the use of business and process models for service design. These two related findings led to a state-of-the-art analysis to check whether there was indeed a technological solution that met these characteristics (see Section 2). In terms of DSR, this analysis, together with the previous experience mentioned above, forms the context identified during the relevance cycle of this work.
Once the problem to be solved and the scope of application had been identified, during the rigor cycle, the existing knowledge base was used to analyse several works on business and process modelling notations, as well as other works focused on the study of the correspondences between these notations.
In the meantime, during the design cycle, the specification and construction of the artifact were carried out. Finally, to validate the functionality of the constructed artifact, a laboratory case study was executed, while to evaluate it an experiment was carried out with the participation of several researchers and professionals in the field of services. This validation and evaluation stage also allowed for determination of the benefits of the proposed artifact; thus, the initial research question was answered.
4. Technological Proposal
As described in Section 2, there are currently technological solutions that support some business and process modelling notations in isolation, but no solution has been found that allows working with different techniques in an integrated way in the context of service design. Furthermore, most of the available tools are not model-based, which means that in many cases, it is not possible to process the information that the diagrams contain. In order to try to overcome this lack of technological support, this work is committed to the use of MDE techniques applied to business and process modelling, with the aim of building an environment that allows working in an integrated way with different notations in the context of service design projects.
Thus, during the design cycle of this study, the INNoVaServ modelling environment was built: an open source prototype that integrates a set of visual DSLs for the BMC, value, SBP, PCN and BPMN notations, as well as the necessary tools to manage the relationships between the models produced with these DSLs in the context of a service design project. In addition, INNoVaServ provides a dashboard that allows for the partial generation of models in a given notation to be invoked from models produced in other notations, as well as the generation of trace models that make explicit the relationships between the elements of the input and output models. INNoVaServ also automates tasks as validations and corrections of models. The main aspects of the design and development of the tool are described below.
4.1. Supported Notations
As mentioned above, INNoVaServ currently supports the notations BMC, value, SBP, PCN and BPMN. It should be noted that these are only some of the existing techniques used in service design. Therefore, the rationale behind the choice of this set of notations is related to the UK Design Council’s3 double diamond model for service design.
The double diamond model defines a design process that consists of two phases with two stages of convergent and divergent reasoning. The aim of the first phase is to understand the context of the problem in a global way and to define the problem to be solved. Here is where business models are useful. The goal of the second phase is to design a set of solutions and to specify the details of their implementation. In this case, process models can help to design such solutions. Figure 2 shows the double diamond model and how the chosen notations fit into each phase.
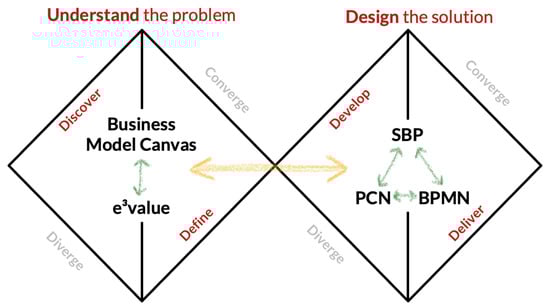
Figure 2.
Double diamond model for service design and selected notations. Reproduced from [26].
For the first phase, two notations were selected that can represent the overall structure of a service from different perspectives: BMC and value. While the former provides a generic representation of an organisation, the latter details the activities and value exchanges that take place between the different actors involved in a service. For the second phase, three notations were selected which, similarly to the previous case, offer different views of the same process. For example, while SBP provides a simplified view, BPMN allows much more detail to be specified, and PCN supports the definition of additional elements such as the monetary or non-monetary gains or losses associated with each action.
The choice of these five notations is based not only on their theoretical alignment with the double diamond model but also on empirical evidence of their adoption in service design and business process modelling. BMC is widely recognized as a standard for representing business models and has been extensively applied in industry and service contexts [2,3]. BPMN is the most popular notation for process modelling, supported by numerous tools and validated in industrial and services environments [18,33]. SBP remains a cornerstone in service design, with recent adaptations for digital ecosystems confirming its relevance [11,20]. The value notation is used in value-based service design and has been integrated into collaborative modelling approaches [17,50]. Finally, although PCN is less widespread, it is employed in operations management and offers unique capabilities to represent concepts not included in the other notations, like gains and losses in service interactions [19]. These notations were therefore selected for their prevalence and complementary perspectives, enabling communication among diverse stakeholders. Furthermore, the proposed environment is designed to be extensible, allowing additional notations to be incorporated as needed.
4.2. Correspondence Analysis
Once the choice of notations has been made, the next step is to design mechanisms to enable integration between the chosen techniques. This way, it is necessary to establish correspondences between them [53]. In this work, a correspondence is defined as a semantic or structural relationship between elements of two different modelling notations that represent equivalent concepts. For instance, it becomes evident that the actions or steps of an SBP model correspond to the actions of a BPMN model, and vice versa. In the context of this work, these correspondences were identified primarily from the fundamental components that form the metamodels of each notation (DSL). Note that work using this idea of correspondence has been carried out in the past, as mentioned in Section 2 [46,47,48,49].
In order to execute this analysis, the models from five case studies were utilised as reference. For each case, an analysis was conducted to ascertain the elements and structures that were common between pairs of models. If the same similarities were observed in all five case studies, a correspondence was established at the metamodel element level. Due to the different nature and purpose of the selected notations, the correspondence study was divided into three blocks. First, the correspondences between the business models BMC and value were assessed. Secondly, the correspondences between the process models SBP, PCN and BPMN were evaluated. Finally, possible correspondences between the two previous groups were analysed.
Regarding business models, Table 1 shows the identified correspondences. Some of the most important mappings include the actors and the market segments of an value could be derived from the key partners of a BMC and vice versa; similarly, the value activities of each actor or market segment of an value could be derived from the key activities and the value proposition of the BMC; as for the value objects exchanged in an value, these can be extracted from several BMC regions, but although all these regions have elements that can potentially be converted into value objects, this is not always the case and interaction with the designer would be required to capture design decisions in this respect.

Table 1.
Correspondences between BMC and value.
Regarding process models, Table 2 shows the found correspondences. Some of the most relevant are as follows: there is a direct correlation between the BPMN pools and the PCN entities, but in the case of SBP it would be necessary to manually indicate which two entities are represented; any BPMN or PCN task is directly convertible into a SBP task because SBP has only one element to represent actions, but there are some peculiarities between BPMN and PCN because they have several types of events and tasks (the same applies to dependencies); it is also possible to establish a correspondence between BPMN OR gates and PCN decision nodes, relating these elements to SBP tasks, as this notation has no elements to represent decisions.
Table 2.
Correspondences between BPMN, PCN and Service Blueprint.
The third step consisted of a correspondence analysis between business models and process models. Since the former focus on representing the value proposition of an organisation, while the latter focus on describing the underlying service operations, the main correspondence lies in the fact that process models exploit the information gathered in business models. Thus, from the data contained in a BMC (such as key activities) or in an value model (such as dependency paths), we can identify how many process models are needed to represent the main service operations. Therefore, in order to estimate from an value model the number of process models needed to represent a value proposition, it is necessary to analyse how many dependency paths the first model contains. For example, since the value model in Figure 3 has two different dependency paths (from the customer to the restaurants and from Deliveroo to the dealers), we would need two process models to represent the corresponding value proposition. However, it would not be possible to derive the actions that implement the interaction between these entities from the information collected in the business model alone.
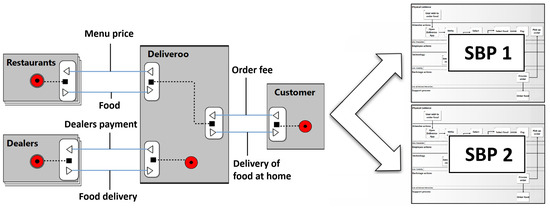
Figure 3.
Correspondence example between business and process models.
Note that PCN or BPMN models can also be generated from the value model. In these cases, the PCN entities or BPMN pools correspond to the actors or market segments involved in each dependency path. In addition, BPMN AND/XOR gates and PCN decision tasks correspond to the AND/OR dependencies of value. However, it would still not be possible to obtain the remaining actions, except for the start or end events of the BPMN processes, which correspond to the consumer needs and boundary elements of value.
4.3. Architecture of the Solution
Having selected the notations to be supported and identified the relationships between them, it is time to design the INNoVaServ architecture, which can be approached from both a conceptual and a technical perspective.
Regarding the conceptual architecture, the main goal was to provide the tool with a high degree of modularisation. Thus, as shown in Figure 4, this architecture can be described along two orthogonal dimensions. From the vertical dimension, INNoVaServ can be understood as a set of DSLs that support different modelling notations in isolation. This modular architecture allows for easy integration of new DSLs. With respect to the horizontal dimension, the separation of concerns principle of [54] was taken into account. Thus, the conceptual architecture of INNoVaServ distinguishes in each DSL the presentation layer of a model from the model itself. Such a separation also corresponds to the traditional division between the concrete syntax and the abstract syntax of any modelling language. Note that this separation also allows the presentation layer of the notations to be modified without affecting the models and metamodels of the logic layer. Finally, the logic layer also includes the model processor, which is the module that enables the integration of the different DSLs. To this end, the model processor contains several components to support model processing tasks like validations, corrections, transformations or traceability management.
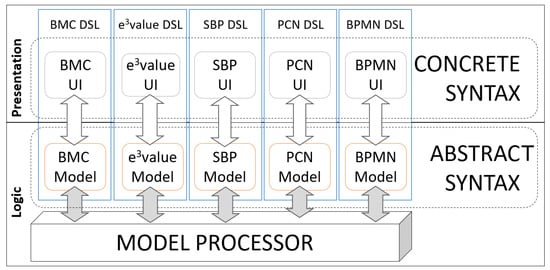
Figure 4.
INNoVaServ conceptual architecture. Reproduced from [27].
With regard to the technical architecture of INNoVaServ, Figure 5 shows the main components. As can be seen, the Eclipse IDE is the base on which the rest of the elements are integrated. This way, it is possible to distribute the modelling environment as a new version of Eclipse. The second major component is Eclipse Modeling Framework (EMF), which is the basis for the rest of the technologies used in the development, making it possible to integrate any other EMF-based DSL into INNoVaServ. At the next level, there are different groups of components. First, those that provide EMF-based DSLs with concrete visual syntaxes: Eclipse Graphical Editing Framework (GEF), Graphical Modeling Framework (GMF) and Sirius. Next to Sirius is Acceleo, which is the code generator used by this tool. It is worth mentioning that it would be possible to integrate into this architecture any other tool for the development of EMF-based graphical editors. Secondly, we find different components of Eclipse Epsilon that allow for the processing of the information collected in the EMF models. Specifically, we can see the languages Epsilon Object Language (EOL) and Epsilon Transformation Language (ETL), which are used to develop transformations between models, and Modelink, which will be the visualiser of the trace models that can be produced by the environment in each transformation. Finally, based on the previous set of components, INNoVaServ integrates four DSLs developed with GMF and a fifth DSL developed with Sirius to demonstrate the feasibility of integrating DSLs developed with other EMF-based tools.
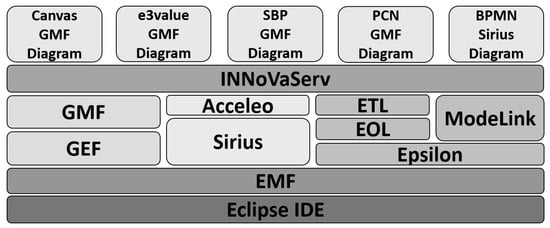
Figure 5.
INNoVaServ technical architecture. Reproduced from [27].
4.4. Development of DSLs
As mentioned above, the architecture of INNoVaServ includes graphical DSLs built with GMF and with Sirius. However, following the process illustrated in Figure 6, the development is similar in both cases. Note that the process illustrated in Figure 6 is the usual procedure in the development of MDE graphic editors, as described in the GMF and Sirius frameworks manuals.
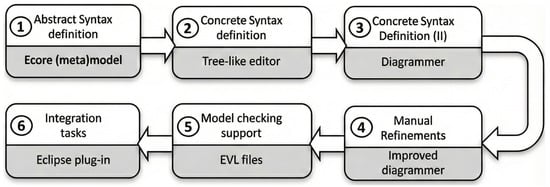
Figure 6.
Development process for graphical DSLs.
(1) The first development step is to specify the abstract syntax of the DSLs by creating the metamodels in the Ecore language [55]. (2) EMF is then used to generate a set of Java classes for programmatically managing models that conform to the specified metamodels. EMF also generates a fully functional tree editor. (3) GMF or Sirius technologies are then used to build the appropriate diagrammers for each of the DSLs. (4) The generic nature of GMF or Sirius imposes certain limitations on the functionality of the resulting diagrammers, so the Java code obtained is then manually refined to implement some complex functionalities that the automatic code generation is not able to support. (5) To ensure that the models created by the users are correct with respect to the specification of each notation, the next step is to implement a model validator, for which Epsilon Validation Language (EVL) and EOL languages were used. (6) Finally, the plug-in that packages the whole DSL is generated.
4.5. Bridging the Notations
Once the graphical editors have been implemented, the next step is to develop technological bridges that make it possible to exploit the correspondences analysed in Section 4.2. Since INNoVaServ currently supports five notations, up to twenty transformations linking them could be implemented. To avoid this complexity, it was decided to select a subset of these transformations that could be concatenated to generate models in each of the five notations. Thus, the transformations implemented are those shown in Figure 7. Furthermore, this subset of transformations, without excluding other possibilities, facilitates the transition between the conceptual ideas collected in the business models and the way of putting them into practise, specified by means of process models.
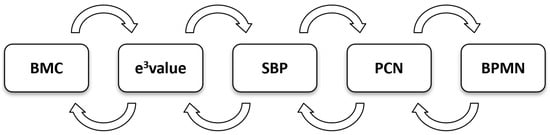
Figure 7.
Direct transformations implemented in INNoVaServ. Reproduced from [26].
To implement the transformations, the ETL language was used. The fact that ETL allows for the combination of imperative blocks with the definition of declarative rules was particularly useful, since most of the transformations require a certain level of interaction with the user, which was mainly supported by dialogue boxes implemented with EOL.
On the other hand, to capture relationships between the models involved in each transformation, the generic trace metamodel shown in Figure 8 is used. This way, when one of the transformations is executed, in addition to the target model, a trace model that instantiates this metamodel is generated.
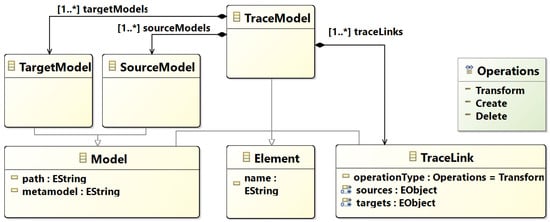
Figure 8.
Generic trace metamodel.
To visualise and manage the models involved in each transformation, Epsilon’s Modelink tool was integrated into INNoVaServ, a multi-panel editor that allows the source, target and trace models to be visualised and the existing relationships to be edited, as shown in Figure 9. The example in the figure shows a tree-shaped BMC model on the left, an value model generated from the BMC on the right, and the trace model produced during the transformation in the middle.
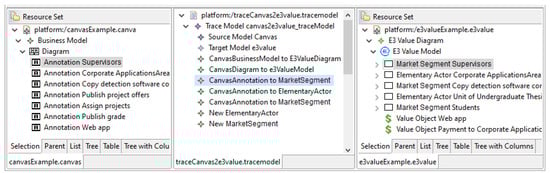
Figure 9.
Trace model, together with the source and target models visualised with Modelink. Reproduced from [27].
Finally, a basic dashboard was also incorporated into INNoVaServ to manage the different models developed in a service design project. As shown in Figure 10, the dashboard is inspired by the one provided by GMF to work with the models involved in the development of a graphical editor. In our case, the dashboard allows the selection and deletion of models from the project, as well as invoking the execution of the implemented transformation.
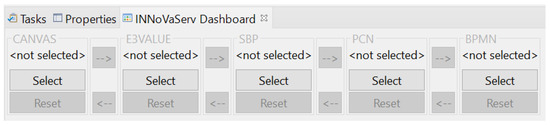
Figure 10.
INNoVaServ dashboard. Reproduced from [26].
4.6. Formal Validation of Models
In addition to the features described in the previous subsections, it is also worth noting the fact that INNoVaServ also includes mechanisms to provide formal validation for some of the supported notations.
For example, work has been carried out to support the formal validation of PCN models [56]. This study is based on the lack of technological support for the formal validation of this modelling technique. Since other notations, such as Petri nets, provide a large number of formal validation and verification solutions, the work proposes the transformation of PCN models into stochastic Petri nets as a way to support the formal validation of PCN models.
On the other hand, work has also been done on the formal validation of SBP models using simulation techniques [57]. Broadly speaking, this work proposed to enrich SBP models with a formal information layer using Unified Modelling Language (UML) to represent the underlying data model, and then to generate a set of simulatable semantic rules using the OpExec library4, a utility designed to detect the violation of previously defined constraints.
In both cases, the development of these formal validation mechanisms was intended to demonstrate another of the potential benefits of introducing the use of processable models into service design.
5. Evaluation of the Proposal
This section presents the evaluation phase of INNoVaServ, which consisted of a case study following the guidelines proposed by [58,59], and an empirical study conducted according to the guidelines of [60,61]. The aim was to collect enough data to answer the initial research question, including how the proposed environment may alleviate cognitive load and positively influence the well-being of service designers during intensive modelling tasks.
5.1. Case Study
DSR is the design and investigation of artefacts in a given context [62]. Consequently, it is reasonable to use the case study methodology for the validation of such artefacts since it allows the analysis of the behaviour of a proposal in its real context [58]. Thus, to validate the developed technological solution, this work uses a laboratory case study, which consists of the following stages: definition: of the case study; definition of the data collection protocol; execution of the case study; analysis of the case study.
Regarding the definition of the case study, it is proposed to design a service that responds to a specific problem of an organisation that can be approached from the service design methodology. This problem is caused by the high increase in the number of new students in a certain public university in the last six years. This increase in the number of students has in turn led to an increase in the number of Final Degree Projects (FDPs) to be assessed, making an already complex process even more complicated, as there are several stakeholders involved and they have to be coordinated in order to carry out the management of these FDPs (supervisors, administrative staff, FDP department, etc.). In order to facilitate the management of this volume of work, the FDP department proposed the use of a computer application that would centralise and support the actions of all those involved in the process. Thus, the idea of this laboratory case study is to use INNoVaServ to support the design of the corresponding service, building the models involved in each of the stages of the double diamond model of service design, while also observing how integrated modelling tools may reduce cognitive effort and improve the experience of service designers.
As for the data collection protocol, in the context of a case study, this involves defining a series of questions to be answered after the case has been conducted, using the information collected during its execution. Therefore, at this stage, the data sources to be used to answer these questions must also be defined. In the case of this work, the aim of the validation is to check that the modelling environment that has been constructed correctly provides all the functionalities that it supports, and allows the design of services through the elaboration of business and process models that are characteristic of the different stages of the double diamond model of service design. The case study questions are listed below.
- CSQ-1: Was it easy and intuitive to work with all notations supported by INNoVaServ?
- CSQ-2: To what extent do the transformations supported by INNoVaServ reduce the effort required for service design?
- CSQ-3: How close to reality are the models resulting from each transformation supported by INNoVaServ?
- CSQ-4: Is the integration of graphical editors produced by different tools (GMF, Sirius) transparent?
- CSQ-5: Is it possible to implement the double diamond model with INNoVaServ?
With regard to the data sources to collect the evidence to answer the above questions, it was decided to use the following:
- Direct observation of the execution of the case study.
- Models built manually during the development of the service.
- Models generated automatically during the development of the service.
- Trace models generated by the transformations.
During the execution of the case study, the double diamond model was followed to design a solution to the proposed problem. Thus, the discovery phase was first carried out with the aim of visualising the context of the problem and achieving a common understanding. To this end, a BMC model was first developed. This BMC model was then used to generate a partial view of the associated value model using the corresponding transformation integrated in INNoVaServ. The value model then had to be completed manually. This transformation also generated a trace model that collects the correspondences between the elements of the source and target models. To illustrate this stage, Figure 11 shows the BMC and the corresponding value model generated with INNoVaServ, while previous Figure 9 shows the Modelink view for both models together with the generated trace model. At this point it is worth noting that the BMC and value models provide two complementary perspectives of the problem context: while the BMC model provides a global view of the organisation (in this case, the FDP department), the value model allows for the specification of the value chains related to the organisation and its services.
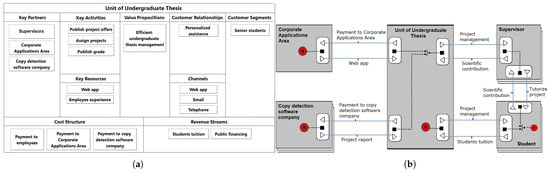
Figure 11.
BMC (a) and value (b) models generated with INNoVaServ during the case study. Reproduced from [26].
After exploring the problem space, the next step is to design the solution. For this purpose, the three process modelling notations supported by INNoVaServ were used to specify the service operations involved in the value chains contained in the value model. The next model developed with INNoVaServ was therefore the SBP. This model was defined during the reflection phase of the case study with the aim of designing a service that would help to manage the life cycle of each FDP using a support application. However, as the implementation of the service required a greater level of detail than that provided by SBP, the next step was to partially generate a PCN model by performing another of the transformations supported by INNoVaServ, which then had to be completed manually. This transformation also generated the corresponding trace model. Finally, in an attempt to bring the design of the solution closer to its implementation, the BPMN model (and the corresponding trace model) was partially generated from the PCN using the appropriate transformation. Again, the model had to be manually completed by making the remaining design decisions, such as the selection of task types or the positioning of certain intermediate message passing events.
Once the case study has been executed, the answers obtained during the case study analysis to the questions previously stated are discussed below:
CSQ-1 (Was it easy and intuitive to work with all notations supported by INNoVaServ?): Partially. INNoVaServ allows for the creation of models using graphical editors, where the user basically has to select elements from the tool palette and the desired position to place these elements. This process is simple and intuitive, as this is the usual way of working in this type of modelling solution. However, the complexity of each editor is largely related to the complexity of the notation it supports. Thus, editors for notations such as BMC or SBP (which do not have a large number of nested elements) offer higher levels of usability than those corresponding to more complex notations such as PCN or BPMN. With regard to the usability of the tool, it was noted at this stage that the execution of the semi-automatic transformations was not particularly intuitive, so it was decided to create the model dashboard described previously.
CSQ-2 (To what extent do the transformations supported by INNoVaServ reduce the effort required for service design?): The answer to this question is given in terms of the time required to build each model. In this way, the time taken to manually construct each model was compared with the time taken to partially generate it using the transformations implemented. To avoid including the time spent on making design decisions, this analysis was carried out once the final model was known. The results obtained (measured in seconds) are shown in Table 3, where the last row represents the percentage of time saved by using the transformations compared to the time it takes to build the models manually, a reduction that not only improves efficiency but also mitigates stress and fatigue, contributing to designers’ well-being. Note that this analysis does not take into account transformations between business and process models since, in these cases, as described above, it is effectively only an estimate of the number of process models needed to represent a value proposition.
Table 3.
Modelling time (in seconds) for manual and transformation-based generation, and time savings from transformations (%).
Based on the results shown in Table 3, it can be affirmed that the model transformations supported by INNoVaServ do indeed lead to a reduction of the user’s effort, since, in the worst case, the generation of partial models allows a saving of around 10% of the time spent on modelling tasks. This finding reinforces the idea that reducing repetitive manual work and cognitive effort can lower stress and enhance psychological well-being. However, during this analysis, a number of improvements were identified that would further reduce the effort required by the user, such as the layout of the graphical elements of the diagrams generated by the transformations, which by default are positioned according to a horizontal layout that the user has to modify manually in order to obtain a correct visualisation of the model. Finally, although this analysis does not take into account the time spent on design issues because it is a non-controllable variable, the fact is that an added value of the generation of partial models is the help in making this type of decision, since some of the transformations interact with the user through dialogue boxes to produce the target model.
CSQ-3 (How close to reality are the models resulting from each transformation supported by INNoVaServ?): To answer this question, the number of elements of each model produced by a transformation (without subsequent modifications) was compared with the number of elements of the same model produced manually, considering the latter to be complete or closer to the reality it represents. Again, this comparison was made for all transformations except for those that involved moving from business to process models and vice versa. In addition to the case study presented in this section, four other laboratory cases were used to calculate average completeness values. These cases correspond to a food delivery service, a car rental company, a bicycle rental company and a neuropsychological institute.
Table 4 shows the percentage of elements of each model generated by the tool for each of the case studies. On the basis of these data, it can be concluded that, in general, the partial models generated by the tool are quite close to reality: in four out of the six possible scenarios, the percentage of generated elements exceeds 67%, while the other two are between 36% and 44%. Finally, it is worth mentioning that one of the limitations of this study is that the analysis is conditioned by the amount of information collected in the source models, so that if these were incomplete, the transformations would be less effective. For instance, in the transformation that allows a PCN model to be generated from a BPMN model, the completeness of the PCN model may depend on the completeness of the source BPMN model. To avoid this problem, the source models have been thoroughly reviewed to avoid omissions of information that could adversely affect the generated models.
Table 4.
% of generated elements in each transformation compared to manually constructed models. Reproduced from [27].
CSQ-4 (Is the integration of graphical editors produced by different tools (GMF, Sirius) transparent ?): Partially. Although the user will not notice any difference between the GMF and Sirius editors when modelling, there are small differences when creating new models or generating the corresponding diagrams. However, from an internal point of view, this integration is completely transparent, since the model management tasks supported by INNoVaServ, and those that may be implemented in the future, are carried out only with the underlying EMF models, whose nature and composition are completely independent of the graphical editor used.
CSQ-5 (Is it possible to implement the double diamond model of service design with INNoVaServ?): Partially. As it has been shown during the execution of the case study, it is possible to design and model a service with INNoVaServ, elaborating for this purpose the different models related to the different stages of the double diamond model for service design. However, the transition between the stages of problem exploration and solution design is too large a gap. While the tool can generate the number of process models needed to represent the value proposition, it would be desirable to enable a stronger connection between the artefacts used in both stages.
5.2. Empirical Study
The above case study helped to ensure the correct functionality of the modelling environment and the efficiency of some of its features. However, as mentioned in Section 2.1, there are several technological solutions that, in isolation, support some of the notations included in INNoVaServ. It would be reasonable to think that modelling a service could be more efficient in an environment that allows working with different notations in an integrated way, rather than having to resort to different tools for each notation. To test this hypothesis and to determine the usefulness of the proposed artifact, an empirical study was carried out to obtain data comparing the design of a service using INNoVaServ and other alternatives. However, it must be taken into account that the modelling environment of this work is a functional prototype with certain usability limitations [63]. Therefore, the aforementioned empirical study was carried out in the context of a supervised workshop in which various researchers and professionals related to service design participated. For its execution, the guidelines of [60,61] were followed, which imply the need to describe the plan of the experiment; the participants involved; the material used; and the analysis of the results.
During the planning of the experiment, the procedure to be followed was defined. First, participants would complete a pre-questionnaire on their prior experience in business and process modelling. Next, they would be given a set of documents, including the specification of a case study to be developed using INNoVaServ. Finally, they would complete a post-questionnaire on their experience of using the tool, and the resulting dataset would be analysed. In the following, the elements of the study are described with greater detail.
As participants of this empirical study, nine professionals and researchers related to service design were involved. Given that the artefact to be analysed is a prototype for research tasks focused on functionality and with certain usability deficiencies, its execution with a larger number of participants was not considered due to the complications that could arise.
In order to make the data obtained as representative as possible, the group of participants included people with different levels of prior knowledge of modelling. It is worth noting that other issues were not taken into account, such as knowledge of how to use the Eclipse IDE. This is because, being a prototype for research tasks, the participants in the experiment were always assisted by the authors of the experiment to resolve any questions about how to use the tool.
In terms of the material used, since the experimental session was conducted remotely via Microsoft Teams due to scheduling constraints, each participant had their own computing resources on which INNoVaServ distributions based on the Eclipse IDE 2020-12 were installed. In order to run it, each participant was asked to install the Java Development Kit (JDK) version 11.0.9 and was given instructions on how to configure this JDK correctly. Apart from that, the first material provided to the participants during the session was a questionnaire on prior knowledge of business and process modelling, experience of using other related tools, and personal preferences in this context.
After completing the above questionnaire, a short manual on each of the notations supported by INNoVaServ was distributed to the participants. Together with these manuals, another document was distributed containing the description of the service to be modelled. In this specification, the participants were basically asked to redesign a service using the different notations supported by INNoVaServ. It should be noted that no specific solution was envisaged in this experiment: the aim was simply for the participants to interact with INNoVaServ in order to analyse their experience with the tool and to establish a comparison with other known alternatives. An INNoVaServ user manual was also made available to the participants at this stage. Finally, after working on the modelling of the proposed service, the participants completed a final questionnaire to gather their views on their experience of using INNoVaServ.
Once the experimental session was over, the analysis of results was carried out. To that end, the answers to the initial questionnaire were first analysed. Table 5 shows a summary of the responses collected. Note that the answers to questions 1, 2, 3, and 5 show the number of subjects who selected each of the options, while the answers to question 4 are given as the average rating of different tools using a Likert scale from 1 to 5, where 1 means low usefulness of the tool for service design, and 5 means high usefulness.
Table 5.
Summary of results (pre-questionnaire). Reproduced from [27].
As can be seen in Table 5, the answers to the first question show that the most popular notations among the experiment participants are BMC and BPMN, closely followed by SBP. Less popular are value and PCN, a result consistent with the conclusions drawn in Section 2.1.
The answers to the second question show that the most used notation among the participants is BPMN, followed by BMC and SBP. Analysing the answers to the first two questions, it is possible to state that the set of notations supported by INNoVaServ is sufficiently popular among the participating service design professionals, although the addition of new notations such as Lean Canvas or i* could be considered.
The third question asked participants to select which alternatives to INNoVaServ they had used in the past. Due to space limitations, only those tools mentioned by four or more participants are shown in Table 5. It can be seen that Draw.io and MS Visio are the most commonly used tools among the participants, possibly due to their generic nature or the free web access in the case of Draw.io. Also used, although to a lesser extent, are Bizagi (3), BonitaSoft (3), Miro (2) or value editor (3), the latter probably because it was the only tool available for this notation until the construction of the editor integrated in INNoVaServ. Section 2 describes the main features of the tools listed in Table 5 in response to question 3.
The fourth question asked the participants to rate from 1 to 5 the usefulness for service design of the used tools, taking into account aspects such as usability, export capabilities, etc. Table 5 shows the average rating of each tool by the participants who used it. As can be seen, the two best-rated tools are Bpmn.io and Canvanizer, both being online solutions supporting a single notation (BPMN and BMC, respectively) and having a very clean interface.
The last question of the pre-questionnaire asked participants to select the features they considered necessary for a modelling environment in the context of service design. As can be seen, all participants indicated that both ease of use and support for collaboration were desirable features in this type of environment. On the other hand, the integration of different notations in the same tool was also highly accepted (six points out of nine). Other desirable features mentioned by the participants were an online solution (no installation required and accessible from anywhere), support during the design process, or the ability to export models in different formats.
Regarding the post-questionnaire on the quantitative evaluation of INNoVaServ, the survey contained two blocks of questions: one on specific features of the tool and the other on global issues of the tool. Table 6 shows the average scores for the first block of questions in the questionnaire. Note that the ratings of the subjects were given on a Likert scale from 1 to 5, where 1 represents the lowest value for each evaluated characteristic, and 5 represents the highest value.
Table 6.
Average ratings of specific features (post-questionnaire). Reproduced from [27].
The first question asked about the ease of use of the different INNoVaServ diagrammers, with the ones supporting the BMC and SBP notations standing out positively. On the other hand, the editors for the PCN and BPMN notations receive lower scores, possibly due to the large number of elements in these notations. This confirms the idea expressed in the first question of the case study (CSQ-1), where it was stated that the complexity of use of each editor is largely influenced by the complexity of the notation to be supported.
The second question asked the participants to evaluate the usefulness of the different transformations supported by INNoVaServ. It is noteworthy that, although there are no significant differences, the transformations allow the design of a service starting with a global vision provided by a BMC model and step by step specifying the implementation details with BPMN, and after several transformations, better scores are achieved (see Figure 7, from left to right). It is also remarkable that the low score given to the usefulness of transformations between business models (value) and process models (SBP) and vice versa.
The third question aimed to assess the effort that the supported transformations can save for the service designers. In this case, while most of the transformations received acceptable ratings, those involving the value business model and the SBP process model again stood out negatively.
The fourth question asked participants to rate the usefulness of the dashboard included in INNoVaServduring the design of a service. The average rating was 3.89 out of 5.
Finally, the fifth question in this block asked participants to rate the usefulness of the automatic model validations supported by the tool. In this case, the average rating was 2.78 out of 5. These validations are limited to detecting small errors, such as not assigning names to entities or the presence of unconnected actions. In addition, the experiment showed that, in some cases, the automatic solutions offered by the tool (quick fixes) took longer than manual repairs.
On the other hand, Table 7 summarised the responses to the questions of the post-questionnaire referring to the general features of INNoVaServ. Note that responses to questions 6, 7, 8, 9, and 10 use the same 1-to-5 Likert scale as in the previous table, while responses to question 11 show the number of subjects who selected each of the characteristics.
Table 7.
Average ratings of general features (Post-questionnaire). Reproduced from [27].
The answers to the sixth question lead to the conclusion that the learning curve of the tool is too pronounced (2.22 points out of 5), probably due to the complexity of using an Eclipse-based environment for users unfamiliar with this IDE. However, the answers to the seventh question allow us to consider the usability of the tool as acceptable (3.11 points out of 5).
The eighth question asked participants to rate the extent to which the different models in the case study were integrated, i.e., that clear relationships could be seen between the models previously created and generated by the different transformations. In this case, the average score was 3.78 out of 5. Although this is a good result, taking into account the scores for questions 2 and 3, it can be concluded that this rating is undermined by the negative perception of the transformations between value and SBP.
The ninth question asked participants to rate the efficiency of INNoVaServ in service design against the alternative of using different tools for each notation, highlighting how a unified environment may simplify workflows and reduce fragmentation, which is often linked to cognitive overload, thereby fostering a healthier experience for designers. In this case, the score was 4.44 out of 5. In fact, as the answers to the eleventh question show, the most outstanding feature of INNoVaServ for the participants is precisely its support for multiple notations.
The tenth question asked participants to rate the overall usefulness of INNoVaServ in the service design process, with a score of 3.78 out of 5. Comparing this score with the data from the fourth question of the pre-questionnaire (Table 5), INNoVaServ ranks only behind tools such as Canvanizer and Bpmn.io.
On the other hand, in order to show that the answers given by the participants are statistically reliable, the Intraclass Correlation Coefficient (ICC) [64] was calculated for the quantitative questions 1 to 10 of the post-questionnaire. To summarise, the ICC can be calculated using the formula shown below, where var represents the variability due to differences between questions in the questionnaire, var represents the variability due to differences between raters, and var represents the residual variability associated with the inherent error of any given measurement. Furthermore, the results of this calculation can range from 0 (total lack of consistency) to 1 (absolute consistency), with values below 0.4 representing low reliability, those between 0.4 and 0.75 good reliability, and those above 0.75 representing excellent reliability [65].
Applying the above formula to the dataset collected in the final questionnaire, a value of 0.7213246 was obtained, indicating good reliability, although there is some variability in the responses, probably due to the different levels of previous experience in business and process modelling.
Finally, as will be seen in the next subsection, it is worth mentioning that some of the responses and comments made by the participants during the experiment allowed us to identify areas where the tool could be improved.
5.3. Validation Findings
The previous subsections have described the procedure followed to evaluate the artefact created as part of this work. To that end, a case study was used to verify the correct functioning of the tool and to answer a series of research questions, and an experiment was used to identify the improvement of the artefact compared to similar alternatives.
This validation has shown that most of the model transformations supported by INNoVaServ represent a significant reduction in effort for the service designer compared to the alternative of creating a model completely manually, which may help mitigate cognitive overload, reduce stress associated with tool-switching, and improve overall well-being by creating a more supportive and less fragmented design environment [66]. Furthermore, most of these transformations produce models that are largely complete, i.e., close to the reality they represent. Also, participants in the experiment found it more efficient to use INNoVaServ to implement different models during the design of a service than to use different tools for each notation. Finally, INNoVaServ received a higher average overall rating than most of the alternatives used by the participants. The following points discuss some of the areas with the greatest potential for improvement:
- Given that the validated artefact is a prototype for research tasks, its usability was identified as one of the points for improvement. These problems stem from two main sources. On the one hand, there is inherent complexity in certain modelling notations. Diagrammers for notations with fewer elements, such as BMC, are therefore more usable than those with a large number of elements (see BPMN). The results of both the case study (CSQ-1) and the empirical study (post-questionnaire, question 1) indicate this. Therefore, it is necessary to improve the usability of diagrammers for more complex notations. On the other hand, it was observed that the problem also stems from the complexity of using Eclipse. For this reason, work is already underway on the possibility of transferring the artefact to a web environment, which, in addition to reducing the complexity of use, would allow it to be used from any type of device and make it easier to support collaborative working capabilities. This is a functionality that participants in the empirical study identified as essential in the context of service design, which INNoVaServ does not currently support. Note that this need for collaborative capabilities in modelling environments is consistent with recent research that highlights the growing importance of co-creation and distributed teamwork in model-driven service design platforms [67]. Finally, in order to improve the overall usability of the tool, it would be necessary to standardize the processes for creating new models and diagrams, regardless of the tool used to develop the diagrammer.
- It has been demonstrated that automatic transformations result in considerable time savings when developing each model. However, the amount of time saved varies depending on the transformation involved, ranging from 9.73% to 36.40%. An initial analysis of these differences suggests that this is because some transformations require more user interaction than others. For instance, the transition from PCN to BPMN requires minimal user interaction, yielding significant savings compared to the transition from value to BMC, where every step of the transformation necessitates user interaction. However, analysis of the validation process results reveals two other causes of this discrepancy. On the one hand, during the empirical study, some participants expressed concern that, in certain cases, it is necessary to understand the underlying relationship analysis in order to correctly complete the dialogue boxes that appear during certain transformations, which slows down the transformation process. In this respect, the possibility of including explanatory comments or visual guides in the dialogue boxes with which the user interacts when performing these transformations is being considered. On the other hand, more complex notations, such as BPMN, require a more elaborate graphic layout. Current transformations are unable to achieve this. Consequently, users often have to correct the layout manually, which lengthens the transformation process. Optimising the graphical layout of the generated models is therefore necessary.
- Regarding the completeness of the resulting models from executing the various transformations, there is again a wide range of percentages, from 36.76% in the worst case to 97.71% in the best case. Firstly, it is important to note that the completeness of the output model of a transformation depends on the completeness of the input model. In this sense, the more comprehensive the input model, the more comprehensive the output model can be. Another related factor to consider is the information that the input model can potentially collect compared to the information that the output model can collect. For example, when moving from a BPMN model to a PCN model, a large amount of the information required by the PCN model is already contained in the BPMN model, as both notations have a similar syntax. However, when we move from an SBP model to a PCN model, the SBP is not able to collect all the information needed by the PCN, since the former has a poorer syntax than the latter. In conclusion, when moving from a notation with poorer syntax than the target notation, the percentage of completeness is lower than when the source notation has equal or greater complexity than the target notation.
- Related to the previous point, while most of the transformations supported by the tool have been shown to be effective to a greater or lesser extent both in terms of time savings and the completeness of the resulting models, it has not been achieved a high degree of integration between business and process notations. This has proved to be a problem arising from the approach taken in this work, which is limited to estimating the number of process models required to represent a value proposition from an value model, but it does not generate almost any element of these models. As a possible solution to the problems encountered, different approaches to support the generation of BPMN models from value models and vice versa are currently being analysed [68].
6. Threats to Validity
Having discussed the details of the INNoVaServ validation process in the previous section, the main threats to the validity of such a study are analysed below. For this purpose, the classification of threats proposed in [59] was used as a reference, following the order suggested in [69].
Construct validity concerns the definitions and measures used for the variables analysed, since an inappropriate choice may result in variables that do not correctly represent the theoretical constructs. In this sense, the initial validation of the modelling environment consisted solely of the laboratory case study described in Section 5. This study was intended to test the correct functioning of the tool as well as to evaluate the efficiency of some of its features. However, during this phase, it became clear that certain aspects of usability needed to be evaluated together with the potential users of the environment (such as those related to the diagrammers and the dashboard). Furthermore, since it is a tool focused on service design, it should be tested by professionals in this sector and, in this sense, a comparison with other modelling tools used in service design should be made in order to extract the main advantages and weaknesses of INNoVaServ with respect to other alternatives.
Therefore, a second phase of the evaluation was carried out, which consisted of an empirical study comparing the use of INNoVaServ against other alternatives, with the participation of different professionals related to service design. However, this second phase of the evaluation implies new threats to construct validity, since, among other aspects, some issues related to the usability of the tool were evaluated. In this sense, it would be desirable to carry out a new evaluation involving software usability experts in order to obtain more precise metrics. In any case, it is obvious that a single experiment cannot be used to evaluate all aspects of a single proposal, so it would be necessary to carry out a specific evaluation of each of its ramifications.
Internal validity refers to the causal relationship between the proposal and the results obtained, so threats arise when the result is influenced by an undesirable factor. In this sense, several threats were identified during the evaluation phase of the modelling environment. For example, during the laboratory case study, we calculated how much time the INNoVaServ transformations could save compared to the manual creation of the same models. However, the results obtained could have been influenced by the specific case used, so it would be desirable to repeat this study for all possible case studies in order to calculate average values and obtain more accurate results. On the other hand, it should be noted that this study was carried out once it was known what the final result of each model should be in order to avoid other threats related to the loss of time in design decisions.
Related to the previous threats, during the empirical study, participants were asked to rate the time savings of the INNoVaServ transformations. However, in this case, the subjects were only working with the transformations, so since they had not previously performed the same models manually, their responses consisted of mere perceptions. In order to solve this problem, two groups of subjects could be set up: one to complete the experiment completely manually and the other to use the transformations. In this way, the times taken to complete the task could be measured and then compared. Thus, the calculation would be similar to the one carried out during the case study.
On the other hand, during the case study, we also calculated how close to reality the models generated by the INNoVaServ transformations were. A limitation of this study is that the models resulting from each transformation are conditioned on the amount of information collected in the input models, so that if the latter were incomplete, the transformations would be less effective. To address this problem, up to five different case studies were used in this analysis. However, it would be desirable to use even more cases to obtain more accurate results.
Another internal limitation relates to the lack of separation into groups according to participants with prior experience with modeling notations. This could introduce bias in the perception of usability and efficiency of the tool. However, the primary goal of the empirical study was exploratory, focusing on validating the functionality of the prototype rather than comparing groups. To mitigate this threat, participants were provided with short manuals and assisted during the session. Furthermore, this empirical validation is complemented by a laboratory case study, which strengthens the overall credibility of the findings.
Finally, since the modelling environment consists of a prototype for research tasks, there were numerous usability weaknesses that could affect the experience of the participants in the empirical study. To avoid this internal threat, it was decided to control the experiment by assisting the participants in case they had problems or questions related to the use of INNoVaServ.
Conclusion validity refers to the capacity of the statistical analysis to produce correct conclusions about the relationship between the proposal and the outcome of the experiment. Therefore, threats to the validity of the conclusion occur when the requirements for using a particular statistical test are not met or when the statistical reliability of a test is low. In this sense, we are confident that the statistical analysis carried out during the evaluation phase of this work is correct. In order to demonstrate this, the calculation of the ICC was carried out after the empirical study had been executed, which showed good reliability. Furthermore, the questionnaires used in this empirical study allowed us to obtain the information we were looking for, and the models obtained showed that the participants had fully understood the objective of the session, so there were no problems of misunderstanding. In any case, for reasons of transparency and reproducibility, the dataset of each participant’s answers to the questions asked in the questionnaires has been made online and available to the public.
Finally, external validity refers to the generalisation of the obtained results to other environments or contexts not considered in the study, so threats of this nature arise when the group of subjects in an experiment is not representative of the population to be studied, or when an inappropriate experimental environment is chosen. In this sense, the empirical study involved nine participants, which limits the external validity of the findings. It should be noted that the presented evaluation is not an automatic validation process but rather an evaluation that requires a high workload from participants, as they must perform complex modelling tasks using multiple notations. Recruiting a larger sample is challenging in empirical software engineering studies, as widely recognized in the literature [70], where participant recruitment is considered a persistent difficulty. Nevertheless, this limitation is partially mitigated by the complementary validation conducted through multiple case studies, which strengthens the overall credibility of the results.
On the other hand, although the empirical study was conducted in a research context and its results cannot be generalized to industrial environments, this limitation is inherent to the exploratory nature of the work. The goal was to validate the feasibility and functionality of the proposed modelling environment. This limitation is yet partially mitigated by the validation process involving laboratory case studies that simulate realistic scenarios since, again, the literature illustrates the difficulty of validating artifacts in industry due to factors such as costs, access, and heterogeneity of contexts [70]. In any case, once the improvements identified in the validation process have been implemented, the artifact should be re-evaluated in more realistic environments.
7. Conclusions and Future Work
This paper has presented INNoVaServ, a modelling environment for service design that uses MDE techniques to enable integrated working with different notations. To conclude, this section describes the main findings, as well as some future lines of research that will serve to continue working on the improvement of the proposal and to explore other related directions of work.
7.1. Conclusions
In the early stages of this work, a study of technological tools for business and process modelling was carried out. The main result of this research was that there was no technological environment that supported the modelling and integrated management of business and process models with different techniques in the context of service design. In light of this finding, the aim was to develop a modelling environment using MDE to fill this gap and to evaluate its usefulness in such a context.
Beyond technical integration, this work emphasizes the human dimension of service design. Fragmented workflows and constant tool-switching often lead to cognitive overload, stress, and reduced engagement among designers. By consolidating multiple modelling notations into a unified environment and automating repetitive tasks, INNoVaServ helps to alleviate mental effort, fosters consistency, and supports a more fluid design experience. These improvements align with research on digital well-being and workplace ergonomics [21,22], suggesting that technological integration can actively contribute to healthier and more satisfying work environments.
To develop the modelling environment, the first step was to select the notations to be supported. Taking the double diamond model for service design as a reference, different business (BMC, value) and process (SBP, PCN and BPMN) modelling notations were selected. Note that this choice of notations is merely a preliminary proposal.
In order to achieve the construction of technological bridges to connect the selected notations, a study was carried out to identify the correspondences between the elements of the different techniques. As a further result of this study, it was concluded that many of the correspondences found require certain design decisions to be made. Therefore, it would not be possible to fully automate the transformations to be implemented, but would require the assistance of the service designer to make these decisions when moving from one model to another.
Based on the previous analysis, the artefact of this work was developed: INNoVaServ, a modelling environment for service design that integrates a set of graphical DSLs to support business and process modelling with different notations in an integrated way. This environment uses MDE techniques, so it is not just a simple diagramming tool, but allows the processing of the information collected in the models represented by each diagram. In addition, INNoVaServ includes a dashboard for managing the models involved in a given service design project, allowing the different transformations to be invoked. Moreover, INNoVaServ also supports other tasks such as the formal validation of SBP and PCN models. Finally, it is also worth mentioning that, according to the results of the analysis of related works, INNoVaServ is the first technological solution to support the PCN notation.
In order to evaluate the proposal, a laboratory case study was carried out to verify its correct functioning and the efficiency of some of its features, such as the time saved and the quality of the models generated with the semi-automatic transformations. An empirical study was also carried out in which participants, including researchers and service professionals, evaluated their experience with the tool in comparison with other alternatives. This analysis made it possible to identify some advantages of INNoVaServ as well as some aspects to improve the environment.
The results of the evaluation not only demonstrate technical benefits but also suggest positive implications for designers’ well-being. Time savings of up to 36.4% and model completeness close to 97.7% indicate a reduction in manual workload and decision fatigue, which can help mitigate stress and improve psychological comfort during intensive modelling tasks. These factors are known contributors to stress in complex design tasks [66], suggesting that integrated modelling environments can positively influence designer well-being.
From an ethical and practical perspective, supporting designers’ well-being should be considered a core objective in the development of digital tools for service design. Future research should explore this dimension more systematically, incorporating validated metrics of well-being (e.g., perceived stress, engagement, satisfaction) and conducting longitudinal studies in real-world settings.
Regarding the limitations of applying the research results of this work, it should be noted that the proposed environment is a functional prototype intended for exploratory validation. Its use in industrial settings requires further empirical studies with larger and more diverse samples to confirm the observed benefits. Therefore, the current findings should be interpreted as indicative of the benefits that the proposal presented entails for service designers.
Finally, this work contributes to the understanding of modelling notation integration by demonstrating that MDE principles can effectively bridge heterogeneous business and process modelling languages in service design. Unlike previous approaches that treated notations in isolation, our proposal introduces a unified environment with formal correspondences and semi-automatic transformations, showing that integration is feasible and can significantly reduce modelling effort while improving consistency. This advances the state of knowledge by positioning MDE as a practical enabler for multi-notation service design.
7.2. Future Work
Several lines of future research have been identified from the contributions of this work. For example, in the short term, one of the immediate objectives is to develop a web version of the modelling environment. On the one hand, this would avoid the disadvantages associated with the use of a desktop and offline distribution of the Eclipse IDE, and would address some of the shortcomings identified during the evaluation of the initial prototype. On the other hand, a version of INNoVaServ with these features will open the door to supporting collaborative work, which not only improves efficiency but also reduces stress and isolation in distributed teams, contributing to the well-being and engagement of service designers.
Furthermore, the approach taken in this work to link the business modelling notations with those of process modelling is to estimate the number of process models required to represent a given value proposition. However, there are other complementary approaches like [68]. Therefore, another future objective is to integrate the necessary technological support in INNoVaServ to allow the automation of the derivation guides proposed in these approaches. In addition, the improvements in transformations identified during the evaluation phase will also be addressed.
In the medium and long term, another objective is to connect the models developed by INNoVaServ with data generated by the daily operations of organisations, and to generate new models from these data by applying process mining techniques, helping designers make informed decisions with less cognitive effort and greater confidence, which can positively impact their well-being. In this way, enriching the models with high-level information generated from these data could facilitate the identification of a service’s strengths and weaknesses and guide or facilitate the organisation’s strategic decision-making.
Finally, it is worth mentioning that work has started on the integration of a DSL for the representation of Smart Contracts in the INNoVaServ environment [71]. Therefore, another future work consists of continuing this line of research in order to achieve the semi-automatic generation of Solidity Smart Contracts for services, based on the business or process models used for its design.
Author Contributions
Conceptualization, F.J.P.-B. and J.M.V.; methodology, F.J.P.-B. and J.M.V.; validation, F.J.P.-B., J.M.V., C.G.-M., C.V. and D.G.; Software, F.J.P.-B. and C.G.-M.; formal analysis, F.J.P.-B. and J.M.V.; investigation, F.J.P.-B., J.M.V. and C.G.-M.; Resources, F.J.P.-B., J.M.V. and C.G.-M.; data curation, F.J.P.-B. and D.G.; writing—original draft preparation, F.J.P.-B.; writing—review and editing, J.M.V.; visualization, F.J.P.-B.; supervision, J.M.V.; funding acquisition, D.G. and J.M.V. All authors have read and agreed to the published version of the manuscript.
Funding
Thisresearch was funded by the Ministry of Science and Innovation of Spain, grant number PID2020-117244RB-100 (SerDigital project); by the European Commission, grant name SIC-SPAIN 4.0 (Safer Internet Centre Spain 4.0 project); by the Community of Madrid, grant number TEC-2024/COM-235 (DESAFíOCM project); and by Universidad Rey Juan Carlos, grant number 2024/SOLCON-137672 (GESMOD project, IMPULSO call for proposals).
Institutional Review Board Statement
Not applicable.
Informed Consent Statement
Informed consent was obtained from all subjects involved in the study.
Data Availability Statement
The data presented in this study are openly available at https://data.mendeley.com/datasets/jtdwhbm4gk/1 (accessed on 9 October 2025).
Acknowledgments
The authors acknowledge the use of DeepL during the preparation of this work to assist in improving the language. After utilizing this service, the authors reviewed and edited the content as necessary and assume full responsibility for the final content of this work.
Conflicts of Interest
The authors declare no conflicts of interest.
Abbreviations
The following abbreviations are used in this manuscript:
| AI | Artificial Intelligence |
| BMC | Business Model Canvas |
| BPMN | Business Process Model and Notation |
| DSL | Domain-Specific Language |
| DSR | Design Science Research |
| EMF | Eclipse Modeling Framework |
| EOL | Epsilon Object Language |
| ETL | Epsilon Transformation Language |
| EVL | Epsilon Validation Language |
| FDP | Final Degree Project |
| GEF | Graphical Editing Framework |
| GMF | Graphical Modeling Framework |
| ICC | Intraclass Correlation Coefficient |
| IoT | Internet of Things |
| JDK | Java Development Kit |
| MDE | Model-Driven Engineering |
| PCN | Process Chain Network |
| SBP | Service Blueprint |
| UML | Unified Modelling Language |
Notes
| 1 | https://www.ideo.com/ (accessed on 9 October 2025). |
| 2 | INNoVaServ can be downloaded from https://data.mendeley.com/datasets/jtdwhbm4gk/1 (accessed on 9 October 2025). |
| 3 | https://www.designcouncil.org.uk/ (accessed on 9 October 2025). |
| 4 | https://www.essi.upc.edu/~xoriol/opexec/ (accessed on 9 October 2025). |
References
- Teece, D.J. Business models, business strategy and innovation. Long Range Plan. 2010, 43, 172–194. [Google Scholar] [CrossRef]
- Osterwalder, A.; Pigneur, Y. Business Model Generation: A Handbook for Visionaries, Game Changers, and Challengers; John Wiley & Sons: Hoboken, NJ, USA, 2010. [Google Scholar]
- Salwin, M.; Jacyna-Gołda, I.; Kraslawski, A.; Waszkiewicz, A.E. The use of business model canvas in the design and classification of product-service systems design methods. Sustainability 2022, 14, 4283. [Google Scholar] [CrossRef]
- Lewis, M. The New New Thing: A Silicon Valley Story; WW Norton & Company: New York, NY, USA, 2000. [Google Scholar]
- Bridgeland, D.M.; Zahavi, R. Business Modeling: A Practical Guide to Realizing Business Value; Morgan Kaufmann: San Francisco, CA, USA, 2008. [Google Scholar]
- Wirtz, B.W.; MÜLLER, W.M.; Langer, P.F. Digital Business Models A Literature-Based Taxonomy And Research Avenues. Int. J. Innov. Manag. 2023, 27, 2330003. [Google Scholar] [CrossRef]
- Möller, F.; Stachon, M.; Azkan, C.; Schoormann, T.; Otto, B. Designing business model taxonomies–synthesis and guidance from information systems research. Electron. Mark. 2022, 32, 701–726. [Google Scholar] [CrossRef]
- Saco, R.M.; Goncalves, A.P. Service design: An appraisal. Des. Manag. Rev. 2008, 19, 10–19. [Google Scholar] [CrossRef]
- Lee, S.H.; Yang, M.; de Weck, O.L.; Lee, C.; Coughlin, J.F.; Klopfer, E.; Ochsendorf, J. Service design in action: Transformation, consideration, and system thinking. Proc. Des. Soc. 2023, 3, 3145–3154. [Google Scholar] [CrossRef]
- Cook, L.S.; Bowen, D.E.; Chase, R.B.; Dasu, S.; Stewart, D.M.; Tansik, D.A. Human issues in service design. J. Oper. Manag. 2002, 20, 159–174. [Google Scholar] [CrossRef]
- Shostack, L. Designing services that deliver. Harv. Bus. Rev. 1984, 84115. [Google Scholar]
- Blaurock, M.; Büttgen, M.; Schepers, J. Designing collaborative intelligence systems for employee-AI service co-production. J. Serv. Res. 2024, 28, 544–562. [Google Scholar] [CrossRef]
- Chin, H.; Marasini, D.P.; Lee, D. Digital transformation trends in service industries. Serv. Bus. 2023, 17, 11–36. [Google Scholar] [CrossRef]
- Mayer, S.; Schwemmle, M. The impact of design thinking and its underlying theoretical mechanisms: A review of the literature. Creat. Innov. Manag. 2025, 34, 78–110. [Google Scholar] [CrossRef]
- Grönroos, C. Business model innovation through the adoption of service logic: Evolving to servification. J. Serv. Theory Pract. 2024, 34, 347–360. [Google Scholar] [CrossRef]
- Chen, X.; Thapa, D. Clarifying the business model construct: A theory-driven integrative literature review through ecosystems and open systems perspectives. Rev. Manag. Sci. 2025, 1–34. [Google Scholar] [CrossRef]
- Gordijn, J. E-business value modelling using the e3-value ontology. In Value Creation from E-Business Models; Elsevier: Amsterdam, The Netherlands, 2004; pp. 98–127. [Google Scholar]
- Chinosi, M.; Trombetta, A. BPMN: An introduction to the standard. Comput. Stand. Interfaces 2012, 34, 124–134. [Google Scholar] [CrossRef]
- Sampson, S.E. Visualizing service operations. J. Serv. Res. 2012, 15, 182–198. [Google Scholar] [CrossRef]
- da Silva, A.; Cardoso, A. Rethinking service blueprint for digital coopetition: A new framework for networked collaboration. J. Infrastruct. Policy Dev. 2024, 8, 7072. [Google Scholar] [CrossRef]
- Gruman, J.A.; Choi, E. Well-being at work: A balanced approach to positive organizational studies. In The Palgrave Handbook of Workplace Well-Being; Springer: Berlin/Heidelberg, Germany, 2021; pp. 169–207. [Google Scholar]
- Uslu, O. Understanding digital wellbeing: Impacts, strategies, and the path to healthier technology practices. Discov. Soc. Sci. Health 2025, 5, 145. [Google Scholar] [CrossRef]
- Götzinger, D.; Miron, E.T.; Staffel, F. OMiLAB: An open collaborative environment for modeling method engineering. In Domain-Specific Conceptual Modeling: Concepts, Methods and Tools; Springer: Cham, Switzerland, 2016; pp. 55–76. [Google Scholar] [CrossRef]
- Yin, L.; Liu, J.; Ding, Z. Modeling and prototyping business processes in AutoPA. In Proceedings of the 2011 Fifth International Conference on Theoretical Aspects of Software Engineering, Xi’an, China, 29–31 August 2011. [Google Scholar]
- Di Ruscio, D.; Kolovos, D.; de Lara, J.; Pierantonio, A.; Tisi, M.; Wimmer, M. Low-code development and model-driven engineering: Two sides of the same coin? Softw. Syst. Model. 2022, 21, 437–446. [Google Scholar] [CrossRef]
- Pérez Blanco, F.J.; Vara, J.M.; Gómez, C.; De Castro, V.; Marcos, E. Leveraging Service Design by bridging business and process modeling. In Proceedings of the 55th Hawaii International Conference on System Sciences, Maui, HI, USA, 4–7 January 2022. [Google Scholar] [CrossRef]
- Pérez Blanco, F.J. INNoVaServ: Un Entorno de Modelado para el Diseño de Servicios. Ph.D. Thesis, Universidad Rey Juan Carlos, Madrid, Spain, 2022. Available online: https://hdl.handle.net/10115/20701 (accessed on 9 October 2025).
- Thomas, B.; Skinner, H. Dissertation to journal article: A systematic approach. Educ. Res. Int. 2012, 2012, 862135. [Google Scholar] [CrossRef]
- American Psychological Association. Publication Manual of the American Psychological Association, 7th ed.; American Psychological Association: Washington, DC, USA, 2020. [Google Scholar]
- Whittle, J.; Hutchinson, J.; Rouncefield, M. The state of practice in model-driven engineering. IEEE Softw. 2013, 31, 79–85. [Google Scholar] [CrossRef]
- Araújo, W.J.D.; Gomes, T.A. Evaluation of business process management systems (BPMS): Analysis of Bizagi and Bonita softwares. RDBCI Rev. Digit. Bibliotecon. Ciênc. Inf. 2023, 20, e022023. [Google Scholar]
- Ramdani, M.; Ferhati, M.S.; Lassel, H.; Kahloul, L.; Choucha, C.E. Optimizing Research Laboratory Workflows in Algeria Through Low-Code BPMN Implementation with BonitaSoft. In Proceedings of the 2025 International Symposium on iNnovative Informatics of Biskra (ISNIB), Biskra, Algeria, 28–30 January 2025; pp. 1–6. [Google Scholar]
- Kang, G.; Cheng, H.; Liu, J.; Wen, Y.; Peng, J. Business Process Modeling for Industrial Internet Application via BPMN Extension. IEEE Trans. Autom. Sci. Eng. 2024, 22, 813–829. [Google Scholar] [CrossRef]
- Kolluri, S. Leveraging SAP Signavio for End-to-End Business Process Transformation: A Framework for Implementation and Usage in Intelligent Enterprises. J. Comput. Sci. Technol. Stud. 2025, 7, 652–661. [Google Scholar] [CrossRef]
- Hendrawan, E.; Meisel, M.; Sari, D.N. Analysis and implementation of computer network systems using software draw.io. Asia Inf. Syst. J. 2023, 2, 9–15. [Google Scholar]
- Janicki, J.; Wójcik, E. Tools for analysis of business processes–a comparative analysis. J. Comput. Sci. Inst. 2021, 20, 165–169. [Google Scholar] [CrossRef]
- Parker, D.J. Microsoft visio 2013 Business Process Diagramming and Validation; Packt Publishing Ltd.: Birmingham, UK, 2013. [Google Scholar]
- Abou-Khalil, W.; Eid, O.; Sokhn, M.; Chamoun, R.K. A canvas-based AI-driven framework supporting SMEs digital transformation roadmap. In Proceedings of the 2025 International Conference on Computer, Information and Telecommunication Systems (CITS), Colmar, France, 16–18 July 2025; pp. 1–8. [Google Scholar]
- Szopinski, D.; Schoormann, T.; John, T.; Knackstedt, R.; Kundisch, D. How Software Can Support Innovating Business Models: A Taxonomy of Functions of Business Model Development Tools. In Proceedings of the 23rd Americas Conference on Information Systems (AMCIS), Boston, MA, USA, 10–12 August 2017. [Google Scholar]
- Lee, L.J. Tools: MIRO Real-Time Board, Visual Collaborations and Tools, Easy Screen Sharing And Presentation. 2019. Available online: https://hdl.handle.net/20.500.11766/10605 (accessed on 9 October 2025).
- Vikström, M.; Tuunanen, T.; Hönigsberg, S. Recombining Operant Resources: Integrating Service Design and Service Engineering to Improve Service Innovation. In Proceedings of the 57th Hawaii International Conference on System Sciences, Hawaii, HI, USA, 3–6 January 2024. [Google Scholar]
- García Lechuga, A.; Cortés Robles, G.; Arredondo Soto, K.C.; Miranda Ackerman, M.A. The integration of the business model canvas and the service blueprinting to assist the conceptual design of new product-service systems. J. Clean. Prod. 2023, 415, 137801. [Google Scholar] [CrossRef]
- Schoormann, T.; Hagen, S.; Brinker, J.; Wildau, S.; Thomas, O.; Knackstedt, R. Towards Aligning Business Models with Business Processes: A Tool-based Approach. In Modellierung; Gesellschaft für Informatik e.V.: Bonn, Germany, 2020; pp. 13–27. [Google Scholar]
- Six, T.; Lederer, M.; Schmidt, W.; Nirschl, M. Business Process Management Bridging Marketing and IT: Transformation Model for Customer Journey Maps and BPMN. In Subject-Oriented Business Process Management. Dynamic Digital Design of Everything—Designing or Being Designed; Springer: Berlin/Heidelberg, Germany, 2022; pp. 95–114. [Google Scholar]
- Lara Machado, P.; van de Ven, M.; Aysolmaz, B.; Athanasopoulou, A.; Ozkan, B.; Turetken, O. Methods that bridge business models and business processes: A synthesis of the literature. Bus. Process Manag. J. 2023, 29, 48–74. [Google Scholar] [CrossRef]
- Kazemzadeh, Y.; Milton, S.; Johnson, L. A Conceptual Comparison of Service Blueprinting and Business Process Modeling Notation (BPMN). Asian Soc. Sci. 2015, 11, 307. [Google Scholar] [CrossRef]
- Kazemzadeh, Y.; Milton, S.; Johnson, L. A Comparison of Concepts in Service Blueprinting and Process Chain Network (PCN). Int. J. Bus. Manag. 2015, 10, 13. [Google Scholar] [CrossRef]
- Kazemzadeh, Y.; Milton, S.K.; Johnson, L.W. Service blueprinting and process-chain-network: An ontological comparison. Int. J. Qual. Res. Serv. 2015, 2, 1–12. [Google Scholar] [CrossRef]
- Kazemzadeh, Y.; Milton, S.K.; Johnson, L. Process chain Network (PCN) and business process modeling notation (BPMN): A comparison of concepts. J. Manag. Strategy 2015, 6, 88–99. [Google Scholar] [CrossRef]
- Fatemi, H.; van Sinderen, M.; Wieringa, R. E3value to BPMN Model Transformation. In Adaptation and Value Creating Collaborative Networks; Springer: Berlin/Heidelberg, Germany, 2011; pp. 333–340. [Google Scholar]
- Hevner, A.; Chatterjee, S. Introduction to design science research. In Design Science Research Cases; Springer: Berlin/Heidelberg, Germany, 2010; pp. 1–8. [Google Scholar]
- Hevner, A.R.; March, S.T.; Park, J.; Ram, S. Design science in information systems research. MIS Q. 2004, 75–105. [Google Scholar] [CrossRef]
- Rhazali, Y.; Hadi, Y.; Mouloudi, A. Model Transformation with ATL into MDA from CIM to PIM Structured through MVC. Procedia Comput. Sci. 2016, 83, 1096–1101. [Google Scholar] [CrossRef]
- Parnas, D.L. On the criteria to be used in decomposing systems into modules. In Pioneers and Their Contributions to Software Engineering; Springer: Berlin/Heidelberg, Germany, 1972; pp. 479–498. [Google Scholar]
- Steinberg, D.; Budinsky, F.; Merks, E.; Paternostro, M. EMF: Eclipse Modeling Framework; Pearson Education: Singapore, 2008. [Google Scholar]
- Gómez-Martínez, E.; Pérez-Blanco, F.; de Lara, J.; Vara, J.M.; Marcos, E. Formal support of process chain networks using model-driven engineering and petri nets. In Proceedings of the 34th ACM/SIGAPP Symposium on Applied Computing; ACM: New York, NY, USA, 2019; pp. 98–100. [Google Scholar]
- Estañol, M.; Marcos, E.; Oriol, X.; Pérez, F.J.; Teniente, E.; Vara, J.M. Validation of service blueprint models by means of formal simulation techniques. In Proceedings of the Service-Oriented Computing: 15th International Conference, ICSOC 2017, Malaga, Spain, 13–16 November 2017; pp. 80–95. [Google Scholar]
- Yin, R.K. Case Study Research: Design and Methods; SAGE: Los Angeles, CA, USA, 1994; Volume 5. [Google Scholar]
- Wohlin, C.; Runeson, P.; Höst, M.; Ohlsson, M.C.; Regnell, B.; Wesslén, A. Experimentation in Software Engineering; Springer Science & Business Media: Berlin/Heidelberg, Germany, 2012. [Google Scholar]
- Jedlitschka, A.; Pfahl, D. Reporting guidelines for controlled experiments in software engineering. In Proceedings of the 2005 International Symposium on Empirical Software Engineering, Noosa Heads, Australia, 17–18 November 2005; p. 10. [Google Scholar]
- Pfleeger, S.L.; Kitchenham, B.A. Principles of survey research: Part 1: Turning lemons into lemonade. ACM SIGSOFT Softw. Eng. Notes 2001, 26, 16–18. [Google Scholar] [CrossRef]
- Wieringa, R.J. Design Science Methodology for Information Systems and Software Engineering; Springer: Berlin/Heidelberg, Germany, 2014. [Google Scholar]
- Matos Claro, S.; Ruiz de la Peña, J.; Lamoth Borrero, L.; Snoeck, M. Technology for Automatic Usability Evaluation Using Model Driven Engineering. In Proceedings of the International Conference on Business Process Modeling, Development and Support, Limassol, Cyprus, 3–4 June 2024; Springer: Berlin/Heidelberg, Germany, 2024; pp. 191–200. [Google Scholar]
- Fisher, R.A. On the’probable error’of a coefficient of correlation deduced from a small sample. Metron 1921, 1, 1–32. [Google Scholar]
- Fleiss, J.L. Design and Analysis of Clinical Experiments; John Wiley & Sons: Hoboken, NJ, USA, 2011. [Google Scholar]
- Bakker, A.B.; Demerouti, E. The job demands-resources model: State of the art. J. Manag. Psychol. 2007, 22, 309–328. [Google Scholar] [CrossRef]
- Choudhury, A.; Malavolta, I.; Ciccozzi, F.; Aslam, K.; Lago, P. The technological landscape of collaborative model-driven software engineering. Softw. Syst. Model. 2025, 24, 1595–1619. [Google Scholar] [CrossRef]
- Hotie, F.; Gordijn, J. Value-based process model design. Bus. Inf. Syst. Eng. 2019, 61, 163–180. [Google Scholar] [CrossRef]
- Cairns, P.A. Experimental methods in human-computer interaction. In Encylopedia of Human-Computer Interaction, 2nd ed.; IGI Global: Hershey, PA, USA, 2016; p. 34. [Google Scholar]
- Kitchenham, B.; Madeyski, L. Recommendations for analysing and meta-analysing small sample size software engineering experiments. Empir. Softw. Eng. 2024, 29, 137. [Google Scholar] [CrossRef]
- Gómez-Macías, C.; Pérez-Blanco, F.J.; Granada, D.; Vara, J.M. Integrating smart contracts into the modeling paradigm to harness the potential of models. Softw. Syst. Model. 2025, 24, 823–842. [Google Scholar] [CrossRef]
Disclaimer/Publisher’s Note: The statements, opinions and data contained in all publications are solely those of the individual author(s) and contributor(s) and not of MDPI and/or the editor(s). MDPI and/or the editor(s) disclaim responsibility for any injury to people or property resulting from any ideas, methods, instructions or products referred to in the content. |
© 2025 by the authors. Licensee MDPI, Basel, Switzerland. This article is an open access article distributed under the terms and conditions of the Creative Commons Attribution (CC BY) license (https://creativecommons.org/licenses/by/4.0/).