Abstract
This study examines the peer effects of bank digital transformation facilitated by shareholder networks and explores the underlying mechanisms. A time-varying network is constructed based on common shareholder connections among banks, and a corresponding measure is developed to quantify peer effects in digital transformation. Using the Peking University digital transformation index together with ownership and financial data from CSMAR, an empirical analysis is performed on a panel of 114 Chinese commercial banks from 2010 to 2021 to evaluate these effects. Fixed-effects estimations indicate that bank digital transformation is significantly affected by peer effects transmitted through common shareholder connections, with a one-unit increase in peers’ digitalization index associated with a 0.151-unit rise in the focal bank’s index. These findings remain robust and economically meaningful across alternative specifications, including system GMM, IV/2SLS designs, and different ownership thresholds. Further analyses indicate that the peer effects operate through mechanisms such as intensified competition, enhanced information sharing, and pooled resources. However, such peer influence also exacerbates disparities in digital progress across the industry, reflecting a Matthew Effect in which leading banks consolidate their advantages. Heterogeneity analysis reveals that the peer effects are more pronounced among banks with larger workforces, more diversified operations, and higher ownership concentration. The findings of this study provide insights into how financial institutions can leverage technological innovations through network-based channels, offering practical implications for promoting industry-wide transformation in the digital economy era.
1. Introduction
The rapid evolution of financial technology has posed profound challenges to traditional banking models [1]. In the digital economy era, digital transformation has emerged as a critical strategic response for commercial banks seeking to maintain long-term competitiveness [2]. Beyond specific technological developments such as intelligent risk assessment, automated operational workflows, and personalized financial services, digital transformation reflects a fundamental restructuring of banking practices in terms of operational efficiency, customer engagement, and risk management [3,4].
Bank digital transformation is not an isolated process. Rather, it is often influenced by the actions of peer institutions, giving rise to significant peer effects across the industry [5]. These effects play a crucial role in shaping the overall trajectory of digital transformation within the banking sector. On the one hand, peer effects can accelerate collective progress. The initiatives of leading banks create valuable precedents that reduce barriers to adoption for others, thereby facilitating the diffusion of digital innovations throughout the sector [6]. On the other hand, peer effects may also deepen existing disparities. Leading banks may leverage their superior resources to consolidate advantages, while other banks face capital and talent constraints in their efforts to catch up [7,8].
Understanding how peer effects shape bank digital transformation is an important research question that warrants particular attention. Specifically, peer effects in the banking sector appear to exhibit distinctive characteristics that differentiate them from those observed in other industries [9,10]. Prior research on firms has primarily examined peer influence through industry similarity, geographic proximity, and shared organizational attributes [11]. However, given the unique structural and operational features of the banking industry, the applicability of these traditional peer influence channels remains uncertain [12].
The role of governance-based channels, particularly common-shareholder networks, has received limited attention in the related literature, thus leaving a clear research gap. In fact, common shareholder networks provide a theoretically grounded and empirically tractable channel through which peer effects unfold in banking. By connecting multiple banks through shared ownership, common shareholders act as coordinated governance agents who influence digital transformation by aligning capital allocation, overseeing board decisions, and shaping strategic direction across affiliated institutions [13]. These common ownership links also facilitate information transmission and resource coordination [14]. As such, shareholder networks function as a governance-based conduit for peer influence that extends beyond geographic and organizational boundaries.
This study addresses the identified research gap by demonstrating that shareholder networks constitute a distinct and previously underexplored channel of peer effects in bank digital transformation. First, a measure is constructed to quantify these effects. Specifically, each bank is treated as a node in a shareholder network, with a connection formed between two banks if they share at least one of the top ten shareholders. The peer effect is defined as the average level of digital transformation among a bank’s connected peers. Using data from 114 Chinese commercial banks between 2010 and 2021, an empirical analysis is performed to assess the explanatory power of the peer effect measure. The findings reveal significant peer effects in bank digital transformation transmitted through common shareholder connections. Further analysis indicates that these effects are driven by mechanisms such as enhanced competition, information sharing, and resource pooling. Moreover, the peer effects of digital transformation are particularly advantageous for banks already leading in this domain, reflecting a “Matthew Effect”. Heterogeneity analysis shows that these effects are more pronounced among banks with larger workforces, more diversified operations, and higher ownership concentration. These results further support the presence of the Matthew Effect and clarify the mechanisms through which it operates.
The remainder of the paper is organized as follows. Section 2 reviews the literature and highlights the study’s contributions. Section 3 presents the theoretical framework and hypotheses. Section 4 details the construction of the bank shareholder networks and the measure of the corresponding peer effects. Section 5 reports the empirical findings, and Section 6 concludes the study.
2. Literature Review and Contributions
This study contributes to three strands of literature. First, it extends the research on peer effects in digital transformation. Prior studies have reported mixed conclusions regarding the outcomes of such peer effects. Many have documented improvements in investment efficiency [15], business performance [16], ESG outcomes [17,18,19], and innovation behaviors [20,21], while others have identified suppressive impacts on long-horizon investment [22] and amplification of systemic risk [5]. The direction and magnitude of peer influence can also vary depending on market conditions, firm characteristics, and the specific peer channel employed [21,23]. Evidence from this study likewise indicates a two-sided pattern, where peer influence can accelerate digital adoption by individual banks yet also widen gaps across the sector.
Regarding peer channels, prior studies have mainly focused on firms or individuals and emphasized industry-wide or spatial links [11,17,24]. This study instead examines governance links formed through common shareholders as a distinct channel, which is more salient than geographic or sectoral proximity in the banking sector.
Second, this study complements work on the drivers of bank digital transformation. Prior research has highlighted disruptions from financial technology firms that reshape competition and spur digital adoption [1,25]. Bank-level studies often consider factors such as employee characteristics, organizational performance, and digital experience [26], but have offered limited attention to how practices spread across banks. Positioning peer influence within shareholder networks highlights an additional and significant driving force that connects sector-level shocks to bank-level adoption.
Third, this study advances the emerging literature on common shareholder networks. Prior research has shown that network centrality at the firm level is associated with lower financing costs [27,28], stronger stock price performance [29,30], and greater corporate innovation [31,32,33]. A smaller body of work has applied this approach to commercial banks, relating network structures to board governance and risk-taking, with mixed evidence for the latter [13,14]. Building on this foundation, the study examines how network centrality relates to bank digital transformation and introduces a metric to measure peer exposure within shareholder networks [34,35]. This approach helps differentiate genuine transmission from simple co-movement and provides a clear link from the literature to the hypotheses that follow.
3. Theoretical Framework and Hypotheses
Peer effects shape how digital transformation spreads within and across banks. When certain banks succeed in their digital transformation initiatives, others can observe and emulate these pioneers, thereby reducing the risks associated with trial and error [16]. At the industry ecosystem level, peer effects promote the standardization of technological frameworks, generating cross-institutional network effects that accelerate digital transformation across the entire banking sector [36].
This study adopts a governance network perspective to analyze peer effects in bank digital transformation. The theoretical framework consists of three components. The first examines whether the shareholder network channel transmits digital practices across banks. The second explores the mechanisms that moderate this transmission, namely enhanced competition, information sharing, and resource pooling. The third evaluates cross-sectional heterogeneity consistent with a Matthew Effect, in which stronger institutions benefit more from the same peer exposure.
Figure 1 presents the theoretical analytical framework, which outlines the conceptual linkages and logical pathways that guide the hypotheses and the empirical design.
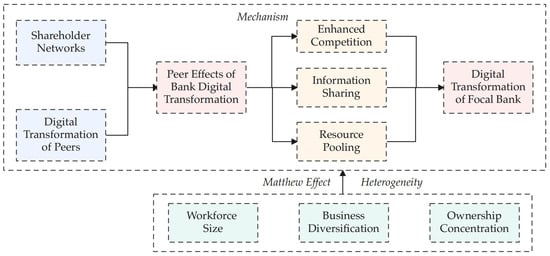
Figure 1.
Theoretical analytical framework.
Prior research on non-financial firms has documented salient industry peer effects [15,16,19,20,22] and spatial peer effects [17,21,23,37,38] in digital transformation, but the external validity of these channels for banks may be limited. Peer influence in banking has been shown to exhibit distinct characteristics compared with canonical peer channels documented for non-financial firms [9,10]. For instance, local commercial banks and rural financial institutions often operate in highly segmented markets, resulting in limited interaction even among geographically close institutions [12]. Direct competition for market share can also discourage voluntary sharing among banks engaging in comparable lines of business. Consequently, geographic or sectoral proximity provides weak signals of payoff-relevant actions and often fails to capture the deeper structural and strategic interdependencies that influence banks’ digital transformation.
A growing subset of studies indicates that shareholder networks can transmit peer effects among firms [34,35]. In the context of banking, common shareholder connections also provide a governance-based linkage that aligns incentives and sustains repeated interaction across affiliated institutions [14]. Shareholders, particularly institutional investors, play a central role in shaping strategic decisions by influencing capital allocation, oversight practices, and the long-term priorities of affiliated banks [39,40,41]. As a result, banks under overlapping shareholder influence tend to converge toward similar innovation agendas. Moreover, the benefits of digital transformation are partially internalized within shareholder networks, thereby promoting coordinated responses to new technologies beyond geographic or industry-based proximity [32,42].
Based on this analysis, the following hypothesis is proposed:
H1:
The digital transformation of commercial banks generates significant peer effects through shareholder networks.
Having established that shareholder networks facilitate peer effects in digital transformation, the analysis next explores the underlying mechanisms through which these effects occur. Prior research indicates that governance ties created by common shareholders align incentives, ease information flows, and expand access to shared resources [13,14]. Accordingly, the analysis examines whether these mechanisms make banks’ digital transformation more responsive to connected peers.
First, competition creates strategic complementarity in digital transformation. When a bank observes a connected peer gaining a competitive edge through digital innovation, the marginal return to closing the gap rises, thereby prompting the focal bank’s own adoption [11]. The response is supposed to be stronger where competitive pressure is more intense because payoffs are more sensitive to relative performance [10]. Such evidence on competition and strategic responses yields a testable implication that the association between peer exposure and the focal bank’s digitalization should be stronger in more competitive markets [17,24].
Second, shareholder networks reduce frictions in information dissemination. Under technological uncertainty, banks rely on the observed actions of peers to infer the payoffs of digital transformation, consistent with information cascade theory [11,43]. Common shareholders create implicit channels through which soft information, including technological choices, implementation experience, and strategic priorities, flows more efficiently across affiliated institutions [13,33,44]. These information exchanges facilitate coordination and reduce duplicative experimentation. Moreover, higher transparency and disclosure quality increase the credibility and interpretability of information flows, strengthening the influence of peer behavior [31,45]. Consequently, the empirical implication is that banks with greater transparency should exhibit a stronger response to peer exposure.
Third, resource pooling translates observed practices into feasible implementation. Common shareholder connections create social capital and coordination capacity that lower the organizational cost of adoption. These connections facilitate access to technological resources, cross-institutional talent mobility, and collaborative standard setting [14]. Mutual interests embedded in overlapping ownership further strengthen incentives to integrate resources across banks [42]. Prior research has shown that banks occupying more central positions within the shareholder network enjoy higher status and credibility, which expands access to shared resources [13,14]. Accordingly, the testable implication is that peer effects intensify with higher centrality in the shareholder network.
Based on this analysis, the following hypothesis is proposed:
H2:
The peer effects of bank digital transformation through shareholder networks are primarily driven by enhanced competition, improved information sharing, and expanded resource pooling.
While network-based peer effects can accelerate digital adoption at the bank level, they may nevertheless exacerbate industry stratification through the Matthew Effect [46]. Firm-level evidence shows that more productive entities capture larger digitalization gains, widening performance dispersion [8]. In the context of bank shareholder networks, this asymmetry arises because stronger institutions possess greater absorptive capacity and tighter governance alignment, allowing them to translate peer signals into timely implementation and scale [13]. In empirical terms, this logic implies a heterogeneous effect, whereby the sensitivity to peer exposure is stronger for those better positioned to absorb and act on peer signals conveyed through shareholder connections.
Based on this analysis, the following hypothesis is proposed:
H3:
The peer effects of bank digital transformation through shareholder networks exhibit a Matthew Effect, manifesting as heterogeneous effects in which stronger banks benefit more from peer exposure.
4. Measuring Peer Effects of Bank Digital Transformation Through Shareholder Networks
4.1. The Construction of Bank Shareholder Networks
In this study, bank shareholder networks are constructed following the methodology of Li et al. [14] and Wang et al. [13], using data from Chinese commercial banks. For each year, the top ten shareholders of every commercial bank are retrieved from the CSMAR Banking Research Series—Bank Governance—Top Ten Shareholders table. Each commercial bank is then treated as a node in the network, and an undirected link is established between two banks if they share at least one of the same top ten shareholders during that year.
Specifically, two types of common shareholder connections are considered. The first refers to a direct ownership link, where one bank appears as a top ten shareholder of another. The second captures indirect ties, where two banks share a common third-party institution among their top ten shareholders. After excluding banks with missing key information and removing isolated nodes, a time-varying shareholder network covering 376 commercial banks from 2010 to 2021 is constructed. The set of common shareholders includes 117 commercial banks and 398 non-bank institutions.
To account for variations in shareholder influence, threshold-based shareholder networks are also constructed. Following prior studies [13,14], the analysis uses 1%, 3%, and 5% ownership cutoffs to reflect increasing governance influence and to eliminate weak ties. Specifically, in an x% threshold network, a shareholder is included only if its ownership stake equals or exceeds x%, while other construction rules remain unchanged. As expected, the number of valid connections declines as the threshold rises, with the 1%, 3%, and 5% networks including 375, 338, and 284 banks, respectively.
Panels (a) and (b) of Figure 2 depict the structure of the bank common shareholder networks in 2021 under the 1% and 3% ownership thresholds, respectively. In both panels, node size and color lightness increase with degree. The network visualizations show a prominent central cluster surrounded by several localized subgroups, indicating a polycentric structure. Moreover, as the ownership threshold increases, weaker ties are filtered out, resulting in a more streamlined network and a more consolidated core.
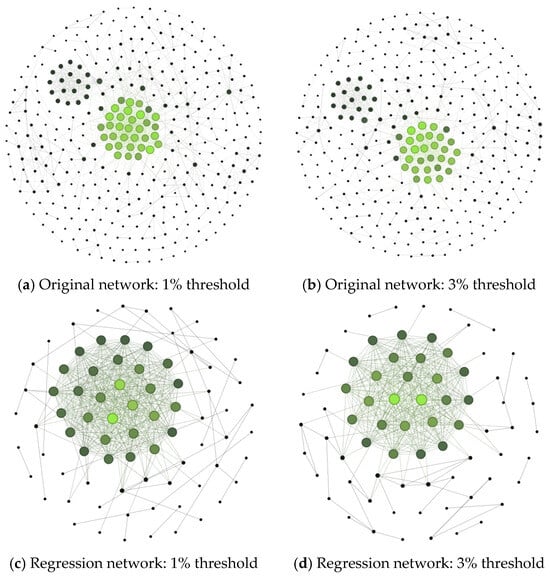
Figure 2.
Visualization of bank shareholder networks in 2021.
Columns (1) and (2) of Table 1 further quantify these structural changes using standard network topology metrics. As the threshold increases, the average degree decreases from 7.232 to 6.314, and the average path length increases from 5.047 to 5.659. Meanwhile, the clustering coefficient rises from 0.500 to 0.521, indicating that the removal of weaker links enhances local triadic connections and improves overall cohesion. These findings suggest that setting a moderate ownership threshold reduces noise and clarifies the core structure of the network.

Table 1.
Basic characteristics of bank shareholder networks.
4.2. Peer Effects of Bank Digital Transformation
Using the constructed shareholder network, the analysis quantifies the peer effects in bank digital transformation. Specifically, the peer effect for bank i in year t is defined as:
where Ci,t represents the set of banks connected to bank i in year t, and |Ci,t| is the number of such connections. Digitalizationj,t denotes the level of digital transformation for bank j in year t, as measured by the Peking University digital transformation index of commercial banks in China [4]. This index is widely used in existing studies on the digital transformation of Chinese commercial banks [47,48]. It captures digital transformation across three dimensions, including strategic, business, and management digitalization. Each dimension is measured using a set of sub-indicators, and the scores are then combined into a composite index through principal component analysis.
The three dimensions of the index are defined as follows. Strategic digitalization reflects the degree of strategic emphasis on digital technologies and is measured through textual analysis of banks’ annual reports. Business digitalization measures the extent to which digital technologies are embedded in financial products and services, using indicators such as mobile banking usage, internet-based offerings, and patent filings. Management digitalization captures the integration of digital technologies into governance and organizational structures, based on indicators including organizational setup, the technological background of executives, and partnerships with external technology firms.
Data for the digital transformation index cover 160 commercial banks over the period from 2010 to 2021. Among these, 129 banks are included in the common shareholder network (original network). To ensure data quality and the validity of peer effect estimation, a three-step screening procedure is implemented. First, banks with missing values for key explanatory variables are excluded. Second, banks whose connected peers suffer from missing data are removed to maintain the consistency of network-based measures. Third, banks with only a single year of observations are dropped, as they provide limited information for panel estimation. After these filters, the final panel dataset consists of 114 commercial banks. Although the peer effect measure is based on the original network, it is effectively equivalent to using the network formed by the banks in the final regression sample (regression network).
Panels (c) and (d) of Figure 2 illustrate the structure of the regression shareholder network in 2021 under the 1% and 3% ownership thresholds, respectively. Compared with the original network, the regression network exhibits a more distinct core-periphery configuration. Under the 1% threshold in Figure 2c, most banks cluster tightly around a small set of central nodes, while only a limited number of peripheral nodes remain. Under the 3% threshold shown in Figure 2d, the peripheral contracts further and the core becomes even more concentrated.
Columns (3) and (4) of Table 1 present network topology metrics that support this structural interpretation. Compared with the original network, the regression network exhibits a higher average degree and clustering coefficient, along with a lower average path length. These changes point to denser interconnections and stronger local cohesiveness. However, the clustering coefficient in the regression network declines slightly from 0.717 under the 1% ownership threshold to 0.675 under the 3% threshold, which contrasts with the trend observed in the original network. This suggests that in an already centralized structure, further elimination of weak ties may reduce the prevalence of triadic connections, although the network’s overall core-centered configuration remains largely unchanged.
5. Empirical Analysis
5.1. Model Specification
The following regression model (2) is estimated to examine the peer effects of bank digital transformation facilitated by shareholder networks:
In this specification, the dependent variable, Digitalizationi,t, denotes the overall level of digital transformation for bank i in year t. The key independent variable, DigitalPEi,t−1, captures the peer effects of bank digital transformation, as defined in Equation (1). In the baseline analysis, this variable is constructed based on shareholder networks using 1% and 3% ownership thresholds. In robustness tests, results are also reported for networks constructed without an ownership threshold and with a 5% threshold.
Following prior studies on bank digital transformation and peer effects [2,17], the set of control variables, Controlsi,t−1, include the logarithm of total assets (Size), non-performing loan ratio (NPL), return on assets (ROA), capital adequacy ratio (CAR), and loan ratio (Loan). All independent and control variables are lagged by one period to mitigate concerns regarding reverse causality. Bank fixed effects (θb) and year fixed effects (θt) are included to control for unobservable heterogeneity across banks and over time. α denotes the constant term, and εb,t is the error term.
As described in Section 4.2, the panel dataset consists of 114 Chinese commercial banks spanning the period from 2010 to 2021. Data on bank ownership structures and financial indicators are obtained from the CSMAR Database. Measures of bank digital transformation are sourced from the research team that developed the digital transformation index of commercial banks in China at Peking University. Data for additional variables are primarily drawn from the Wind database and the National Financial Regulatory Administration. To mitigate the influence of outliers, all continuous variables are winsorized at the 1st and 99th percentiles. Table 2 reports the descriptive statistics for the key variables used in the empirical analysis.
Table 2.
Descriptive statistics.
Prior research often measures peer effects using industry-level or regional-level averages as proxies, incorporating them as explanatory variables in regression models. However, this practice may introduce endogeneity concerns, particularly spurious correlations driven by group-level unobserved shocks [49]. In contrast, the proposed peer effect measures are constructed based on the underlying shareholder network structure [50]. Compared with traditional methods, the network-based approach provides a more accurate depiction of the mechanisms through which peer effects operate and helps alleviate the endogeneity issues that often complicate the causal identification of peer effects [34].
5.2. Empirical Results
5.2.1. Baseline Regression
Table 3 reports the baseline regression results for Equation (2). Columns (1) and (2) present results based on the peer effect measure constructed under a 1% ownership threshold, while columns (3) and (4) use the 3% threshold. The parameter of primary interest is the coefficient β on L.DigitalPE, summarized in the first two rows of Table 3. The results consistently indicate that L.DigitalPE exerts a positive and statistically significant effect on bank digital transformation across all specifications. This relationship holds regardless of the ownership threshold adopted and whether time fixed effects are included, with statistical significance at the 1% level. The magnitude of the effect is also economically meaningful. For instance, under the two-way fixed-effects model using a 1% threshold, a one-unit increase in the average digitalization level of connected peers is associated with a 0.151-unit rise in the focal bank’s own digitalization index. In standardized terms, a one-standard-deviation increase in peer exposure corresponds to a 0.140-standard-deviation improvement in the focal bank’s digitalization level. These findings provide strong support for Hypothesis H1, confirming that commercial banks’ digital transformation exhibits significant peer effects through common shareholder connections. They also affirm the reliability of the proposed network-based peer effect measure.
Table 3.
The overall impact of peer effects on bank digital transformation.
The analysis further examines whether peer effects differ across the three dimensions of bank digital transformation. To this end, dimension-specific peer effect measures are constructed following a similar approach as in Section 4.2. Specifically, the composite digital transformation index L.Digitalization in Equation (1) is replaced with three dimension-specific sub-indices corresponding to strategic digitalization (L.StrategyPE), business digitalization (L.BusinessPE), and management digitalization (L.ManagePE). Each dimension-specific peer effect measure is then incorporated as the explanatory variable, with the corresponding dimension-specific digitalization level serving as the dependent variable in regressions based on Equation (2).
Columns (1)–(3) and (4)–(6) of Table 4 report the results based on the 1% and 3% ownership threshold networks, respectively. The results show that the coefficients on the peer effect variables across all dimensions are positive and generally statistically significant. This evidence suggests that peer effects transmitted through common shareholder connections influence not only overall digital transformation but also all its individual dimensions.
Table 4.
The impact of peer effects on different dimensions of bank digital transformation.
In terms of magnitude, peer effects are more pronounced for strategic and management digitalization, while the influence on business digitalization appears relatively weaker. This pattern is consistent with the staged nature of digital transformation: strategic and management digitalization reflect the foundational stages, such as setting digital priorities and establishing organizational structures to support transformation, whereas business digitalization reflects the final implementation stage, which typically requires a longer period of technological accumulation and operational refinement [4]. Accordingly, peer influence is more likely to promote alignment in strategy formulation and management adaptation than in direct product and service innovation.
To further assess whether common shareholder networks constitute the dominant channel for peer effects in bank digital transformation, the analysis next examines whether alternative peer effect measures exhibit comparable explanatory power. The first alternative channel considered is regional proximity. Based on each bank’s headquarters location, a regional peer effect measure, Regional DigitalPE, is constructed as the average digital transformation level of other banks within the same province and year1. This variable is lagged by one period and incorporated into the regression model specified in Equation (2).
As shown in column (1) of Table 5, the coefficient on the regional peer effect measure is not statistically significant. The analysis is further extended by constructing regional peer effect measures for the three sub-dimensions of digital transformation (i.e., strategic, business, and management digitalization), with results reported in columns (2) to (4) of Table 5. Across all three dimensions, regional peer effects remain statistically insignificant, in sharp contrast to the significant peer effects observed through shareholder networks in Table 4. These findings are consistent with the sample characteristics, which include a large number of regional commercial banks in China. Such banks tend to focus on local markets and have limited interaction with geographically proximate peers, implying that physical proximity is not the primary driver of their peer effects.
Table 5.
Other peer effect measures.
Peer effects based on ownership structure are also examined. Specifically, banks are categorized into five ownership types: state-owned banks, joint-stock commercial banks, foreign banks, rural commercial banks, and city commercial banks. Using this classification, an ownership-based peer effect measure, Ownership DigitalPE, is constructed as the average digital transformation level of other banks within the same ownership category and year.
As reported in column (5) of Table 5, the coefficient on L.Ownership DigitalPE is significantly negative, which is contrary to the expected direction. A plausible explanation is that smaller banks tend to learn from larger, more technologically advanced banks rather than from peers within their own ownership group. As a result, peer effects in digital transformation are more likely to flow across ownership categories, particularly from large banks to smaller ones, resulting in a statistically negative association within ownership-defined groups.
5.2.2. Robustness and Endogeneity Tests
First, robustness tests are performed under alternative specifications of the peer effect measure. Specifically, the explanatory variable is replaced by peer effect measures constructed using networks both without an ownership threshold and with a 5% ownership threshold. As shown in columns (1) and (2) of Table 6, the coefficients on the peer effect measures remain positive and statistically significant at the 1% level. These results are consistent with the baseline findings in Table 3, confirming that the main conclusions are robust to variations in the construction of the shareholder networks2.
Table 6.
Robustness and endogeneity tests.
Next, to further address potential robustness and endogeneity concerns, a dynamic panel model is estimated. In the baseline regressions, the one-period lagged peer effect measure is used as the explanatory variable to mitigate reverse causality. However, there remains a concern that banks’ digital transformation levels and peer effects may be contemporaneously correlated, potentially causing the baseline results to capture shared trends in digital transformation rather than genuine peer influence.
To alleviate this concern, the lagged dependent variable, L.Digitalization, is introduced into Equation (2) and the model is estimated using the system GMM approach. The second and third lags of the dependent variable, the explanatory variable, and Size are employed as GMM-style instruments. The Arellano-Bond test for first-order serial correlation (AR(1)) is significant, while the test for second-order serial correlation (AR(2)) is not significant, indicating no serial correlation in the second-differenced residuals. Additionally, the Hansen test of overidentifying restrictions fails to reject the null hypothesis, confirming the validity of the selected instruments. Columns (3) and (4) of Table 6 present the regression results. After controlling for the lagged dependent variable, the coefficients on the peer effect measures remain positive and statistically significant at the 1% level, and the magnitudes are also close to those in the baseline regressions. Overall, these findings reinforce the robustness and causal interpretation of the main results.
Finally, following the approach of Bramoullé et al. [34], an instrumental-variables strategy based on “peers of peers” is implemented to address potential endogeneity arising from simultaneity and reflection problems that are common in peer effect research. The identification strategy exploits the intransitivity of the shareholder network, such that peers of peers that are not directly linked to a focal bank can influence it only through its immediate peers.
Specifically, the “peers of peers” instrumental variable is constructed as follows:
This variable reflects the average digital transformation level of the peers connected to a bank’s direct peers. Relevance arises from the propagation of influence along the network, such that Peers of Peers covaries with the endogenous regressor DigitalPE. Exclusion validity is ensured by the absence of direct links between the focal bank and its peers of peers, after conditioning on fixed effects and control variables, which eliminates alternative channels of influence beyond those operating through direct peers. Accordingly, this instrument is plausibly exogenous to a bank’s own digitalization decisions while remaining strongly correlated with the peer environment that shapes those decisions. By exploiting second-degree connections within the network, this approach strengthens causal identification and mitigates bias from simultaneity.
Columns (1)–(2) and (3)–(4) of Table 7 report the results of the two-stage least squares (2SLS) estimation based on the 1% and 3% ownership threshold networks, respectively. The results show that the “peers of peers” variable is significantly correlated with the endogenous variable in the first stage, and that the Cragg-Donald Wald F-statistics exceed the conventional critical values, indicating that weak instrument concerns are not present. The Kleibergen-Paap rk LM statistics are also significant at the 1% level, further confirming instrument relevance. In the second stage, the coefficient on the peer effect variable remains positive and statistically significant at the 1% level, providing additional evidence that the estimated peer effects are robust to endogeneity concerns.
Table 7.
Two-stage least squares (2SLS) estimation.
5.2.3. Mechanism Analysis
The analysis next investigates the underlying mechanisms through which peer effects in digital transformation operate, beginning with the role of enhanced competition as proposed in Hypothesis H2. According to the hypothesis, banks operating in more competitive environments are expected to experience stronger marginal impacts from peer effects.
To empirically test this mechanism, two indicators of market competition are employed. First, the Herfindahl-Hirschman Index (HHI) in each city’s banking sector is calculated [51]:
where Branchk denotes the number of branches operated by bank k, K is the total number of banks, and T_Branch is the total number of bank branches, all within the given city. A higher HHI value indicates greater market concentration and thus lower competition. Second, competition is proxied by the branch share of the top three banks (CR3) in each city’s banking sector, defined as:
where Branch(k) is the branch count of the m-th largest bank by branches in that city. Larger CR3 values indicate higher concentration and lower competition. Each bank is assigned the HHI and CR3 values corresponding to its headquarters location, thus capturing the level of market competition it directly faces. Licensing data from the National Financial Regulatory Administration are utilized to track the annual distribution of bank branches across Chinese cities.
Both L.HHI, L.CR3, and their interactions with the peer effect variable are incorporated into the regression models based on Equation (2). Columns (1) and (2) of Table 8 report the regression results for HHI, while columns (3) and (4) report the regression results for CR3. The coefficients on the interaction terms are all significantly negative, indicating that the peer effects in digital transformation are more pronounced in markets with higher levels of competition This finding provides empirical support for the enhanced competition mechanism described in Hypothesis H2.
Table 8.
Mechanism: enhanced competition.
The analysis now turns to the information-sharing mechanism in the context of peer effects in digital transformation. As outlined in Hypothesis H2, the information-sharing mechanism is expected to be particularly effective among banks with greater transparency. Following Jones et al. [52], bank assets are categorized by transparency and an index, Opacity, is calculated as the ratio of opaque assets to total assets. In this study, opaque assets include trading assets, fixed assets, intangible assets, and other assets. Both L.Opacity and its interaction with the peer effect variable, L.(DigitalPE × Opacity), are then included into the regression models specified in Equation (2). Columns (1) and (2) of Table 9 present the results. The coefficients on the interaction term are significantly negative, suggesting that banks with higher transparency benefit more from peer effects in digital transformation. This finding provides supporting evidence for the information-sharing mechanism proposed in Hypothesis H2.
Table 9.
Mechanism: sharing of information and resources.
The mechanism analysis concludes by examining the role of resource pooling. As proposed in Hypothesis H2, banks with greater centrality in shareholder networks benefit more from extensive and efficient access to shared resources [13,14]. To test this mechanism, each bank’s degree centrality in the original shareholder network, i.e., L.DegreeCentrality, along with its interaction term L.(DigitalPE × DegreeCentrality), is incorporated into the regression model specified in Equation (2). Columns (3) and (4) of Table 9 report the results. The coefficients on the interaction term are significantly positive, indicating that peer effects in digital transformation are more pronounced among banks that occupy more central positions within the shareholder networks. This finding aligns with the theoretical expectations of the resource-pooling mechanism outlined in Hypothesis H23.
5.2.4. Heterogeneity Analysis
This section examines how heterogeneous peer effects reshape the distribution of banks’ digitalization. Consistent with Hypothesis H3, the key question is whether peer influence reinforces a Matthew Effect, in which leading banks consolidate advantages, or whether it generates convergence [8]. To implement a direct test, all banks in the shareholder network are divided each year into two groups. A bank is assigned to the leading group if its digitalization exceeds the average of its connected peers; otherwise, it is assigned to the lagging group. Equation (2) is then estimated separately for the two groups.
Table 10 reports the estimates. For the leading group, the coefficients on L.DigitalPE are positive and significant at the 1% level under both the 1% and 3% thresholds. For the lagging group, the corresponding coefficients are not significant under the 1% threshold, and the estimate is positive only at the 10% level under the 3% threshold. These results indicate that peer influence raises digitalization primarily among banks already ahead of their peers, providing direct evidence of a Matthew Effect.
Table 10.
Matthew Effect of peer effects.
To align with Hypothesis H3, the analysis evaluates whether peer effects manifest as heterogeneous effects across banks with different characteristics. The first dimension considered is workforce size. While workforce size is correlated with overall bank size, it serves as a more direct proxy for human capital, which is more closely related to a bank’s ability to engage in digital transformation than financial scale alone. Based on the median of the number of employees in each year, the sample is divided into two groups: banks with workforces above the median are classified as the Large group, and those below the median as the Small group. Baseline regressions are then estimated separately for each group.
Panel A of Table 11 reports the results. Columns (1) and (3) present the estimates for the Large group, while Columns (2) and (4) show the results for the Small group. As shown, the coefficients on the peer effect variable L.DigitalPE are significantly positive for the Large group, but statistically insignificant for the Small group. These results suggest that larger banks are more responsive to peer influences in digital transformation. A reasonable interpretation is that banks with larger workforces possess greater organizational flexibility and specialized human capital, enabling them to more effectively interpret, adapt, and replicate successful digital strategies observed in peer institutions. Overall, the evidence indicates heterogeneous peer effect sensitivities consistent with a Matthew Effect, in which stronger banks derive greater gains from peer exposure.
Table 11.
Heterogeneity analysis results.
Next, the role of business diversification in moderating peer effects is examined. Business diversification is proxied by the ratio of non-interest income to total income, where non-interest income includes revenues from activities outside of traditional lending, such as intermediary service fees, consulting, and investment-related income. Following the same approach as before, banks are split annually at the median of this ratio: those above the median form the High diversification group, while those below constitute the Low diversification group.
Panel B of Table 11 presents the regression results. The coefficients on L.DigitalPE are significantly positive at the 1% level for the High diversification group, but statistically insignificant for the Low diversification group. This indicates that peer effects in digital transformation are more pronounced among banks with greater business diversification. The pursuit of new income streams beyond interest earnings typically requires substantial investment in technology and business model innovation. Consequently, diversified banks are generally more agile and innovation-oriented, which enables them to more effectively absorb and implement digital practices pioneered by leading banks. Moreover, digital transformation itself often facilitates business diversification by enabling the development of new service channels and revenue models. As such, these findings reinforce the earlier discussion of the Matthew Effect, whereby peer influences may exacerbate the digital divide among banks.
Finally, the impact of ownership concentration is examined. From a corporate governance perspective, higher ownership concentration can incentivize managers to engage in technological innovations that maximize long-term shareholder value. Moreover, banks with greater ownership concentration are better positioned to address agency problems, thereby streamlining decision-making and enabling quicker responses to the digital transformation efforts of peer banks [2].
Ownership concentration is measured by the shareholding ratio of the largest shareholder. Accordingly, the sample banks are divided into two groups based on the median ownership concentration: High concentration and Low concentration. Separate regressions are then performed for each group. The results in Panel C of Table 11 show that the coefficients on L.DigitalPE are significantly positive only for the High concentration group, indicating stronger sensitivity to peer exposure where ownership is more concentrated. This heterogeneity is also consistent with a Matthew Effect, since stronger governance enables leading institutions to convert peer signals into scale and speed, thereby widening the gap with less concentrated peers.
6. Conclusions
This study investigates the peer effects of bank digital transformation through shareholder networks. A time-varying network for 114 Chinese commercial banks from 2010 to 2021 is combined with a fixed-effects panel design. The estimated coefficient on lagged peer exposure is positive, statistically significant, and economically meaningful. In standard terms, a one standard deviation increase in peer exposure is associated with roughly a 0.14 standard deviation rise in a bank’s own digitalization. Alternative peer definitions based on geography or ownership types contribute little explanatory power, and estimates remain stable under alternative network thresholds as well as dynamic and instrumental-variables estimators, supporting a causal interpretation.
Mechanism evidence indicates governance-linked transmission operating through enhanced competition, information sharing, and resource pooling, with stronger effects where competition is higher, transparency is greater, and network centrality is stronger. Moreover, the distribution of effects across institutions reveals systematic heterogeneity consistent with a Matthew Effect. Peer influence is stronger for leading banks and for institutions with characteristics that proxy greater absorptive capacity and governance strength and help convert peer signals into adoption and scale.
Practical and policy implications follow directly from these results. For banks, strengthening shareholder-aligned collaboration, co-investment, and information-sharing arrangements can reduce duplication of costly experimentation and raise the return to digital transformation. Managing network position also matters, since higher centrality expands access to partners, talent, and standards. For regulators, monitoring common shareholder connections helps identify where peer diffusion may stall or where a Matthew Effect may widen digital gaps. At a societal level, a more inclusive diffusion of digital capabilities can expand access to safe and affordable financial services, thereby improving the economic and commercial impact of digital transformation.
Several limitations remain and point to future research. First, data constraints on digitalization and related variables limit sample coverage. Expanding measurement approaches for digital transformation and extending the observation window would improve coverage and precision. Second, the evidence is drawn from Chinese commercial banks. Given structural and operational differences relative to banking systems in other regions, cross-country comparisons would help assess external validity and enhance generalizability. Third, identification could be strengthened by exploiting exogenous policy changes or regulatory reforms as natural experiments, which would provide additional tests of the robustness of the findings. Fourth, future studies could further explore the dynamic interactions between digitally leading and lagging banks, potential systemic risks arising from uneven digitalization, and the heterogeneous influence of different shareholder types.
Author Contributions
Conceptualization, L.H. and X.D.; methodology, L.H.; software, M.Z.; data curation, M.Z. and S.Z.; formal analysis, S.Z.; writing—original draft preparation, L.H.; writing—review and editing, M.Z. and S.Z.; funding acquisition, L.H. and X.D. All authors have read and agreed to the published version of the manuscript.
Funding
This research was funded by the National Natural Science Foundation of China, grant number [72201129, 72073067], Jiangsu Office of Philosophy and Social Science, grant number [2021SJA0047].
Data Availability Statement
The data are available from the author upon reasonable request.
Acknowledgments
During the preparation of this work the authors used ChatGPT-5 in order to improve spelling, grammar, and general editing. After using this tool/service, the authors reviewed and edited the content as needed and take full responsibility for the content of the publication.
Conflicts of Interest
The authors declare no conflicts of interest.
Notes
| 1. | If the analysis were narrowed to the city level, the data would become too sparse to calculate regional peer effect measures. |
| 2. | When the ownership threshold is increased to 5%, some commercial banks become isolated nodes in the shareholder networks. As a result, it is not possible to calculate their peer effect measures, leading to a reduction in the regression sample size. |
| 3. | We also conduct regressions using eigenvector centrality. The results are largely consistent with those obtained from degree centrality and are available upon request. |
References
- Thakor, A.V. Fintech and Banking: What Do We Know? J. Financ. Intermed. 2020, 41, 100833. [Google Scholar] [CrossRef]
- Ren, X.; Song, K.; Zhu, K.; Yang, X. Does Digital Transformation Increase Bank Profit Efficiency? Evidence from China. Pac.-Bas. Financ. J. 2024, 86, 102388. [Google Scholar] [CrossRef]
- Gherțescu, C.; Manta, A.G.; Bădîrcea, R.M.; Manta, L.F. How Does the Digitalization Strategy Affect Bank Efficiency in Industry 4.0? A Bibliometric Analysis. Systems 2024, 12, 492. [Google Scholar] [CrossRef]
- Xie, X.; Wang, S. Digital Transformation of Commercial Banks in China: Measurement, Progress and Impact. China Econ. Q. Int. 2023, 3, 35–45. [Google Scholar] [CrossRef]
- Margaretic, P.; Cifuentes, R.; Carreño, J.G. Banks’ Interconnections and Peer Effects: Evidence from Chile. Res. Int. Bus. Financ. 2021, 58, 101438. [Google Scholar] [CrossRef]
- Gangopadhyay, P.; Nilakantan, R. Peer Effects and Social Learning in Banks’ Investments in Information Technology. Int. Rev. Econ. Financ. 2021, 75, 456–463. [Google Scholar] [CrossRef]
- Cheng, M.; Qu, Y. Does Bank FinTech Reduce Credit Risk? Evidence from China. Pac.-Bas. Financ. J. 2020, 63, 101398. [Google Scholar] [CrossRef]
- Gómez-Bengoechea, G.; Jung, J. The Matthew Effect: Evidence on Firms’ Digitalization Distributional Effects. Technol. Soc. 2024, 76, 102423. [Google Scholar] [CrossRef]
- Fuertes, A.-M.; Robles, M.-D. Bank Credit Risk Events and Peers’ Equity Value. Int. Rev. Financ. Anal. 2021, 75, 101668. [Google Scholar] [CrossRef]
- Zeng, J.; Lin, S. Peer Effect, Bank Concentration, and Crises: Evidence from the United States. Manag. Decis. Econ. 2024, 45, 1090–1103. [Google Scholar] [CrossRef]
- Ali-Rind, A.; Boubaker, S.; Jarjir, S.L. Peer Effects in Financial Economics: A Literature Survey. Res. Int. Bus. Financ. 2023, 64, 101873. [Google Scholar] [CrossRef]
- Yeung, G.; He, C.; Zhang, P. Rural Banking in China: Geographically Accessible but Still Financially Excluded? Reg. Stud. 2017, 51, 297–312. [Google Scholar] [CrossRef]
- Wang, L.; Huang, Z.; Wang, Y. Bank Shareholder Network and Board Governance: Evidence from Chinese Commercial Banks. J. Innov. Knowl. 2023, 8, 100412. [Google Scholar] [CrossRef]
- Li, B.; Li, C.; Wang, L. Does the Shareholding Network Affect Bank’s Risk-Taking Behavior? An Exploratory Study on Chinese Commercial Banks. Financ. Res. Lett. 2019, 31, S154461231830789X. [Google Scholar] [CrossRef]
- Jiang, Y.; Zheng, Y.; Fan, W.; Wang, X. Peer Digitalization and Corporate Investment Decision. Financ. Res. Lett. 2024, 61, 104995. [Google Scholar] [CrossRef]
- Chen, G.; Liang, T.; Chen, X. How Do Firms’ Performance Shortfalls Affect Digital Transformation? The Role of Peer Experience and Persistent Underperformance. Rev. Manag. Sci. 2025, 19, 757–795. [Google Scholar] [CrossRef]
- Ren, X.; Zeng, G.; Sun, X. The Peer Effect of Digital Transformation and Corporate Environmental Performance: Empirical Evidence from Listed Companies in China. Econ. Model. 2023, 128, 106515. [Google Scholar] [CrossRef]
- Guo, H.; Qiu, R.; Li, Y. Research on the Impact of Digital Transformation Network Peer Groups on Corporate Carbon Neutrality Performance: Based on the Interlocking Directorate Network. Sustainability 2025, 17, 2382. [Google Scholar] [CrossRef]
- Pei, X.; Song, J.; Li, N.; Cao, B. Digital Transformation and the Spillover of Green Innovation: Evidence from Peer Firms in Heavily Polluting Industries. Eur. J. Innov. Manag. 2025; ahead of print. [Google Scholar] [CrossRef]
- Li, W.; Wang, F.; Liu, T.; Xue, Q.; Liu, N. Peer Effects of Digital Innovation Behavior: An External Environment Perspective. Manag. Decis. 2023, 61, 2173–2200. [Google Scholar] [CrossRef]
- Zhang, A.; Guo, X.; Zhang, W.; Liu, Z. Research on the Mechanism by Which Digital Transformation Peer Effects Influence Innovation Performance in Emerging Industries: A Case Study of China’s Photovoltaic Industry. PLoS ONE 2025, 20, e0313615. [Google Scholar] [CrossRef]
- Chang, K.; Li, J.; Xiao, L. Hear All Parties: Peer Effect of Digital Transformation on Long--term Firm Investment in China. Manag. Decis. Econ. 2024, 45, 1242–1258. [Google Scholar] [CrossRef]
- Pan, X.; Xu, G.; Zhu, N. Spatial Peer Effect of Enterprises’ Digital Transformation: Empirical Evidence from Spatial Autoregressive Models. Sustainability 2022, 14, 12576. [Google Scholar] [CrossRef]
- Kong, D.; Shi, Z.; Wang, S.; Lin, S. Conflicting or Complementary? Peer Effects on Green Breakthrough Technological Innovation: Evidence from China. Int. Rev. Financ. Anal. 2025, 105, 104441. [Google Scholar] [CrossRef]
- Boot, A.; Hoffmann, P.; Laeven, L.; Ratnovski, L. Fintech: What’s Old, What’s New? J. Financ. Stab. 2021, 53, 100836. [Google Scholar] [CrossRef]
- António Porfírio, J.; Augusto Felício, J.; Carrilho, T. Factors Affecting Digital Transformation in Banking. J. Bus. Res. 2024, 171, 114393. [Google Scholar] [CrossRef]
- Guo, H.; Sun, Y.; Qiu, X. Cross-Shareholding Network and Corporate Bond Financing Cost in China. N. Am. J. Econ. Financ. 2021, 57, 101423. [Google Scholar] [CrossRef]
- Yin, H.; Jin, X.; Quan, X.; Yu, J. Does Social Network Improve Corporate Financing Efficiency? Evidence from China. Pac.-Bas. Financ. J. 2022, 74, 101802. [Google Scholar] [CrossRef]
- Li, J.; Ren, D.; Feng, X.; Zhang, Y. Network of Listed Companies Based on Common Shareholders and the Prediction of Market Volatility. Physica A 2016, 462, 508–521. [Google Scholar] [CrossRef]
- Sun, B.; Li, H.; An, P.; Wang, Z. Dynamic Energy Stock Selection Based on Shareholders’ Coholding Network. Physica A 2020, 542, 122243. [Google Scholar] [CrossRef]
- Liu, T.; Wang, Q.; Yang, S.; Shi, Q. The Impact of Shareholder and Director Networks on Corporate Technological Innovation: A Multilayer Networks Analysis. Systems 2024, 12, 41. [Google Scholar] [CrossRef]
- Li, X.-L.; Xia, X.; Ge, X.; Si, D.-K. Common Institutional Ownership and the Spillover Effect of Corporate Innovation. Pac.-Bas. Financ. J. 2025, 90, 102677. [Google Scholar] [CrossRef]
- Xu, J.; Zhong, L.; Bi, R.; Wang, C. Board Networks and Firms’ Technological Innovation Output: The Moderating Roles of Shareholder Networks and CEO Networks. Systems 2025, 13, 414. [Google Scholar] [CrossRef]
- Bramoullé, Y.; Djebbari, H.; Fortin, B. Peer Effects in Networks: A Survey. Annu. Rev. Econ. 2020, 12, 603–629. [Google Scholar] [CrossRef]
- Zhang, T. Peer Effects in R&D Investment Based on Interlock Network: Evidence from China. Int. Rev. Financ. Anal. 2023, 89, 102752. [Google Scholar] [CrossRef]
- Parker, G.; Alstyne, M.V. Innovation, Openness, and Platform Control. Manag. Sci. 2017, 64, 2973–3468. [Google Scholar] [CrossRef]
- Lyu, W.; Yu, L.; Zhang, J. Peer Effects in Digital Inclusive Finance Participation Decisions: Evidence from Rural China. Technol. Forecast. Soc. Change 2024, 208, 123645. [Google Scholar] [CrossRef]
- Zheng, B.; Yuan, Y.; Lv, K. Spatial Peer Effect of Retail Stores’ Digital Transformation: An Analysis Using the Survey Data from China. Appl. Econ. Lett. 2025, 32, 523–527. [Google Scholar] [CrossRef]
- Aghion, P.; Van Reenen, J.; Zingales, L. Innovation and Institutional Ownership. Am. Econ. Rev. 2013, 103, 277–304. [Google Scholar] [CrossRef]
- Fang, V.W.; Tian, X.; Tice, S. Does Stock Liquidity Enhance or Impede Firm Innovation? J. Financ. 2014, 69, 2085–2125. [Google Scholar] [CrossRef]
- Tian, M.; Wang, T.; Li, X. Dual Function of Corporate Social Responsibility on R&D Strategy: Moderating Effect of Board Interlock. Manag. Decis. Econ. 2021, 42, 1492–1508. [Google Scholar] [CrossRef]
- Antón, M.; Ederer, F.; Giné, M.; Schmalz, M. Innovation: The Bright Side of Common Ownership? Manag. Sci. 2025, 71, 3713–3733. [Google Scholar] [CrossRef]
- Bikhchandani, S.; Hirshleifer, D.; Welch, I. A Theory of Fads, Fashion, Custom, and Cultural Change as Informational Cascades. J. Polit. Econ. 1992, 100, 992–1026. [Google Scholar] [CrossRef]
- Barone, G.; Schivardi, F.; Sette, E. Interlocking Directorates and Competition in Banking. J. Financ. 2025, 80, 1963–2016. [Google Scholar] [CrossRef]
- Cao, L.; Lau, W.; Shaharuddin, S.S. Peer Effect of Proprietary Information: A Cost–Benefit Analysis of Customer Information Disclosure. Manag. Decis. Econ. 2023, 44, 2643–2656. [Google Scholar] [CrossRef]
- Merton, R.K. The Matthew Effect in Science. Science 1968, 159, 56–63. [Google Scholar] [CrossRef]
- Wang, Y.; Wen, H. Digital Finance, Digital Transformation, and the Development of Off-Balance Sheet Activities by Commercial Banks. Systems 2024, 12, 301. [Google Scholar] [CrossRef]
- Li, Y.; Xia, Y.; Sun, Z.; Sun, N. Does Digital Transformation Affect Systemic Risk? Evidence from the Banking Sector in China. Int. Rev. Financ. Anal. 2025, 102, 104137. [Google Scholar] [CrossRef]
- Angrist, J.D. The Perils of Peer Effects. Labour Econ. 2014, 30, 98–108. [Google Scholar] [CrossRef]
- Comola, M.; Prina, S. Treatment Effect Accounting for Network Changes. Rev. Econ. Stat. 2021, 103, 597–604. [Google Scholar] [CrossRef]
- Bai, Z.; Ban, Y.; Hu, H. Banking Competition and Digital Transformation. Financ. Res. Lett. 2024, 61, 105068. [Google Scholar] [CrossRef]
- Jones, J.S.; Lee, W.Y.; Yeager, T.J. Valuation and Systemic Risk Consequences of Bank Opacity. J. Bank. Financ. 2013, 37, 693–706. [Google Scholar] [CrossRef]
Disclaimer/Publisher’s Note: The statements, opinions and data contained in all publications are solely those of the individual author(s) and contributor(s) and not of MDPI and/or the editor(s). MDPI and/or the editor(s) disclaim responsibility for any injury to people or property resulting from any ideas, methods, instructions or products referred to in the content. |
© 2025 by the authors. Licensee MDPI, Basel, Switzerland. This article is an open access article distributed under the terms and conditions of the Creative Commons Attribution (CC BY) license (https://creativecommons.org/licenses/by/4.0/).