Abstract
Unlike general large-scale projects, major science and technology projects (MSTPs) are strategically positioned to meet national needs, reflecting the forward-looking direction of science and technology development. The correctness of decision making for MSTPs is crucial for the long-term development and strategic interests of the country. To measure decision complexity accurately, we propose a graph-based approach that utilizes information entropy theory. This approach provides decision makers with a theoretical foundation for effectively managing decision complexity.
1. Introduction
MSTPs are set up to meet national strategic needs. They are major strategic products, key common technologies, and key engineering projects completed within a certain time limit through core technology breakthroughs and resource integration, such as the “Manhattan Project” to develop the atomic bomb and the “Apollo moon landing project” in the United States, “Galileo Plan” in the European Union, Sputnik-1 project in Russia, and “Very Large Scale Integration (VLSI) Plan” in Japan. These projects have the characteristics of high technical complexity, large investment scale, long implementation cycle, and a wide range of units involved. They are complex giant systems across disciplines, fields, departments, industries, and levels. The decision making of major scientific and technological projects is a difficult and important issue in project management, wherein making decision could account for the differences between success and failure. Simon [1] believes that “decision is the core of management” and emphasizes the important position and role of decision in project management. Practical engineering experience shows that there are no more than two reasons for the failure of a project: first, decision-making mistakes; second, poor implementation. Under normal circumstances, the latter can also reverse the form by strengthening management, taking measures, and timely correction; however, decision-making mistakes are often fatal [2,3,4]. For projects with wrong decisions, no matter how efficient the implementation process management is, it is difficult to reverse the situation. Therefore, the problem of identifying and characterizing decision complexity becomes more and more important. Although more and more documents focus on the complexity of projects, they lack attention to the complexity of decision making.
In engineering practice, ignoring the comprehensive and systematic analysis of decision-making complexity has led to the failure to achieve the development objectives of major scientific and technological projects. Taking the 16 major scientific and technological projects of the 11th Five-Year Plan in China as an example, the state invested 34.761 billion CNY and organized tens of thousands of scientific research personnel. After 5 years of spending substantial financial, material, and human resources, but the problem of scientific and technological management was chaotic. According to the information released by the National Audit Bureau [5], “by the end of 2011, 93% of the projects to be accepted for eight major projects had not been completed, two of 134 projects had not been accepted, and 582 of the 2401 achievements of 84 projects were offset by the achievements of other scientific research projects”. There were two cases of uncompleted acceptance. In one case, the research work was completed, but the acceptance was not organized, and the responsibility fell on leaders at all levels; in the other case, the research was not completed on schedule and could not be accepted, where the responsibility fell on the scientific researchers. There have been efforts to determine the reasons for the failure to complete the acceptance of major special projects, which were found to be due to errors in the top-level design, development objectives, ideas, tasks, and requirements of major special projects, as well as problems in the bidding policy, project selection and approval, fund allocation, annual work plan, etc., or in the project application, feasibility study report, management supporting measures, etc., which did not conform to the facts or to the implementation plan, overall technical plan, or construction plan. The failure of the acceptance plan and evaluation plan to meet the construction requirements could not be simply attributed to the problems caused by the poor quality of the implementation link in the project construction process. More importantly, a lack of clear understanding of the source of decision-making complexity and a failure to truly understand the connotation of decision-making complexity can lead to irreversible consequences. Because decision making involves multiple factors and their complex relationships, with the characteristics of deep uncertainty and multiscale complexity, decision making becomes more challenging than ever in the context of increasing engineering scale and technical complexity, as well as a dynamic decision-making environment. However, the current research on decision complexity has tended to select a limited number of decision complexity factors for analysis, focusing on the conceptual framework of decision complexity, whereas quantitative research on decision complexity is lacking. This paper focuses on how to characterize, describe, and measure the complexity of decision analysis and decision management in MSTPs, not only considering the sources of the decision-making complexity of MSTPs, but also emphasizing the correlation among the dimensions of complexity. With the help of Shannon’s information entropy theory and based on the graph structure model, a decision-making complexity measurement method is proposed, which provides a comprehensive analysis method for academic research.
2. Literature Review
With the promulgation of the view that organizations are open systems in the 1960s, the concept of complexity emerged in organizational theory, leading to studies on complexity measurement methods that calculate and evaluate complexity as a function of the interaction relationships and mechanisms of elements within and between organizations. Etzioni [6] described the composite characteristics of an organization. Simon [7] defined a complex system as a system composed of a large number of interdependent and interactive components. Thompson [8] described a complex organization as a whole composed of interdependent components or sets of components, coupled with environmental interdependence. Hall et al. [9] described the interrelationships linking organizational scale, complexity, and form, and proposed a classical perspective of hierarchy to measure complexity. Klatzky [10] analyzed the interrelationships between describing the size, complexity, and synergy of an organization, and proposed a collaborative measurement model. Cohen et al. [11] proposed a trash can model for organizational selection. Granovetter [12] believed that, from the perspective of complexity theory, organizational behavior has many diverse characteristics related to connection and association. Radner [13] proposed a behavioral model for organizational information processing and coordination, as well as cost reduction. Meyer et al. [14] advocated for addressing the normative and institutional measurement models of complex organizations.
On the basis of organizational complexity, people began studying methods for measuring management complexity. Vaill, Meyer, and Granovetter [15,16,17] viewed organizational systems as complex, open, and adaptive systems. Scott and Pfeffer [18,19] believed that there is a dissipative and dependent relationship with the environment. Murray [20] demonstrated the complexity of management and demonstrated the relationship between complexity and change. Klabers [21] believed that complex self-organizing systems arise among individuals, and proposed a model of interaction in large-scale and small-scale complex designs facing knowledge. Bella [22] studied the impact of organizational complexity on human events, such as self-organizing systems and organizational order. Kornberger et al. [23] believed that complexity is generated and stimulated in organizational spaces, and proposed the concept of constructing complex buildings in this space. Hodgson [24] analyzed the relationship between individual organizational behavior and management performance. These studies resulted in dissipative systems and organizational complexity measurement models for individuals and populations. The Structural Fundamentals School was proposed by Warfield et al. [25], involving methods such as interactive management, analytic structural modeling, and general design science to solve complexity problems in organizational management. Twenty laws of complexity, taxonomy, and index constitute the core theory of this school. Daft et al. [26] viewed complexity as the number of activities and subsystems within an organization, pointing out that it can be measured in three dimensions. The vertical dimension of complexity is the number of levels within the organization, the horizontal dimension is the number of work projects or departments that the organization must simultaneously handle, and the spatial dimension is the number of geographical locations. Martinelli [27] emphasized the complexity of interactions between systems and between systems and environments, indicating that three levels are most suitable for organizational management. Hignett [28] used the perspective of human factor engineering to study the relationship between the scale and complexity of medical organizations, with three management levels: management level, staff level, and outpatient level where patients gather. Li et al. [29] decomposed complex social systems into three levels (constitutional system, organizational structure, and operational norms), and proposed a three-stage design method for complex social systems. These studies form the complexity measurement theory system of the structural foundation school. Carley [30] proposed the complexity of organizational tasks, resources, knowledge, and human cognition, and established a complexity measurement model. Ryu et al. [31] and Warnecke [32] proposed models for analyzing factories and fractal companies. Spencer [33] proposed a complexity measure for the supply and demand relationship of mixed organizations in multinational corporations. White [34] analyzed the complex network characteristics of government policies in public macro management to improve management efficiency. Wiley [35] explored the similarity of multinational hybrid organizations in certification standards, as well as the diversity of methods in terms of standards, quality, and complexity. Ritter et al. [36] analyzed the complex relationship between management and networks, pointing out that networks are loosely coupled systems, and that methods for measuring management complexity in enterprise organizations are based on network systems. Marti [37] proposed the human factor structured design method, which improves and expands the definition of complexity domain analysis, application, and structural methods.
For the study of complexity measurement in engineering projects, Ottino [38] pointed out that engineering project personnel should have the ability to understand and deal with complex systems, and they need to understand many complex phenomena that may not be traditionally regarded as typical engineering project phenomena. Rouse [39] believed that engineers need to understand the system complexity problems in their technical fields. Calvano et al. [40] predicted that the increasing complexity of modern engineering projects required new systems engineering methods. Winter et al. [41] proposed that complexity should be described from the perspective of project attributes. Shi et al. [42], on the basis of an in-depth case analysis of the Hong Kong–Zhuhai–Macao Bridge (HZMB), developed a comprehensive framework of decision-making complexity, dividing the elements into six dimensions: technical, social, financial, legal, organizational, and time. Wang et al. [43] systematically discussed the supporting system of the flexible strategy of large engineering projects, the strategic transformation of the flexible strategy, and the integration of strategic management. Yin pointed out that some complex problems of large engineering projects need to be solved through engineering project innovation in practice [44]. In addition, Lu [45] and Lu et al. [46] also discussed the scientific decision making and practice of the Three Gorges Project; Lu further summarized the experience and lessons of decision-making mistakes in major engineering projects at home and abroad, and put forward relevant suggestions for building the decision-making mechanism of major engineering projects in China [47]. Xi pointed out that the decision-making process of large engineering projects is generally carried out from two aspects: the overall strategic deployment of large engineering projects and the determination of a specific engineering project construction plan [48]. Sheng pointed out that the decision making of large engineering projects is a complex system involving multiple decision-making subjects and multilevel decision-making objectives [49]. During the construction of engineering projects, there will be various complex uncertainties from the project itself and the environment.
In recent years, many scholars have devoted themselves to studying how to describe the complex dynamic behavior and chaotic behavior that characterize the complexity of the system. How to measure complexity is an unsolved problem. In fact, different complexity measurement methods measure the difficulty of a complex system in different ways, including constructing an object, describing a system, and executing a task. One example is algorithmic complexity or computational complexity, which is used to measure the difficulty of accurately reconstructing a sequence [50]. Another intuitive concept of complexity is the measurement of uncertainty, randomness, and unpredictability. In complex systems, uncertainty, randomness, and unpredictability increase the difficulty of solving problems. Entropy was first introduced into information theory by Shannon and applied to information coding; it was defined as the total amount of information needed to describe the system state or the system uncertainty level. Kolmogorov extended Shannon entropy theory to the study of dynamic processes, and revealed the internal relationship between information and a kind of complexity.
3. Characteristic of Decision Complexity in MSTPs
MSTPs are complex system projects, which require huge human and material resources and financial resources. They require many organizations to cooperate in the study and manufacture of a series of large-scale equipment or to organize the construction of large-scale projects. Project decision making is a whole process with the typical characteristics of complex systems in which many people participate in the decision-making analysis and complete the decision making, which often involves the multiplicity of decision-making objectives and the movement of time state and state uncertainty. Project decision making in MSTPs has the typical characteristics of complex systems, in the following aspects:
- (1)
- Decision distribution and loose coupling
The decision-making members are composed of experts from various fields, functional departments, professional backgrounds, and identities. The members are widely distributed, and the time and location are usually not fixed.
- (2)
- Decision independence
Due to the differences in the identity, knowledge background, interest demands, and information acquisition of decision-making members, each decision-making member independently completes the decision-making tasks and goals on the basis of their own knowledge background, interest demands, and subjective cognition according to their own decision-making objectives and decision-making methods.
- (3)
- Dynamic change and evolution of decision making
Through information exchange and interaction among decision members, information can be shared. Project decision making is a dynamic process in which the decision information of each member interacts repeatedly and finally reaches an agreement.
- (4)
- Convergence or divergence of decision
The differences in benefits, values, specialties, emotions, and wills of decision makers make their decision preferences heterogeneous, which may affect other decision makers’ preferences, lead to group behaviors such as the “group convergence” effect (i.e., herding effect) or the extreme effect of decision-making risk, and may also make the group opinions diverge more and more, splitting into several extreme opinion groups.
4. Structure of Decision Complexity in MSTPs
The decision-making complexity of MSTPs has many factors and various forms of expression based on different perspectives. The source of its complexity requires not only considering factors such as progress, quality, cost, and risk, but also considering factors such as coordination with the environment and sustainable development. At the same time, it is necessary to achieve a coordinated balance of constraints such as demand, quality, cost, schedule, risk, resources, information, and environment based on the overall goal and overall interests of the project. There are many factors and forms of complexity in decision making in MSTPs. Below, we investigate the evaluation index system of decision complexity. Studying decision complexity mainly involves identifying the sources of complexity. The sources of decision complexity should firstly be analyzed from the constituent elements of the decision-making system, and secondly from the perspective of engineering management. On this basis, our two research perspectives are formed. We first construct the top nodes from the perspective of the main components of decision-making systems, including decision objectives, decision makers, population structure, group consensus, and decision process. Next, we construct middle nodes from the perspectives of engineering management, including demand, mass, agent, cost, environment, time, information, and risk. Lastly, we refine and decompose the middle nodes from the perspective of measures, and then construct the lower nodes. In summary, we construct a multiscale decision-making complexity evaluation index system that involves micro, meso, and macro factors. The decision complexity measurement model of MSTPs is shown in Figure 1.
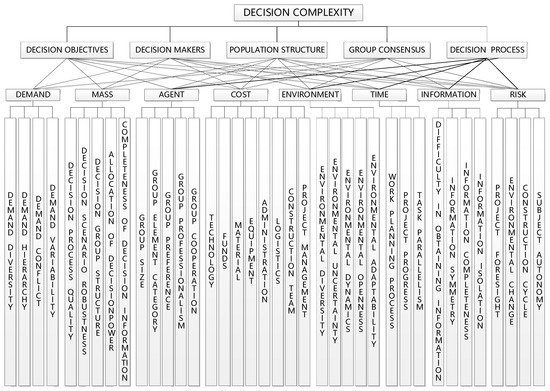
Figure 1.
The evaluation index system of decision complexity in MSTPs.
- (1)
- Complexity of decision objectives
The decision-making objectives of MSTPs are diverse, involving strategic objectives and system objectives. The decision-making objectives of the overall project and individual are different, driven by their respective interests; individual and overall decision-making objectives are also prone to conflict, affecting and restricting the overall decision-making objectives.
- (2)
- Complexity of decision makers
The decision-making bodies of MSTPs are diverse, consisting of personnel from multiple fields, multiple functional departments, and multiple professional knowledge backgrounds. They have the characteristics of spanning across regions, departments, disciplines, and industries. Moreover, the limited knowledge of the main body leads to limited rationality of the main body, which results in bias in the main body’s decision making. At the same time, in a complex and uncertain decision-making environment, due to differences in the responsibilities and identities, knowledge backgrounds, interest demands, and information acquisition of decision makers, and on the basis of their respective decision-making objectives, decision-making models, and decision-making methods, each decision maker independently completes decision-making tasks and objectives by relying on their own knowledge backgrounds, interest demands, and subjective information cognition, which results in local conflicts of interest among subjects, bringing complexity to their behavior.
- (3)
- Complexity of group structure
The decision-making group for major scientific and technological projects has a multilevel structure, and each member constitutes a complex network. The group members dynamically reorganize the network structure through continuous learning and interaction. At the same time, due to the large number of units involved in project development and construction, large number of personnel, and huge amount of organizational management workload, involving a variety of complex interpersonal, administrative, and economic relationships, these complex relationships are intertwined, leading to inconsistent goals and conflicts, and these relationships and causal relationships have nonlinear diffusion characteristics, making it possible to change from local to global. From minor to significant errors, some issues in project decision-making cannot be directly described or expressed as specific causal relationships, thereby losing the predictability of engineering decision making.
- (4)
- Complexity of group consensus
In the decision making of major scientific and technological projects, it is necessary to form a consensus on decision-making objectives, decision-making issues, and decision-making rules, especially regarding group opinions on decision-making options. In engineering decision making, due to differences in the interests, values, professions, emotions, willpower, and other aspects of decision-making bodies at various levels, the decision-making preferences of members are heterogeneous, which may affect the preferences of other decision-making bodies, leading to group behaviors such as “group convergence” effects (i.e., herd effects) or extreme decision-making risk effects, as well as increasing differences in group opinions, splitting into several extreme opinion groups, which inevitably leads to the complexity of group consensus.
- (5)
- Complexity of decision process
Due to the large number of units involved in the development and construction of major scientific and technological projects, the large number of personnel, and the huge workload of organizational management, involving a variety of complex interpersonal, administrative, and economic relationships, these complex relationships are intertwined, with inconsistent goals and conflicts, making coordination work in the decision-making process extremely difficult and complex. At the same time, due to the diversity of decision-making subjects for major scientific and technological projects, the hierarchical nature of decision-making objectives, the uncertainty of the decision-making environment, and the limited rationality of people, the understanding and mastery of knowledge on decision-making issues are always incomplete, leading to limited cognition of decision-making options. Therefore, the decision-making process is an interactive process of spiral recursive approximation and dynamic iterative evolution, mainly reflected in the interactive activities among decision-making individuals, between decision-making individuals and decision-making groups, and among different decision-making groups. In addition, there is reverse feedback in the decision-making process, and the decision-making results need to be evaluated in detail, whereby the formulation of decision-making plans requires repeated demonstration and iterative approximation, and the decision making at each stage forms an open decision-making loop, continuously approaching convergence toward optimization in the form of spiral progression.
Combining the management objects and operation modes of major scientific and technological projects, the complexity of decision-making objectives, decision-making subjects, group structure, group consensus, and decision-making procedures is summarized into eight factors: demand, quality, subject, cost, environment, time, information, and risk. Then, the complexity is further refined and decomposed to establish a decision-making complexity measurement and evaluation index system. Demand factors mainly include indicators such as demand diversity, demand hierarchy, demand conflict, and demand variability; quality factors mainly include factors such as the quality of the decision-making process, the robustness of the decision-making context, the structural relationship of the decision-making group, the allocation of decision-making power, and the completeness of decision-making information; the main factors include group size, group element category, group preference, group professionalism, and group cooperation; cost factors mainly include indicators such as technology, funds, materials, equipment, administration, logistics, construction teams, and project management; environmental factors mainly include indicators such as environmental diversity, environmental uncertainty, environmental dynamics, environmental openness, and environmental adaptability; time factors mainly include the work planning process, project progress, and task parallelism; information factors mainly include indicators such as difficulty in obtaining information, degree of information symmetry, information completeness, and information isolation; risk factors mainly include indicators such as the future of the project, changes in the project environment, construction cycle, and subject autonomy.
5. Measurement of Decision Complexity in MSTPs
Overall, research on complexity measurement is relatively lagging behind, with most studies only remaining at the qualitative analysis stage. There is insufficient research on the diversity, heterogeneity, and heterogeneity of complex source factors. Some studies simplified the factors and structure of decision-making complexity sources due to the lack of consideration of the diverse, multidimensional, hierarchical, and heterogeneous characteristics of major science and technology project decision making. The main reason is that the measurement of complexity depends on the definition of complexity and the complexity of the problem. According to Shannon entropy theory, this article transforms the decision complexity structure into a graph structure and proposes a method for measuring the complexity of major science and technology project decisions.
As a measure of information content, information entropy is used to measure the uncertainty index, i.e., the probability of random events. In short, “the more chaotic the situation, the greater the information entropy, and vice versa”, which is due to the higher complexity of the system, its greater uncertainty, and the greater amount of information required to truly grasp the state of the system. Therefore, we can use Shannon entropy theory to analyze and measure decision complexity. According to information theory, given a random vector , Shannon entropy is defined as follows [51]:
where is the probability distribution function of element in , and entropy represents the uncertainty of system .
MSTPs are complex systems that cover multiple scales and levels, as well as multiple elements at the same level, and their system structure constitutes a complex network. According to organizational form, logical function, and physical composition, the structure of MSTPs can be divided into different levels of elements such as systems, subsystems, devices, modules, and components, as shown in Figure 2. Therefore, it is necessary to establish systems thinking and approach decision-making complexity issues from a holistic and global perspective, taking into account the interrelationships across and within various scales and levels of the system. The characteristics of MSTPs depend on both the elements at various levels and the connection relationships among them. These connections include series, parallel, and hybrid relationships, which simultaneously affect the complexity of the system structure. Therefore, according to different structural forms, the structure of MSTPs has different complexities. The construction idea of the decision complexity measurement method proposed in this paper is to calculate the average complexity information contributed by each element to the overall complexity information contribution according to the information entropy for the elements at all levels of MSTPs.
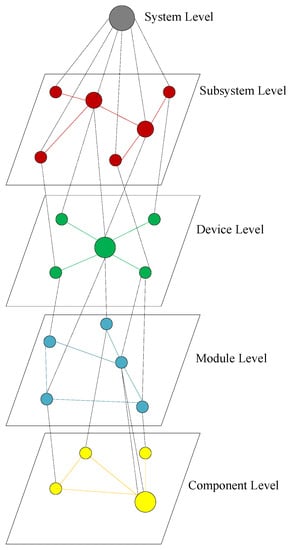
Figure 2.
Schematic diagram of hierarchical structure of the MSTPs.
Next, the complexity measurement of MSTPs is abstracted into a graph structure, i.e., a combination of nodes and connecting edges. The modeling process is as follows: each node in the tree diagram in Figure 1 represents a node in the diagram structure, whereas the branches in Figure 1 represent the connected edge in the diagram structure, which can build the structure model of project decision complexity diagram.
Suppose the set of nodes is , and weight set indicates the importance of the node, where is the weight of the node . According to Figure 1, the maximum value of is . At the same time, it is assumed that the type of relationship between nodes is , and weight set indicates the importance of the relationship, where is the weight of the relationship . In the tree hierarchy, there are the following relationships: indicates a direct control relationship, indicates a direct subordination, indicates an indirect control relationship, indicates an indirect subordination, represents a parallel relationship at a higher level, represents a parallel relationship at a lower level, and represents a parallel relationship at the same level. Obviously, the maximum value of is . Symbol represents the order pairs , , , of node related to , and represents the number of these order pairs.
Derived from Shannon’s information entropy formula, the entropy of node related to is defined as
where , and is the number of all elements in . Considering the different importance of each node and connecting edge, we note as the modified value for with respect to the weight of node and the weight of . Then, we get that
Furthermore, we obtain that
Constructing the martrix of the connecting edges, we note that
The elements of matrix are as follows:
Noting that is the number of these order pairs, we establish the length matrix as
From the relation matrix of the connecting edges, the element of the length matrix is
Considering that the relationship between control and subordination is symmetrical, letting symbol “” represent the symmetric relations, we get that , , . Moreover, we get that and are the upper triangular matrices, and and are the lower triangular matrices. In the relation . Similarly, , , are symmetric matrices. From the relation matrix of the connecting edges, when , we get that
Similarly, when , we get that
Next, considering the weight of nodes and connecting edges, and establishing the weight matrix and to modify the length matrix , we get that
where is the diagonal matrix with as the diagonal element, is the diagonal matrix with as the diagonal element, and the element of length matrix is
In this case, the element of the entropy matrix is
The entropy matrix is
The decision complexity in MSTPs is
6. Case Analysis
The selected case was the space–ground integrated information network sourced from one of the MSTPs in China’s technological innovation . The space–ground integrated information network is composed of a high-rail network, low-rail network, and ground network, and is interconnected with ground internet and mobile communication networks to establish a “global coverage, on-demand access, on-demand service, and secure and reliable” integrated information network system, as shown in Figure 3. After completion, it will enable China to have global spatiotemporal continuous communication, highly reliable and secure communication, regional high-capacity communication, and high-mobility full-range information transmission capabilities. Obviously, the space–ground integrated information network is a complex system that covers multiple hierarchical elements such as systems, subsystems, devices, modules, and components. Among them, system-level elements refer to the space–ground integrated information network. Subsystem-level elements include the high-orbit network, low-orbit network, and ground network. Device-level elements include various satellites in the high-orbit network, as well as satellite stations and operation control centers in the ground network. Module-level elements include various satellite platforms, payloads, and ground base station equipment, while component-level elements refer to the basic components at the lowest level.
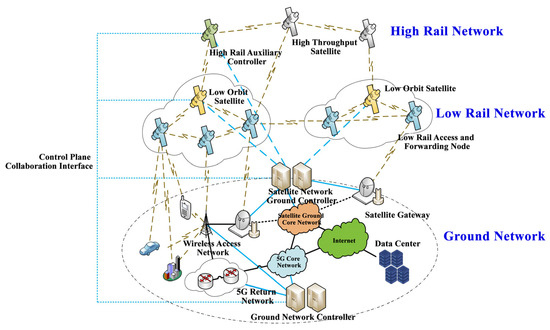
Figure 3.
Schematic diagram of the space–ground integrated information network.
Figure 1 involves node elements; hence, the relationship matrix is composed of elements, resulting in a very complex computational workload. For the convenience of calculation, we simplified the structure of Figure 1, as shown in Figure 4. It can be noted that the number of nodes is , i.e., , and the number of relationships is , mainly including a direct control relationship, a direct subordination, an indirect control relationship, an indirect subordination, a parallel relationship at a higher level, a parallel relationship at a lower level, and a parallel relationship at the same level. Furthermore, we asked experts in relevant fields to determine node weights and edge weights on the basis of the importance of nodes and relationships and .
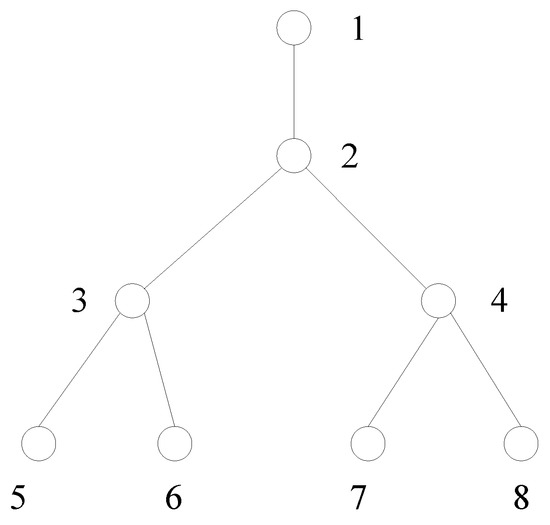
Figure 4.
Structure of decision-making complexity in case project.
According to the decision complexity measurement method above, the length matrix can be calculated as
Furthermore, the decision complexity of the project can be calculated as .
Through the case study above, we learned that, in order to reduce decision complexity, it is necessary to eliminate or cut off the correlation between nodes at various scales, among levels, and across scales and levels. Therefore, a feasible method to reduce complexity is to isolate complexity as much as possible in one node and avoid interaction with other nodes, in order to achieve the goal of eliminating complexity. For example, the risk node in Figure 1 is related to both the measurement indicators of subject autonomy and group cooperation, and the indicators of demand diversity and demand variability. This node may have complex correlation relationships with nodes at the same scale, at the same level, and across scales and levels. In order to reduce the complexity of risk nodes and follow the principle of reducing the correlation between elements at the same scale or level and across scale or level, we should focus on the main relationships and key aspects for complexity. For example, in order to achieve risk control, we mainly focus on two factors (group cooperation and subject autonomy) and ignore the impact of other factors in different scales and levels on risk nodes. By comprehensively analyzing these two indicator factors, a “benefit sharing risk sharing” strategy should be established at the organizational level to achieve risk control.
7. Conclusions
In this paper, the decision complexity characteristics, constituent elements, and modeling methods for decision complexity in MSTPs were studied. The decision complexity characteristics of MSTPs were analyzed. The evaluation index system for the decision complexity of MSTPs was proposed, and a complexity measurement method of project decision making based on graph structure was constructed, which is conducive to the reasonable design and appropriate organization and optimization of group scale and group structure. It can provide theoretical and methodological guidance for a better limitation and utilization of complexity in the construction of MSTPs.
Author Contributions
Software, Z.W.; Supervision, Y.L. All authors have read and agreed to the published version of the manuscript.
Funding
This research received no external funding.
Institutional Review Board Statement
Our paper is not applicable for studies not involving humans or animals.
Informed Consent Statement
Excluding this statement because our study did not involve humans.
Data Availability Statement
No additional data are available.
Conflicts of Interest
The authors declare no conflict of interest.
References
- Simon, H.A. Theories of Decision-making in Economics and Behavioral Science. J. Environ. Manag. 2011, 92, 1346–1353. [Google Scholar]
- Priemus, H. Mega-projects Dealing with Pitfalls. Eur. J. Transp. Infrastruct. Res. 2010, 10, 19–29. [Google Scholar] [CrossRef]
- Cicmil, S.; Williams, T.; Thomas, J.; Hodgson, D. Rethinking Project Management: Researching the Actuality of Projects. Ecol. Appl. 2006, 16, 2411–2425. [Google Scholar] [CrossRef]
- Bendoly, E.; Thomas, D.; Capra, M. Multilevel Social Dynamics Considerations for Project Management Decision Makers. Decis. Sci. 2010, 41, 459–490. [Google Scholar] [CrossRef]
- Liu, J. The State Council’s audit report on the implementation of the central budget and other financial revenues and expenditures in 2011. In Proceedings of the 27th meeting of the Standing Committee of the 11th National People’s Congress, No.17 Jin Zhong Du Nan Jie Fengtai District, Beijing, China, 27 June 2012. [Google Scholar]
- Etzioni, A. Complex Organizations: A Sociological Reader; Holt, Rinehart and Winston: New York, NY, USA, 1961. [Google Scholar]
- Simon, H. The Architecture of Complexity. Proc. Am. Philos. Soc. 1962, 106, 467–482. [Google Scholar]
- Thompson, D. Organization in Action; MeGraw-Hill: New York, NY, USA, 1967. [Google Scholar]
- Hall, R.H.; Johnson, N.J.; Haas, J.E. Organizational size, complexity, and formalization. Am. Sociol. Rev. 1967, 32, 903–912. [Google Scholar] [CrossRef]
- Klatzky, S.R. Relationship of Organizational Size to Complexity and Coordination. Adm. Sci. Q. 1970, 15, 428–438. [Google Scholar] [CrossRef]
- Cohen, M.D.; March, J.G.; Olsen, J.P. A Garbage Can Model of Organizational Choice. Adm. Sci. Q. 1972, 17, 1–25. [Google Scholar] [CrossRef]
- Granovetter, M.S. Program Chang Organizational Properties. Am. J. Sociol. 1973, 72, 503–518. [Google Scholar]
- Radnr, R. A Behavioral Model of Cost reduction. Bell Ournal Econ. 1975, 6, 196–215. [Google Scholar] [CrossRef]
- Meyer, J.W.; Rowan, B. Institutionalized Organizations: Formal Structure as Myth and Ceremony. Am. J. Sociol. 1977, 83, 340–363. [Google Scholar] [CrossRef]
- Vaill, P.B. Managing as a Performing Art: New Ideas for World of Chaotic Change; Jossey-Bass Publishers: San Freancisco, CA, USA, 1989. [Google Scholar]
- Meyer, J.W.; Scott, W.R. Organizational Environments; Stage: Newbury Park, CA, USA, 1983. [Google Scholar]
- Granovetter, M. Economic Action and Social Structure: The Problem of Embeddedness. Am. J. Sociol. 1985, 91, 481–510. [Google Scholar] [CrossRef]
- Scott, W. Organizations: Rational, Natural and Open Systems, 4th ed.; Prentice-Hall: Englecliffs, NJ, USA, 1998. [Google Scholar]
- Pfeffer, J.; Salancik, G. The External Control of Organizations; Harper Row: New York, NY, USA, 1978. [Google Scholar]
- Murray, P.J. So What’s New About Complexity? Syst. Res. Behav. Sci. 2003, 20, 409–417. [Google Scholar] [CrossRef]
- Klabbers, J.H.G. Gaming and Simulation: Principles of a Science of Design. Simul. Gaming 2003, 34, 569–591. [Google Scholar] [CrossRef]
- Bella, D.A. Organized Complexity in Human Affairs the Tobacco Industry. J. Bus. Ethics 1997, 16, 977–999. [Google Scholar] [CrossRef]
- Kornberger, M.; Clegg, S. The Architecture of Complexity. Cult. Organ. 2003, 9, 75–91. [Google Scholar] [CrossRef]
- Hodgson, D. Putting on a Professional Performance Performativity, Subversion and Project Management. Organization 2005, 12, 51–68. [Google Scholar] [CrossRef]
- Warfield, J.N. Social Systems: Planning, Policy and Complexity; Wiley Inter-Scineces: New York, NY, USA, 1976. [Google Scholar]
- Daft, R.L.; Lewin, A.Y. Can organization studies begin to break out of the normal science straitjacket? An editorial essay. Organ. Sci. 1990, 1, 1–9. [Google Scholar] [CrossRef]
- Martinelli, D.P. Systems hierarchies and management. Syst. Res. Behav. Sci. Off. J. Int. Fed. Syst. Res. 2001, 18, 69–81. [Google Scholar] [CrossRef]
- Hignett, S. Hospital ergonomics: A qualitative study to explore the organizational and cultural factors. Ergonomics 2003, 46, 882–903. [Google Scholar] [CrossRef]
- Li, Y.; Li, X. A Three-Phase Design Methodology for Complex Social Systems. Syst. Res. Behav. Sci. Off. J. Int. Fed. Syst. Res. 2003, 20, 445–452. [Google Scholar] [CrossRef]
- Carley, K.M. Organizational Adaptation. Ann. Oper. Res. 1997, 75, 25–47. [Google Scholar] [CrossRef]
- Ryu, K.; Jung, M. Agent-based Fractal Architecture and Modelling for Developing Distributed Danufactureing Sytems. Int. J. Prod. Res. 2003, 41, 4233–4255. [Google Scholar] [CrossRef]
- Warnecke, H.J. The Fractal Company: A Revolution in Corperate Culture; Springer: Berlin/Heidelberg, Germany, 2003. [Google Scholar]
- Spencer, R. Key Accounts: Effectively Managing Atrategic Complexity. J. Bus. Ind. Mark. 1999, 14, 291–310. [Google Scholar] [CrossRef]
- White, L. Effective Governance through Complexity Thinking and Management Science. Syst. Res. Behav. Sci. Former. Syst. Res. 2001, 18, 241–257. [Google Scholar] [CrossRef]
- Wiley, C. A Comparative Analysis of Certification in Human Resource Management. Int. J. Hum. Resour. Manag. 1999, 10, 737–762. [Google Scholar] [CrossRef]
- Ritter, T.; Wilkinson, I.F.; Johnston, W.J. Managing in complex business networks. Ind. Mark. Manag. 2004, 33, 175–183. [Google Scholar] [CrossRef]
- Marti, P. Structured task analysis in complex domains. Ergonomics 1998, 41, 1664–1677. [Google Scholar] [CrossRef]
- Ottino, J.M. Engineering complex systems. Nature 2004, 427, 399. [Google Scholar] [CrossRef]
- Rouse, W.B. Complex engineered, organizational and natural systems. Syst. Eng. 2007, 10, 260–271. [Google Scholar] [CrossRef]
- Calvano, C.N.; John, P. Systems engineering in an age of complexity. Syst. Eng. 2004, 7, 25–34. [Google Scholar] [CrossRef]
- Winter, M.; Smith, C.; Morris, P.; Cicmil, S. Directions for future research in project management: The main findings of a UK government-funded research network. Int. J. Proj. Manag. 2006, 24, 638–649. [Google Scholar] [CrossRef]
- Shi, Q.; Hertogh, M.; Bosch-Rekveldt, M.; Zhu, J.; Sheng, Z. Exploring decision-making complexity in major infrastructure projects: A case study from China. Proj. Manag. J. 2020, 51, 617–632. [Google Scholar] [CrossRef]
- Wang, Y.; Liu, Y.; Li, Y. Strategic management of large-scale projects. Strateg. Study Chin. Acad. Eng. 2004, 2, 28–32. [Google Scholar]
- Yin, R. Building a Harmonious Society and Engineering Innovation—Understanding of Engineering and Engineering Innovation. Sci. Chin. 2006, 5, 21–25. [Google Scholar]
- Lu, Y. Decision making and practice of the Three Gorges Project. China Eng. Sci. 2003, 6, 16–43. [Google Scholar]
- Lu, G.; Fu, C.; Wu, J.; Liu, Y. Research on the decision-making process and characteristics of major projects—Taking the Three Gorges Project as an example. China Sci. Technol. Forum 2008, 8, 20–24. [Google Scholar]
- Lu, G. Major project decision-making mistakes and construction of major project decision-making mechanism. China Sci. Technol. Forum 2009, 4, 30–35. [Google Scholar]
- Xi, Y. Large Project Decision-Making; Guizhou People’s Publishing House: Guiyang, China, 1988. [Google Scholar]
- Sheng, Z. Preliminary study on the integrated management mode of large and complex projects—Theoretical thinking on the engineering management of Sutong Bridge. Constr. Econ. 2009, 5, 20–22. [Google Scholar]
- Allender, E. Applications of Time-Bounded Kolmogorov Complexity in Complexity Theory; Springer: Berlin/Heidelberg, Germany, 1992. [Google Scholar]
- Lin, J. Divergence measures based on the Shannon entropy. IEEE Trans. Inf. Theory 1991, 37, 145–151. [Google Scholar] [CrossRef]
Disclaimer/Publisher’s Note: The statements, opinions and data contained in all publications are solely those of the individual author(s) and contributor(s) and not of MDPI and/or the editor(s). MDPI and/or the editor(s) disclaim responsibility for any injury to people or property resulting from any ideas, methods, instructions or products referred to in the content. |
© 2023 by the authors. Licensee MDPI, Basel, Switzerland. This article is an open access article distributed under the terms and conditions of the Creative Commons Attribution (CC BY) license (https://creativecommons.org/licenses/by/4.0/).