Article

Path Optimization of Technological Innovation Efficiency Improvement in China’s High-Tech Industries Based on QCA and GA-PSO-BP Neural Network

1
College of Economics and Management, Shandong University of Science and Technology, Qingdao 266590, China
2
School of Economics and Management, Beijing Jiaotong University, Beijing 100044, China
*
Author to whom correspondence should be addressed.
Systems 2023, 11(5), 233; https://doi.org/10.3390/systems11050233
Submission received: 7 April 2023 / Revised: 3 May 2023 / Accepted: 5 May 2023 / Published: 7 May 2023

Abstract

:
Innovation is the main driving force to promote national technological progress. It is of great significance to explore the optimal path to improve innovation efficiency by using the qualitative method and neural network prediction model to promote the high-quality development of the national economy. This study focuses on high-tech industries in the eastern, central and western regions of China; a factor-dependent research framework for innovation efficiency improvement in high-tech industries is constructed in China. The fuzzy-set qualitative comparative analysis method (QCA) is used to explore multiple paths to enhance the innovation efficiency of China’s high-tech industries. Then, a GA-PSO-BP neural network is used to construct an optimization model for the enhancement path of technological innovation efficiency, which clarifies the optimal path for the enhancement of innovation efficiency of high-tech industries in the eastern, central and western regions of China. Finally, innovation management strategies for high-tech industries are presented with regional features. The study finds that none of the individual conditions are necessary to promote the innovation efficiency of China’s high-tech industries, and only the linkage effect of the factors can achieve the goal of improving the innovation efficiency level of China’s high-tech industries. There are four configuration paths to improve the innovation efficiency of China’s high-tech industries, which are: “Multinational company (MNC) innovation—economic development—government support”; “MNC innovation—government support”; “economic development—government support”; and “economic development”. The characteristics of regional heterogeneity make differences in the optimal paths of innovation efficiency improvement in high-tech industries in eastern, central and western regions of China.

1. Introduction

With the strengthening trend of economic globalization and the advent of the era of knowledge economy, technological innovation has not only become a means for enterprises to make profits, but also the basis and driving force for their survival and development. High innovation efficiency motivates enterprises to continuously develop new technologies and products in line with market demand, which increases the added value of products and brings good economic benefits to enterprises [1]. Meanwhile, with improved economic efficiency, enterprises will be able to increase their innovation investment, continue to improve their innovation efficiency, and gain a sustainable and competitive technological advantage [2,3]. As for technological innovation, it is closely related to human resources, capital investment, institutional protection and industrial structure. Therefore, technological innovation is a multi-input and multi-output process by using internal and external innovation resources such as human, financial, material, and institutional [4,5], and the process is dynamic and regionally heterogeneous. In the increasingly fierce business environment, how enterprises use advanced and intelligent methods, means that obtaining the optimal path for innovation and development is always a research topic in the field of national technology and economic strategy.
Current research on the efficiency of technological innovation focuses on two aspects: measurement methods and impact factors, as shown in Table 1. Existing results on the efficiency measurement of technological innovation have been synthesized, and it was found that two basic measures are mostly used. One is mathematical programming-based data envelope analysis, which mainly applies a set of multiple input and output observations to estimate effective production fronts. The other is stochastic frontier analysis, which is developed based on knowledge production functions that require setting the production–function relationship between inputs and outputs in advance and using regression analysis and other methods to estimate the parameters of the production function. Moreover, in order to effectively promote the evolution of corporate innovation, scholars have explored the factors that influence the efficiency of corporate innovation at different levels and perspectives.
While existing studies have provided theoretical guidance and practical insights for technological innovation, further improvements are still needed. On the one hand, existing studies typically use traditional regressions to explore the net effect arising from a single variable, whereas changes in the efficiency of technological innovation are the result of multiple factors acting together. Therefore, when examining the path of efficiency improvements of technological innovation, not only should the degree of influence and direction of actionable individual factors be considered, but also focusing and mastering the joint effect of multiple influencing factors. On the other hand, enterprises are located in different innovation environments, and the direction and degree of influence exerted by factors may also produce differences. In the case of China’s eastern, central and western regions, the eastern region of the country, with its superior market environment and a high level of development capability factor, has moved away from its previous crude economic growth model, which was dominated by traditional factor inputs. Innovative activities are market-driven, and science and technology innovation has become a major engine of economic development. However, some provinces in Central and Western China are still falling behind in infrastructure construction, opening up to the outside world and having relatively low marketization. Although the innovation environment in the central and western regions has been improved by the policies of “Rise of Central China” and “Western Development”, it still has a large gap with the eastern regions. Therefore, regional heterogeneity should also be included in the study of technological innovation efficiency improvement, and regional innovation efficiency should also be improved according to local conditions.
To make up for the shortcomings of existing studies, we aim to dig deeper into the path of technological innovation efficiency enhancement in China’s high-tech industries. A qualitative approach is introduced to examine the joint effects of antecedent conditions, such as the level of economic development, human capital, government support, industrial structure, the level of openness to the outside world, the level of intellectual property protection, and MNC innovation on the efficiency of technological innovation. A neural network prediction model is used to explore the optimal path of innovation efficiency enhancement in China’s high-tech industries and to provide theoretical support for promoting China’s technological progress. The main contributions of this paper include: firstly, the fuzzy-set qualitative comparative analysis (fs/QCA) method, which is used to deeply explore the innovation efficiency enhancement paths of China’s high-tech industries and enrich the theoretical explanation of the antecedent conditions of technological innovation efficiency; and secondly, utilizing the Applying Genetic Algorithm (GA) and Particle Swarm Optimization (PSO) to optimize the Back Propagation (BP) neural network to identify the optimal paths of innovation efficiency enhancement in China’s high-tech industries, which will open up new horizons in China’s technology innovation research, enrich and improve the methods and tools of China’s regional innovation development research, and provide support and suggestions for promoting China’s high-quality science and technology development.
The remainder of the paper is organized as follows: Section 2 is a literature review and theoretical framework, which mainly describes the mechanism of action between antecedent conditions and technological innovation efficiency; Section 3 is the research design, which mainly uses the QCA method and GA-PSO-BP neural network to build the path optimization model; Section 4 is empirical to identify the improvement path of the innovation efficiency of China’s high-tech industry and the optimal path of each region; Section 5 provides further discussion; and finally, the conclusion and suggestion are provided in Section 6.

2. Literature Review

Technological innovation is an important part of the country’s innovation system. Enhancing the efficiency of technological innovation is an important way to improve a country’s competitive edge and achieve sustainable development goals. In this study, both inductive and deductive methods are used to identify and select configurations for technological innovation efficiency improvement. First, a top-down deductive approach is used to explicitly select both external and internal antecedents. Then, a bottom-up inductive approach is applied to summarize the research on the efficiency of technological innovation. Levels of economic development, human capital, government support, industrial structure, innovation of multinational corporations, openness to the outside world and protection of intellectual property rights were chosen as final antecedents. Finally, this study concludes with theoretical results on the mechanism of action between each antecedent and the efficiency of technological innovation.

2.1. External Influences on the Efficiency of Technological Innovation

2.1.1. The Economic Development and the Efficiency of Technological Innovation

Pulling market demand is not only the basic starting point for promoting innovative activities but also an important source of motivation [18], which plays an irreplaceable role in enhancing the efficiency of technological innovation. A higher level of economic development can provide a good material base and market demand for innovation, which has a great supporting effect on innovation activities and directly enhances the efficiency of technological innovation [19]. Meanwhile, economic development helps to promote the education of human resources, investment in workforce training, and the level of infrastructure, which indirectly contributes to the efficiency of technological innovation [20]. Therefore, the level of economic development is a non-trivial influence on the efficiency of technological innovation.

2.1.2. Human Capital and the Efficiency of Technological Innovation

China’s economic growth pattern has gradually shifted from a traditional factor-driven model to an innovation-driven development model. Human capital, as an important factor leading innovation-driven development, provides knowledge carriers and technological support for innovation development, and is the main driving force for promoting scientific and technological research, and development and transformation of achievements [21]. The increase in human capital means that the higher the supply of high-level, highly skilled and qualified personnel, the greater the selectivity of companies for high-quality research and development (R&D) personnel, and the higher the competence of the personnel ultimately involved in innovation activities, which contributes to the success rate of carrying out innovation activities [22]. Meanwhile, a high level of human capital helps to reduce production and R&D costs, improve the efficiency of the use of invested capital, and thus achieve an increase in the efficiency of technological innovation.

2.1.3. Government Support and Efficiency of Technological Innovation

The government is an essential participant in the regional innovation system, and government support for innovative behavior plays an important guiding and fundamental role in the improvement of technological innovation efficiency [23]. Government support is central to the construction and optimization of innovative environments. The government supports enterprises’ innovative R&D by providing R&D funds, granting innovation subsidies and providing tax incentives to enterprises [24], which stimulates enterprises to carry out independent innovation activities and helps to promote their innovative output [25]. Moreover, government-led innovation environment construction is conducive to the clustering of innovation factors. As a result, clusters of high-quality innovative resources are formed to better exploit the scale effect, which is conducive to improving the efficiency of technological innovation.

2.2. Internal Influences on the Efficiency of Technological Innovation

2.2.1. Industrial Structure and Efficiency of Technological Innovation

There is a consensus that industrial structure can have an impact on regional innovation. The upgrading of regional industrial structure can provide a broad market for the application of new knowledge and technology, attract the concentration of high-tech industries, and promote the development of strategic emerging industries [26]. Moreover, the upgrading of industrial structure will further deepen the division of labor and promote the efficiency of regional innovation [27]. However, some scholars have also found that the blind pursuit of upgrading and promoting advanced industrial structure under a relatively reasonable industrial structure can hinder the rational allocation of innovation production resources, which in turn inhibits the efficiency of technological innovation [28]. Therefore, industrial structure is an important influence on the efficiency of technological innovation.

2.2.2. The Level of Openness and the Efficiency of Technological Innovation

Reform and opening up is not only an important prerequisite for the country’s rapid economic development, but also an inevitable requirement for the country to achieve high-quality technological development. An active policy of opening up to the outside world can help attract more foreign capital inflows and increase the market size and investment scope of the host country [29]. Meanwhile, the increased level of openness is conducive to the introduction of high-quality talent, high-level technology, advanced management concepts and business models. The competitive and learning effects motivate enterprises to actively upgrade their own products and technological innovations, which can also effectively drive the development of affiliated enterprises and promote the regional innovation capacity [30].

2.2.3. The Intellectual Property Protection and the Efficiency of Technological Innovation

Intellectual property creation is not only key to promoting innovation and high-quality development in the region, but also an important driving force to stimulate and drive innovation. Firstly, regions with a higher level of intellectual property protection have a lower risk of intellectual property rights infringement for enterprises, which is conducive to motivating enterprises to invest more in R&D and strengthening their willingness to sustain innovation [31]. Secondly, when the government enforces intellectual property protection, enterprises will provide more critical information about R&D investment projects, which will help increase the willingness of external investors to invest and promote innovation. Finally, enterprises tend to use intellectual property pledge financing to obtain resource support in an environment of fair competition, and transparent and open information, which helps to enhance the comprehensive strength of regional innovation [32].

2.2.4. MNC Innovation and Efficiency of Technological Innovation

MNC innovation can have a positive effect on host country innovation activities by generating technology transfer and technology spillover effects through demonstration effects, competitive effects, personnel mobility and industrial linkage effects [33]. The entry of multinational companies into China inevitably leads to personnel and technology exchanges with high-tech Chinese industries, which promotes the flow of innovative resources [34]. Meanwhile, the entry of multinational companies can increase market competition [35]. This makes the high-tech industries compete not only with domestic enterprises but also with foreign enterprises. It has prompted high-tech industries to pay more attention to core technology research and increase investment in innovation, which has boosted the efficiency of innovation in high-tech industries.
Therefore, we construct a factor-dependent research framework for innovation efficiency improvement in China’s high-tech industries, as shown in Figure 1.

3. Study Design

3.1. Research Methodology

3.1.1. QCA Method

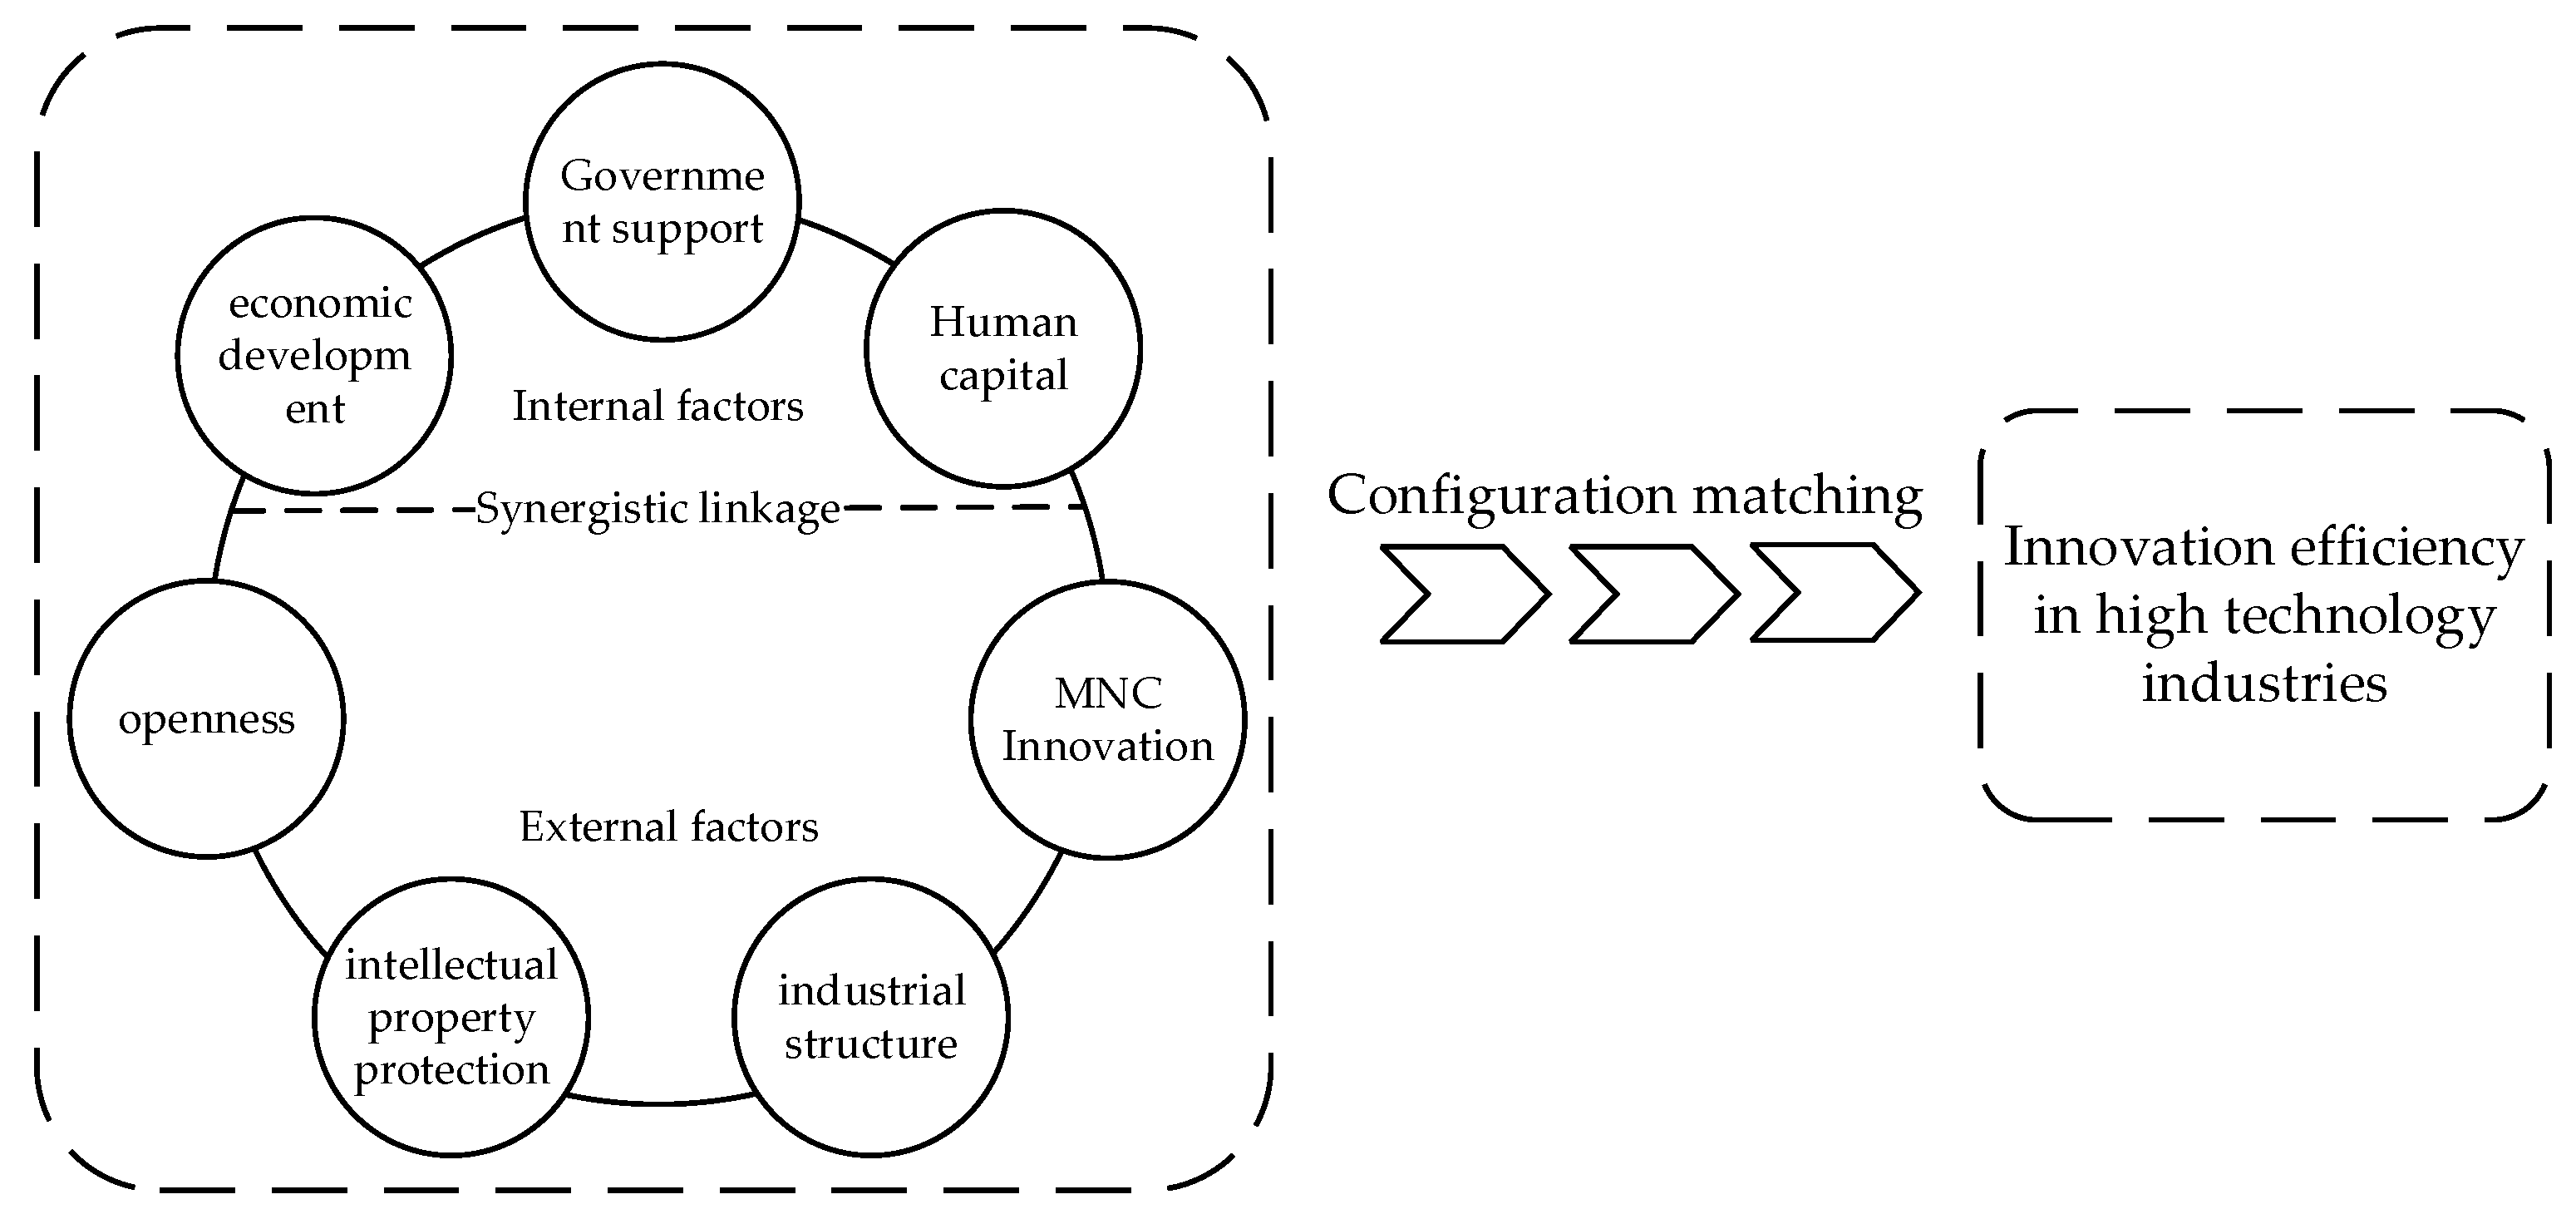
The antecedents of technological innovation efficiency do not function in isolation, but will be correlated and affect each other; hence, the fs/QCA approach was chosen to construct the factor-linkage model of technological innovation efficiency in this study. QCA was explicitly proposed by sociologist Regin in 1987 as a case-oriented research method that integrates the advantages of qualitative and quantitative analysis. Fiss used it in 2007 for empirical analysis, and since then the QCA method has been widely used in solving management problems [36]. QCA methods include clear-set qualitative comparative analysis (cs/QCA), multi-value set qualitative comparative analysis (mv/QCA), and fuzzy-set qualitative comparative analysis (fs/QCA). The cs/QCA and mv/QCA require dichotomous or multivariate segmentation of the variable data, which over-emphasizes the differences between groups and may indirectly lose a large amount of sample information, leading to serious outcome errors. Moreover, mv/QCA is difficult to handle continuous data, so these two methods are only suitable for specific studies. Compared with cs/QCA and mv/QCA, fs/QCA is good at dealing with analytical problems that are not dichotomous, defining the degree of affiliation of each variable in the range of [0,1]. It exhibits the characteristics of ambiguity and is suitable for continuous data studies, where the state of the variables can be more precisely described and the objectivity and confidence of the results can be improved. In this study, the fs/QCA method was used to select the innovation efficiency of China’s high-tech industries as the outcome variable, and the level of economic development, government support, human capital, industrial structure, innovation of multi-national corporations, openness and intellectual property protection as the conditional variables.

3.1.2. BP Neural Network

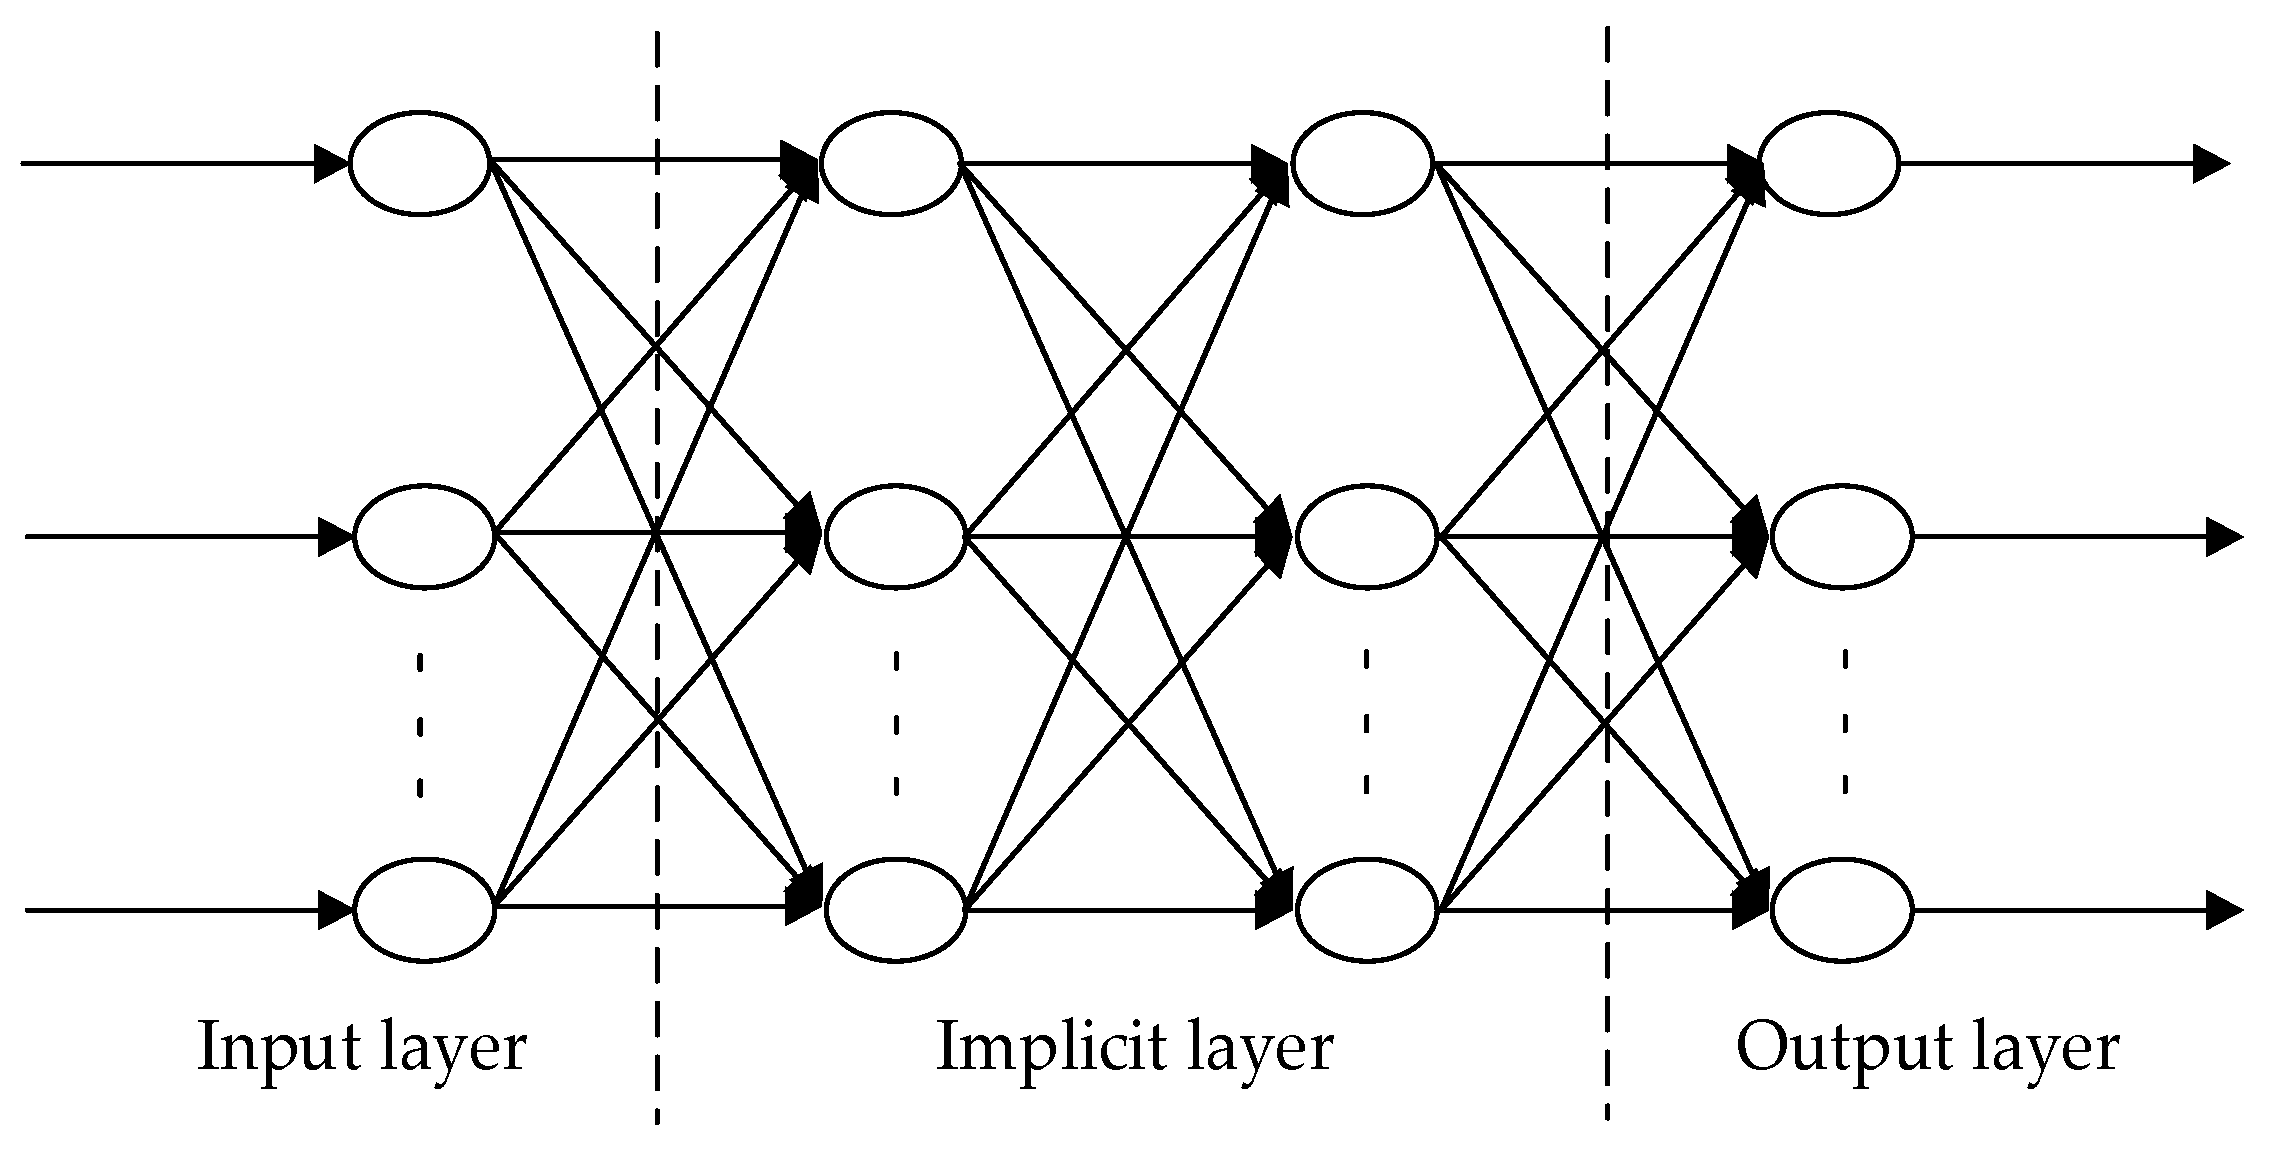
Artificial neural network models are mathematical representations formed by abstracting the information transfer of biological neurons using mathematical language. It has successfully solved many real-world problems in the fields of pattern recognition, intelligent robotics, automatic control, biology, and economics, and demonstrated powerful intelligent properties. BP neural network is a classical model of artificial neural network, which is a multilayer feed-forward neural network model. This neural network model uses the error backpropagation algorithm to solve the learning problem in the connection pairs of the hidden layers of a multilayer neural network [37]. BP neural networks can be used to implement arbitrary nonlinear mapping from input to output by varying the network weights, layers, and nodes. The basic idea is the gradient descent method, which uses gradient search techniques to achieve the minimum mean-squared error between the actual output value and the desired output value of the network [38]. The implementation process of BP neural network learning algorithm mainly includes the following three parts: firstly, the input sample forward propagation process. Here, the sample data is passed from the input layer through the implicit layer to the output layer, and the corresponding network output values are calculated based on the input samples. The sample data is passed from the input layer through the hidden layer to the output layer, and the corresponding network output value is computed based on the input samples. Secondly, output error back propagation process. Here, the sample data is forward propagated to obtain the output results, and the network weights and thresholds are corrected for learning by using the error between the output results and the expected ones. Thirdly, cyclic memory training process. Here, the input sample forward propagation procedure and the output error backward propagation procedure are repeated until the output error reaches the desired accuracy value of the ensemble. The specific procedure of the BP neural network is illustrated in Figure 2.

3.1.3. GA-PSO Algorithm

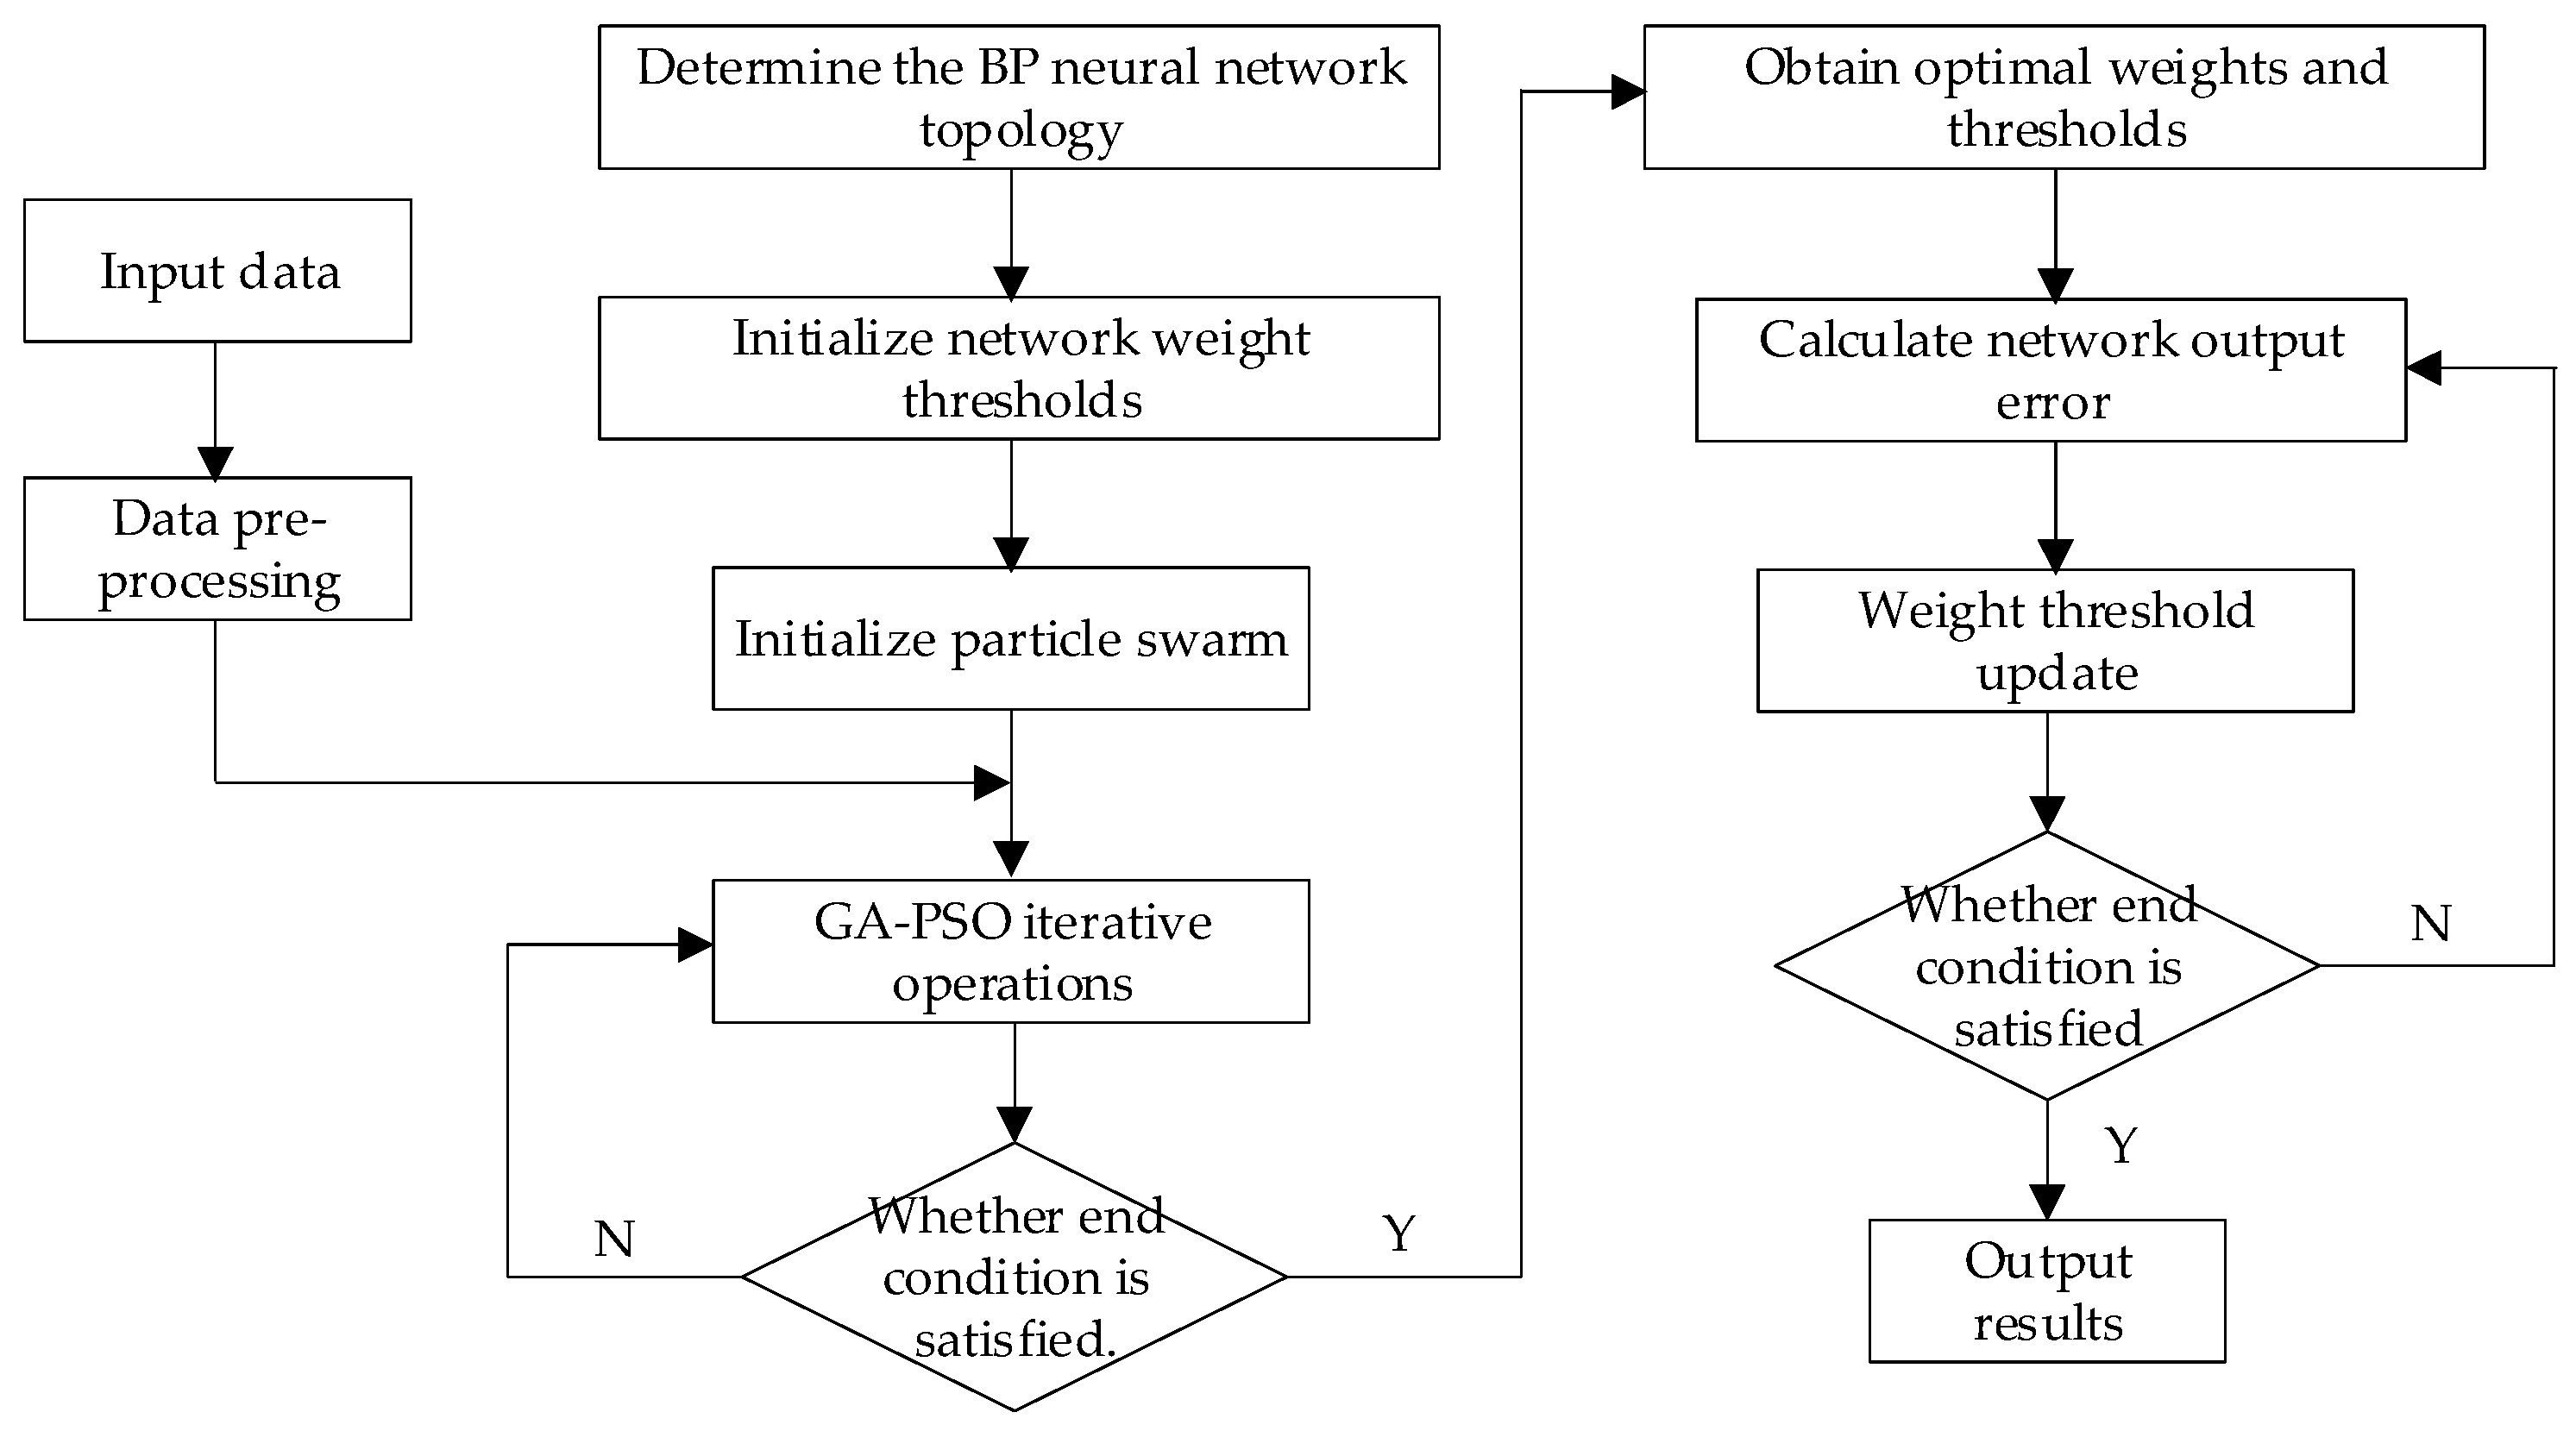
GA is a computational model of a biological evolutionary process that mimics the mechanism of natural selection and genetics of biological evolution [39]. It is an optimization algorithm that finds an optimal solution by simulating a natural evolutionary process, and is widely used in combinatorial optimization, machine learning, and signal processing. PSO is a global stochastic search algorithm based on simulating the intelligent behavior of a flock of birds in the process of predation [40]. The GA-PSO algorithm is a hybrid algorithm formed by introducing the GA algorithm into the PSO algorithm. The GA algorithm has the advantage of having excellent global search ability, does not easily get stuck in local extrema, has good scalability, and can be mixed with other algorithms; however, it also has the drawback of having low local search ability and being prone to premature convergence. The PSO algorithm has the advantages of fast convergence, high generality, and small parameter settings, but it also has the drawbacks of easily conducting population convergence earlier than normal and having a slow convergence later than normal [41]. Due to the scalability of the GA algorithm, the genetic operation operator in its algorithm is brought into the PSO algorithm to perform crossover operations and variation operations on the position and velocity vectors of the particles during the iterative process of the particle swarm, which helps maintain the diversity of the population and the population jumping out of the local extrema, and also greatly improves the global search performance of the population.

3.1.4. GA-PSO-BP Neural Network

The BP neural network has outstanding merits and can effectively solve the problem of adjusting the weights and thresholds of multilayer feed-forward neural networks. It features massively parallel processing, strong fault tolerance, and distributed storage [42]. With a complete theoretical foundation and successful application cases, it implements a nonlinear mapping function from the input layer to the output layer and has become a hot topic for applications in several research areas. However, BP neural networks still have drawbacks, such as slow convergence, a tendency to get stuck in local extrema, and a tendency to overfit during training [43]. As a result, a variety of improvements have emerged. For example, the integration of the additional momentum method and the LM (Levenberg–Marquardt) algorithm in the training of BP neural networks is very effective in improving the shortcomings of traditional neural BP. In addition, there are also optimization learning algorithms, such as the PSO algorithm (Partical Swarm Optimization) which is applied to the learning process of BP neural networks; however, the PSO algorithm still has shortcomings, such as low solution accuracy and easy scattering, so the performance of PSO-BP neural networks still needs to be improved. The GA and PSO algorithm were combined to speed up the convergence of the algorithm and solve the problem of early convergence [44]. Therefore, the GA-PSO hybrid algorithm is used in this study to optimize the performance of BP neural networks. The GA-PSO-BP neural network algorithm is used to construct an improved path optimization model for technological innovation effectiveness. The flow chart of the GA-PSO-BP neural network algorithm is shown in Figure 3.

3.2. Sample Selection and Data Sources

Based on the availability of data, 30 provinces in China were selected for this study (more data were missing in Tibet, so they were excluded). Regional heterogeneity is taken into account by dividing the 30 provinces in the sample into three regions: Eastern, Central and Western, according to the way the National Bureau of Statistics of China divides them. The eastern region specifically includes Beijing, Fujian, Guangdong, Hainan, Hebei, Jiangsu, Liaoning, Shandong, Shanghai, Tianjin and Zhejiang. The central region includes Anhui, Henan, Heilongjiang, Hubei, Hunan, Jilin, Jiangxi and Shanxi provinces. The western region includes Guangxi, Guizhou, Shaanxi, Sichuan, Yunnan, Chongqing, Inner Mongolia, Gansu, Qinghai, Ningxia and Xinjiang. The data on innovation efficiency, economic development level, human capital, government support, industrial structure, multinational corporation innovation, openness level and intellectual property protection level of China’s high-tech industries are mainly obtained from the “China High-tech industries Statistical Yearbook”, “China Industrial Statistical Yearbook”, “China Statistical Yearbook” and statistical yearbooks of each province. Since the statistical method of “China High-tech industries Statistical Yearbook” changed after 2008, this study selects 2009-2020 as the research period in consideration of the accuracy of the data.

3.3. Variable Definition and Measurement

The specific measures of antecedent conditions and outcome variables for this study are listed below. Innovation efficiency of China’s high-tech industries (IE). Data related to domestic enterprises and state-owned enterprises in China’s high-tech industries were selected to measure the innovation efficiency of China’s high-tech industries. The innovation efficiency of China’s high-tech industries is measured using the ultra-efficient SBM model with full-time equivalent research and development personnel, internal R&D funding and new product development funding as input indicators, and the number of patent applications and valid inventions and new product sales revenue as output indicators. Economic development (ED): Gross domestic product (GDP) per capita is used as a proxy variable to measure the level of economic development, which can reflect the state of economic development and potential of a region. Human capital (HC): Human capacity directly affects innovation efficiency, as well as the ability of innovation agents to externally learn, assimilate and digest new technologies. Thereby, this can indirectly affect innovation efficiency. This study expresses human capital in terms of the ratio of the number of researchers to the number of employed people. Government support (GS): The higher the indicator, the more favorable it is for improving the motivation of the subject to carry out innovative activities. In this study, the percentage of government funding in R&D grants was used to indicate the strength of government support. Industrial structure (IS): Industrial structure is an important influence on intra-regional efficiency, as measured by the ratio of tertiary industry output to regional GDP. MNC innovation (MNCI): MNC innovation has helped activate China’s regional innovation system and has had a major impact on corporate technology innovation. The innovation efficiency of MNCs in China was chosen to represent MNC innovation. Openness (OP): The high level of foreign development is conducive to improving the efficiency of foreign exchange and resource factor accretion, which has a significant impact on scientific and technological innovation. This study uses the ratio of total imports and exports to regional GDP to express the level of openness. Intellectual property protection (IPP): The intellectual property protection system is an effective guarantee against malicious infringement of knowledge and technology and helps to increase the innovation-driven effect. In this study, the share of technology market transactions to regional GDP is used to express the level of intellectual property protection.

4. Empirical Analysis

4.1. Configuration Path for Technological Innovation Efficiency Improvement

4.1.1. Variable Calibration

The fs/QCA method uses set theory to transform variables into sets between [0,1]. Causes and effects are revealed by exploring the set of relations between the conditional and outcome variables. Therefore, the raw data needs to be transformed into fuzzy-set affiliation scores to conform to the Boolean logic of the QCA method. The fuzzy-set affiliation scores can be divided into three-value sets, four-value sets, and six-value sets as needed, which gives the raw data an interpretable ensemble meaning. This process is known as data calibration. Based on the actual meaning and vector nature of the sample data, the anchor point is determined by applying the quartile point method in this study. Referring to Greckhamer’s method [45], 95%, 50%, and 5% were selected as the three directional anchor points for data calibration as fully affiliated, intermediate, and completely unaffiliated to calibrate the sample data. The calibration anchor points for the outcome and conditional variables are shown in Table 2.

4.1.2. Necessity Analysis

After the variables have been calibrated, a necessity test needs to be performed on the individual conditional variables to check for the presence of a necessity condition in the conditional variables that affect the outcome variables. The fuzzy affiliation scores of the sample data are imported into the fs/QCA software, which generates two metrics, coherence and coverage. Consistency is the degree of agreement between a sample test and a pooled relation, and coverage measures the importance of a combination of conditional variables. The results of the tests are shown in Table 3. If the consistency of a conditional variable is greater than 0.9, it means that the variable is a necessary condensation of the outcome variable and requires a special label for the necessary condition. According to Table 3, the agreement of each conditional variable is below the critical value of 0.9, which means that no conditional variable is necessary to influence the outcome variable. This suggests that the rising efficiency of innovation in China’s high-tech industries is subject to the combined effect of several influencing factors. Therefore, a combined analysis of the factors affecting the innovation efficiency of China’s high-tech industries is needed.

4.1.3. Analysis of Conditional Configurations

The configuration distribution of all conditional variables is determined by constructing a truth table. Case thresholds and consistency thresholds are determined during the construction of the truth table. A combination of conditional variables with a concordance score greater than or equal to the threshold can be called a fuzzy subset of the outcome variable, while a combination of conditional variables with a concordance score less than the threshold does not constitute a fuzzy subset. In this study, the consistency threshold, case threshold, and PRI threshold were set to 0.80, 1, and 0.75, respectively, based on Park’s study [46]. Then, the configuration effect of innovation efficiency in China’s high-tech industries was analyzed.
The normalization runs were performed with the fs/QCA software and yielded 3-form solutions including complex, simple and intermediate solutions. The complex solution will reject all logical residual terms. As a result, more combinations of conditions are obtained, which are not favorable for the analysis of the results. Simple solutions accept all logical residual terms without evaluating and filtering the conditional variables, which can easily lead to deviations from the actual situation. The intermediate solution lies between the above two, and it incorporates a logical residual term that is consistent with theory and practice. The conclusions of the analysis are objective in nature and have a high degree of applicability. Therefore, this study uses a combination of intermediate and simple solutions to analyze the conditional configurations that affect the innovation efficiency of high-tech industries in China. Based on the results of the research data shown in Table 4, a path of improvement in the efficiency of innovation in China’s high-tech industries has been constructed.
It can be seen from Table 4 that the seven conditional variables eventually form four causal configuration paths. The consistency of each path and the overall solution for the innovation efficiency of China’s high-tech industries is greater than 0.8, and the total coverage is 0.785, which indicates that these four conditional configurations can cover and explain more than 78.5% of the innovation efficiency improvement of China’s high-tech industries, and the results are more satisfactory. Based on the distribution of conditional configurations, combined with the comparison results for simple and intermediate solutions, it can be found that innovation, economic development level, and government support play major roles for MNCs in each of the four configuration paths. They are the core conditions that drive the innovation efficiency of China’s high-tech industries. With the development status of innovation in China’s high-tech industries, four paths to enhance the efficiency of innovation in China’s high-tech industries have been analyzed specifically around the three core conditions of MNC innovation, economic development and government support.
Path 1
“MNC innovation—economic development—government support” linkage type. MNC innovation, economic development and government support emerge simultaneously as core conditions with human capital and the level of existing intellectual property protection as marginal conditions. This condition configuration indicates that high efficiency of multinational innovation, a good level of economic development and strong government support in the region, complemented by abundant human capital and a sound intellectual property protection system, can promote the efficient development of innovation in China’s high-tech industries. Zhejiang Province, Jiangsu Province and Shandong Province are typical regions that belong to this conditional configuration. These provinces are among China’s more economically, technologically and intellectually educated regions, ranking high in terms of total GDP. The region has sufficient R&D capital investment, a large number of research institutions, universities and high-tech enterprises, which will pool and collect rich resources of talent, and a good level of intellectual property protection. As a result, MNCs are driven to invest in R&D in these regions, and with superior innovation environments and innovation resources, continuously spill new knowledge, technologies and management concepts for other innovation agents in the region, while enhancing their own innovation efficiency. It has boosted the innovation efficiency of China’s high-tech industries and accelerated the continuous improvement of regional innovation capabilities.
Path 2
“MNC innovation—government support” linkage type. MNC innovation and government support exist as core conditions, economic development, human capital and openness as marginal conditions, and industrial structure and intellectual property protection are absent. This condition configuration indicates that MNCs with a high innovation efficiency and strong government support in the region, combined with advanced economic development, sufficient human resources and high levels of openness, can promote the innovation efficiency of China’s high-tech industries. Beijing, Shanghai and Guangdong province are typical regions that belong to this condensation configuration. These regions are China’s economic, technological, educational and market centers, with top-notch economic development levels, ample government investment in research and development, high-quality research universities, institutions and enterprises, numerous state-of-the-art laboratories and other science and technology innovation service platforms, and clear advantages in innovation environment and innovation resources. Meanwhile, with the benefits of reform and opening-up, most of the above-mentioned regions have taken the lead in building a sound trading market system in China. It has not only facilitated the marketization of scientific and technological achievements in China’s high-tech industries, but also helped a large number of oversea MNCs rapidly enter the Chinese market. The cooperation between MNCs and each innovation body in the region is strengthened, the inter-regional technology transfer and transformation of scientific research results is accelerated, and the deep integration of regional science, technology and economy is accelerated, which can promote the progress of China’s regional innovation capacity and effectively enhance the innovation efficiency of China’s high-tech industries.
Path 3
“Economic development—government support” linkage type. Economic development and government support exist as core conditions, human capital as marginal conditions, and MNC innovation, industrial structure and openness are absent. This condition configuration indicates a good level of economic development and strong government support in the region. Even if MNCs do not have a high level of innovation, abundant talent resources, imperfect industrial structure and low level of openness to the outside world, they can still contribute to the innovation efficiency of China’s high-tech industries. Liaoning, Tianjin, Shaanxi and Chongqing are typical regions that fall under this model. These regions are partly located in China’s important heavy industrial agglomerations and have strong manufacturing bases. Part of this is in the Beijing–Tianjin–Hebei region, where new industries such as new materials and biomedicine are developing rapidly. Another part is in Western China, but has more manufacturing industries and abundant educational resources. Each of these regions has its own strengths in terms of economy, technology and other resources. Universities and research institutes are encouraged to cooperate and exchange with local industries to promote an organic combination of industry-academia research and results transformation. Ultimately, it has boosted the innovation efficiency of China’s high-tech industries.
Path 4
“Economic development” driven type. Only economic development exists as a core condition; MNC innovation, government support and human capital exist as marginal conditions; and industrial structure, openness and protection of intellectual property rights are absent. The condition configuration indicates that a higher level of economic development, combined with a certain amount of multinational innovation spillover, a moderate amount of government support and sufficient human resources, can promote the efficiency of innovation in China’s high-tech industries even if the industrial structure is not perfect, the level of openness is relatively low and the intellectual property protection system is not robust. Jiangxi and Anhui provinces are typical regions that belong to this model. These regions are mainly located in the central part of the country, and the leading industries are mainly precision manufacturing. Although it is comparable to the developed provinces in the eastern region, there are some gaps in the level of science and technology, human resources, and the market system. However, the above-mentioned region is an important hinterland of the Yangtze River Delta, the Pearl River Delta and the economic zone on the west coast of the Taiwan Strait with unique location advantages. With its geographical advantages and industrial base, it has attracted more investment from MNCs and absorbed resources and technology transfers from developed provinces such as Guangdong, Zhejiang, Shanghai and Jiangsu. By continuously transforming and driving the development of technological innovation in the region, the innovation efficiency of China’s high-tech industries in the region has been boosted, and the technological innovation capability and industrial competitive strength have been enhanced.

4.1.4. Robustness Test

In order to ensure the robustness of the results, the calibration quantile was adjusted. The 95% quantile of the fully affiliated threshold and the 5% quantile of the fully unaffiliated threshold were adjusted to the 90% and 10% quantile, respectively, and the other steps were kept unchanged, and fs/QCA analysis procedure was continued. The specific results of the robustness test are shown in Table 5. Comparing the results in Table 4 with those in Table 5, it can be seen that two of the three conditional groupings are identical to Paths 1 and 3, and the other one is a subset of Path 2. The congruence and coverage also yield only minor changes, indicating that neither the core condition nor the grouping path has changed substantially. This demonstrates the robustness of the findings in this study.

4.2. Path Optimization of Technological Innovation Efficiency Improvement

Although the configuration paths for innovation efficiency improvement in high-tech industries in China are obtained by fs/QCA, the regional heterogeneity in China can lead to differences in the optimal paths for efficiency improvement in different regions. In this study, a simulation platform was built with the help of Matlab software to construct a path optimization model for innovation efficiency improvement in high-tech industries in China using a BP neural network optimized by a hybrid GA-PSO algorithm. Different scenario sets and simulations were conducted to obtain the optimal path for the improvement of the efficiency of innovation in high-tech industries in different regions of China.

4.2.1. Data Preparation and Pre-Processing

Parameters of the proposed BP neural network algorithm. The neuron transfer function from the model input layer to the hidden layer is set to be the S-type function tansig. The excitation function of neurons in the layer-to-output layer is a linear function purelin. The training function is used as trainlm and the training algorithm is the LM algorithm. The maximum number of iterations is 1000, the expected error is 0.001, and the learning rate is 0.1. The setting is a separate hidden layer network, and the number of neurons in the hidden layer is calculated as shown in Equation (1),
s = m + n + α
where s, m, and n are the number of neurons in the hidden layer, input layer, and output layer, respectively, and are taken as integers between [1,10]. In the model, m = 7, n = 1, and s takes values in the range of [4,13]. The other parameters and structures in the network are kept constant, and the model with the number of neurons in hidden layers 4–13 is tested for attention. Finally, it was determined that the error of the BP neural network algorithm is minimized when the number of neurons in the hidden layer is 9.
Parameters of the proposed GA-PSO algorithm. The number of particles contained in the population should not be too large, as the variation of the number of particles in the population can significantly affect the complexity of the network operation. The population size is set to 30, the maximum number of iterations is 100, the crossover rate is 0.7, the mutation rate is 0.1, and the learning factor is 1.5, according to the data characteristics and practical experience. The formula for calculating the individual dimension is shown in Equation (2), and the individual dimension of the particle can be calculated as 82.
D = m × s + s × n + s + n

4.2.2. Setting of Scenarios

Based on the configuration paths obtained from the fs/QCA, scenarios are set for the possible development trends of innovation efficiency in China’s high-tech industries. One category is the baseline scenario setting, which uses real impact factor data as baseline metrics. Another category is the simulated scenario setting, where the covariates in each path are adjusted to form a new combination of influences based on the baseline metrics. The values of the innovation efficiency of China’s high-tech industries in benchmark and simulation settings are compared to obtain the optimal path for innovation efficiency improvement.
The direction of adjustment of the variable settings is determined. The innovation efficiency of China’s high-tech industries was used as an explanatory variable. Economic development, human capital, government support, MNC innovation, industrial structure, openness and intellectual property protection are the explanatory variables. Econometric regression models were used to identify the direction of the explanatory variable on the explanatory variable, and the detection results are shown in Table 6. Economic development, human capital, government support, MNC innovation, openness and intellectual property protection positively affect the innovation efficiency of China’s high-tech industries. In turn, the industrial structure negatively affects the innovation efficiency of China’s high-tech industries.
Scenario settings for the four paths obtained according to the action direction of the conditional variable. Path 1: Driven by a combination of MNC innovation, economic development and government support efforts. Based on the baseline data, the value of MNC innovation, economic development, government support, human capital and intellectual property protection was increased by 10%, the value of industrial structure was reduced by 10% and the value of openness level was left unchanged. Path 2: Driven by a combination of MNC innovation and government support. Based on the baseline data, the values of MNC innovation, economic development, government support, human capital and openness were increased by 10%, while the other conditional variances remained unchanged. Path 3: Driven by a combination of economic development and government support. Based on the baseline data, the value of economic development and government support increased by 10%, the value of MNC innovation, human capital, industrial structure and openness decreased by 10%, and the level of intellectual property protection remained unchanged. Path 4: Driven primarily by economic development. Based on the baseline data, the values of MNC innovation, economic development, government support and human capital were increased by 10%, while the values of the other conditional variables remained unchanged.

4.2.3. Selection of the Optimal Path

Selection of the optimal path in Eastern China. The benchmark data for the eastern region is set according to the four path simulation metrics described above and fed into a path optimization model based on GA-PSO-BP neural network for innovation efficiency improvement in high-tech industries in China. The predicted value of the performance of local innovation in Eastern China for different paths from 2009 to 2020 is obtained and the trend of the change of the value under the four paths is depicted in Figure 4. All four paths can effectively improve the innovation efficiency of high-tech industries in Eastern China, which demonstrates the effectiveness and robustness of the high-tech industries innovation efficiency in China obtained by the fs/QCA method.
The difference between the predicted mean and the true value of innovation efficiency for the high-tech industries in Eastern China under the four paths is shown in Table 7. The predicted mean values of innovation efficiency corresponding to Paths 1, 2, 3, and 4 are 0.765, 0.739, 0.743, and 0.753, respectively. Compared to the mean value of true innovation efficiency (0.709), their differences are 0.056, 0.030, 0.034 and 0.044, respectively. The effect of the four paths on enhancing the innovation efficiency of high-tech industries in Eastern China is slightly different. The difference of Path 1 is significantly the largest, which indicates that Path 1 is the optimal path to improve the innovation efficiency of high-tech industries in Eastern China.
Selection of the optimal path in central China. The benchmark data for the central region is set according to the four path simulation metrics described above and fed into a path optimization model based on GA-PSO-BP neural network for innovation efficiency improvement in high-tech industries in China. The predicted values of the performance of local innovation in central China for different paths from 2009 to 2020 are obtained, and the trend of change in the values under the four paths is depicted in Figure 5. All four paths can effectively improve the innovation efficiency of high-tech industries in central China.
In Table 8, the predicted mean values of innovation efficiency corresponding to paths 1, 2, 3 and 4 are 0.586, 0.595, 0.581 and 0.584, respectively. Compared to the mean value of true innovation efficiency (0.537), the difference is 0.049, 0.058, 0.044 and 0.047, respectively. The four paths have a relatively balanced impact on improving the innovation efficiency of high-tech industries in central China. Path 2 has the largest difference, which indicates that Path 2 is the optimal path to enhance the innovation efficiency of high-tech industries in central China.
Selection of the optimal path in Western China. The benchmark data for the western region is set according to the four path simulation metrics described above and fed into a path optimization model based on GA-PSO-BP neural network for innovation efficiency improvement in high-tech industries in China. The predicted values of the performance of local innovation in Western China for different paths from 2009 to 2020 are obtained, and the trend of the change in the values under the four paths is depicted in Figure 6. All four paths can effectively improve the innovation efficiency of high-tech industries in Western China.
The difference between the predicted mean and the true value of innovation efficiency for the high-tech sector in Western China under the four paths is shown in Table 9. The predicted mean values of innovation efficiency corresponding to Paths 1, 2, 3 and 4 are 0.334, 0.332, 0.326 and 0.346, respectively. Compared to the mean value of true innovation efficiency (0.309), the differences are 0.046, 0.037, 0.033 and 0.044, respectively. The impact of the four paths on improving the innovation efficiency of high-tech industries in Western China is clearly different. Path 4 has the largest difference, which indicates that Path 4 is the optimal path to enhance the innovation efficiency of high-tech industries in Western China.

5. Discussion

Based on the analysis of the configuration mechanism and the optimal path selection, this study further delves into the theoretical basis of the path to achieve innovation efficiency improvement in China’s high-tech industries.

5.1. The Innovation Efficiency of China’s High-Tech Industries Is Subject to the Linkage of Multiple Internal and External Influences

Using the fs/QCA method, this study found that the innovation efficiency of high-tech industries in China is not a function of individual factors, but a combination of economic development level, human capital, government support, MNC innovation, industrial structure, openness and intellectual property protection. The reason for this conclusion is mainly that the internal and external environment can jointly affect the innovation efficiency of China’s high-tech industries [47]. In different stages of development and social contexts, there are differences in the size of MNC R&D, the degree of industrial agglomeration, and the effect of government policy implementation. According to power change theory, there is an interplay between organization and environment. Corporate innovation strategy decisions need to be changed accordingly to changes in the internal and external environment [48]. In other words, to better adapt to the external environment, China’s high-tech industries needs to adjust its resource acquisition and technology innovation strategies in a timely manner by combining internal factors, such as market size, talent pool allocation, workforce structure and R&D capital. Along the way, the elements will have a linkage effect and play a role in driving innovation efficiency in high-tech in-dust industries.

5.2. MNC Innovation and Government Support Have a Universal Effect on Improving the Innovation Efficiency of High-Tech Industries in East–Central China

Comparison of optimal innovation efficiency improvement paths for high-tech industries in Eastern and Central China shows that MNC innovation and government support have a universal impact on improving the efficiency of high-tech innovation in Eastern and Central China. According to resource dependency theory, to adapt to environmental changes and achieve innovative development, China’s high-tech industries needs to actively interact with the external environment and search for innovative resources. MNC innovation is an important way for enterprises to access innovative resources. It is necessary for China’s high-tech industries to promote technological development by giving full play to the MNC innovation spillover effect [49]. The positive effect of government support on innovation development has been confirmed by numerous scholars. It is able to promote technological innovation in China’s high-tech industries in a variety of ways, such as resource support and signaling [50]. The government can guide enterprises to use innovative resources actively and rationally, and this role is even more evident in East–Central China.

5.3. The Key to Improving the Innovation Efficiency of High-Tech Industries in Western China Is to Improve the Innovation Environment and Upgrade Their Basic Skills

Economic development dominates the optimal path of innovation efficiency improvement for high-tech industries in Western China. The main reason for this conclusion is the lower level of economic development in Western China compared to the country’s east–central regions. This is reflected in the incomplete talent pool, the imperfect construction of project support facilities and innovation policy system, as well as the late and slow process of opening up to the outside world [51,52]. The backwardness of high-tech industries in Western China is evident. Therefore, the government needs to increase the investment in education in the western region, improve the educational facilities in schools, grasp the cultivation of talents from the source, and formulate relevant policies to encourage the flow of high-quality talents to the western region [53,54]. Meanwhile, the government should cultivate and develop commodity and factor markets in the western region. Effective measures will be taken to expand the market size and capacity in the western regions. The market economy system is being improved and perfected to further regulate the market order. Marketization in the western region is enhanced so as to continuously improve the innovation environment in Western China and enhance the innovation base capacity of high-tech industries in the western region.

6. Conclusions and Recommendations

6.1. Conclusions

This study uses the fs/QCA method to excavate the multi-factor innovation efficiency enhancement path of China’s high-tech industry, which enriches the theoretical results of the antecedent conditions of technological innovation efficiency, deepens the systematic study of technological innovation efficiency, and extends the dimension and depth of technological innovation efficiency research. The optimization model of technological innovation efficiency enhancement in China’s high-tech industries is constructed based on GA-PSO-BP neural network. According to the group-path warp scenario setting and simulation, the optimal path for innovation efficiency improvement of high-tech industries in the eastern, central and western regions of China is obtained. To develop innovation management strategies for China’s high-tech industries based on the level of regional economic development and regional endowment characteristics, it is of great practical significance to efficiently utilize innovation resources and enhance the innovation capacity of localities and enterprises, and help to promote sustainable progress in the innovation efficiency of China’s high-tech industries, which in turn promotes high-quality development of regional innovation in China. The findings of the study include the following main conclusions:
(1)
The improvement of technological innovation efficiency is revealed as a con-current mechanism of multi-factor combination through a configuration perspective. There is no single condition among economic development, government support, human capital, industrial structure, MNC innovation, openness or intellectual property protection that is necessary to promote the efficiency of innovation in China’s high-tech industries. Only an effective combination of conditions can achieve the goal of increasing the level of innovation efficiency in China’s high-tech industries.
(2)
Four configuration paths of innovation efficiency improvement in China’s high-tech industries were identified by applying the fs/QCA method. They are: the “MNC innovation—economic development—government support” linkage type, the “MNC innovation—government support” linkage type, the “Economic development—government support” linkage type, and the “Economic development” driven type.
(3)
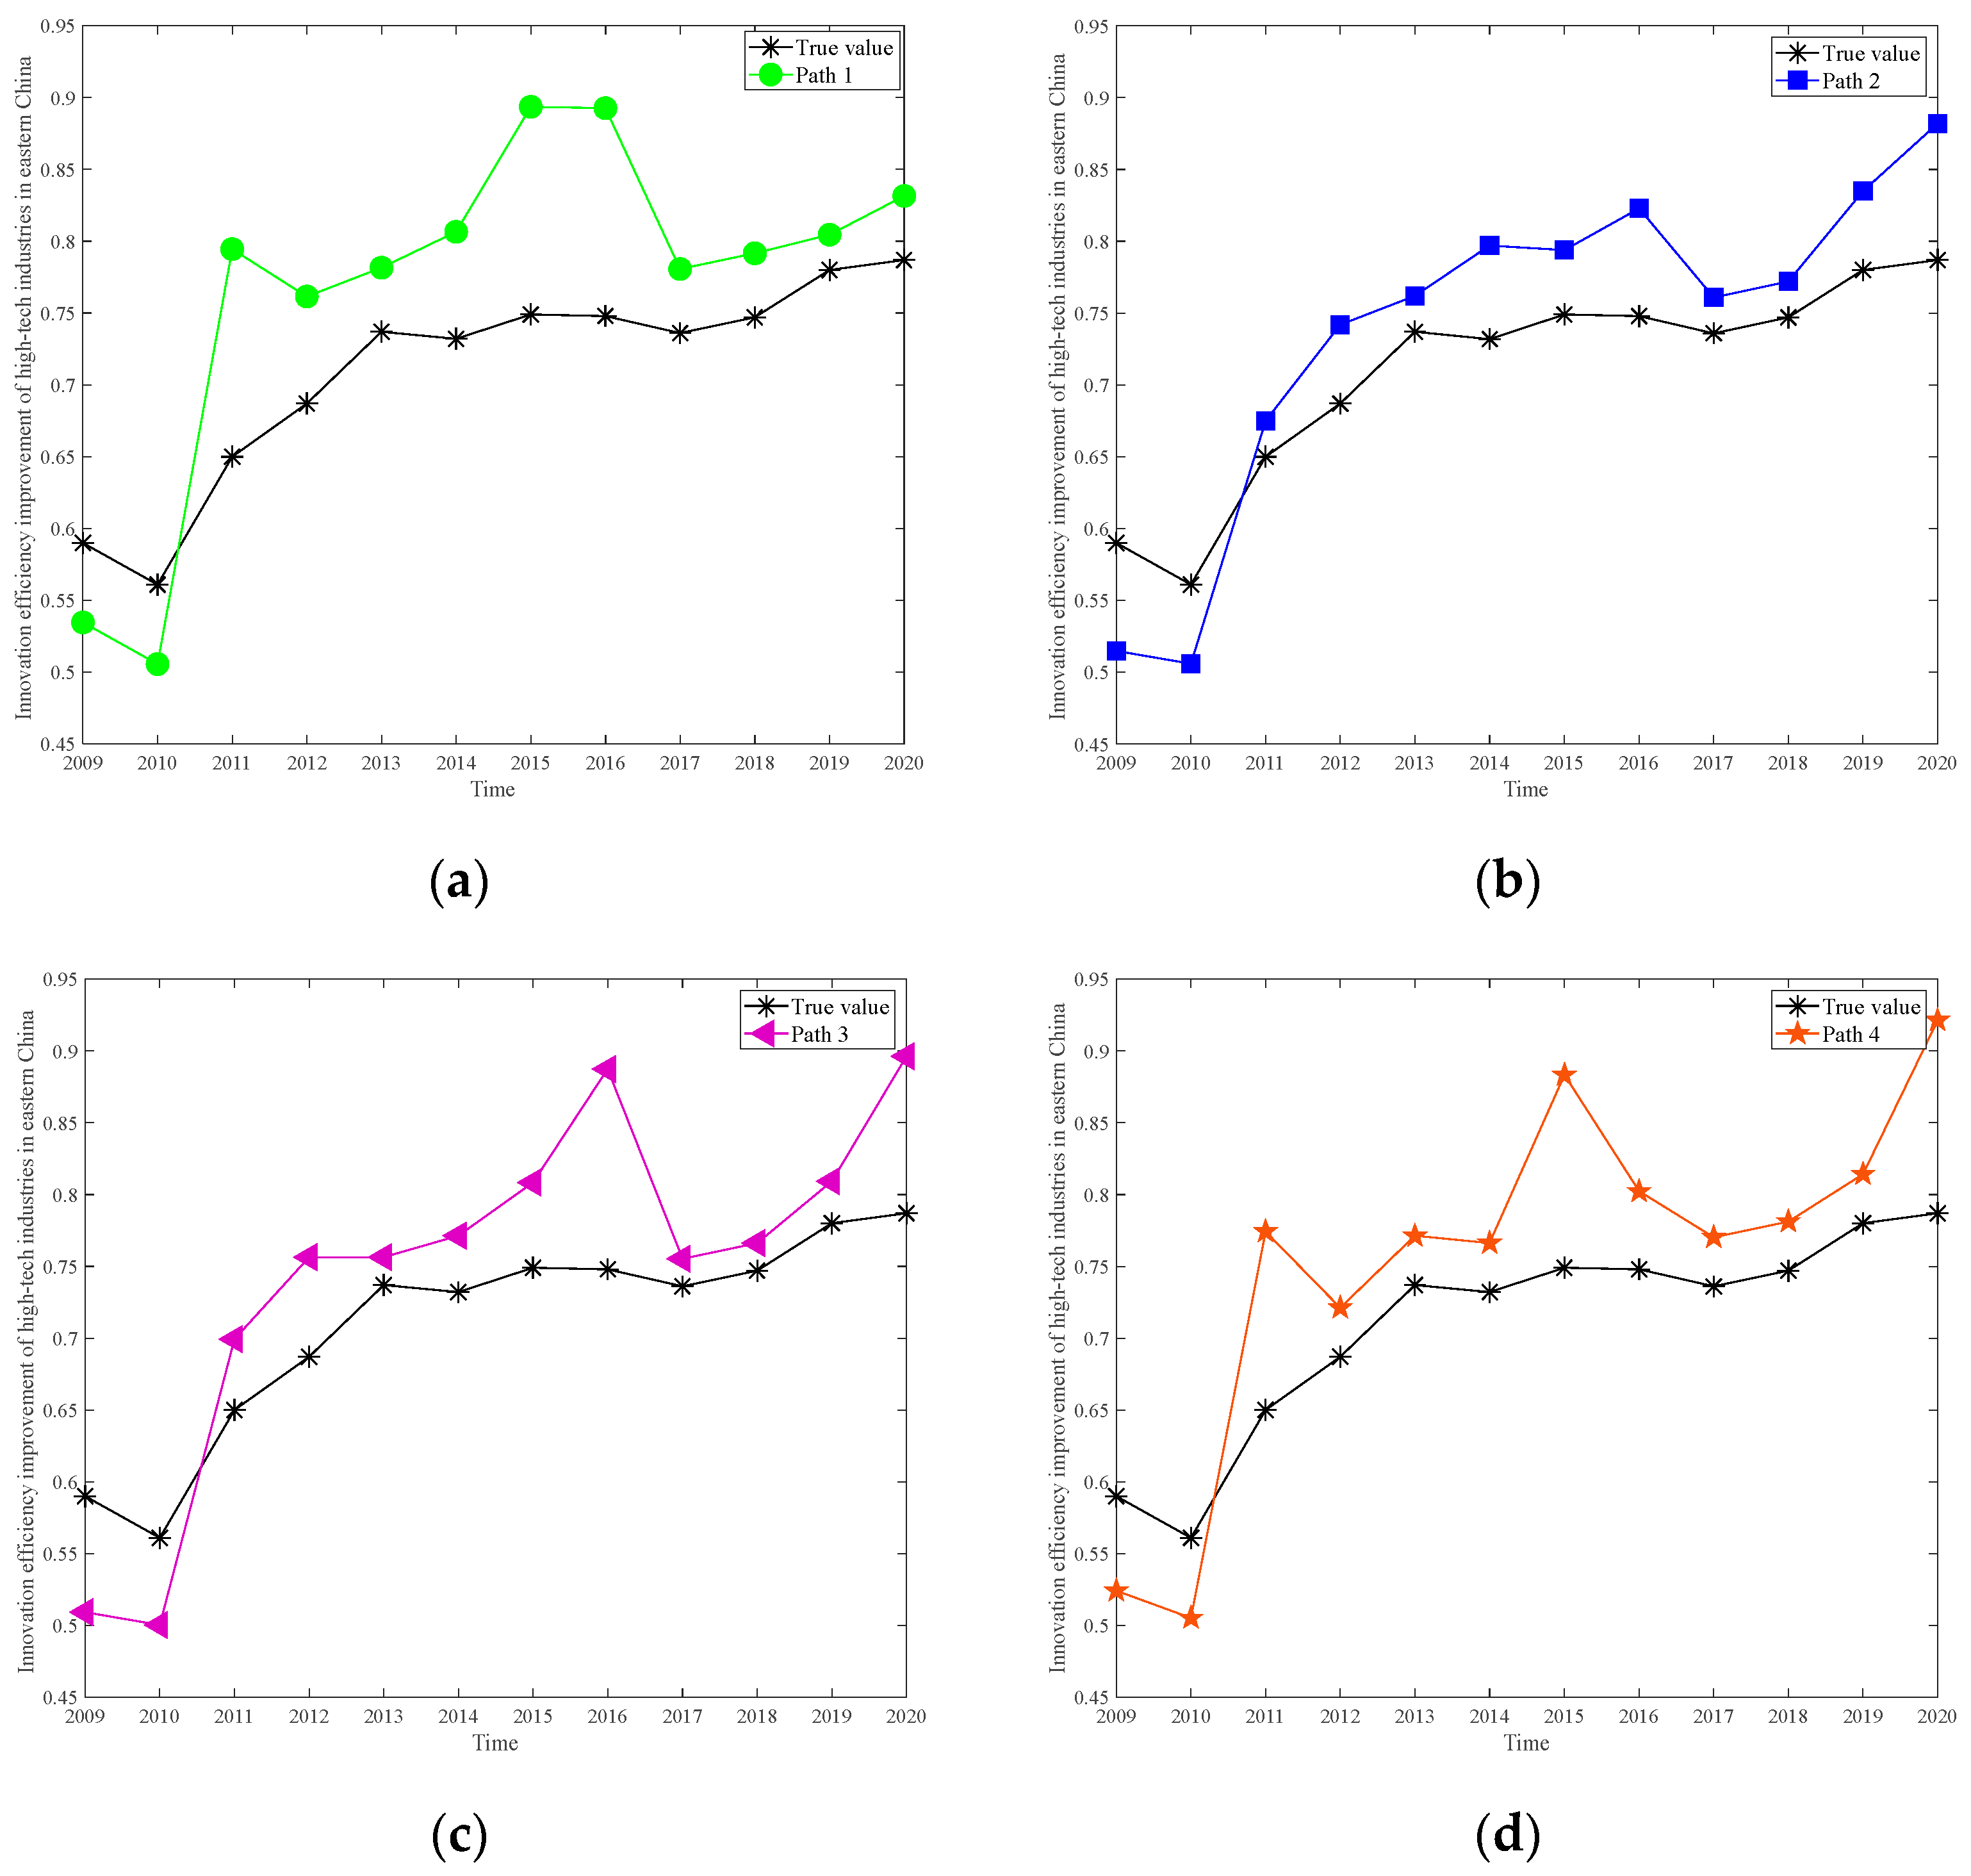
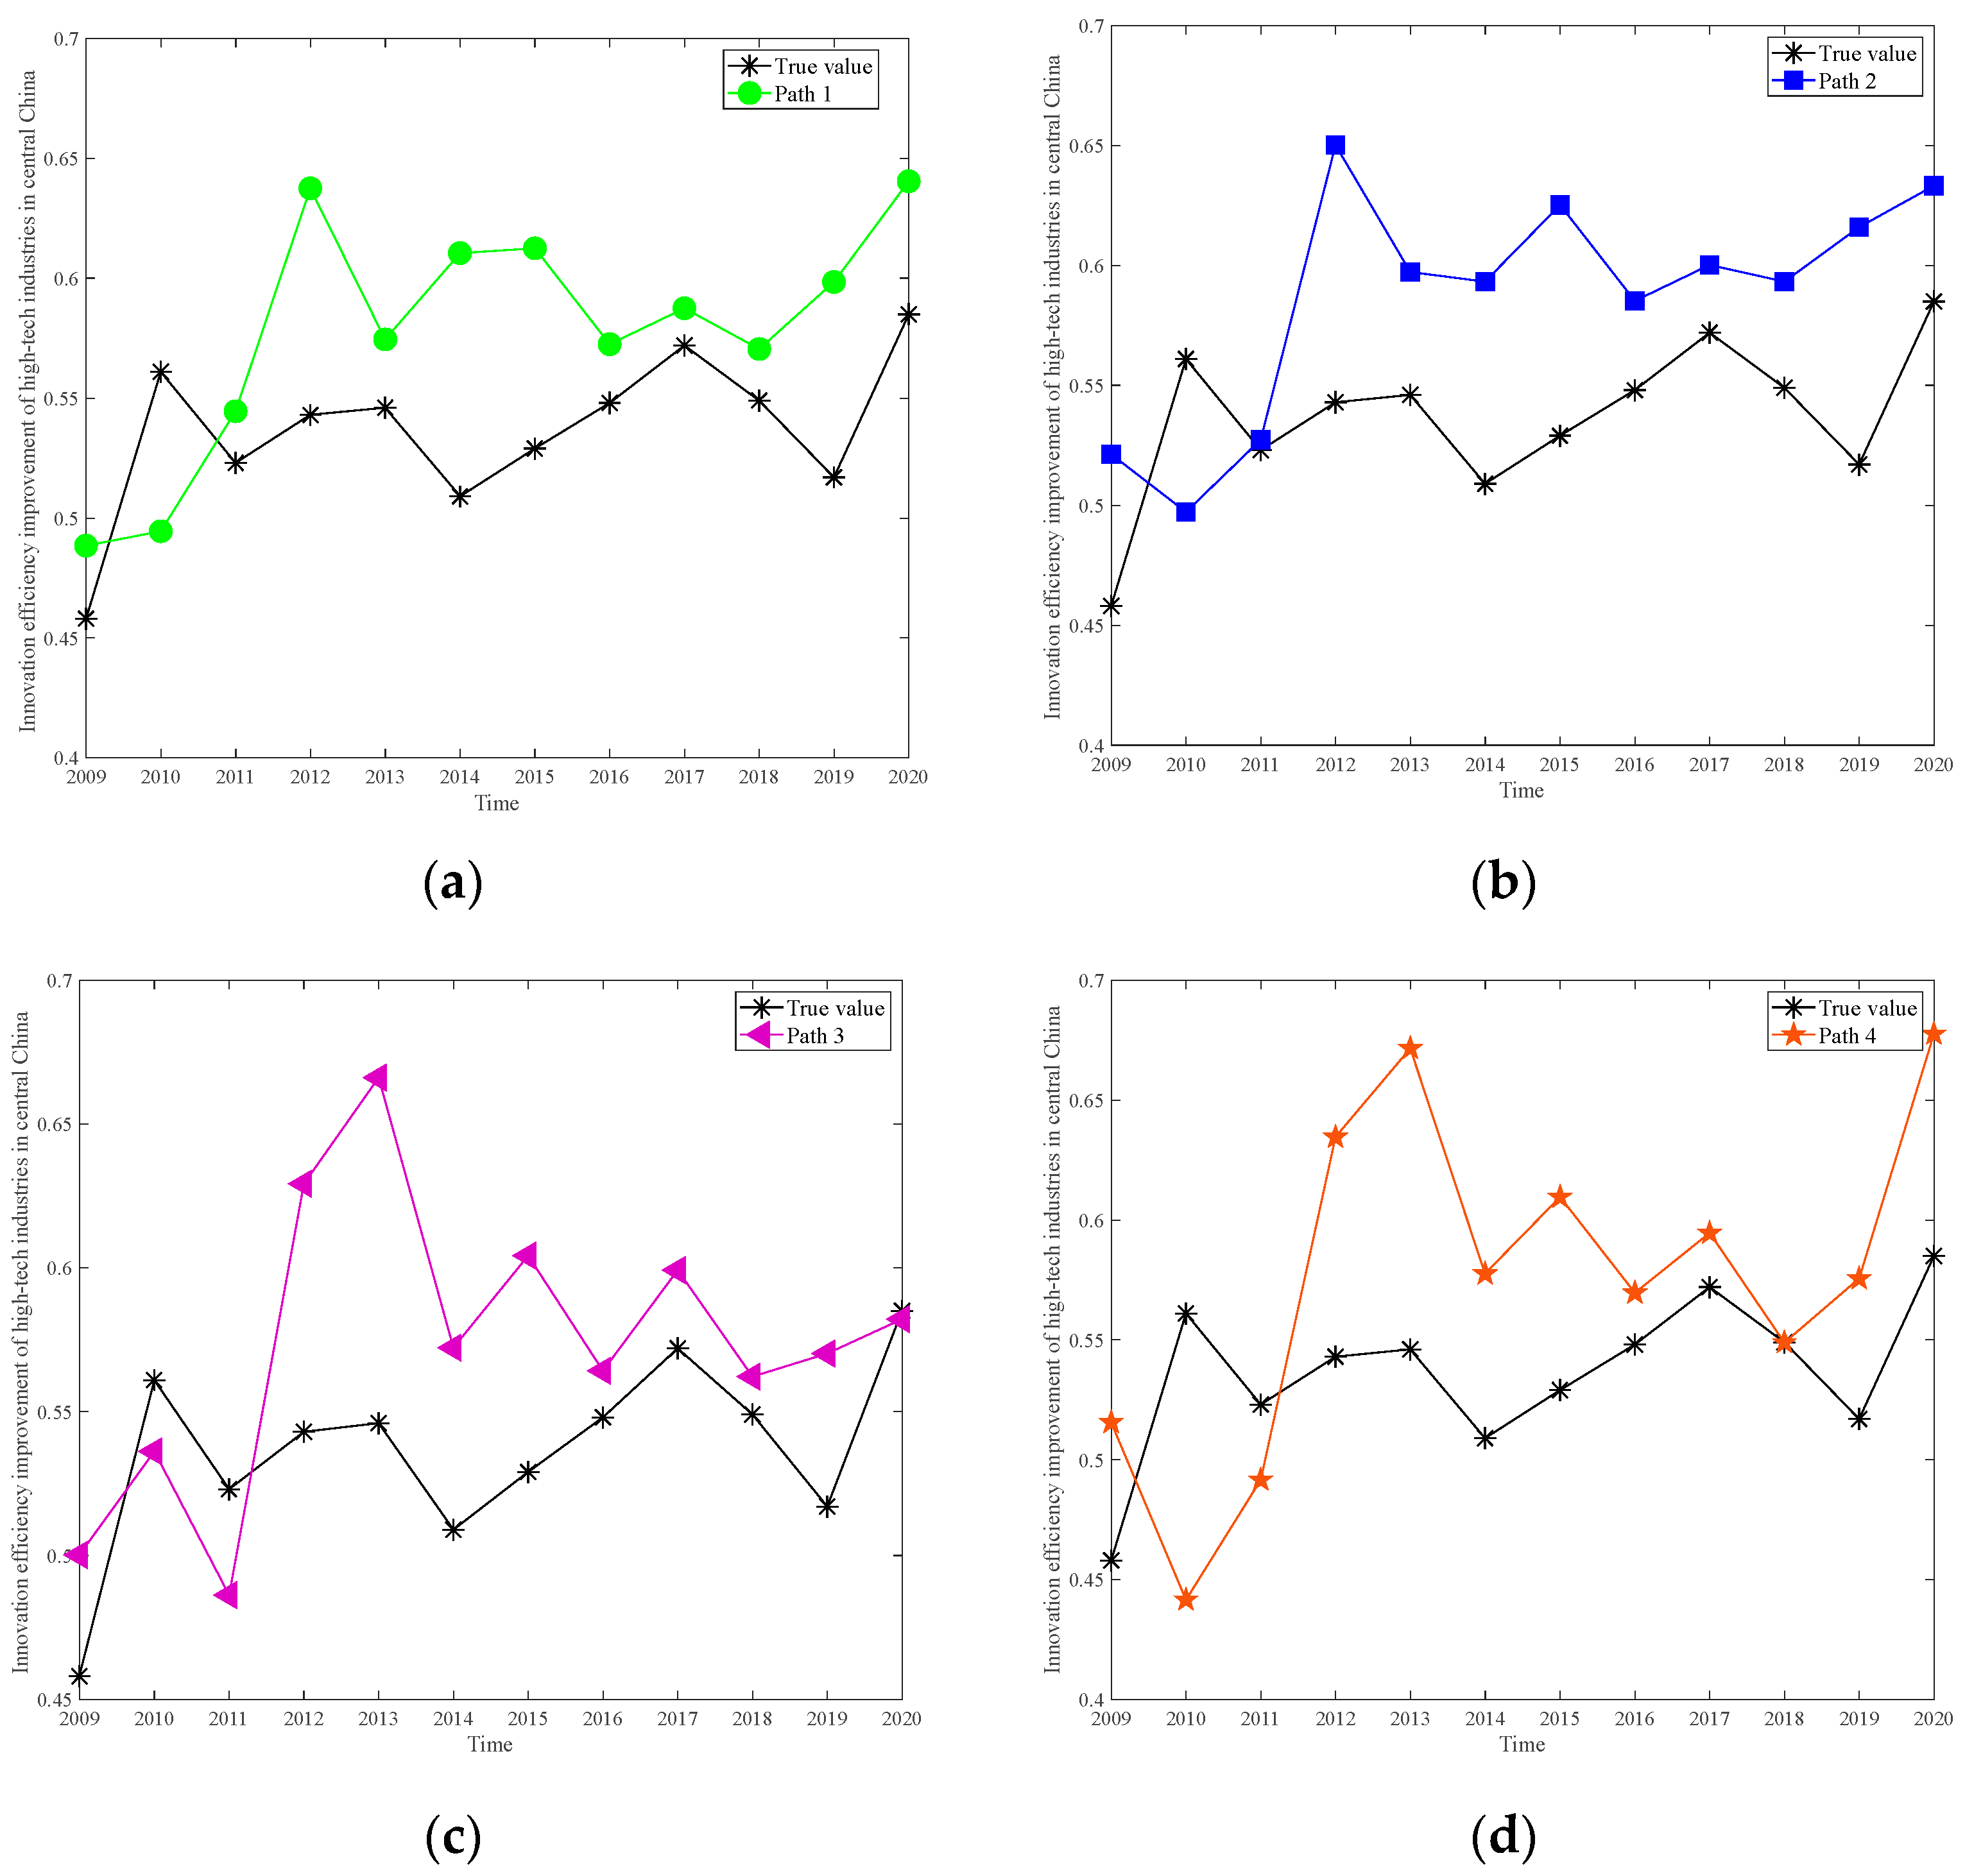
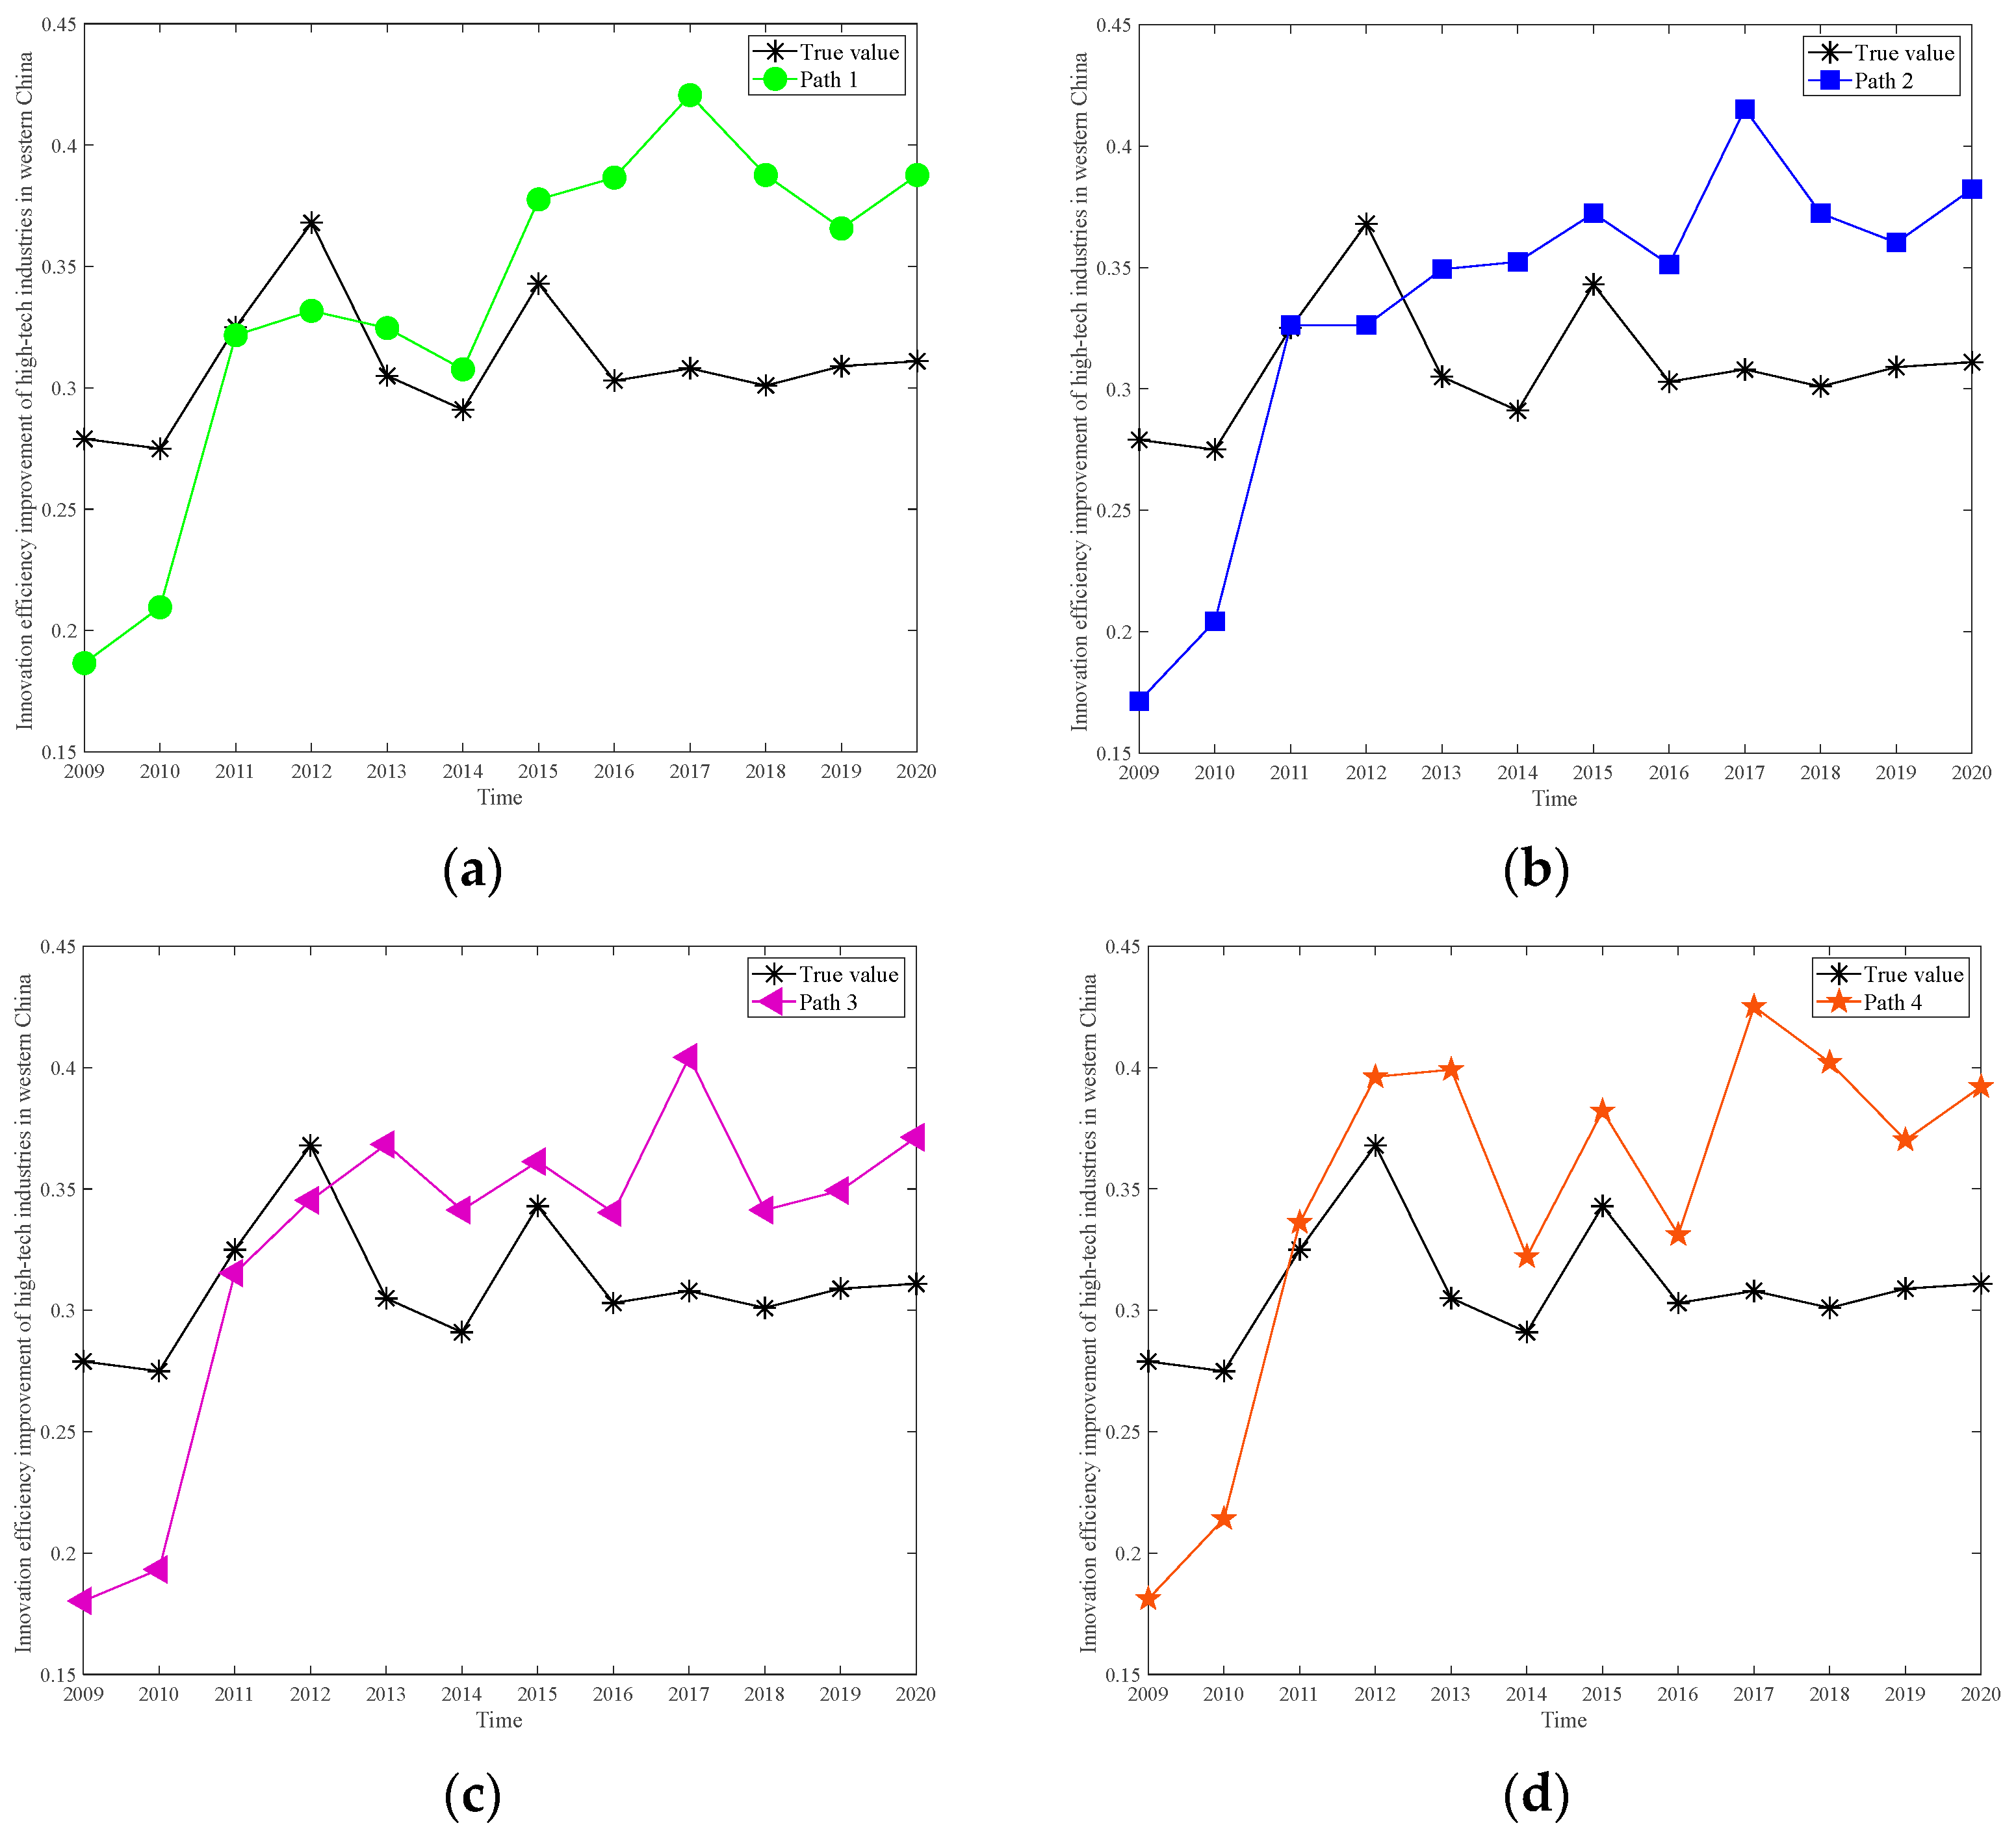
Regional heterogeneity makes differences in the optimal paths of innovation efficiency improvement in high-tech industries in Eastern, Central and Western China. The “MNC innovation—economic development—government support” linkage type has the best effect on improving the efficiency of innovation in high-tech industries in Eastern China. The “MNC innovation—government support” linkage type has the best effect on improving the efficiency of innovation in high-tech industries in Central China. The “Economic development” driven type has the best effect on improving the efficiency of innovation in high-tech industries in Western China.

6.2. Recommendations

The innovation management strategies of China’s eastern, central and western regions cannot be generalized. Combined with the region’s own resource conditions and development stage, a corresponding management policy for the improvement of enterprises’ innovation and self-sufficiency should be formulated. This will lead to a coordinated, balanced and stable development of Chinese innovation in the region. Therefore, the following recommendations for regional differentiation management are presented in this study.
(1)
Eastern China has a higher level of economic development, human capital, and intellectual property protection. The government’s financial support for the eastern region is stronger, and the attraction for R&D investment by MNCs is stronger. Therefore, more attention should be paid to absorbing and digesting MNC innovations and enhancing independent innovation capabilities to promote the high-quality development of regional innovation. As economic development and government policies change, the advantages of high openness and robust infrastructure in the eastern region will gradually diminish, and the role of human capital will gradually come to the forefront. Therefore, the eastern region should focus on introducing MNCs with a large proportion of R&D-oriented, high-tech and highly educated workers. More attention should be paid to the cultivation of high-quality talent, the development of corresponding talent introduction strategies, and the reduction of talent consumption costs. In this way, we can attract and retain talent and enhance our human capital edge. Eastern regions should break regional monopolies, cross-regional information exchange on innovation should be strengthened, local attributes of innovation spillover should be reduced, geographical radius of innovation spillover should be increased, and coordinated and balanced development of innovation in China’s regions should be promoted.
(2)
Although Central China is weaker than the eastern region in all aspects, the economy, capital and technology are in the stage of rapid development, which belongs to the state that should focus on improving learning, absorbing and imitating advanced foreign technology. The government should give appropriate policy support and implement favorable policies to attract multinational companies to the central region, so that the central region can get more financial support for research and development, and cultivate and import higher-quality technical talent. The central region should continue to expand the size of the market, tap the market potential and make the trading market system robust. Market information exchange network platforms, innovation achievement transformation platforms and intermediary service agencies should be constructed. High-tech industries in the central region should accelerate the conversion of the innovation model based on “imitation innovation” to the innovation model based on “independent innovation”. Self-competitive advantages should be enhanced and industries with distinctive advantages should be formed. Meanwhile, we should strengthen the docking cooperation with the innovation main body in the eastern and undertake the quality industries transferred from the eastern. The eastern region plays its radiating and leading role and can realize the rapid improvement of innovation efficiency of the high-tech industries in the central region.
(3)
Compared with the eastern and central regions, the western region has a lower level of economic development, an incomplete talent pool, and an imperfect construction of project support facilities and the innovation policy system. Meanwhile, the western region is opening up to the outside world later and in a slower process. Therefore, the western region belongs to the phase of improving the innovation environment and enhancing the technological learning capability of high-tech industries. The western region should strengthen hard environmental conditions and improve the environment for investment in research and development as soon as possible. The construction of transport and its communication infrastructure should be accelerated. Regional aviation networks should be constructed, and telecommunications and information networks should be improved between the western and central regions and abroad. This way, we can build convenient platforms for research, production and operations needed by enterprises. The learning and absorption capacity of the western region should be enhanced. Governments at all levels should continue to invest more in education and the introduction of talent, and advocate for senior talent and university students to go to the western, the grassroots and places that are struggling in terms of development commitment and progress. Local enterprises should actively organize training and conduct regular exchange seminars with MNCs and high-tech industrial enterprises in the central and eastern. This allows local enterprises to learn and summarize new technologies, knowledge and ideas that advanced enterprises have. Resource advantages were translated into new economic development advantages, and efforts were made to enhance their own level of innovation and development capacity.

6.3. Limitations and Prospects

There are still some limitations in this paper. (1) Based on the availability of data, this paper examines the innovation efficiency enhancement path of China’s high-tech industries using provincial data. The research object can be expanded in the future, for example, the research can be carried out from Chinese cities and manufacturing industries, and the research can also be deepened from the perspective of high-tech industry subdivision, which will help to explore the path of technological innovation efficiency improvement more deeply and make the research conclusion more scientific and comprehensive. (2) In this paper, the research sample is divided into three regions in the eastern, central and western parts of China according to the way the China Bureau of Statistics is divided. According to the physical geography and economic development level, China’s regions can also be divided into eight economic geographical regions, including northeast, north, central, southwest, central and south, east, south and northwest. Meanwhile, China has three major economic circles, including the Yangtze River Delta Economic Circle, the Pearl River Delta Economic Circle and the Bohai Sea Economic Circle. Future research can be conducted from the above eight economic geographic regions or three major economic spheres to expand the breadth and depth of research.

Author Contributions

Conceptualization, Y.K. and H.C.; methodology, Y.K.; software, K.L.; formal analysis, Y.K.; investigation, H.X.; resources, K.L.; data curation, Y.K.; writing—original draft preparation, Y.K.; writing—review and editing, Y.K. and K.L.; visualization, K.L. and H.X.; supervision, H.C. and Y.Z.; project administration, H.C. and Y.Z.; funding acquisition, H.C. All authors have read and agreed to the published version of the manuscript.

Funding

This research was funded by Natural Science Foundation of Shandong Province (ZR2022MG079, ZR2021MG018), Key Research and Development Program (Soft Science Project) of Shandong Province (2022RZA06022).

Data Availability Statement

All data that support the findings of this study are available from the corresponding author upon reasonable request.

Conflicts of Interest

The authors declare no conflict of interest.

References

  1. He, P.X.; Pei, Y.N.; Lin, C.P.; Ye, D. Ambidextrous marketing capabilities, exploratory and exploitative market-Based innovation, and innovation performance: An empirical study on China’s manufacturing sector. Sustainability 2021, 13, 1146. [Google Scholar] [CrossRef]
  2. Dong, T.; Yin, S.; Zhang, N. New energy-driven construction industry: Digital green innovation investment project selection of photovoltaic building materials enterprises using an integrated fuzzy decision approach. Systems 2023, 11, 11. [Google Scholar] [CrossRef]
  3. He, L.; Jiang, M.H. How does philanthropy influence innovation management systems? A moderated mediation model with a social exchange perspective. Systems 2022, 10, 206. [Google Scholar] [CrossRef]
  4. Zhang, X.F.; Xiao, Y.; Wang, L. Can the sci-tech innovation increase the China’s green brands value?-Evidence from Threshold Effect and Spatial Dubin Model. Entropy 2023, 25, 290. [Google Scholar] [CrossRef] [PubMed]
  5. Yang, W.D.; Wang, J.Z.; Wang, R. Research and application of a novel hybrid model based on data selection and artificial intelligence algorithm for short term load forecasting. Entropy 2017, 19, 52. [Google Scholar] [CrossRef]
  6. Xu, K.; Bossink, B.; Chen, Q. Efficiency evaluation of regional sustainable innovation in China: A Slack-Based Measure (SBM) model with undesirable outputs. Sustainability 2020, 12, 31. [Google Scholar] [CrossRef]
  7. Chen, W.; Pan, L.Y.; Lin, C.R.; Zhao, M.Q.; Li, T.; Wei, X. Efficiency evaluation of green technology innovation of China’s industrial enterprises based on SBM model and EBM mode. Math. Probl. Eng. 2021, 2021, 6653474. [Google Scholar] [CrossRef]
  8. Peng, Y.F.; Fan, Y.Y.; Liang, Y. A green technological innovation efficiency evaluation of technology-based SMEs based on the undesirable SBM and the Malmquist index: A case of Hebei Province in China. Sustainability 2021, 13, 11079. [Google Scholar] [CrossRef]
  9. Qiao, S.; Shen, T.; Zhang, R.R.; Chen, H.H. The impact of various factor market distortions and innovation efficiencies on profit sustainable growth: From the view of China’s renewable energy industry. Energy Strategy Rev. 2021, 38, 100746. [Google Scholar] [CrossRef]
  10. Chen, X.H.; Tee, K.; Chang, V.C. Accelerating innovation efficiency through agile leadership: The CEO network effects in China. Technol. Forecast. Soc. 2022, 179, 121602. [Google Scholar] [CrossRef]
  11. Lanfranchi, D.; Grassi, L. Translating technological innovation into efficiency: The case of US public P&C insurance companies. Eurasian. Bus. Rev. 2021, 11, 565–585. [Google Scholar] [CrossRef]
  12. Zou, L.; Cao, X.Z.; Zhu, Y.W. Research on regional high-tech innovation efficiency and influence factors: Evidence from Yangtze River Economic Belt in China. Complexity 2021, 2021, 9946098. [Google Scholar] [CrossRef]
  13. Huang, J.; Tian, Y.; Khanal, R.; Wen, F.G.; Deng, C.H. Evaluation and prediction of high-quality development in China: A time-spatial analysis from Hubei province. Front. Environ. Sci. 2022, 10, 987188. [Google Scholar] [CrossRef]
  14. Xi, X.; Xi, B.X.; Miao, C.L.; Yu, R.J.; Xie, J.; Xiang, R.; Hu, F. Factors influencing technological innovation efficiency in the Chinese video game industry: Applying the meta-frontier approach. Technol. Forecast. Soc. 2022, 178, 121574. [Google Scholar] [CrossRef]
  15. Chen, H.X.; Lin, H.; Zou, W.J. Research on the regional differences and influencing factors of the innovation efficiency of China’s high-tech industries: Based on a shared inputs two-stage network DEA. Sustainability 2020, 12, 3284. [Google Scholar] [CrossRef]
  16. Lu, C.W.; Chen, M.; Tian, G.X. Spatial-temporal evolution and influencing factors of urban green innovation efficiency in China. J. Environ. Public Health 2022, 2022, 4047572. [Google Scholar] [CrossRef]
  17. Wang, K.L.; Zhang, F.Q.; Xu, R.Y.; Miao, Z.; Cheng, Y.H.; Sun, H.P. Spatiotemporal pattern evolution and influencing factors of green innovation efficiency: A China’s city level analysis. Ecol. Indic. 2023, 146, 109901. [Google Scholar] [CrossRef]
  18. Tang, T.Y.; Zhang, S.L.; Peng, J.P. The value of marketing innovation: Market-driven versus market-driving. J. Bus. Res. 2021, 126, 88–98. [Google Scholar] [CrossRef]
  19. Shen, Y.; Yang, X.X. Study on the impact of breakthrough and incremental innovation on firm capacity utilization. Sustainability 2022, 14, 14837. [Google Scholar] [CrossRef]
  20. Diebolt, C.; Hippe, R. The long-run impact of human capital on innovation and economic development in the regions of Europe. Appl. Econ. 2019, 51, 542–563. [Google Scholar] [CrossRef]
  21. Love, J.H.; Roper, S. Location and network effects on innovation success: Evidence for UK, German and Irish manufacturing plants. Res. Policy 2001, 30, 643–661. [Google Scholar] [CrossRef]
  22. Tang, M.J.; Wang, X.X.; Niu, W.Y.; Fu, J.M.; Zhu, M.R. How financial development scale and R&D influence regional innovation efficiency: Empirical evidence from the financial industry. Environ. Sci. Pollut. Res. 2021, 1–14. [Google Scholar] [CrossRef]
  23. Howell, A. Picking ‘winners’ in China: Do subsidies matter for indigenous innovation and firm productivity? China. Econ. Rev. 2017, 44, 154–165. [Google Scholar] [CrossRef]
  24. Lee, S.Y.; Chung, G. A study on the overlap and the cooperation of government-funded research institutes with quantitative approach. J. Korea Technol. Innov. Soc. 2020, 22, 526–547. [Google Scholar] [CrossRef]
  25. Huergo, E.; Moreno, L. Subsidies or loans? Evaluating the impact of R&D support programmes. Res. Policy 2017, 46, 1198–1214. [Google Scholar] [CrossRef]
  26. Zhang, W.M.; Ma, W.R.; Chen, Q.W. Does regional development policy promote industrial structure upgrading? Evidence from the Yangtze River Delta in China. Sustainability 2022, 14, 8127. [Google Scholar] [CrossRef]
  27. Hatipoglu, O. The relationship between inequality and innovative activity: A Schumpeterian theory and evidence from cross-country data. Scott. J. Political Econ. 2012, 59, 224–248. [Google Scholar] [CrossRef]
  28. Su, Y.; Fan, Q.M. Renewable energy technology innovation, industrial structure upgrading and green development from the perspective of China’s provinces. Technol. Forecast. Soc. 2022, 180, 121727. [Google Scholar] [CrossRef]
  29. Gupta, N.; Yuan, K. On the growth effect of stock market liberalizations. Technol. Forecast. Soc. 2009, 22, 4715–4752. [Google Scholar] [CrossRef]
  30. Brockman, P.; Khurana, I.K.; Zhong, R. Societal trust and open innovation. Res. Policy 2018, 47, 2048–2065. [Google Scholar] [CrossRef]
  31. Gangopadhyay, K.; Mondal, D. Does stronger protection of intellectual property stimulate innovation? Econ. Lett. 2012, 116, 80–82. [Google Scholar] [CrossRef]
  32. Chu, S.; Gao, C.C. Intellectual property protection and creative enterprises? investment efficiency: Alleviating financing constraints or inhibiting agency problem? Asia-Pac. J. Account. Econ. 2019, 26, 747–766. [Google Scholar] [CrossRef]
  33. Zhang, R.; Fu, Y.H. Technological progress effects on energy efficiency from the perspective of technological innovation and technology introduction: An empirical study of Guangdong, China. Energy. Rep. 2022, 8, 425–437. [Google Scholar] [CrossRef]
  34. Luo, Y.S.; Lu, Z.N.; Salman, M.; Song, S.F. Impacts of heterogenous technological innovations on green productivity: An empirical study from 261 cities in China. J. Clean. Prod. 2022, 334, 130241. [Google Scholar] [CrossRef]
  35. Zhang, Y.H.; Wang, Y.; Liu, Q.X. Grey game research about customer preference, international competition and the choice of industrial type. Grey Syst. Theory Appl. 2018, 8, 122–132. [Google Scholar] [CrossRef]
  36. Fiss, P.C. A Set-Theoretic Approach to organizational configurations. Acad. Manag. Rev. 2007, 32, 1180–1198. [Google Scholar] [CrossRef]
  37. Yang, W.D.; Wang, J.Z.; Niu, T.; Du, P. A hybrid forecasting system based on a dual decomposition strategy and multi-objective optimization for electricity price forecasting. Appl. Energy 2019, 235, 1205–1225. [Google Scholar] [CrossRef]
  38. Liu, J.P.; Shao, L.L.; Jin, F.F.; Tao, Z.F. A multi-attribute group decision-making method based on trust relationship and DEA regret cross-efficiency. IEEE Trans. Eng. Manag. 2022, 1–13. [Google Scholar] [CrossRef]
  39. Zhai, D.X.; Zhao, X.F.; Bai, Y.F.; Wu, D.L. Effective evaluation of green and high-quality development capabilities of enterprises using machine learning combined with genetic algorithm optimization. Systems 2022, 10, 128. [Google Scholar] [CrossRef]
  40. Sheng, X.J.; Lan, K.; Jiang, X.L.; Yang, J. Adaptive curriculum sequencing and education management system via Group-Theoretic Particle Swarm Optimization. Systems 2023, 11, 34. [Google Scholar] [CrossRef]
  41. Huang, W.Y.; Liu, Y.J.; Zhang, X.Z. Hybrid Particle Swarm Optimization Algorithm based on the Theory of Reinforcement Learning in psychology. Systems 2023, 11, 83. [Google Scholar] [CrossRef]
  42. Zheng, Y.; Fu, H.; Li, R.M.; Hsung, T.C.; Song, Z.X.; Wen, D.S. Deep neural network oriented evolutionary parametric eye modeling. Pattern Recognit. 2021, 113, 107755. [Google Scholar] [CrossRef]
  43. Fu, H.; Chi, Z.; Feng, D. Recognition of attentive objects with a concept association network for image annotation. Pattern Recognit. 2010, 43, 3539–3547. [Google Scholar] [CrossRef]
  44. Hu, Y.; Li, J.; Hong, M.; Ren, J.Z.; Lin, R.J.; Liu, Y.; Liu, M.R.; Man, Y. Short term electric load forecasting model and TCI verification for process industrial enterprises based on hybrid GA-PSO-BPNN algorithm—A case study of papermaking process. Energy 2019, 170, 1215–1227. [Google Scholar] [CrossRef]
  45. Greckhamer, T. CEO compensation in relation to worker compensation across countries: The configurational impact of country-level institutions. Strateg. Manag. J. 2016, 37, 793–815. [Google Scholar] [CrossRef]
  46. Park, Y.; Fiss, P.C.; El Sawy, O.A. Theorizing the multiplicity of digital phenomena: The ecology of configurations, causal recipes, and guidelines for applying QCA. MIS Q. 2020, 44, 1493–1520. [Google Scholar] [CrossRef]
  47. Park, J.H. Open innovation of small and medium-sized enterprises and innovation efficiency. Asian J. Technol. Innov. 2018, 26, 115–145. [Google Scholar] [CrossRef]
  48. Bogler, R.; Somech, A. Psychological capital, team resources and organizational citizenship behavior. J. Psychol. 2019, 153, 784–802. [Google Scholar] [CrossRef]
  49. Yu, H.C.; Zhang, J.Q.; Zhang, M.Q.; Fan, F. Cross-national knowledge transfer, absorptive capacity, and total factor productivity: The intermediary effect test of international technology spillover. Technol. Anal. Strateg. Manag. 2021, 34, 625–640. [Google Scholar] [CrossRef]
  50. Zhu, H.G.; Chen, Z.H.; Zhang, S.P.; Zhao, W.C. The role of government innovation support in the process of urban green sustainable development: A spatial difference-in-difference analysis based on China’s innovative city pilot policy. Int. J. Environ. Res. Public Health 2022, 19, 7860. [Google Scholar] [CrossRef]
  51. Zhang, Q.; Shen, J.Q.; Sun, F.H. Spatiotemporal differentiation of coupling coordination degree between economic development and water environment and its influencing factors using GWR in China’s province. Ecol. Model. 2021, 462, 109794. [Google Scholar] [CrossRef]
  52. Wang, J.Z.; Gao, Y.Y. An integrated forecasting system based on knee-based multi-objective optimization for solar radiation interval forecasting. Expert Syst. Appl. 2022, 198, 116934. [Google Scholar] [CrossRef]
  53. Li, Q.; Yu, J.Y. Place-based policies and regional innovation: Evidence from western development in China. Appl. Econ. 2022, 55, 999–1022. [Google Scholar] [CrossRef]
  54. Liu, J.P.; Fang, M.D.; Jin, F.F.; Wu, C.S.; Chen, H.Y. Multi-attribute decision making based on stochastic DEA cross-efficiency with ordinal variable and its application to evaluation of banks’ sustainable development. Sustainability 2020, 12, 2375. [Google Scholar] [CrossRef]
Figure 1. Factor linkage research framework of technological innovation efficiency.
Systems 11 00233 g001
Figure 2. Topology of BP neural network.
Systems 11 00233 g002
Figure 3. The flow chart of GA-PSO-BP neural network algorithm.
Systems 11 00233 g003
Figure 4. Path forecast of innovation efficiency improvement of high-tech industries in Eastern China, 2009–2020: (a) Path 1; (b) Path 2; (c) Path 3; and (d) Path 4.
Systems 11 00233 g004
Figure 5. Path forecast of innovation efficiency improvement of high-tech industries in central China, 2009–2020: (a) Path 1; (b) Path 2; (c) Path 3; and (d) Path 4.
Systems 11 00233 g005
Figure 6. Path forecast of innovation efficiency improvement of high-tech industries in Western China, 2009–2020: (a) Path 1; (b) Path 2; (c) Path 3; and (d) Path 4.
Systems 11 00233 g006
Table 1. Current research on the efficiency of technological innovation.
Measurement Methods
AuthorMethodologyMain Contribution
Xu et al. (2020) [6]DEA-SBM modelmeasures the efficiency of sustainable development in the east, central and western regions of China
Chen et al. (2021) [7]SBM modelevaluates and analyzes the efficiency of green technology innovation in Chinese industrial enterprises
Peng et al. (2021) [8]SBM model and Malmquist indexcompares and analyzes the technological innovation efficiency of technology-based SMEs in Hebei Province
Qiao et al. (2021) [9]SFA modelmeasures the technological innovation efficiency of Chinese listed technology companies
Chen et al. (2022) [10]SFA modelanalyzes panel data on renewable energy firms in China
Lanfranchi et al. (2021) [11]DEA and SFA modelsmeasures the efficiency of technological innovation in U.S. insurance companies
Impact factors
AuthorMethodologyMain contribution
Zou et al. (2021) [12]Super-efficient SBM model and panel regression modelStrengthens international cooperation and increasing financial support. Can contribute to the innovation efficiency of high-technology enterprises
Huang et al. (2022) [13]Comprehensive entropy method and BP neural networkThe level of economic development and the degree of openness to the outside world will have different degrees of impact on the efficiency of technological innovation
Xi et al. (2022) [14]Meta-frontier approach and econometric modelThe level of economic development and government subsidy support are important factors to promote the efficiency of technological innovation in the video game industry
Chen et al. (2020) [15]DEA model and spatial econometric modelGovernment support, R&D investment intensity and economic development have different degrees of influence on innovation efficiency in China’s high-tech industries
Lu et al. (2022) [16]Spatial econometric modelForeign direct investment and industrial structure can affect the efficiency of green technology innovation
Wang et al. (2023) [17]Panel regression modelOpenness and intellectual property protection can have a significant impact on the efficiency of green technology innovation
Table 2. Calibration anchor points for each variable.
VariablesAnchor Points
Fully AffiliatedIntermediateCompletely Unaffiliated
Outcome variablesInnovation efficiency 0.7710.5460.162
Conditional variablesMNC innovation0.7230.4380.289
Economic development0.5610.2040.153
Government support0.3860.2470.112
Human capital0.3280.2190.128
Industrial structure0.6240.4580.404
Openness0.4500.1230.005
Intellectual property protection0.7570.5790.231
Table 3. Results of the necessity test for a single condition variable.
Conditional VariablesConsistencyCoverage
MNC innovation0.5730.587
~MNC innovation0.7080.638
Economic development0.6870.675
~Economic development0.5720.535
Government support0.6030.644
~Government support0.6370.553
Human capital0.6670.667
~Human capital0.6060.558
Industrial structure0.7680.805
~Industrial structure0.5560.491
Openness0.6380.632
~Openness0.6030.559
Intellectual property protection0.6290.566
~Intellectual property protection0.6450.662
Table 4. Result of condition configuration.
Conditional VariablesConfiguration
Path 1Path 2Path 3Path 4
MNC innovationSystems 11 00233 i001Systems 11 00233 i001Systems 11 00233 i003Systems 11 00233 i002
Economic developmentSystems 11 00233 i001Systems 11 00233 i002Systems 11 00233 i001Systems 11 00233 i001
Government supportSystems 11 00233 i001Systems 11 00233 i001Systems 11 00233 i001Systems 11 00233 i002
Human capitalSystems 11 00233 i002Systems 11 00233 i002Systems 11 00233 i003Systems 11 00233 i002
Industrial structureSystems 11 00233 i003 Systems 11 00233 i003Systems 11 00233 i004
Openness Systems 11 00233 i002Systems 11 00233 i004Systems 11 00233 i003
Intellectual property protectionSystems 11 00233 i002 Systems 11 00233 i003
Consistency0.8440.8400.8390.894
Original coverage0.2930.3200.4010.196
Unique coverage0.0470.0500.2640.011
Consistency of the overall solution0.852
Coverage of the overall solution0.785
Note: Systems 11 00233 i001 means the core condition exists, Systems 11 00233 i002 means the edge condition exists, Systems 11 00233 i004 means the core condition is missing, Systems 11 00233 i003 means the edge condition is missing, and blank means the condition variable can exist or be missing.
Table 5. Test for robustness.
Conditional VariablesConfiguration
Configuration 1Configuration 2Configuration 3
MNC innovationSystems 11 00233 i001Systems 11 00233 i003Systems 11 00233 i001
Economic developmentSystems 11 00233 i001Systems 11 00233 i001Systems 11 00233 i002
Government supportSystems 11 00233 i001Systems 11 00233 i001Systems 11 00233 i001
Human capitalSystems 11 00233 i002Systems 11 00233 i003Systems 11 00233 i002
Industrial structureSystems 11 00233 i004Systems 11 00233 i003Systems 11 00233 i003
Openness Systems 11 00233 i004Systems 11 00233 i002
Intellectual property protectionSystems 11 00233 i002 Systems 11 00233 i003
Consistency0.8400.8390.894
Original coverage0.3200.4010.196
Unique coverage0.1400.2650.011
Consistency of the overall solution0.805
Coverage of the overall solution0.834
Note: Systems 11 00233 i001 means the core condition exists, Systems 11 00233 i002 means the edge condition exists, Systems 11 00233 i004 means the core condition is missing, Systems 11 00233 i003 means the edge condition is missing, and blank means the condition variable can exist or be missing.
Table 6. Direction of action of conditional variables on outcome variables.
EDGSHCMNCISOPIPP
IE0.0080.6620.0240.231−0.4170.3640.153
Table 7. Path predicted values of innovation efficiency improvement of high-tech industries in Eastern China.
PathPredicted Mean ValueDifference Value
Path 10.7650.056
Path 20.7390.030
Path 30.7430.034
Path 40.7530.044
Table 8. Path predicted values of innovation efficiency improvement of high-tech industries in central China.
PathPredicted Mean ValueDifference Value
Path 10.5860.049
Path 20.5950.058
Path 30.5810.044
Path 40.5840.047
Table 9. Path predicted values of innovation efficiency improvement of high-tech industries in Western China.
PathPredicted Mean ValueDifference Value
Path 10.3340.025
Path 20.3320.023
Path 30.3260.017
Path 40.3460.037
Disclaimer/Publisher’s Note: The statements, opinions and data contained in all publications are solely those of the individual author(s) and contributor(s) and not of MDPI and/or the editor(s). MDPI and/or the editor(s) disclaim responsibility for any injury to people or property resulting from any ideas, methods, instructions or products referred to in the content.

