Highlights
What are the main findings?
- A mechanistic equivalent chip-evacuation force model enables fast groove evaluation.
- GA-optimized BP surrogate replaces FE runs to predict strain-based stiffness response.
- NSGA-II and entropy-TOPSIS pick a balanced design; drilling tests confirm benefits.
What are the implications of the main findings?
- Hybrid physics + surrogate modeling cuts computation while keeping decision consistency.
- Provides an interpretable trade-off path between chip evacuation and drill stiffness.
- Workflow is transferable to deep-hole tool geometry optimization with coupled targets.
Abstract
To address the poor cutting stability and deterioration of hole quality caused by the inherent trade-off between chip evacuation performance and drill-body stiffness in U-drilling, a multi-objective optimization framework was established. The design variables were the core thicknesses and of the inner and outer chip flutes, the inner and outer offset angles and , and the inner and outer helix angles and . The objectives were to maximize the chip evacuation force and minimize the drill-body strain (which serves as an equivalent indicator of maximizing drill-body stiffness). The chip evacuation force was rapidly evaluated using a mechanistic chip evacuation force model derived from mechanism-based analysis. The drill-body strain was efficiently predicted using a GA–BP neural-network surrogate model. An NSGA-II algorithm combined with the entropy-weighted TOPSIS method was employed to solve the optimization problem, yielding the optimal parameter combination for the U-drill chip-flute geometry. The results show that drilling experiments on 42CrMo under the optimal structural parameter combination reduced the cutting forces in the , , and directions by approximately 11.2%, 13.1%, and 11.8%, respectively. The root-mean-square acceleration in the and -directions decreased by about 17.3% and 22.9%, respectively. These improvements effectively enhanced the hole-wall surface roughness and hole diameter accuracy, and further improved chip evacuation smoothness and cutting stability of the U-drill.
1. Introduction
Manufacturing is rapidly evolving toward high-end, green, and intelligent development, and research on concepts and methods related to industrial sustainability continues to deepen [1]. Stavropoulos et al. [2] reviewed the role of artificial intelligence in advancing the digitalization of machining processes, highlighting AI-enabled modeling, monitoring, and optimization in manufacturing. Hole making is one of the key operations in machining and is widely used in industries such as aerospace and automotive manufacturing; its productivity and hole quality directly affect component assembly and in-service performance [3]. With the increasing application of difficult-to-machine materials, drilling processes impose much higher requirements on machining stability, thereby making the optimization of both process parameters and tool structures more critical [4].
Indexable insert drills (commonly referred to as U-drills in engineering practice) have been widely adopted in hole making because of their replaceable inserts and their capability for internal coolant supply. During drilling, the mechanical behavior of chip evacuation and the associated evacuation resistance can significantly affect chip removal stability and increase the risk of chip clogging, which in turn influences cutting loads and hole quality. Consequently, tool-structure optimization aimed at improving chip evacuation capability and process stability in hole drilling has become an important pathway for enhancing hole machining quality. Rupasinghe et al. [5] combined numerical simulations and experiments to evaluate chip evacuation and lubricant flow using optimized drill heads, demonstrating that drill-structure optimization can improve evacuation-related behavior and drilling stability.
In hole drilling, poor chip evacuation causes the chip evacuation force to increase markedly with hole depth, which is a primary contributor to the rise in drilling force and torque, and further aggravates hole-wall quality deterioration and the risk of drill breakage. Biermann et al. [6] pointed out that insufficient chip removal and inadequate cooling are among the key bottlenecks affecting the stability of cutting processes. To clarify the mechanical response during chip evacuation, many studies have focused on modeling and validation of the chip evacuation force. Mellinger et al. [7] developed a model to predict the forces and torque induced by chip evacuation and used it to evaluate chip-clogging tendencies. Han et al. [8] proposed a chip evacuation force model for deep-hole twist drilling, and experiments demonstrated that the model can effectively capture the pronounced increase in chip evacuation force with increasing hole depth. Shamoto et al. [9] further derived an equation describing the growth of chip evacuation pressure, and experiments confirmed that chip clogging can lead to a rapid increase in thrust force. These studies indicate that the chip evacuation force, as an additional load, directly couples into the drilling mechanical system and is an important trigger for process instability. Therefore, controlling and reducing the chip evacuation force is one of the key measures for improving the reliability of hole drilling.
Moreover, the evacuation process not only affects quasi-static load levels but may also cause abrupt load changes through variations in clogging and frictional conditions, and it can further couple with dynamic responses and hole-quality evolution. Consequently, beyond geometric optimization and data-driven tool design, related studies have also been extended toward evacuation-load characterization, stability analysis, and simulation–experiment verification, providing a basis for developing engineering-oriented and interpretable design frameworks.
Regarding evacuation-load mechanisms and controllable factors, Niketh et al. [10] introduced micro-textures on drill tools and experimentally showed that surface texturing can reduce chip-evacuation-related load indicators (e.g., thrust/torque) and mitigate burr formation in high-aspect-ratio drilling. Pereira et al. [11] analyzed chip formation during drilling of Al–Mg–Si 6061-T6 using HSS drills with and without DLC coatings and clarified how tool/coating conditions affect chip morphology and chip compression behavior relevant to evacuation. Chu et al. [12] proposed a drilling-torque modeling approach by decomposing the torque into cutting torque, chip-evacuation torque, and stick–slip torque, thereby providing a structured description of evacuation-related torque growth with drilling depth. Parsian et al. [13] developed a time-domain simulation routine for indexable drills to predict torsional and axial chatter vibrations while accounting for asymmetric drill geometry and loading. Akdulum et al. [14] performed drilling experiments with indexable insert drills and optimized process stability through multi-response evaluation using thrust force, torque, spindle load, and acoustic signals. Lian et al. [15] investigated the full process from entry drilling to steady-state cutting for indexable insert drills and related force evolution and structural features to vibration and machining-quality issues. Etxebeste et al. [16] presented an efficient 3D finite element model for indexable insert drilling and validated predictions of thrust force, torque, thermomechanical loads, and chip morphology to support simulation-driven design verification.
In summary, existing studies have provided important foundations in evacuation-load/torque characterization, dynamic stability analysis for indexable drilling, and simulation–experiment verification methodologies. However, studies that unify “dual-flute geometric parameters–evacuation-load objectives–drill-body stiffness/stability and hole-quality metrics” within a single framework for joint modeling, multi-objective optimization, and closed-loop experimental validation remain limited, which constitutes the main motivation of this work.
One of the keys to achieving effective chip evacuation lies in the design of the drill’s chip-flute geometry. The flute geometry not only determines the available chip space and transport conditions, but also governs the load-carrying capacity and stiffness of the drill body. Liang et al. [17] reported that both the web thickness ratio and the flute width influence the stiffness and strength of the tool body as well as the chip-storage capacity: increasing the web thickness ratio and reducing the flute width can improve stiffness and strength, but will reduce chip space and consequently increase cutting forces and temperature rise. Related structural modification studies also reflect this coupling and trade-off. Guo et al. [18] showed that variable helix (and variable pitch) designs can enhance process stability; however, inappropriate parameter selection may also deteriorate stability. Therefore, the structural design of U-drill chip flutes constitutes a multi-objective problem that requires balancing chip evacuation performance and drill-body stiffness, and empirical adjustments driven by a single indicator are unlikely to yield a comprehensive and generalizable optimal solution.
For multi-objective optimization, NSGA-II proposed by Deb et al. [19] is capable of generating a diverse Pareto solution set. However, engineering implementation still requires selecting a final scheme from the obtained set; therefore, a comprehensive evaluation and selection of candidate solutions is necessary. Zhou et al. [20] investigated parameter optimization for coating-related machining, established a multi-objective optimization model, and employed NSGA-II to obtain a Pareto solution set to guide parameter selection. Behzadian et al. [21] noted that TOPSIS is often integrated with other methods for complex engineering evaluation and can be used as a decision-making tool for selecting among Pareto-optimal solutions. Shu et al. [22] combined a response surface model with NSGA-II for multi-objective optimization of process parameters; after obtaining the Pareto set, they further determined preferred parameters and experimentally verified the overall performance improvement. In comprehensive evaluation, weight determination directly affects the ranking results. Shannon’s information entropy concept [23] can characterize the information contribution of each indicator according to the dispersion of the data. Chen [24] pointed out that entropy weighting strengthens the influence of indicators with higher dispersion in decision-making, and Chen [25] further showed that the normalization method can significantly affect entropy-weight-based TOPSIS ranking results. On the other hand, if large-scale iterations rely directly on high-fidelity simulations and experiments, the optimization cost will increase substantially. Pfrommer et al. [26] indicated that surrogate models can reduce expensive simulation calls and improve optimization efficiency, and Xie et al. [27] verified the feasibility of a coupled GA and BP neural-network surrogate model for modeling complex nonlinear mappings.
To address the coupled trade-off between chip evacuation performance and drill-body stiffness in U-drilling, this study develops a surrogate-assisted multi-objective optimization framework for the dual-flute chip-groove geometry by integrating a GA-initialized BP surrogate model with the NSGA-II algorithm. The design variables include the core thicknesses and of the inner and outer chip flutes, the offset angles and , and the helix angles and . Although surrogate-assisted evolutionary multi-objective optimization coupled with decision-making techniques has been widely used for parameter design, existing studies on dual-groove U-drills still exhibit two notable limitations. First, a mechanism-oriented and interpretable objective formulation that explicitly quantifies the relationship between dual-groove geometry and chip-evacuation load/resistance remains insufficient. Second, for the geometry selected from the Pareto set, closed-loop experimental validation in terms of cutting force, vibration, and hole quality is still limited. Therefore, the novelty of this work lies in establishing a mechanism-based objective formulation for dual-flute chip evacuation and integrating it into a surrogate-assisted multi-objective design workflow with experimental verification.
Accordingly, the main contributions of this work are summarized as follows:
- (1)
- An analytical chip-evacuation-force model is established to rapidly evaluate the chip-evacuation indicator(s), thereby enabling an explicit and interpretable linkage between chip-evacuation loads and chip-groove geometric parameters;
- (2)
- A GA-optimized BP neural-network surrogate model is developed using finite-element simulation samples to efficiently predict the drill-body strain response (as a stiffness-related index), which reduces the evaluation cost during iterative optimization;
- (3)
- Considering the inherent asymmetry of the dual-groove configuration, the chip-evacuation forces associated with the inner and outer grooves are formulated as independent objectives and jointly optimized with the stiffness objective, avoiding an over-simplified representation of chip evacuation by a single aggregated metric;
- (4)
- NSGA-II is employed to obtain the Pareto-optimal set, and an entropy-weighted TOPSIS scheme is adopted to identify a compromise solution. The selected geometry is subsequently validated through comparative drilling experiments in terms of cutting force, vibration, and hole quality, thereby establishing a closed-loop research framework encompassing mechanism modeling, surrogate prediction, multi-objective search, decision-making, and experimental verification.
2. Construction of a U-Drill Performance Target Model
To meet the requirements of multi-objective optimization for chip-flute structural parameters, this study establishes evaluation metrics and fast computational models for both chip evacuation performance and drill-body stiffness, forming a unified performance evaluation basis that can be embedded into the iterative optimization process. Because the effects of flute geometric parameters on the chip evacuation process and the stiffness response exhibit strong nonlinearity and tight coupling, it is difficult to derive an explicit analytical mapping suitable for iterative solving. Meanwhile, directly invoking finite element analysis repeatedly during optimization would result in prohibitively high computational cost and reduced evaluation efficiency. Accordingly, chip evacuation performance is rapidly assessed using a mechanistic chip-evacuation-force model developed through mechanism-based analysis. The stiffness objective is efficiently predicted and consistently evaluated using a GA–BP surrogate model trained on finite-element sample data, thereby providing efficient and robust objective-function computation and evaluation support for the subsequent multi-objective optimization.
2.1. Construction of the U-Drill Chip Evacuation Performance Model
During U-drilling, chips must continuously travel upward along the chip flutes and be discharged from the hole. If chip motion is impeded, chips may accumulate and become compacted, leading to chip clogging, which can further cause fluctuations in cutting forces, excessive heat generation, and even process instability. Mechanistically, the occurrence of chip clogging is governed by two key factors: (i) the compatibility between the available chip space and the chip morphology, and (ii) whether the chip-evacuation driving force generated during chip transport in the flute is sufficient to overcome resistive forces such as friction and gravity. Accordingly, this section first introduces quantitative indices to characterize chip morphology and chip-carrying capacity (the chip accommodation coefficient and the flute accommodation coefficient), and then defines the critical chip traveling speed as the minimum speed required to prevent clogging. On this basis, a force analysis of chip motion within the flute is conducted to establish a chip-evacuation-force model and derive the criterion for stable, clog-free chip evacuation, providing a theoretical foundation for subsequent parameter analysis and structural optimization.
- Chip Accommodation Coefficient
As a quantitative descriptor of chip morphology, the chip accommodation coefficient is defined as the ratio of the chip volume to the initial volume of the removed material :
According to the classification of chip morphologies, short-pitch helical chips and long-pitch helical chips have the most significant influence on chip evacuation performance. Therefore, these two chip types are selected as the objects of study in this work. Their geometric parameters are illustrated in Figure 1. Substituting these parameters into Equation (1) yields the chip accommodation coefficient as:
where is the chip material density (g/cm3); is the diameter of the helical chip (mm); is the length of the helical chip (mm); and is the chip mass (g).
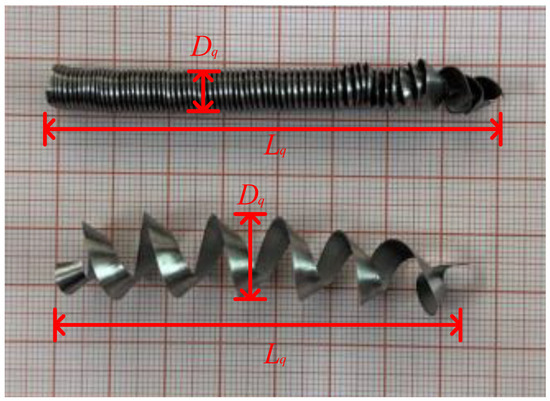
Figure 1.
Structural parameters of the chip.
- 2.
- Flute Accommodation Coefficient
As shown in Figure 2, a Cartesian coordinate system is established with the center of the circular-arc segment of the outer chip flute, , as the origin, and the -axis passing through the drill axis . Point is the intersection between the straight segment of the outer flute and the outer profile of the drill cross-section ; point is the intersection between the straight segment and the circular-arc segment of the outer flute ; point is the intersection between the circular-arc segment and the outer profile ; and point is the intersection between the circular-arc segment and the -axis. The flute cross-sectional area is the sum of , , and .
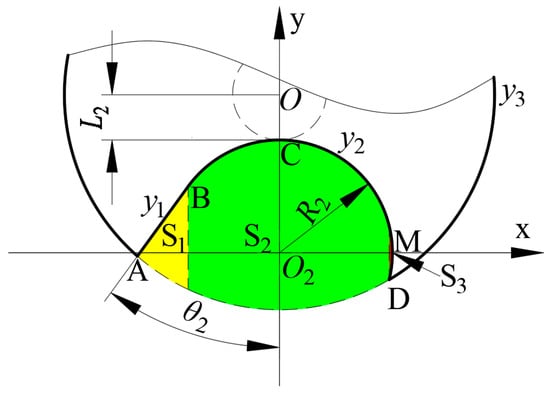
Figure 2.
Cross-sectional area of chip flute.
The original equation of the straight segment of the outer chip flute is given by:
After rotating the flute by the offset angle about the center of the circular-arc segment of the outer chip flute, the equation of the straight segment is obtained as:
The equation of the circular-arc segment of the outer chip flute is given by:
The equation of the outer profile of the drill cross-section, , is given by:
where is the drill body radius (mm).
The cross-sectional area of the chip flute, , is given by:
The cross-sectional area of the drilled hole, , can be calculated using Equation (8):
where is the drilling diameter of the U-drill (mm).
As one of the quantitative indices for evaluating chip evacuation performance, the flute accommodation coefficient is defined as the ratio of the flute cross-sectional area to the cross-sectional area of the drilled hole , i.e.,
- 3.
- Critical Chip Traveling Speed
During drilling, the volume of material converted into chips per unit time, (mm3/s), is given by:
where is the feed speed (mm/s).
Meanwhile, the chip volume generated per unit time is denoted as (mm3/s), and the corresponding chip accommodation coefficient at this moment is . When chips are transported through the flute at a volumetric rate of their axial traveling speed must exceed a critical value to prevent chip clogging. The critical traveling speed can be expressed as follows: as chips pass through the flute at the rate at least a flute length of (mm/s) must be occupied by newly generated chips per unit time, thereby avoiding chip accumulation and blockage. Hence, the critical chip traveling speed represents the minimum speed required to ensure that chips can move smoothly within the flute without mutual compression.
where is the helix angle of the chip flute (°).
Substituting Equations (1), (9) and (10) into Equation (11) yields:
- 4.
- Development of the Chip Evacuation Performance Model
Figure 3 illustrates the force state of a chip moving within the chip flute. As the chip travels upward along the flute, its motion is hindered by the friction force and gravity mg. Meanwhile, during drilling, the U-drill generates a centrifugal force that presses the chip against the hole wall, thereby inducing an additional friction force . This friction force provides the driving component along the flute direction, promoting upward chip transport and ultimately enabling chip evacuation.
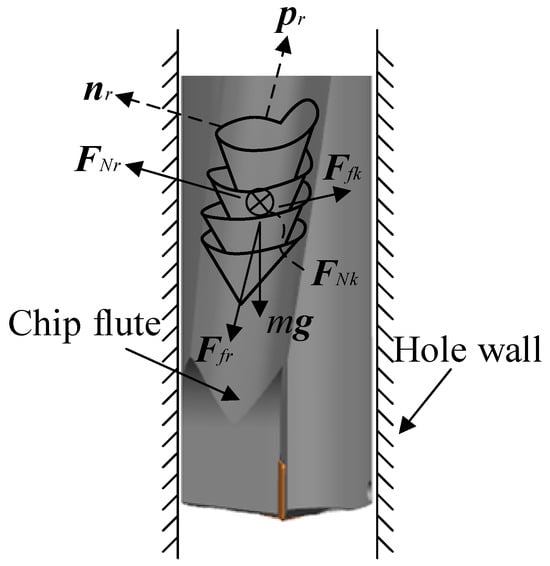
Figure 3.
Free-body diagram of a chip during evacuation.
The resultant force acting on the chip can be calculated using the following equation:
where is the friction force between the chip flute and the chip (N); is the normal force between the chip flute and the chip (N); is the friction force between the hole wall and the chip (N); and is the normal force between the hole wall and the chip (N).
Let be the unit vector parallel to the helical line of the chip flute. Then, the resultant force along the flute helix, , is given by:
The friction forces exerted on the chip by the hole wall and by the chip flute are given by:
where is the coefficient of friction between the chip and the hole wall, and is the coefficient of friction between the chip and the chip flute.
The normal force exerted by the chip flute on the chip is given by:
where is the unit vector normal to (i.e., perpendicular to) the helical line of the chip flute.
Figure 4 illustrates the chip-motion coordinate system, where is aligned with the drill-axis direction, is the chip rotation-radius vector, and is the angular vector of the chip rotating relative to the U-drill. The normal force between the chip and the hole wall, , is induced by the centrifugal force generated by the rotation of the U-drill, and the derivation is given as follows:
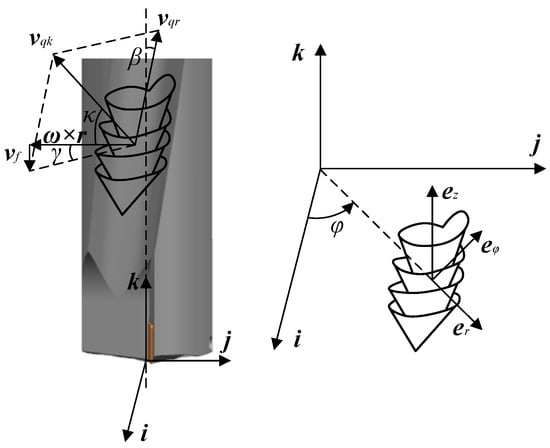
Figure 4.
Chip traveling speed.
The unit vectors and can be expressed as:
The rotational radius of the chip is given by:
The displacement of the chip along the chip flute, , can be expressed as:
where is the chip displacement relative to the U-drill in the -direction, and is the rotational displacement of the chip relative to the U-drill.
In Equation (21), and can be expressed as:
The chip traveling speed relative to the chip flute, , can be obtained by differentiating Equation (21) with respect to time:
In Equation (24), and are given by:
The chip traveling speed relative to the chip flute, , can also be written as:
The chip velocity relative to the hole wall, , is obtained by adding the chip traveling speed relative to the flute, , to the rotational velocity of the drill at the chip’s radial position, , and the feed speed , i.e.,
where is the angular velocity of the U-drill (rad/s).
In Equation (28), and are given by:
Substituting Equations (21) and (28) into Equation (27) yields:
Since:
Based on the time derivative of Equation (31), the acceleration of the chip relative to the workpiece is given by:
When drilling is performed at a constant speed and the chip moves in a stable manner,
Equation (33) can be simplified as:
Therefore, the normal force between the chip and the hole wall, , can be obtained as:
The friction force vector between the chip and the hole wall is given by:
Based on Equations (15), (16), (18), (19), (27), (31), (35) and (37), Equation (14) can be expanded as:
Given the parameters , , , , , , and , Equation (38) indicates that the force provided by the chip flute to drive chip transport, , is a function of the chip traveling speed .
- 5.
- Necessary Conditions for Smooth Chip Evacuation
This study considers that, driven by the friction force , chips are transported along the chip flute and discharged from the bottom of the hole. Chip clogging is attributed to insufficient chip evacuation capability of the U-drill, which causes chips to accumulate and prevents timely removal. In the present model, chip motion is characterized by two velocities that are evaluated separately: (i) the chip traveling speed , i.e., the actual speed of chip transport along the flute; and (ii) the critical chip traveling speed , which is calculated from Equation (12) and represents the minimum speed required to avoid clogging under given flute geometric parameters—equivalently, the minimum conveying speed that the flute must provide for the chips.
During U-drilling, chips are continuously generated. When , chips will not accumulate, and the drilling process can proceed smoothly. It should be noted that the chip-evacuation force acting on the chips does not vary linearly with the flute geometric parameters; instead, it is governed by the chip-evacuation force model in Equation (38). Therefore, to determine the chip-evacuation force under specified inner/outer flute geometrical parameters, it suffices to substitute the critical chip traveling speed (computed from the corresponding flute parameters) into Equation (38).
2.2. Construction of the Objective Model for U-Drill Body Stiffness
2.2.1. Stiffness Evaluation Metric and Sample Design
To enable rapid evaluation of drill-body stiffness during the optimization iterations, the strain response of the drill body obtained from finite element simulations is adopted as a surrogate indicator of stiffness. To cover the design space while maintaining sample representativeness under limited simulation cost, a six-factor, three-level orthogonal experimental design was employed to generate 27 parameter combinations. Finite element simulations were then performed for each combination to obtain the corresponding outputs, forming a dataset of structural parameters versus strain responses (see Table 1).

Table 1.
Orthogonal design matrix and strain response for U-drill body stiffness analysis.
2.2.2. Based on the GA–BP Neural Network Surrogate Model
To rapidly obtain the drill-body stiffness metric during the multi-objective optimization iterations, a surrogate model is developed based on the dataset established in Section 2.1 to map the chip-flute structural parameters to the drill-body strain. The model takes six structural parameters as inputs, the core thicknesses and of the inner and outer chip flutes, the inner and outer offset angles and , and the inner and outer helix angles and . The outputs the drill-body strain response.
- 1.
- BP network architecture and training objective
As shown in Figure 5, the BP neural network adopts a layered architecture consisting of an input layer , a hidden layer with weights and , and an output layer .
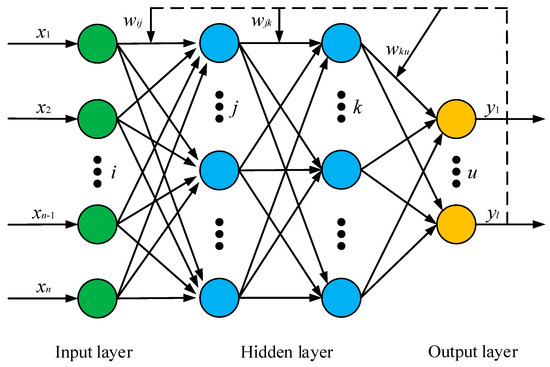
Figure 5.
BP neural network structure.
The neural network used in this study has six neurons in the input layer, corresponding to the six structural parameters, and one neuron in the output layer, corresponding to the predicted strain value. The network learns from the sample data to approximate the nonlinear mapping between the structural parameters and the strain response.
To explicitly define the mathematical form of the surrogate model, let the input be the structural-parameter vector
where the corresponding input-layer nodes are denoted by , and the output is the drill-body strain response . In this study, a backpropagation (BP) neural network with two hidden layers is adopted to construct the nonlinear mapping from the inputs to the output. The number of neurons in the two hidden layers are set to and , respectively. The forward-propagation process can be expressed as:
The output of the -th neuron in the first hidden layer is given by:
The output of the -th neuron in the second hidden layer is given by:
For the regression output layer, the predicted strain is given by
Here, , , and denote the connection weights between adjacent layers, and , , and are the corresponding bias (threshold) terms. is the activation function of the hidden layers. The output layer uses a linear function , and is the predicted value of the model.
To eliminate the influence of differences in physical dimensions and numerical ranges among input variables on network training, Min–Max normalization is applied to both the input variables and the output strain index. The original data are mapped to the interval (set to in this study). The normalization formula is:
where and are the minimum and maximum values of the sample data for the corresponding variable, respectively. After the network outputs the prediction, the result is converted back to the original scale using the corresponding inverse normalization (denormalization) operation.
To improve the model’s capability in approximating complex nonlinear mappings, a BP neural network with two hidden layers is adopted in this study. Consistent with the aforementioned forward-propagation formulation, both hidden layers contain five neurons. The number of hidden-layer neurons can be estimated using the empirical relation in Equation (44):
In the equation, m is the number of neurons in the hidden layer, n is the number of neurons in the input layer, and is the number of neurons in the output layer. The parameter a is a constant ranging from 1 to 10.
- 2.
- Purpose of introducing GA and optimization variables
Traditional BP training is sensitive to the initial weights and bias terms, which may lead to unstable convergence or entrapment in local optima, thereby affecting the prediction consistency of the surrogate model. To enhance the stability of network training, a genetic algorithm is employed to perform global optimization of the initial weights and bias terms of the BP network.
Specifically (as illustrated in the flowchart in Figure 6), the initial weights and biases are encoded as individuals in the genetic algorithm population. The training error is used as the fitness criterion to evaluate individual quality. Through iterative operations of selection, crossover, and mutation, the search is guided toward minimizing the training error, thereby yielding improved initial values for the network.
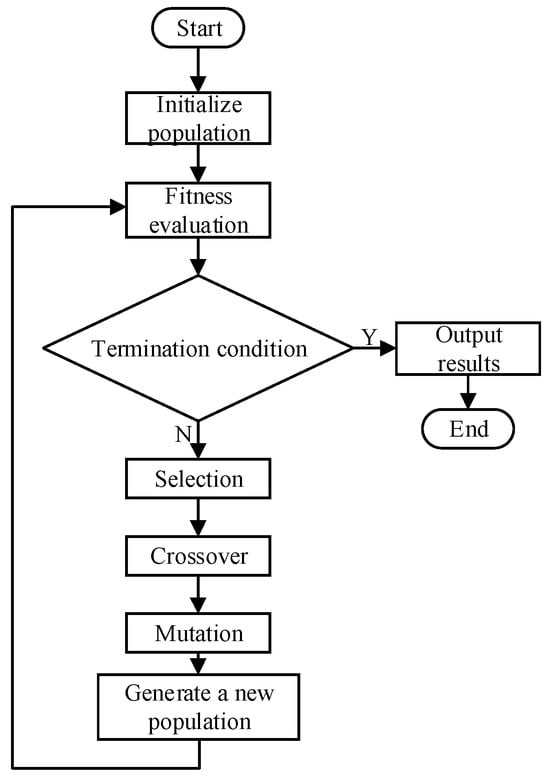
Figure 6.
Flowchart of the genetic algorithm.
- 3.
- GA–BP modeling procedure
The overall procedure of the GA–BP model is shown in Figure 7. First, an initial population is generated, and the fitness values are evaluated. Then, genetic operations are iteratively performed to obtain the optimal initial weights and thresholds (biases). Based on these results, the BP network is initialized and trained until the error criterion or the termination condition on iterations is satisfied. This mechanism enables the surrogate model to improve convergence stability and generalization capability while preserving the nonlinear fitting ability of the BP network.
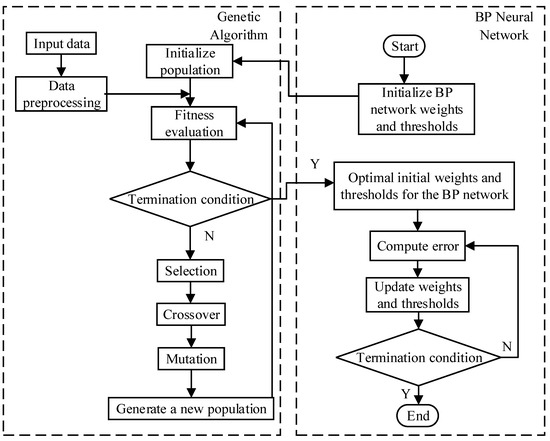
Figure 7.
GA–BP neural network workflow.
- 4.
- Parameter settings and accuracy verification
The genetic algorithm (GA) parameters are set as follows: a population size of 150, a crossover probability of 0.8, a mutation probability of 0.1, and a maximum of 150 iterations. The dataset contains 27 samples. Considering the limited sample size and the associated risk of overfitting when training a neural network, the BP network is configured with a compact architecture, and regularization and/or early stopping is employed during training.
To obtain a reliable estimate of generalization performance under small-sample conditions, k-fold cross-validation (k = 5) is adopted. In each fold, the GA–BP surrogate model is trained using the training subset and evaluated using the held-out validation subset. The reported performance metrics are summarized as the mean ± standard deviation across the k folds, which reduces sensitivity to a single random split.
To prevent information leakage, all preprocessing operations (e.g., normalization/standardization) are performed within each fold: scaling parameters are fitted using only the training subset of that fold and then applied to the corresponding validation subset. Predictions are transformed back to the original strain scale before error computation.
The root mean square error (RMSE) and relative error are adopted as performance metrics. Let denote the number of samples in the validation subset of a fold. For the -th sample, the finite element result is the actual strain , and the surrogate-model output is the predicted strain . The corresponding metrics are computed as follows:
The results show that the predicted strain agrees well with the finite element results in both overall trend and magnitude (see a representative example in Figure 8). In addition to RMSE, the distribution of is summarized using statistics such as the median and maximum values to reflect typical and worst-case deviations.
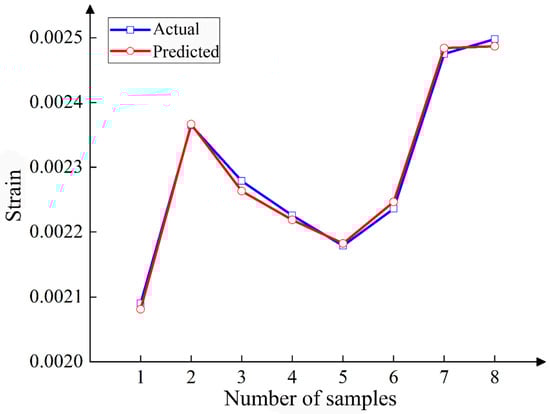
Figure 8.
Representative comparison between predicted and finite element strain responses (an example fold in 5-fold cross-validation).
Quantitative validation results demonstrate that the developed GA–BP surrogate can accurately approximate the FEA strain response within the sampled design space. The overall prediction error is summarized by an RMSE of 44.96 and an MAE of 34.49, with a coefficient of determination of 0.9693. For transparency, Table 2 lists the predicted and FEA strain values for each sample together with the pointwise relative error . The median relative error is 1.21%, and the maximum relative error is 4.95%. In summary, the surrogate model exhibits high agreement with the FEA results and reliable predictive performance within the sampled design space, providing effective support for the subsequent multi-objective optimization.
Table 2.
Sample-wise validation of the surrogate model against actual results.
3. Multi-Objective Optimization of U-Drill Chip-Flute Structural Parameters
Building on the previously developed stiffness surrogate model, a multi-objective collaborative optimization is carried out for the structural parameters of the U-drill chip flutes. The design variables include the core thicknesses and of the inner and outer chip flutes, the inner and outer offset angles and , and the inner and outer helix angles and . An optimization model is established by taking chip-evacuation-related metrics and a stiffness metric as the objectives. Specifically, the drill-body stiffness metric is efficiently predicted using the developed GA–BP surrogate model, while the chip-evacuation-related metrics are calculated via the chip evacuation force model. Accordingly, the objective functions are defined as maximizing the inner-flute chip evacuation force , maximizing the outer-flute chip evacuation force , and minimizing the drill-body strain . NSGA-II is adopted to generate the Pareto-optimal solution set, and the entropy-weighted TOPSIS method is then applied to identify the best overall compromise solution from the Pareto front.
3.1. Principle of the NSGA-II Genetic Algorithm
As a classical algorithm in the field of multi-objective optimization, NSGA-II integrates a non-dominated sorting mechanism with an elitist selection strategy to achieve efficient optimization. Figure 9 illustrates the operation of the elitist strategy: in the -th generation, the offspring population is merged with the parent population to form a combined population . Non-dominated sorting is then performed on , thereby partitioning the solutions into a hierarchical structure with different non-dominance ranks. When constructing the parent population for the -th generation, individuals are first selected from subsets with better non-dominance levels (that is, smaller rank indices). When individuals must be chosen from the same non-dominated front, the crowding-distance criterion is used to preferentially retain individuals with a larger distribution density in the solution space, so as to maintain population diversity while ensuring convergence. After this hierarchical selection process, the system finally reconstructs the parent population that satisfies the preset population size.
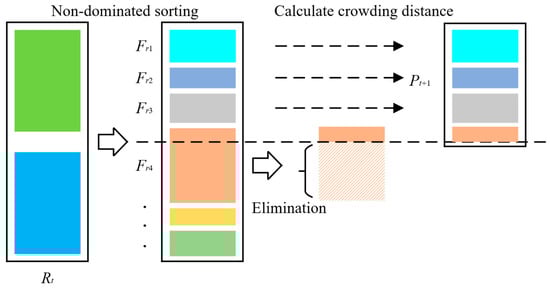
Figure 9.
Flowchart of the elitist selection strategy.
This study employs NSGA-II to solve the multi-objective optimization problem. The algorithm performs non-dominated sorting to obtain the Pareto ranks of candidate solutions, maintains population diversity using the crowding-distance measure, and improves convergence stability through an elitist preservation strategy. As shown in Figure 10, after the population size and genetic-operator parameters are specified, the algorithm iteratively carries out offspring generation, parent–offspring merging, non-dominated sorting, crowding-distance calculation, and elitist selection until the maximum number of iterations is reached, and finally outputs the Pareto solution set.
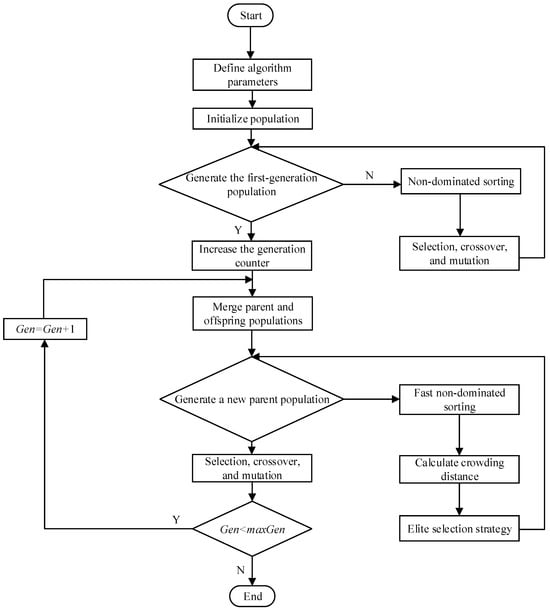
Figure 10.
Flowchart of the NSGA-II genetic algorithm.
3.2. Optimization Objectives and Constraints
The optimization objective of this study is to simultaneously improve the chip evacuation performance and the drill-body stiffness of a U-drill by adjusting the chip-flute structural parameters. However, these two performance indices are often conflicting in practice. Therefore, under the premise that the drill-body stiffness satisfies the required level and cutting chatter is avoided, the chip evacuation efficiency should be improved as much as possible. The core thicknesses and of the inner and outer chip flutes, the inner and outer offset angles and , and the inner and outer helix angles and are key parameters that significantly affect both chip evacuation performance and drill-body stiffness; thus, these six parameters are selected as the design variables. Under the same loading and boundary conditions, a lower strain level indicates smaller elastic deformation and, equivalently, higher stiffness. Accordingly, minimizing the strain response is adopted as one of the optimization objectives to characterize the improvement in the equivalent stiffness of the drill body.
The objective functions for optimizing the U-drill chip-flute geometry are defined as:
where is the chip evacuation force of the inner chip flute; is the chip evacuation force of the outer chip flute; is the offset angle of the inner chip flute; is the offset angle of the outer chip flute; is the helix angle of the inner chip flute; and is the helix angle of the outer chip flute.
Clarification of and : In this study, and denote the effective chip-driving capability provided by the inner/outer chip-groove (i.e., the tendency to propel the chip along the evacuation direction), rather than the resistance (reaction/normal/friction) that hinders chip flow. Therefore, a larger or indicates stronger chip conveying ability and is beneficial for chip evacuation, which justifies the maximization objectives.
To enhance the generalization ability of the model and improve its computational efficiency, the objective functions in a multi-objective optimization problem need to be transformed into a minimization form. Following this principle, Equation (48) can be rewritten as:
To ensure sufficient structural stiffness and chip-evacuation performance during U-drilling, reasonable ranges are specified in this study for the key geometric parameters of the chip flutes. The web thicknesses and directly affect the stiffness of the drill body. The offset angles and mainly determine the flute layout; excessively large or small values may lead to geometric interference with the insert pockets. The helix angles and influence chip evacuation and chip-breaking behavior; overly large values can weaken the chip-breaking capability and reduce structural stiffness. Based on manufacturing experience and geometric constraints, the ranges of these parameters for a 21 mm diameter U-drill are listed in Table 3.
Table 3.
Constraints for the multi-objective optimization of the U-drill chip-flute structure.
3.3. Multi-Objective Optimization
With the chip evacuation force and drill-body strain as the optimization objectives, the chip-flute structural parameters are optimized using the NSGA-II algorithm. The input variables of NSGA-II include the core thicknesses and of the inner and outer chip flutes, the inner and outer offset angles and , and the inner and outer helix angles and . Their lower and upper bounds are specified through constraint conditions. The algorithm parameters are set as follows: an initial population of 50 individuals, a maximum of 200 generations, a crossover probability of 0.8, and a mutation probability of 0.1. The output variables are the chip evacuation forces of the inner and outer flutes and the drill-body strain. The optimization results are presented in Figure 11. Since the Pareto solution set typically contains multiple feasible trade-off solutions, a further decision-making step is required to identify the overall best compromise solution.
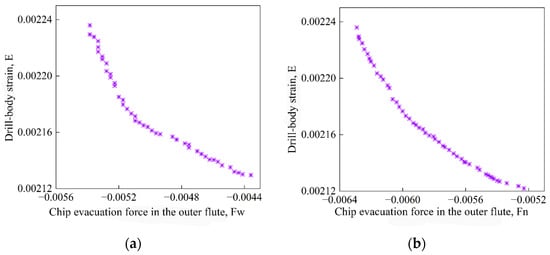
Figure 11.
Pareto front of the optimized chip-flute structural parameters for the U-drill. (a) Relationship between drill-body strain and chip evacuation force in the outer flute. (b) Relationship between drill-body strain and chip evacuation force in the inner flute.
Accordingly, the evaluation-index data corresponding to each non-dominated solution in the Pareto set are processed. The entropy weight method is used to calculate the weights of the evaluation indices (see Table 4), and TOPSIS is then applied to compute the closeness coefficient of each solution to the positive ideal solution and the negative ideal solution, followed by ranking. In TOPSIS, serves as the ranking criterion: a larger indicates that the solution is closer to the positive ideal solution. In this study, all candidate solutions in the Pareto set are first ranked in descending order of (see Table 5), and the top-ranked solution is selected as the overall optimal solution.
Table 4.
Weights of the optimization objectives in the entropy-weighted TOPSIS method.
Table 5.
TOPSIS ranking results based on the closeness coefficient.
4. Experimental Validation and Comparative Analysis of U-Drill Drilling Performance
To verify the effect of chip-flute structural parameter optimization on the machining performance of the U-drill, an optimized U-drill sample (denoted as U2, diameter 21 mm, drilling depth 5D) was fabricated, and the original unoptimized U-drill was used as a reference (denoted as U1). Comparative drilling experiments were conducted on 42CrMo workpieces. Both tools were tested under identical cutting conditions. During the experiments, cutting-force and vibration signals were simultaneously acquired to characterize the drilling load level and process stability. In addition, the hole diameter and hole-wall surface roughness were measured to evaluate the influence of the optimized design on machining accuracy and surface integrity in terms of hole quality. Through a comparative analysis between U1 and U2, the improvements in chip evacuation behavior and drilling stability achieved by chip-flute parameter optimization were systematically examined, providing experimental evidence for subsequent parameter optimization and engineering applications.
4.1. Experimental Scheme for Comparative Evaluation of Drilling Performance
The comparative drilling performance experiments of the U-drill were carried out on a Shenyang Zhongjie VMC1600B CNC vertical machining center, as shown in Figure 12. The main machine specifications are as follows: coolant pressure of 5 MPa; X–Y–Z axis travels of 1600 mm × 800 mm × 800 mm; a maximum spindle speed of 6000 rpm; and a spindle power of 15 kW.
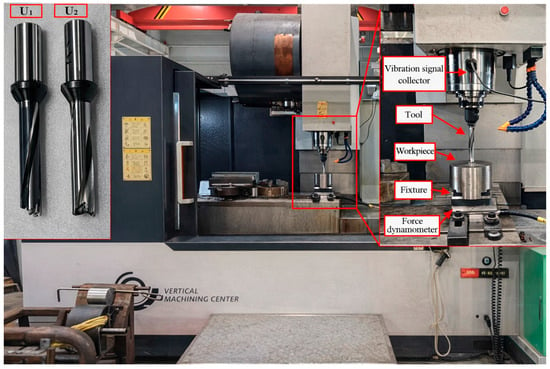
Figure 12.
Experimental setup for comparative evaluation of U-drill drilling performance.
Both U-drills were made of H13 hot-work tool steel and employed the same S-type inserts and Y-type coolant channels. The insert mounting orientation parameters of the two U-drills are listed in Table 6, and the chip-flute structural parameters are provided in Table 7.
Table 6.
Insert installation pose parameters of the U-drill.
Table 7.
Chip-flute structural parameters of the U-drill.
The workpiece material used in the comparative drilling performance experiments for the U-drill was 42CrMo, and its chemical composition is listed in Table 8. After quenching and tempering, 42CrMo exhibits excellent comprehensive strength, toughness, and ductility, with a relatively low tendency to become brittle. The workpiece was pre-machined by turning and milling, and its dimensions were .
Table 8.
Chemical composition of 42CrMo [28].
The instruments used for the comparative drilling performance experiments included a Donghua DH5981 dynamic signal test and analysis system (Donghua Testing Technology Co., Ltd., Jingjiang, China), a KISTLER 9527B three-component dynamic piezoelectric dynamometer with a matching charge amplifier (Kistler Instrumente AG, Winterthur, Switzerland), an internal micrometer gauge, and a contour and surface roughness measuring instrument. The data acquisition instruments used in the experiments are shown in Figure 13, and the experimental scheme for the comparative evaluation of U-drill drilling performance is shown in Table 9.

Figure 13.
Data acquisition setup for the comparative drilling performance tests of U-drills.
Table 9.
Experimental scheme for comparative evaluation of U-drill drilling performance.
Based on the above experimental setup and cutting conditions, the detailed validation protocol and statistical treatment used to ensure a fair comparison and to quantify variability are presented in Section 4.2.
4.2. Experimental Validation Protocol and Statistical Treatment
To improve the reproducibility and reliability of the comparative conclusions, a controlled validation protocol was adopted to evaluate the original U-drill (U1) and the optimized U-drill (U2). Both tools were tested on the same CNC vertical machining center under identical fixturing and coolant conditions, using the same workpiece material (42CrMo). The detailed experimental setup—including the machine tool and fixture, tool geometry and installation parameters, workpiece information, measurement system, and cutting conditions—is provided in Section 4.1 (Figure 9 and Table 5, Table 6, Table 7 and Table 8). A multi-indicator evaluation system was employed. For the drilling process, cutting-force and vibration signals were synchronously acquired and used to compute force-related metrics (mean, peak, and RMS) and vibration-related metrics (RMS/peak, and dominant spectral components when applicable). For hole quality, the hole diameter and the hole-wall surface roughness (Ra) were used as the primary indicators. To minimize the influence of transient effects at drilling entry and exit (e.g., initial engagement, burr formation, and breakthrough impacts), only the steady-state segment of each drilling cycle was extracted for force and vibration analyses. The superiority of U2 over U1 was determined based on consistent improvements across the above indicators, i.e., reduced load fluctuation/vibration and improved hole quality.
Cutting-force and vibration signals were synchronously recorded using the DH5981 dynamic signal testing and analysis system (with the sensor configuration described in Section 4.1). Due to experimental constraints, each tool–condition combination was conducted once. Therefore, to quantify process stability and statistical variation under a single-run test, the steady-state segment of each drilling cycle was further divided into multiple equal-length windows. The force and vibration metrics were calculated for each window, and the variability was reported as the standard deviation across windows. This window-based standard deviation reflects intra-hole fluctuations and drilling stability for the tested condition.
For hole-quality measurements, the hole diameter was measured using an internal micrometer gauge (resolution according to the instrument specification). To ensure comparability among different tools and conditions while reducing the influence of transient effects near the hole entrance and exit, the diameter was consistently evaluated at an axial position 50 mm from the hole entrance. At the specified depth, diameter readings were taken along two orthogonal directions and averaged to obtain the hole diameter for each hole. Each hole diameter was measured three times, and the mean value was reported to reduce random measurement errors. The hole-wall surface roughness was evaluated in terms of Ra using a stylus-type profilometer, measured at the same axial position (50 mm from the entrance) along the hole generatrix direction. The roughness parameters were set to a cut-off length of λc = 0.8 mm and an evaluation length of Le = 4.0 mm. For each hole, Ra was measured along three circumferentially separated traces, and the average value was reported as the final Ra. It should be noted that the present experimental validation was conducted on 42CrMo as a representative alloy steel; although the proposed chip-flute parameter optimization strategy is expected to be transferable to drilling of similar steels under comparable cutting conditions, further validation on additional work materials is required to fully establish its generality.
4.3. Analysis of Comparative Drilling Performance Test Results
Following the validation protocol and statistical treatment described in Section 4.2, the comparative results in terms of cutting force, vibration response, and hole quality are analyzed and discussed in this section.
4.3.1. Cutting Force Analysis
To quantitatively evaluate the effectiveness of the tool optimization, the three-component cutting forces of tool U1 and tool U2 were compared under two conditions: constant feed rate and constant cutting speed. The results are shown in Figure 14 and Figure 15, and the corresponding data are shown in Table 10 and Table 11. As indicated by the figures and tables, under all tested conditions, the radial forces and and the axial force of U2 are lower than those of U1, demonstrating that the optimized tool can effectively reduce cutting forces.
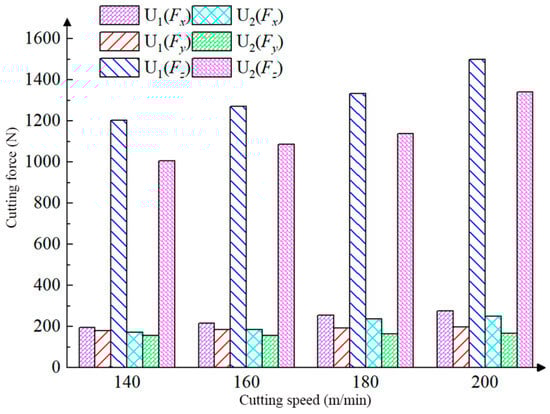
Figure 14.
Variation in cutting forces with cutting speed.
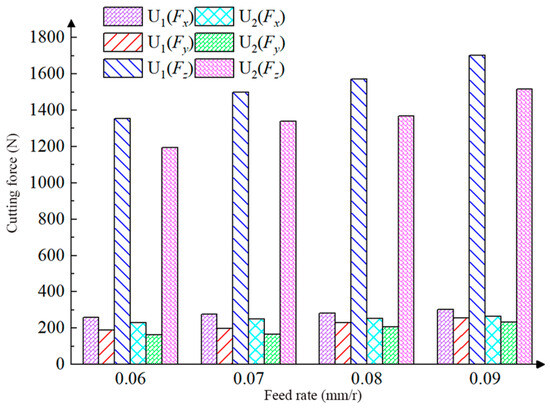
Figure 15.
Variation in cutting forces with feed rate.
Table 10.
Comparison of cutting forces between U1 and U2 at different cutting speeds.
Table 11.
Comparison of cutting forces between U1 and U2 at different feeds per revolution.
Under the constant feed rate of 0.07 mm/r, as the cutting speed increased from 140 m/min to 200 m/min, the reductions in of U2 relative to U1 were 12.3%, 10.9%, 9.9%, and 9.1%, respectively; the reductions in were 13.4%, 14.4%, 15.3%, and 16.2%, respectively; and the reductions in were 16.5%, 14.2%, 12.3%, and 10.6%, respectively. These results indicate that, at different cutting speeds, U2 consistently exhibits lower cutting forces than U1, achieving stable load reduction.
Under the constant cutting speed of 200 m/min, as the feed rate increased from 0.06 mm/r to 0.09 mm/r, the reductions in of U2 relative to U1 were 11.3%, 11.7%, 12.0%, and 12.4%, respectively; the reductions in were 14.2%, 12.0%, 10.2%, and 8.8%, respectively; and the reductions in were 11.7%, 10.6%, 9.7%, and 8.9%, respectively. The results show that even though increasing the feed rate leads to an overall rise in cutting forces, the forces for U2 remain lower than those for U1.
Overall, the results show that U2 achieves average reductions in cutting forces of 11.2%, 13.1%, and 11.8% in the , , and -directions, respectively, further confirming the effectiveness of the tool optimization in reducing cutting loads.
4.3.2. Cutting Vibration Analysis
Vibration signals commonly used for analysis include displacement, velocity, and acceleration. These three types differ in their applicable frequency ranges and their ability to characterize vibration features. Displacement signals are more suitable for low-frequency vibrations and can effectively reflect the overall motion trend of the system, but they are less sensitive to high-frequency details. Velocity signals mainly cover the low-to-mid frequency range and offer certain advantages for steady-state vibration monitoring; however, their capability to capture high-frequency components and transient impact characteristics is limited. In contrast, acceleration signals are more sensitive to high-frequency dynamic responses and can more effectively represent high-frequency vibration characteristics. Therefore, they are more widely used in vibration monitoring of high-speed rotating equipment and mechanically complex systems. Based on these considerations, acceleration was selected as the primary signal for analysis in this study. Taking the drilling processes of the two U-drills at a feed rate of 0.07 mm/rev under different cutting speeds as examples, the corresponding time-domain acceleration signals are presented in Figure 16, Figure 17, Figure 18 and Figure 19.
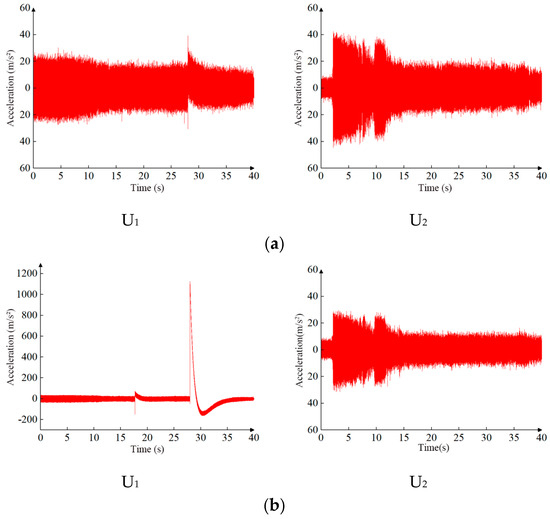
Figure 16.
Comparison of tool acceleration signals in the time domain at a cutting speed of 140 m/min. (a) Time-domain comparison of the acceleration signals of U1 and U2 in the x-direction. (b) Time-domain comparison of the acceleration signals of U1 and U2 in the y-direction.
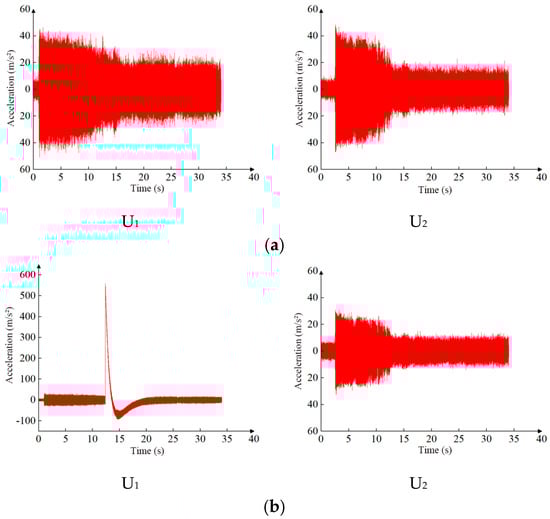
Figure 17.
Comparison of tool acceleration signals in the time domain at a cutting speed of 160 m/min. (a) Time-domain comparison of the acceleration signals of U1 and U2 in the x-direction. (b) Time-domain comparison of the acceleration signals of U1 and U2 in the y-direction.
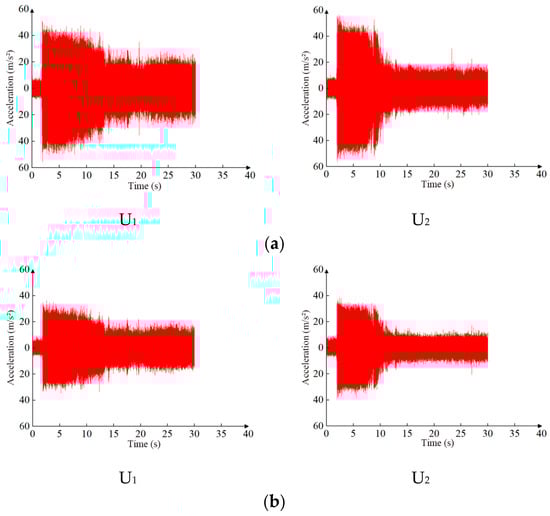
Figure 18.
Comparison of tool acceleration signals in the time domain at a cutting speed of 180 m/min. (a) Time-domain comparison of the acceleration signals of U1 and U2 in the x-direction. (b) Time-domain comparison of the acceleration signals of U1 and U2 in the y-direction.
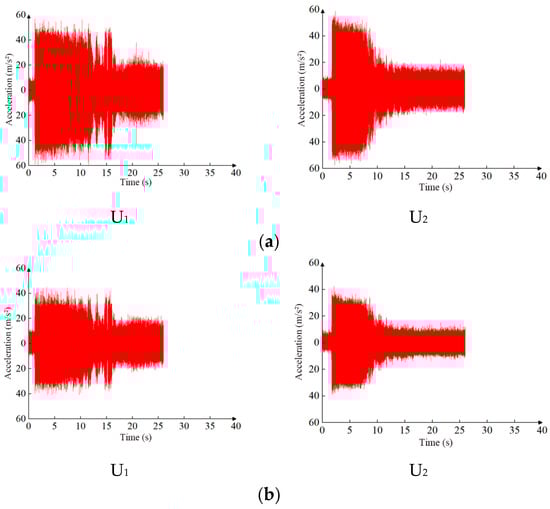
Figure 19.
Comparison of tool acceleration signals in the time domain at a cutting speed of 200 m/min. (a) Time-domain comparison of the acceleration signals of U1 and U2 in the x-direction. (b) Time-domain comparison of the acceleration signals of U1 and U2 in the y-direction.
A comparison was performed between the vibration acceleration signals of the two U-drills under four sets of cutting conditions (Figure 16, Figure 17, Figure 18 and Figure 19). The results indicate that, at a feed rate of 0.07 mm/rev and cutting speeds of 140 m/min and 160 m/min, tool U1 exhibits a pronounced increase in acceleration fluctuations in the later stage of drilling, accompanied by abnormal behavior. This is mainly because, as the drilling depth increases, chips cannot be evacuated in time and tend to remain in the chip flutes, which disrupts the stability of the cutting process and leads to intensified vibrations. In contrast, tool U2 shows an overall stable acceleration response under the same cutting conditions, without significant abnormal fluctuations, indicating stronger chip-evacuation capability and better process stability.
From the time-domain evolution, both U-drills exhibit relatively large vibration amplitudes at the initial stage of drilling, which then gradually decrease and stabilize as the process progresses, suggesting that the vibration level drops after the system enters a stable cutting regime. In addition, differences are observed between the two measurement directions: the amplitude in the -direction is generally higher than that in the -direction, implying that the influence of vibration on the drilling process is direction-dependent. Furthermore, the acceleration data were processed to calculate the root-mean-square (RMS) values at different cutting speeds, as summarized in Table 12. Under identical cutting conditions, the RMS values of U2 are generally lower than those of U1, further confirming that U2 exhibits lower vibration levels and a more stable drilling process.
Table 12.
RMS values of the acceleration signals of the two U-drills at different cutting speeds.
To better analyze the vibration behavior of the two U-drills during drilling, the above time-domain acceleration signals were transformed into the frequency domain using the fast Fourier transform (FFT). The resulting acceleration spectra are shown in Figure 20, Figure 21, Figure 22 and Figure 23.
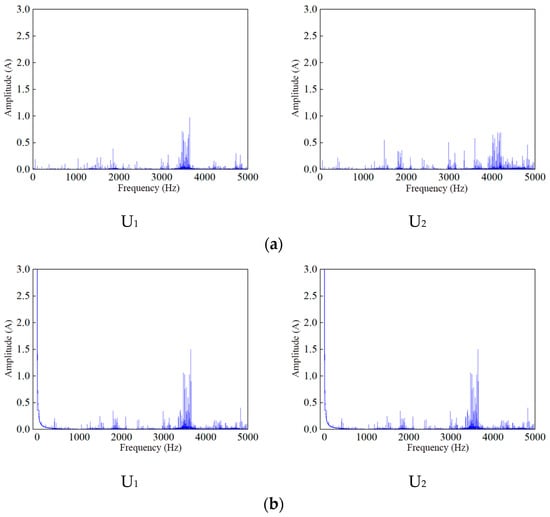
Figure 20.
Comparison of acceleration spectra at a cutting speed of 140 m/min. (a) Frequency-domain comparison of the acceleration signals of U1 and U2 in the x-direction. (b) Frequency-domain comparison of the acceleration signals of U1 and U2 in the y-direction.
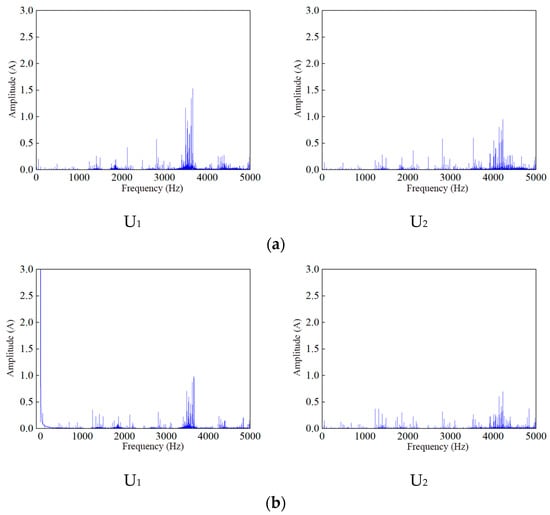
Figure 21.
Comparison of acceleration spectra at a cutting speed of 160 m/min. (a) Frequency-domain comparison of the acceleration signals of U1 and U2 in the x-direction. (b) Frequency-domain comparison of the acceleration signals of U1 and U2 in the y-direction.
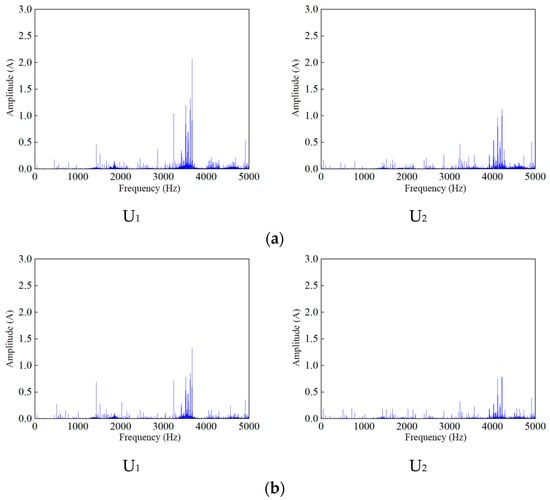
Figure 22.
Comparison of acceleration spectra at a cutting speed of 180 m/min. (a) Frequency-domain comparison of the acceleration signals of U1 and U2 in the x-direction. (b) Frequency-domain comparison of the acceleration signals of U1 and U2 in the y-direction.
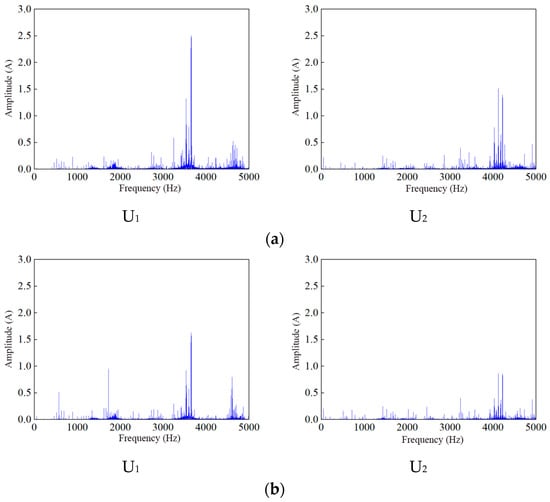
Figure 23.
Comparison of acceleration spectra at a cutting speed of 200 m/min. (a) Frequency-domain comparison of the acceleration signals of U1 and U2 in the x-direction. (b) Frequency-domain comparison of the acceleration signals of U1 and U2 in the y-direction.
Frequency-domain analysis of the vibration acceleration during U-drilling indicates that the vibration characteristics are closely related to the dynamic response of the system. When the spectral energy is significantly concentrated around the tooth-passing frequency or its harmonics, forced vibration is typically intensified. Since the U-drill can be equivalently regarded as a single-edge cutting tool, the corresponding tooth-passing frequencies at cutting speeds of 140, 160, 180, and 200 m/min are approximately 35, 40, 45, and 50 Hz, respectively (see Figure 20, Figure 21, Figure 22 and Figure 23), providing a basis for identifying the harmonic relationships in subsequent analysis.
As shown in Figure 20, Figure 21, Figure 22 and Figure 23, for both tools and under different cutting speeds, elevated amplitudes occur near the spindle rotational frequency and its harmonics, indicating an evident vibration response during drilling. For tool U1, the dominant peak in the frequency domain is mainly concentrated around 3600 Hz and shifts slightly upward as the cutting speed increases (for example, the peak frequencies are approximately 3667 Hz and 3648 Hz at 180 m/min and 200 m/min, respectively). In addition, the peak amplitude in the -direction is generally higher than that in the -direction, suggesting a more pronounced vibration in the -direction. This dominant frequency band is close to the high-order harmonic range of the tooth-passing frequency, implying that the vibration of U1 is dominated by forced vibration components.
In contrast, tool U2 exhibits more stable spectral characteristics overall: at all cutting speeds, the dominant peak is concentrated in the range of approximately 4150–4220 Hz (for example, about 4218 Hz). This range also corresponds to harmonics of the tooth-passing frequency, indicating that the vibration of U2 is likewise dominated by forced vibration, but with a more stable peak distribution and smaller amplitude variation. Overall, U2 demonstrates better frequency-domain stability than U1, which is consistent with its more stable time-domain behavior during cutting.
4.3.3. Hole Quality Analysis
The hole diameters produced by the two U-drills under different cutting conditions were measured at a depth of 50 mm from the hole entrance. The results are shown in Figure 24.
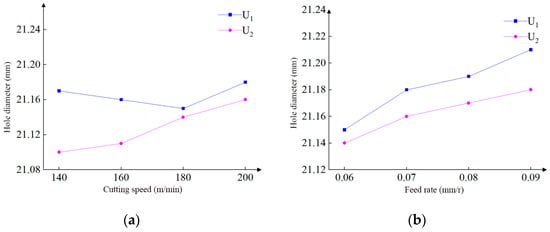
Figure 24.
Hole diameter values of the two U-drills under different cutting parameters. (a) Hole diameter at different cutting speeds with a feed rate of 0.07 mm/r. (b) Hole diameter at different feed rates with a cutting speed of 200 m/min.
As shown in Figure 24, the hole diameters produced by tool U2 are consistently smaller than those produced by tool U1 under different cutting conditions, which is consistent with the vibration behavior discussed above. In addition, the difference in hole diameter between the two U-drills is more pronounced at lower cutting speeds. This is because tool U1 fails to evacuate chips in time under these conditions, thereby impairing the stability of the drilling process.
As shown in Figure 25a, the hole-wall surface quality is significantly improved with increasing cutting speed. This can be attributed to the fact that a higher cutting speed stabilizes chip formation and facilitates chip evacuation, thereby reducing friction between the chips and the hole wall. As shown in Figure 25b, increasing the feed rate leads to a higher surface roughness. This is mainly because a larger feed rate increases the cutting forces; as the cutting forces rise, drill-body vibration is intensified, which in turn deteriorates the surface finish. Moreover, the hole-wall surface roughness produced by tool U2 is consistently lower than that produced by tool U1 under all tested cutting conditions, indicating that U2 provides smoother chip evacuation and effectively reduces friction between the chips and the hole wall.
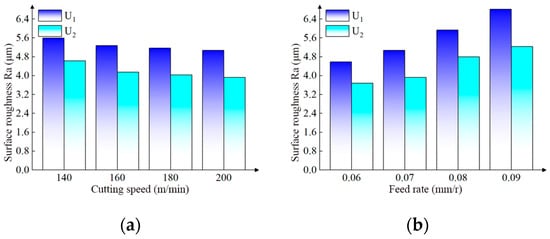
Figure 25.
Hole-wall surface roughness obtained with the two U-drills under different cutting conditions. (a) Hole-wall surface roughness at different cutting speeds with a feed rate of 0.07 mm/r. (b) Hole-wall surface roughness at different feed rates with a cutting speed of 200 m/min.
5. Discussion
This study optimizes the U-drill chip-groove structural parameters based on the adopted GA–BP and NSGA-II frameworks and the specific experimental/simulation settings used herein. The established surrogate models and Pareto-optimal solutions are therefore constrained by (1) the selected design space and parameter ranges, (2) the materials, tool/workpiece combinations, cutting conditions, and measurement environment considered, and (3) the objective definitions and weighting/normalization strategy. In addition, the BP-based surrogate may be sensitive to sample size and noise, and model uncertainty was not explicitly quantified. Consequently, the generalization of the obtained optimal designs to broader machining scenarios should be interpreted with caution.
Future research will expand the dataset and design space by incorporating more materials, cutting regimes, and chip-groove geometries, and by performing additional validation experiments under diverse industrial conditions. Uncertainty quantification and robust optimization will be introduced to account for process variability and measurement noise. More advanced surrogate and multi-objective strategies (e.g., ensemble learning, Gaussian-process/Kriging models, or deep-learning surrogates with Bayesian optimization) will be explored to improve prediction accuracy and optimization efficiency. Finally, the manufacturability, tool wear evolution, and long-term stability of the optimized chip-groove designs will be systematically evaluated to facilitate practical deployment.
6. Conclusions
This study addresses the engineering challenge in deep-hole drilling where inadequate chip evacuation from the chip flutes coexists with stringent stiffness constraints of the drill body. Following a workflow of rapid prediction using a surrogate model, multi-objective optimization, decision-making over the solution set, and experimental comparative validation, the main conclusions are summarized as follows.
- 1.
- A GA-optimized BP neural network surrogate model was developed for the U-drill chip-flute structure. Together with NSGA-II for multi-objective optimization and TOPSIS for decision-based selection, a collaborative optimization framework was established to enable unified modeling and rapid evaluation of chip-flute structural parameters and performance indices. The test results indicate that the surrogate model achieves good predictive accuracy, with the prediction error controlled within five percent, meeting the accuracy requirements for rapid evaluation in engineering optimization.
- 2.
- With the chip-evacuation-related equivalent force metrics and the drill-body strain metric as the optimization objectives, NSGA-II is employed to obtain the Pareto-optimal solution set. The entropy-weighted TOPSIS method is then used to comprehensively evaluate and rank the non-dominated solutions, yielding the optimal chip-flute parameter combination that balances chip evacuation capability and structural stiffness. The selected parameters fall within the prescribed constraints and are consistent with the design trends of enhancing chip evacuation while maintaining stiffness.
- 3.
- Comparative drilling experiments verified the effectiveness of the optimized design. Compared with the original structure, the optimized structure showed significant improvements in cutting forces and vibration levels: the radial forces were reduced by approximately 9.1% and 16.2%, the axial force was reduced by about 10.6%, and the acceleration RMS values were reduced by approximately 17.3% and 22.9% in the - and -directions, respectively. Moreover, both the hole-diameter error and surface roughness were improved relative to the original structure, indicating that the proposed method can effectively enhance chip evacuation and cutting stability.
Author Contributions
Conceptualization, Z.J. and X.L. (Xianli Liu); methodology, Z.J. and Y.L.; validation, X.L. (Xiangwei Liu), G.Z. and Y.J.; formal analysis, Y.L. and X.L. (Xianli Liu); investigation, Y.L., X.L. (Xiangwei Liu), G.Z. and Y.J.; resources, G.Z. and Y.J.; data curation, Y.L. and X.L. (Xiangwei Liu); writing—original draft preparation, Y.L.; writing—review and editing, Z.J. and X.L. (Xianli Liu); visualization, Y.L.; supervision, Z.J.; project administration, Z.J.; funding acquisition, Z.J. All authors have read and agreed to the published version of the manuscript.
Funding
This research received no external funding.
Institutional Review Board Statement
Not applicable.
Informed Consent Statement
Not applicable.
Data Availability Statement
Data are contained within the article.
Conflicts of Interest
Author Guohua Zheng was employed by the Hangzhou Sino-Deutsche Power Transmission Equipment Co. Ltd.; author Yuxin Jia was employed by the Zhejiang Supor Electrical Appliances Manufacturing Co., Ltd. The remaining authors declare that the research was conducted in the absence of any commercial or financial relationships that could be construed as a potential conflict of interest.
References
- Sutherland, J.W.; Skerlos, S.J.; Haapala, K.R.; Cooper, D.; Zhao, F.; Huang, A. Industrial Sustainability: Reviewing the Past and Envisioning the Future. J. Manuf. Sci. Eng. 2020, 142, 110806. [Google Scholar] [CrossRef]
- Stavropoulos, P.; Souflas, T.; Gerontas, C. The Role of Artificial Intelligence in Advancing the Digitalization of Machining Processes. In Artificial Intelligence in Material Science; CRC Press: Boca Raton, FL, USA, 2024; pp. 26–52. ISBN 978-1-003-45251-5. [Google Scholar]
- Chen, W.-C.; Tsao, C.-C. Cutting Performance of Different Coated Twist Drills. J. Mater. Process. Technol. 1999, 88, 203–207. [Google Scholar] [CrossRef]
- López De Lacalle, L.N.; Pérez-Bilbatua, J.; Sánchez, J.A.; Llorente, J.I.; Gutiérrez, A.; Albóniga, J. Using High Pressure Coolant in the Drilling and Turning of Low maChinability Alloys. Int. J. Adv. Manuf. Technol. 2000, 16, 85–91. [Google Scholar] [CrossRef]
- Rupasinghe, N.; Michel, S.; Baumann, A.; Gerken, J.; Gülde, S.; Biermann, D.; Eberhard, P. Numerical and Experimental Evaluation of Chip Evacuation and Lubricant Flow Using Optimized Drill Heads for Ejector Deep Hole Drilling. Prod. Eng. 2026, 20, 52. [Google Scholar] [CrossRef]
- Biermann, D.; Bleicher, F.; Heisel, U.; Klocke, F.; Möhring, H.-C.; Shih, A. Deep Hole Drilling. CIRP Ann. 2018, 67, 673–694. [Google Scholar] [CrossRef]
- Mellinger, J.C.; Burak Ozdoganlar, O.; DeVor, R.E.; Kapoor, S.G. Modeling Chip-Evacuation Forces and Prediction of Chip-Clogging in Drilling. J. Manuf. Sci. Eng. 2002, 124, 605–614. [Google Scholar] [CrossRef]
- Han, C.; Zhang, D.; Luo, M.; Wu, B. Chip Evacuation Force Modelling for Deep Hole Drilling with Twist Drills. Int. J. Adv. Manuf. Technol. 2018, 98, 3091–3103. [Google Scholar] [CrossRef]
- Shamoto, E.; Hayasaka, T.; Lee, K. Theoretical Modelling and Simulation of Chip Clogging in Drilling and Experimental Verification. Int. J. Adv. Manuf. Technol. 2025, 141, 5853–5871. [Google Scholar] [CrossRef]
- Niketh, S.; Samuel, G.L. Surface Textured Drill Tools—An Effective Approach for Minimizing Chip Evacuation Force and Burr Formation during High Aspect Ratio Machining of Titanium Alloy. J. Manuf. Sci. Eng. 2021, 143, 041005. [Google Scholar] [CrossRef]
- De Melo Pereira, L.A.; Santos, S.C.; Martins, P.S.; Ba, E.C.T.; De Freitas Filho, R.L.; Pereira, M.F.; Firpe, P.M.; Júnior, P.A.A.M. Chip Formation Analysis While Drilling al–Mg-Si 6061-T6 Alloy Using High-Speed Steel Drills with and without DLC. Int. J. Adv. Manuf. Technol. 2026, 142, 5213–5231. [Google Scholar] [CrossRef]
- Chu, N.-H.; Nguyen, D.-B.; Ngo, N.-K.; Nguyen, V.-D.; Tran, M.-D.; Vu, N.-P.; Ngo, Q.-H.; Tran, T.-H. A New Approach to Modelling the Drilling Torque in Conventional and Ultrasonic Assisted Deep-Hole Drilling Processes. Appl. Sci. 2018, 8, 2600. [Google Scholar] [CrossRef]
- Parsian, A.; Magnevall, M.; Eynian, M.; Beno, T. Time Domain Simulation of Chatter Vibrations in Indexable Drills. Int. J. Adv. Manuf. Technol. 2017, 89, 1209–1221. [Google Scholar] [CrossRef]
- Akdulum, A.; Kayir, Y. Experimental Investigation and Optimization of Process Stability in Drilling of al 7075-T651 Using Indexable Insert Drills. J. Braz. Soc. Mech. Sci. Eng. 2023, 45, 429. [Google Scholar] [CrossRef]
- Lian, Y.-S.; Zhang, M.; Chen, X.-H.; Peng, S.-W.; Lin, L.-L.; Liu, C.; Chu, X.-Y.; Zhou, W. Cutting Performance Optimization and Experimental Research of Indexable Insert Drill. Adv. Manuf. 2025, 13, 303–321. [Google Scholar] [CrossRef]
- Etxebeste, M.; Ortiz-de-Zarate, G.; Lopez-Hawa, H.; Arrazola, P.J. Finite Element Modeling of Indexable Insert Drilling Processes in Stainless Steel. CIRP J. Manuf. Sci. Technol. 2026, 65, 130–144. [Google Scholar] [CrossRef]
- Liang, Z.; Ma, Y.; Zhang, S.; Wang, X.; Chen, J.; Jiang, L.; Sun, X.; Li, Y. Novel Micro-Deep-Hole Drill with Variable Web Thickness and Flute Width. Precis. Eng. 2021, 72, 340–355. [Google Scholar] [CrossRef]
- Guo, Y.; Lin, B.; Wang, W. Optimization of Variable Helix Cutter for Improving Chatter Stability. Int. J. Adv. Manuf. Technol. 2019, 104, 2553–2565. [Google Scholar] [CrossRef]
- Deb, K.; Pratap, A.; Agarwal, S.; Meyarivan, T. A Fast and Elitist Multiobjective Genetic Algorithm: NSGA-II. IEEE Trans. Evol. Computat. 2002, 6, 182–197. [Google Scholar] [CrossRef]
- Zhou, J.; Shu, L.; Li, A.; Hu, N.; Gong, J. Optimization of Milling Process Parameters for Fe45 Laser-Clad Molded Parts Based on the Nondominated Sorting Genetic Algorithm II. Coatings 2024, 14, 449. [Google Scholar] [CrossRef]
- Behzadian, M.; Khanmohammadi Otaghsara, S.; Yazdani, M.; Ignatius, J. A State-of the-Art Survey of TOPSIS Applications. Expert Syst. Appl. 2012, 39, 13051–13069. [Google Scholar] [CrossRef]
- Shu, L.; Li, J.; Wu, H.; Heng, Z. Optimization of Multi-Track Laser-Cladding Process of Titanium Alloy Based on RSM and NSGA-II Algorithm. Coatings 2022, 12, 1301. [Google Scholar] [CrossRef]
- Shannon, C.E. A Mathematical Theory of Communication. Bell Syst. Tech. J. 1948, 27, 379–423. [Google Scholar] [CrossRef]
- Chen, P. Effects of the Entropy Weight on TOPSIS. Expert Syst. Appl. 2021, 168, 114186. [Google Scholar] [CrossRef]
- Chen, P. Effects of Normalization on the Entropy-Based TOPSIS Method. Expert Syst. Appl. 2019, 136, 33–41. [Google Scholar] [CrossRef]
- Pfrommer, J.; Zimmerling, C.; Liu, J.; Kärger, L.; Henning, F.; Beyerer, J. Optimisation of Manufacturing Process Parameters Using Deep Neural Networks as Surrogate Models. Procedia CIRP 2018, 72, 426–431. [Google Scholar] [CrossRef]
- Xie, Y.; Li, W.; Liu, C.; Du, M.; Feng, K. Optimization of Stamping Process Parameters Based on Improved GA-BP Neural Network Model. Int. J. Precis. Eng. Manuf. 2023, 24, 1129–1145. [Google Scholar] [CrossRef]
- Hu, D.; Yue, C.; Liu, X.; Jiang, Z.; Xu, Y.; Lu, J.; Liang, S.Y. Drilling Process of Indexable Drill Bit Based on Coupled Eulerian-Lagrangian Method: A Simulation Study. Chin. J. Aeronaut. 2024, 37, 477–492. [Google Scholar] [CrossRef]


Disclaimer/Publisher’s Note: The statements, opinions and data contained in all publications are solely those of the individual author(s) and contributor(s) and not of MDPI and/or the editor(s). MDPI and/or the editor(s) disclaim responsibility for any injury to people or property resulting from any ideas, methods, instructions or products referred to in the content. |
© 2026 by the authors. Licensee MDPI, Basel, Switzerland. This article is an open access article distributed under the terms and conditions of the Creative Commons Attribution (CC BY) license.