Highlights
What are the main findings?
- The Monte Carlo method and ABAQUS finite element software are used to build a three-dimensional finite element model of voids, and the relationship between the pore morphology, distribution, and mechanical properties of the porous asphalt mixture is studied.
- The correlation between the stress–strain characteristics of the mesostructure and the void morphology was studied, and the stress characteristics of the aggregate in the porous asphalt mixture and the damaging trend in the mesostructure were summarized.
- The relationship between the strength of the porous asphalt mixture and the void ratio was studied.
What is the implication of the main finding?
- A microvoid model of porous asphalt mixture with optimal mechanical properties is proposed.
Abstract
Traditional macroscopic test methods (e.g., uniaxial compression and indirect tensile strength tests) cannot accurately describe the internal microstructure and its influence on the mechanical properties of asphalt mixtures from a microscopic perspective. With the advancement of digital image processing (DIP) techniques and numerical simulation methods, relatively complete workflows for microstructure characterization and mesostructural evaluation of composite materials have been established. In this study, a three-dimensional finite element model incorporating voids was developed using the Monte Carlo method and ABAQUS software to investigate the relationships between void morphology, distribution, and the mechanical properties of porous asphalt mixtures. By varying void size and shape in the model, correlations between mesostructural stress–strain characteristics and void morphology were derived. The stress distribution around aggregates and damage initiation trends in the mesostructure were summarized. The relationship between the anticipated strength (numerically assessed) of porous asphalt mixture and the void ratio was established through simulations of models with varying void ratios. Finally, a micromechanical model for porous asphalt mixture with optimized mechanical performance is proposed, featuring an icosahedral void shape, a void diameter range of 3–4 mm, and a void ratio of 18%.
1. Introduction
Currently, research on porous asphalt mixtures predominantly focuses on macroscopic scales, with mechanical properties often evaluated through laboratory tests [1,2,3,4]. While essential, such tests are costly and limited in their ability to characterize detailed void information within specimens. For instance, macroscopic approaches typically correlate void ratio with mixture performance [5,6,7,8], whereas microscopic analyses can evaluate the influence of void shape, size, and distribution patterns on mechanical properties. Therefore, investigating the effect of voids on mechanical properties requires a fine-scale (micro-/mesoscale) perspective to characterize void features and their influence mechanisms. Two primary approaches exist for fine-scale modeling of asphalt mixtures: image-based models and computer-generated models [9,10,11]. Image-based models are constructed directly from images of real mixtures, accurately capturing the geometry and spatial distribution of aggregates, asphalt matrix, and voids. While offering high realism, these methods are costly and time-consuming, and their accuracy depends heavily on advanced imaging and processing techniques [12,13,14,15,16]. Recent studies, such as those employing digital image processing (DIP) of warm mix asphalt modified with nanocolemanite and nanoulexite minerals, demonstrate the critical role of DIP in evaluating microstructural effects on performance [17,18]. Computer-generated models offer a more economical and efficient approach by using algorithms to generate aggregate particles within a virtual asphalt matrix in a random or rule-based manner. This facilitates rapid model generation and iterative optimization. However, ensuring that generated geometries accurately represent real mixtures remains a challenge, requiring robust and flexible algorithms. For example, Qian et al. [12] employed 3D image reconstruction to analyze void space. Zhao et al. [13] developed methods to identify and characterize connected voids. Zhu et al. [14] used CT imaging to model AC-13 mixtures and validate void parameters. Xu et al. [15,16] emphasized that 3D void morphology evaluation can reflect actual conditions, largely independent of compaction methods. Zhao et al. [19] constructed a 2D FE model from CT slices to simulate indirect tensile tests, analyzing aggregate content effects. Wang et al. [20] improved the Zwikker–Kosten acoustic model by incorporating additional microstructural factors, optimizing porous asphalt concrete (PAC) for sound absorption. Kollmann et al. [21] combined X-ray tomography and DIP to reconstruct asphalt microstructure. Wang and Yang et al. [22,23] performed laboratory studies linking microscopic pore features to mixture performance using CT images. These studies represent significant progress in image-based modeling. Meanwhile, research on direct computer-generated models is also advancing rapidly. For instance, Cao et al. [24] used a random aggregate FE model to predict the dynamic modulus of asphalt concrete, showing good agreement with experimental results. Ma et al. [25,26] proposed the “Occupancy and Removal Method (ORM)” and a rhombic deformation framework to efficiently generate models with high aggregate content. Wang Zishuo [27] used laser scanning to capture aggregate geometry and employed a Bubble Pack algorithm in PFC3D to create discrete element models, where voids were represented by removing spheres from a regular mortar arrangement. Chen et al. [28] employed a Monte Carlo stochastic aggregate model to investigate the effects of specimen size, coarse aggregate area ratio, and porosity on the nominal tensile strength of concrete through uniaxial tensile simulations. Zhang et al. [29] developed a random aggregate placement model in ABAQUS to simulate asphalt concrete mesostructures, demonstrating good agreement with the experimental results. Wang and Yuan [30] applied Monte Carlo simulations to analyze variability in asphalt pavement mechanical responses, validating the method’s reliability for probabilistic analysis. Cao et al. [31] integrated random aggregate modeling with ABAQUS to predict dynamic modulus, showing improved accuracy over traditional analytical methods.
The fine structure of asphalt mixtures directly influences their macroscopic deformation and strength behavior, justifying a shift from macroscale to micro-/mesoscale investigations. Therefore, developing a fine-scale model that incorporates void mechanics—i.e., the effect of voids on the surrounding matrix—is crucial for analyzing porous asphalt mixtures. This study employs the general-purpose finite element software ABAQUS (2016) to establish a three-dimensional micromechanical model of a porous asphalt mixture. By comparing models with different void shapes, sizes, and ratios, we analyze their stress–strain responses, revealing damage initiation mechanisms and force transmission characteristics within the microstructure. Furthermore, the modeling approach combines the Monte Carlo method for stochastic void generation with ABAQUS for mechanical simulation, a methodology that has been increasingly applied in asphalt research [28,29,30].
The primary objectives of this study are: (1) to develop a fine-scale 3D finite element model incorporating stochastic voids using Monte Carlo and ABAQUS; (2) to systematically investigate the effects of void shape, size, and ratio on the deformation and mechanical properties of porous asphalt mixtures; and (3) to identify an optimal void configuration that minimizes stress concentration and maximizes mechanical performance. The paper is organized as follows: Section 2 details the materials and modeling methodology; Section 3 presents the simulation results regarding deformation; Section 4 analyzes mechanical properties; Section 5 provides a comprehensive discussion comparing results with existing literature; and Section 6 summarizes the conclusions and practical implications.
2. Materials and Methods
2.1. Model Conceptualization and Scale Definition
In this study, the terms microscale refer to the scale of individual constituents (asphalt mastic, aggregates, and voids), mesoscale to the representative volume element (RVE) containing multiple voids and matrix, and macroscale to the homogenized mixture behavior. Our focus is on the mesoscale, where void morphology directly influences local stress fields. The matrix is modeled as a homogeneous linear elastic material representing the asphalt mastic (including fine aggregates and binder), with properties summarized in Table 1. Aggregate particles are not explicitly modeled in this phase to isolate the effect of void morphology; instead, the matrix properties implicitly account for the composite effect of mastic and aggregate stiffness. This simplification is common in initial void morphology studies [21,27].

Table 1.
Material parameters for the finite element model.
2.2. Numerical Modeling Framework
2.2.1. Stochastic Void Generation Using Monte Carlo Method
Monte Carlo methods, also known as stochastic simulation methods, are employed to generate random void distributions within the matrix. The steps include: (1) defining the stochastic process for void placement; (2) optimizing the algorithm for efficiency; (3) sampling from prescribed probability distributions for void location and size; and (4) constructing the 3D geometry [31,32].
Common void shapes investigated include spheres, icosahedrons, dodecahedrons, and hexahedrons. While icosahedral voids may seem idealized, they serve as a geometric benchmark to study the effect of increasing facet count and reduced sharpness compared to common polyhedral approximations of irregular voids. The generation algorithm was implemented in Python (3.6), producing center coordinates and dimensions for each void, which were then imported into ABAQUS via scripts.
2.2.2. Finite Element Model Setup in ABAQUS
A representative volume element (RVE) of size 50 mm × 50 mm × 25 mm was used for uniaxial compression simulation. The matrix was assigned linear elastic properties (Table 1). Voids were modeled as empty spaces by assigning extremely low stiffness values (E ≈ 1 × 10⁻⁶ MPa, ν ≈ 0.01) to the void elements, a common numerical technique to represent negligible load-bearing capacity while maintaining mesh connectivity. This approach avoids convergence issues associated with modeling true voids/empty spaces in Abaqus Standard. The boundary conditions simulated uniaxial compression: the bottom surface fixed in the Y-direction, and a displacement-controlled load applied on the top surface. The mesh was generated using a global size of 2 mm after a sensitivity analysis.
2.2.3. Model Variants and Simulation Plan
Models were generated to investigate three variables:
- (1)
- Void shape: sphere, icosahedron, dodecahedron, hexahedron (constant void ratio ~20%, equivalent diameter range 4–6 mm).
- (2)
- Void size: diameter ranges 3–4, 4–5, 5–6, 6–7, 7–8, 8–9 mm (icosahedron shape, constant void ratio ~20%).
- (3)
- Void ratio: 18%, 19%, 20%, 21%, 22% (icosahedron shape, diameter range 3–4 mm).
For each configuration, uniaxial compression was simulated to extract stress, strain, and displacement fields.
2.2.4. Validation of Modeling Approach
To enhance credibility, the modeling methodology was partially validated by comparing stress distributions with analytical solutions for simple void arrangements and with prior numerical studies [17,22]. While full experimental validation is beyond this paper’s scope, the consistent trends observed in the literature lend support to the approach.
2.3. Image-Based Microstructure Characterization
Although this study primarily uses computer-generated models, we acknowledge the importance of digital image processing (DIP) for real microstructure quantification. For instance, techniques like those used in [21,23] could provide actual void shape distributions to inform model parameters. Future work will integrate CT-based void morphology statistics into the stochastic generation process.
Figure 1 shows a simulated 3D random spherical void model (RVE: 50 × 50 × 25 mm) with void diameters ranging from 3 to 9 mm and a void ratio of 20%. Figure 2 shows the meshed model. The global mesh size was 2 mm, ensuring at least 2–3 elements across smaller voids.
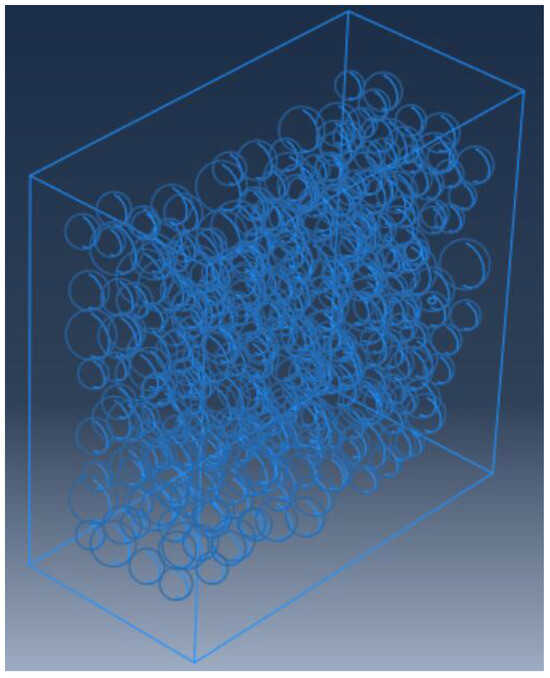
Figure 1.
3D random sphere void model.
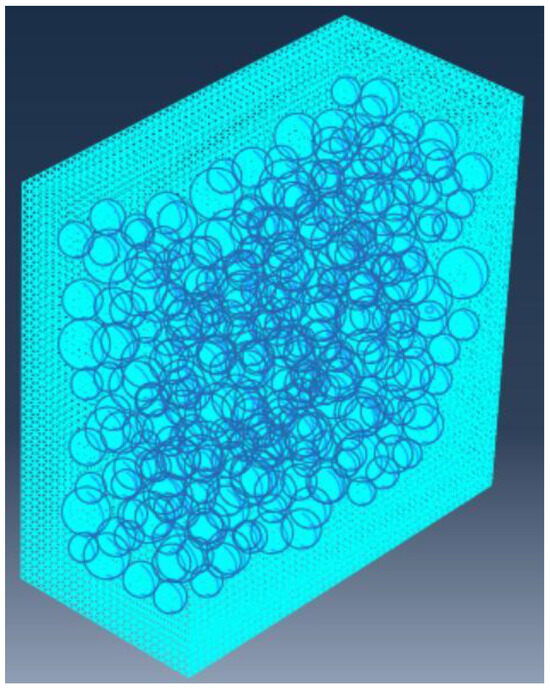
Figure 2.
Divided three-dimensional random sphere void model.
3. Results: Deformation Analysis in Relation to Void Patterns
3.1. Effect of Void Shape on Deformation
The porous asphalt mixture contains a large number of individual voids to form a complex spatial network structure system, and the mechanical properties of porous asphalt mixtures are deeply affected by this. Differences in the size, shape, and number of voids make the internal composition of porous asphalt mixtures vary widely, which can also be called porous asphalt mixtures have different void patterns, but different void patterns will have different degrees of impact on the performance of asphalt mixtures.
First, four models with the same gradation and void shapes of sphere, n-octahedron, n-dodecahedron, and n-hexahedron are established, and the X-direction strain cloud diagrams of each model after the loading calculation are shown in Figure 3, and the values of each strain are shown in Figure 4.
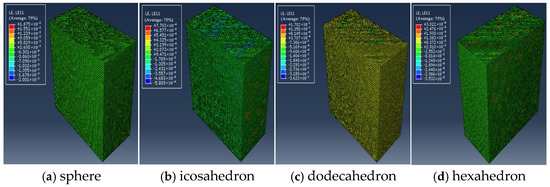
Figure 3.
X-direction strain cloud images of four different void shape models.
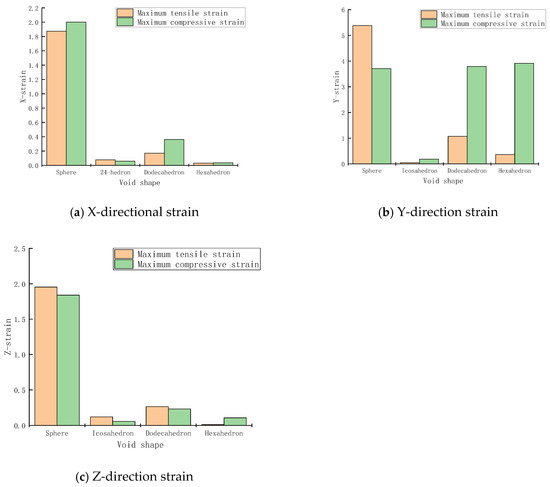
Figure 4.
X, Y, Z strain histograms of four different void shape models.
From Figure 4, it can be found that the tensile strain is less than the compressive strain for the four different void shape models in the X- and Y-directions. Starting from the icosahedron, as the number of polyhedral prisms decreases, the compressive strain in the Y-direction also increases with decreasing number of edges in the void model, in which the compressive strain increases about 20 times from the icosahedron to the dodecahedron. To deeply analyze the trend of the strain, the maximum values of the tensile and compressive strains in the X-, Y-, and Z-directions were regressed and are shown in Figure 5.
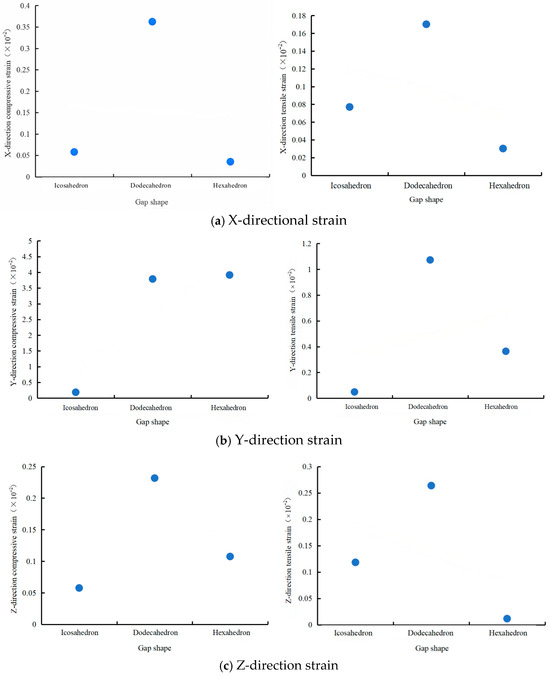
Figure 5.
Individual strain cases for the icosahedral-hexahedral model.
From the above comparison results, it is easy to observe that the maximum tensile and compressive strains in the Y-direction, along with the maximum compressive strains in the Z-direction, increase as the number of polyhedral prisms decreases. The remaining maximum tensile and compressive strains in the X-direction and the maximum tensile stress in the Z-direction exhibit a decreasing trend. However, since the above maximum strain values only refer to the changes at each point in the model, to see the changes in the overall model, it is necessary to use the highest displacement vectors of the three models with different void shapes to characterize the total vertical changes in the models under standard axial loads. As an example, the displacement vectors in the top Y-direction of the icosahedron, dodecahedron, and hexahedron void models are shown in Figure 6.
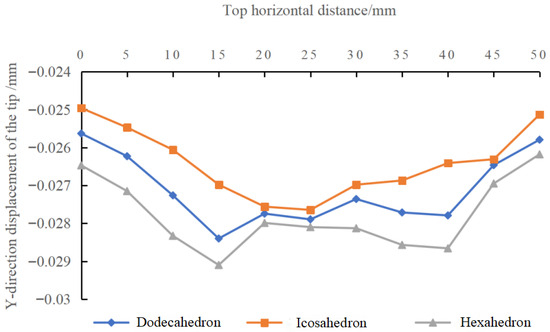
Figure 6.
Sum of the displacement vectors in the Y-direction of the top three models of the void shape.
The different positions indicated along the horizontal position of the tip indicate the unevenness of the change in the pavement. By observation, it is observed that regardless of the shape of the voids, the change at the two ends is always smaller than that in the central part. However, mainly because the test simulates a uniaxial situation, both the left and right sides are constrained and, consequently, their deformation is also affected. From the icosahedron to the hexahedron, the trend of the change in the displacement in the Y-direction of the tip is roughly similar for all models as the horizontal distance from the tip increases. Starting from the icosahedron, the magnitude of the deformation slowly increases as the number of polyhedral void prongs decreases, with the hexahedral void model having the largest deformation. Therefore, it can be inferred that the deformation of the fine-view void model increases as the number of polyhedral prongs decreases.
Again, to make the pattern more obvious, the icosahedron and hexahedron void models were taken separately to compare the cloud plots at the places of maximum strain. As seen in Figure 7, the strains at the edges of the voids, as well as between the voids and the voids, are somewhat larger than elsewhere for both the icosahedron and the hexahedron. In addition, comparing Figure 7a,b still shows that the tip strain of the voids increases a lot due to the fact that the corners of the ortho-hexahedron voids are a little more sharply defined, which indicates that the tip responds sharply to the mechanical properties of the porous asphalt mixtures with a considerable effect.
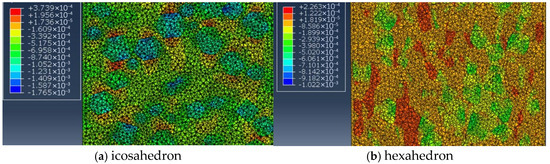
Figure 7.
Partial strain cloud diagrams of tetrahedral and hexahedral void models.
The path A-A of the modeled icosahedral void is established, and the X-, Y-, and Z-direction strains along this path are shown in Figure 8. Comparing the path A-A plot of the icosahedral void with the strains along this path, it can be seen that, at the two adjacent voids, the X-, Y-, and Z-direction strains all show peaks. It can also be analyzed that the entire icosahedral model produces the maximum Y-directional strain, followed by the X-directional strain, and the minimum Z-directional strain.
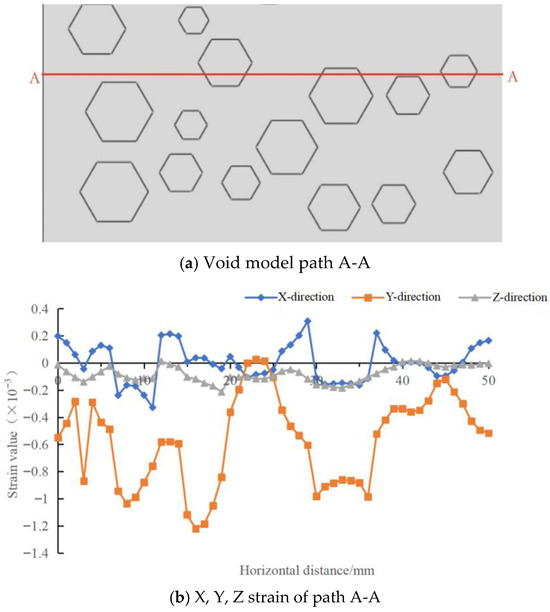
Figure 8.
Twenty-tetrahedral void model path A-A and the strain on this path.
Observation of Figure 8 reveals that, first, the X-direction tensile strain and Y-direction compressive strain vary linearly in each range where the path intersects with each void. Second, the tensile strain of the X-direction at 30 mm and the compressive strain of the Y-direction at 18 mm of the path reach the maximum value, and the strain extremes appear at the intersection of the path and the gap edge, which belongs to the case where the two gap corners are adjacent to each other. This implies that the region adjacent to the gap is highly strained and susceptible to damage such as cracking.
3.2. Effect of Void Size on Deformation
Six models with void diameters ranging from 3 to 4 mm, 4 to 5 mm, 5 to 6 mm, 6 to 7 mm, 7 to 8 mm, and 8 to 9 mm were established, and then the strains under standard axial loads were recorded, and strain cloud diagrams of the Y-direction of various models (see Figure 9) and the various strains (see Figure 10) were recorded.
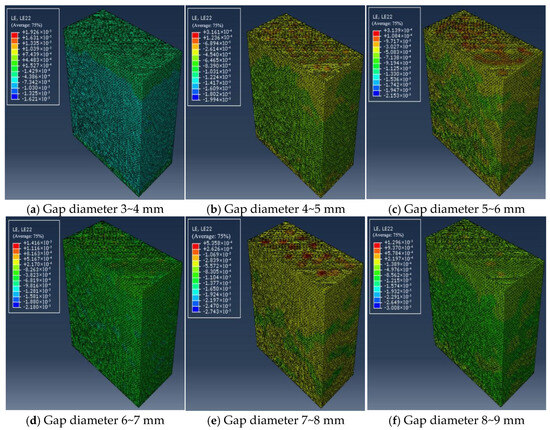
Figure 9.
Y-direction strain cloud diagrams of six models with different gap diameters.
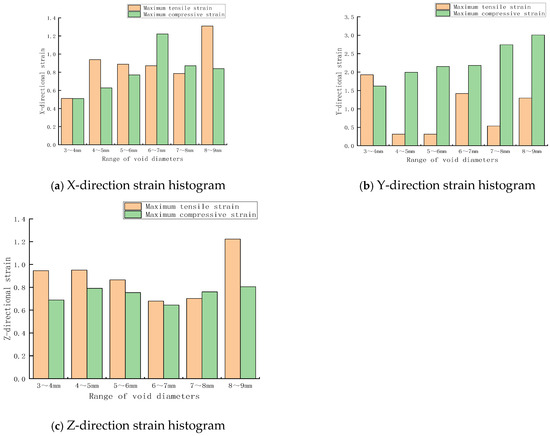
Figure 10.
Histogram of maximum strain in X-, Y-, and Z-directions of models with different gap ranges.
Comparing (a), (b), and (c) in Figure 10, it is easy to see that the overall trend of X- and Y-directional strains increases with the increase in the void diameter. Among them, the compressive strain in the X-direction removes the compressive strain of the model with a gap range of 6~7 mm, and the rest of them are steadily increasing with an increase in the gap diameter range. As the diameter of the voids increases, the effective bearing area continuously decreases, the stability of the skeleton constantly drops, and the bonding performance of the asphalt mortar declines, resulting in a linear decrease in the material’s resistance to compression. Therefore, the compressive strain steadily rises. The tensile strain in the Y-direction is much smaller than the compressive strain, which is also due to the fact that the asphalt mixture model is subjected to the action of the vertical direction load. The Z-direction deformation, except for the tensile deformation in the model with a gap range of 8~9 mm, is a little higher, and the rest of them are similar in size. The tensile and compressive strains are similar in size, and the rest of them are similar in value. The Z-direction strain, except for the 8~9 mm gap range model, which has a slightly higher value of tensile strain, the rest of the tensile and compressive strains are similar in size, without an obvious pattern of change.
3.3. Effect of Void Ratio on Deformation
The void ratio is modeled as 18%, 19%, 20%, 21%, and 22%, and the strain results are shown in Figure 11 and Figure 12.
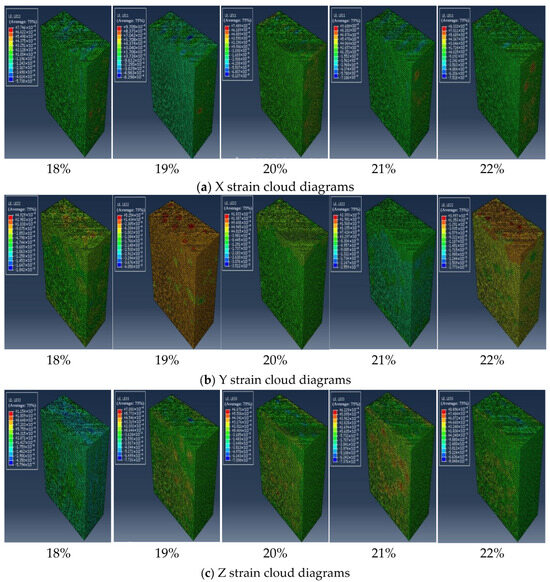
Figure 11.
X, Y, and Z strain cloud diagrams of models with porosity of 18%, 19%, 20%, 21%, 22%.
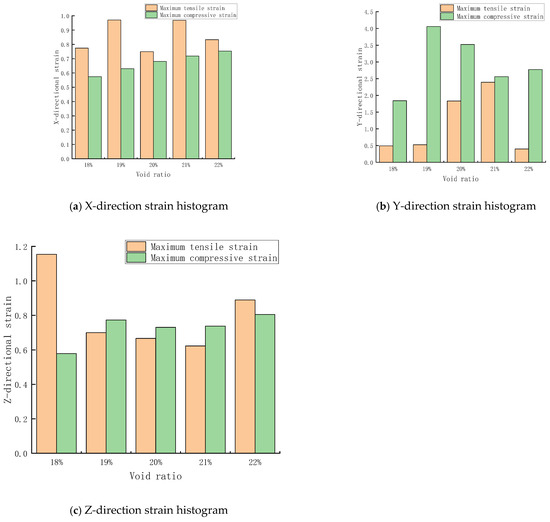
Figure 12.
X, Y, and Z strain histograms of six sets of models in the void range.
From Figure 12, it can be seen that the effect of the size of the void ratio on the X-direction strain is more obvious, and the X-direction strain increases linearly with the increase in the void ratio; then we look at the compressive strain of the Y-direction, the maximum compressive strain of the model with 18% void ratio is the smallest, which is 1.842 × 10⁻³, and the maximum compressive strain is the model with a void ratio of 19%, which is 4.058 × 10⁻³, and more than doubled; finally, the effect of the void ratio on the maximum compressive strain of the Z-direction is not very large, and the magnitudes are similar for models with different void ratios. Figure 13 depicts the vertical deformation plots (also called top displacement vector sums) for different models of the void ratio.
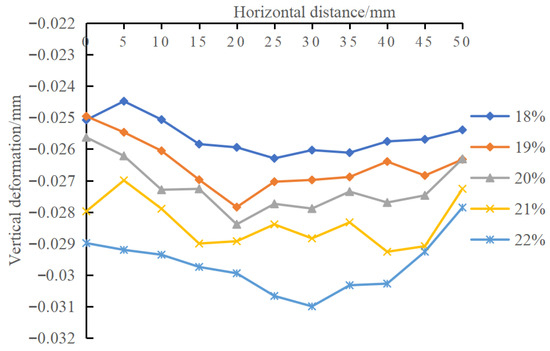
Figure 13.
Top vertical deformation map with different void ratios.
The results show that the vertical deformation of the model increases with the increase in void ratio, and the vertical deformation of the model also increases from −0.026 to −0.031 when the void ratio increases from 18% to 22%, and the trend of the vertical deformation at the top of the different void ratios is more or less the same, except that the change in the sum of the top displacement vectors of the models of the remaining void ratios starts to fluctuate abnormally after the void ratio increases to 21%. Therefore, it can be concluded that the deformation of porous asphalt mixtures increases with increasing void ratio, and the 18% void ratio model has the smallest vertical deformation but the best mechanical properties.
4. Results: Mechanical Properties in Relation to Void Morphology
4.1. Effect of Void Shape on Mechanical Properties
The simulation study is carried out for four different shapes of void models with the same gradation. The void shapes are spherical, icosahedral, dodecahedral, and hexahedral, and their anisotropic stress clouds are shown in Figure 14, and the values of stress magnitude for each model are shown in Figure 15.
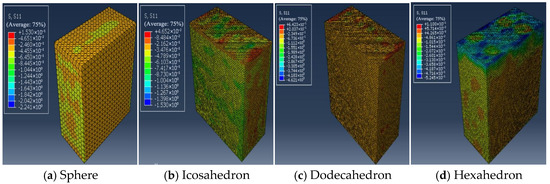
Figure 14.
X-direction stress cloud images of four different void shape models.
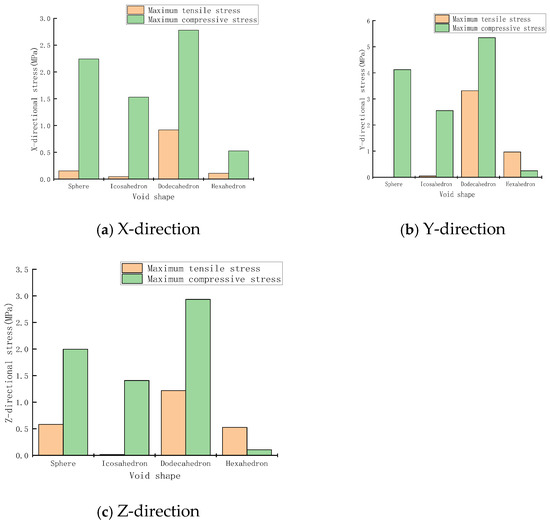
Figure 15.
The histogram of the maximum stress in the X-, Y-, and Z-directions of four different void shape models.
In Figure 14, it can be seen that the stress extremes appear in the middle of the neighboring voids, and the closer the voids are to each other, the stronger the stress response. In Figure 15, the maximum pressure value in the Y-direction appears in the void model with a dodecahedron shape, with a value of 5.349 MPa, and the minimum value appears in the void model with an icosahedron shape, with a value of 2.552 MPa. Obviously, both 5.349 MPa and 2.552 MPa are much larger than the standard axial load of 0.7 MPa. This also indicates that the analysis of porous asphalt mixtures from a detailed point of view has a strong influence on the response to stress. Perspective analysis has a great influence on the mechanical properties of porous asphalt mixtures. Figure 16 depicts the compressive stress in the X-direction and its comparison results for each model with different void shapes.
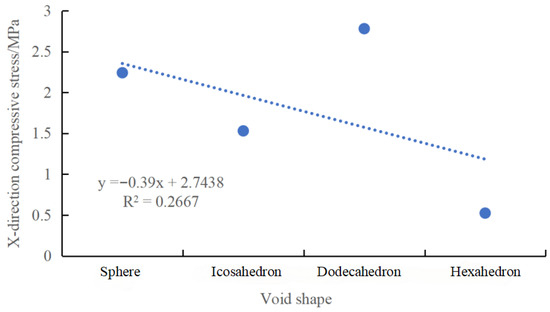
Figure 16.
The relationship between the void shape and compressive force of the X-direction stress and its regression results.
Combining Figure 15 and Figure 16, it is not difficult to find that porous asphalt mixtures have a significant mechanical response to the change in void shape. Specifically, as the number of void edges decreases, the compressive stress in the X-direction of different models of the shape of the void shows a linear decreasing trend, while the change in the compressive stress in the Y-direction is also quite significant. These observations further confirm the important influence of the shape of the void on the mechanical properties of porous asphalt mixtures.
To investigate in depth the specific effects of void shapes on the mechanical properties of porous asphalt mixtures, we chose an icosahedral void model as the research object and set specific research paths on it. These paths include horizontal paths A′-A′ shown in Figure 17 and vertical paths B′-B′ shown in Figure 18.
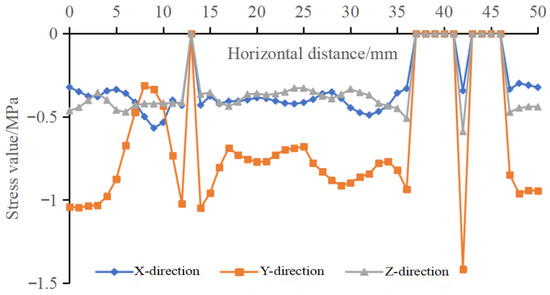
Figure 17.
Twenty-tetrahedral void model path A′-A′ and stress on this path.
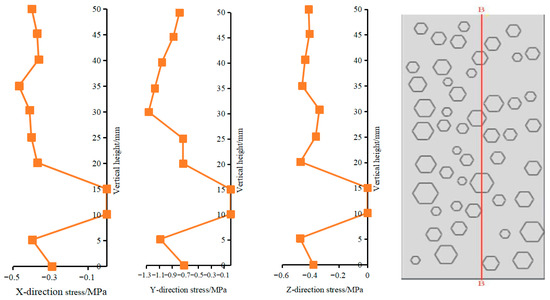
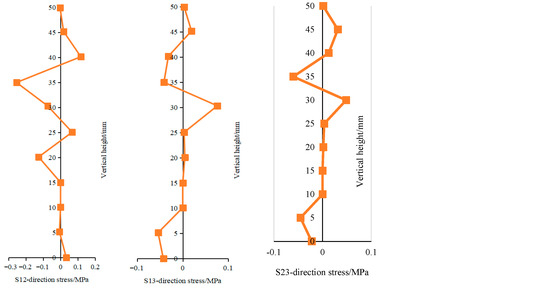
Figure 18.
Stress in all directions on path B-B.
Looking at and analyzing Figure 17 carefully, it is not difficult to find that the stress extremes always appear at the locations where paths A-A are in contact with each void, in which the Y-directional compressive stress at the adjacent corners of two different voids even reaches 1.416 MPa. The remaining paths are in contact with each void range, and the changes in X- and Y-directional stresses are mostly manifested as the linear compressive stress.
The comparative analysis of Figure 18 shows that, first, as in the analysis of paths A-A above, the stress extremes on paths B-B all occur at the locations where the paths are in contact with each void edge. Second, the stresses on the path B-B in both the x-direction and the y-direction exhibit linear compressive stresses. Obviously, the damage-prone areas in porous asphalt mixtures are the sharp edges of the voids.
4.2. Effect of Void Size on Mechanical Properties
The X-direction stress clouds for the icosahedral void model with different sizes are shown in Figure 19, and the stress data in each direction are shown in Figure 20.
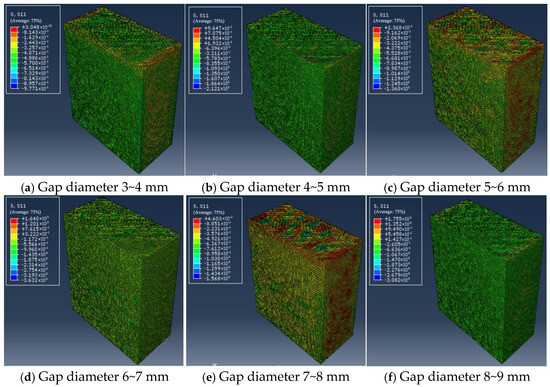
Figure 19.
The stress cloud diagram in the x-direction of a tetrahedral void model with the same void ratio and different diameter ranges.
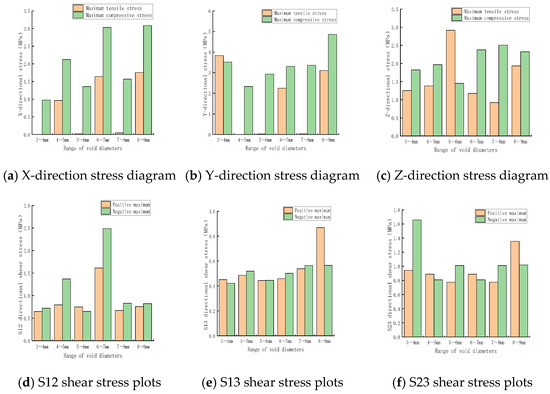
Figure 20.
Histograms of the X-, Y-, and Z-directions and maximum shear stress of the tetrahedral. void models with different diameter ranges.
4.3. Effect of Void Ratio on Mechanical Properties
The shear stress clouds for the models with voids of 18%, 19%, 20%, 21%, and 22% are shown in Figure 21, and the stresses for each model are shown in Figure 22.
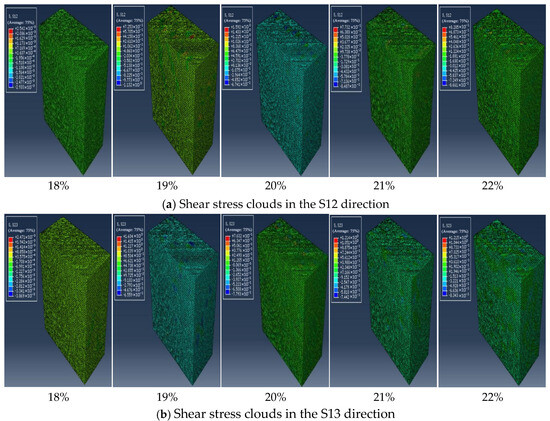
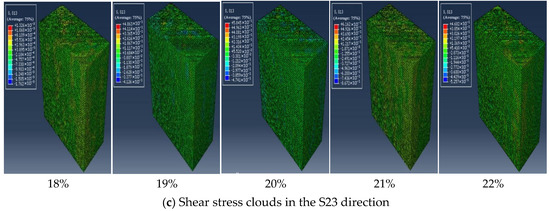
Figure 21.
Shear stress contours of models with different porosity.
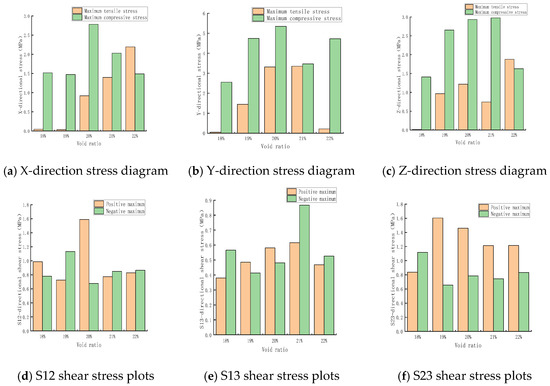
Figure 22.
Histogram of the X-, Y-, and Z-directions, and maximum shear stress of models with different porosities.
Via a comprehensive analysis of the above graphs, it can be found that the 18% void ratio model has the least force in all directions, i.e., the best mechanical properties.
5. Discussion
This study numerically investigated the mesoscale mechanical response of porous asphalt mixtures as a function of void morphology. The key finding—that an icosahedral void shape with a diameter of 3–4 mm and 18% void ratio yields optimal mechanical performance—can be discussed in light of existing literature.
First, regarding the finding of the optimal void shape (icosahedron), although precise control of void geometry is challenging in actual production, this result highlights the importance of reducing sharp edges and corners in order to alleviate stress concentration. This aligns with the conclusions of numerous studies that emphasize the beneficial effect of void roundness on durability [13,21]. The icosahedron, with its larger number of faces and more uniform curvature, can be considered as an “idealized” approximation of a smooth polyhedral void.
Second, concerning the optimal void size (3–4 mm) and void ratio (18%), our simulations indicate that smaller voids can reduce local strain concentration while maintaining a relatively high void ratio. This agrees with the phenomenon often observed in experimental studies, where smaller interconnected voids provide a better balance between drainage capacity and strength [5,9]. However, the actual void size distribution in real mixtures is continuous. Future models should consider realistic distributions obtained from CT images [12,15].
Third, the Monte Carlo + ABAQUS modeling approach adopted in this study shows consistent predictive trends with other similar studies [24,25], such as the decrease in stiffness with increasing void ratio. Nevertheless, our work further quantifies the coupled influence of shape and size, providing more detailed guidance for microstructural design.
Limitations: The model simplifies the matrix as linear elastic, neglecting the viscoelastic and damage evolution behavior of asphalt. The void shapes are regular geometric bodies, differing from real irregular shapes. The aggregate–mortar interface is not explicitly modeled. These simplifications may affect quantitative accuracy, but the qualitative trends should align with the underlying physical mechanisms. While direct shape control is infeasible, mix design and compaction practices that promote aggregate rearrangement and mastic flow (e.g., using rounded aggregates, optimal binder viscosity) can indirectly encourage the formation of less angular, more favorable void networks.
Practical Implications: The findings suggest that during mix design and compaction processes, efforts should be made to avoid creating sharp and large-sized voids. Gradation optimization should be pursued to promote the formation of a more rounded, uniformly distributed, small-void structure, thereby enhancing the mixture’s resistance to deformation and damage. For example, adjusting aggregate angularity or using modified asphalt to improve coating may indirectly foster more favorable void morphology.
Future Research: Future studies could integrate CT scanning to acquire statistical parameters of real void morphology, driving more realistic stochastic models; introduce viscoelastoplastic constitutive models to simulate time-dependent behavior; and conduct parallel experimental validation, particularly using techniques like digital image correlation to measure local strain fields.
6. Conclusions
- (1)
- Among the four different void shapes modeled, the maximum strain values increased as the number of void edges decreased. Tensile strains were consistently lower than compressive strains. The compressive strain in the Y-direction increased notably with fewer edges, while tensile and compressive strains in the X- and Y-directions exhibited linear trends, aligned with stress concentration effects at sharper void corners. Reducing void sharpness (i.e., promoting more rounded, less angular void geometries) is beneficial for mechanical performance.
- (2)
- Both tensile and compressive strains in the X-direction increased with void ratio. The compressive strain in the Y-direction also rose with void ratio, whereas the tensile strain in the Y-direction changed only slightly over the 18%–22% range, indicating a weaker sensitivity to void ratio.
- (3)
- The model with icosahedral voids, a void diameter range of 3–4 mm, and a void ratio of 18% exhibited the most favorable mechanical performance in terms of minimized stress concentration, lower overall deformation, and higher stiffness retention. This configuration represents a micromechanical design goal for enhancing the durability of porous asphalt mixtures.
Practical Implications and Future Work: The findings provide a mesoscale rationale for material design: reducing void sharpness and controlling void size distribution can improve mechanical performance without sacrificing drainage capacity. For industry, this implies that attention to aggregate shape, compaction uniformity, and binder properties that promote smoother void walls could yield longer-lasting porous pavements. Future studies should integrate real void morphology from CT scans, incorporate viscoelastic and damage models, and validate predictions through coordinated experimental testing.
Author Contributions
H.W. (Hongchang Wang): conceptualization, formal analysis, project administration, writing—review and editing; H.W. (Haozhe Wu): data analysis, methodology, writing—original draft, C.L.: visualization, writing—original draft. All authors have read and agreed to the published version of the manuscript.
Funding
This research received no external funding.
Institutional Review Board Statement
Not applicable.
Informed Consent Statement
Not applicable.
Data Availability Statement
All data, models, and codes generated or used in this study are included in the submitted manuscript.
Acknowledgments
The authors would like to express sincere gratitude to all organizations that supported this research.
Conflicts of Interest
The authors declare no conflicts of interest.
References
- Ramadhansyah, P.J.; Masri, K.A.; Mangi, S.A.; Yusak, M.M.; Mashros, N.; Warid, M.M.; Satar, M.K.; Haziman, W.M. Strength and Porosity of Porous Concrete Pavement Containing Nano Black Rice Husk Ash. IOP Conf. Ser. Mater. Sci. Eng. 2020, 712, 012037. [Google Scholar] [CrossRef]
- Ma, X.; Li, Q.; Cui, Y.C.; Ni, A.Q. Performance of porous asphalt mixture with various additives. Int. J. Pavement Eng. 2018, 19, 355–361. [Google Scholar] [CrossRef]
- Wu, H.; Chu, Y.; Gu, X.; Tang, J. Multilevel Characterization of Bonding Strength of High Viscosity Modified Asphalt Mortar and Its Correlation with Failure Forms of Porous Mixtures. Build. Struct. 2023, 53, 1390–1398. [Google Scholar]
- Yan, B.; Yao, B. Research on Aggregate Skeleton Optimization of Porous Asphalt Mixture Based on Discrete Element Method. Highway 2025, 70, 14–21. [Google Scholar]
- Gu, H. Research on the Influence of Coarse Aggregate Texture on the Road Performance of Steel Slag Porous Asphalt Mixture. Hunan Commun. Sci. Technol. 2023, 49, 65–68+73. [Google Scholar]
- Ma, X.; Hu, X.Q.; Zhou, P.S. Internal structure changes within porous asphalt mixture with different saturation under vertical repeated load. Constr. Build. Mater. 2023, 372, 130727. [Google Scholar] [CrossRef]
- Li, J.; He, Z.; Guan, Z. Construction of a physical model for the void ratio of mineral aggregates in porous asphalt mixtures. J. Harbin Inst. Technol. 2022, 54, 139–147. [Google Scholar]
- Ji, X.; Wang, H. Microscopic Void Characteristics Laws of Porous Asphalt Mixture Based on Digital Image Processing Technology. J. China Foreign Highw. 2018, 38, 257–261. [Google Scholar]
- Radzi, N.A.; Masri, K.A.; Ramadhansyah, P.J.; Jasni, N.E.; Arshad, A.K.; Ahmad, J.; Mashros, N.; Yaacob, H. Stability and Resilient Modulus of Porous Asphalt Incorporating Steel Fiber. IOP Conf. Ser. Mater. Sci. Eng. 2020, 712, 012027. [Google Scholar] [CrossRef]
- Shahnewaz, S.M.; Masri, K.A.; Ghani, N.A.; Jaya, R.P.; Choo, C.S.; Giannakopoulou, P.P.; Rogkala, A.; Lampropoulou, P.; Petrounias, P. Porous asphalt mixtures enriched with bamboo fibers as a new approach for future sustainable construction. Constr. Build. Mater. 2023, 407, 133456. [Google Scholar] [CrossRef]
- Yang, X.; You, Z.; Wang, Z.; Dai, Q. Review on heterogeneous model reconstruction of stone-based composites in numerical simulation. Constr. Build. Mater. 2016, 117, 229–243. [Google Scholar] [CrossRef]
- Qian, N.; Wang, D.; Li, D.; Shi, L. Three-dimensional mesoscopic permeability of porous asphalt mixture. Constr. Build. Mater. 2020, 236, 117430. [Google Scholar] [CrossRef]
- Zhao, Y.; Wang, X.; Jiang, J.; Zhou, L. Characterization of interconnectivity, size distribution and uniformity of air voids in porous asphalt concrete using X-ray CT scanning images. Constr. Build. Mater. 2019, 213, 182–193. [Google Scholar] [CrossRef]
- Zhu, R.; Kang, A.; Zhang, Y.; Zhi, W.; Zhu, L. Feasibility Study of Discrete Element Numerical Simulation Technology-Based Microscopic Model for Asphalt Mixtures. Jiangsu Build. Mater. 2023, 6, 31–34. [Google Scholar]
- Xu, H.; Shi, H.; Tan, Y. Investigation and Characterization of 3DVoid Mesostructures in Asphalt Mixtures. China J. Highw. Transp. 2020, 33, 210–220. [Google Scholar]
- Xu, H.; Shi, H.; Tan, Y. Review on Genome Research on Microscopic Structural Characteristics of Asphalt Concrete. Chin. J. Nat. 2020, 42, 249–261. [Google Scholar]
- Kutuk-Sert, T.; Ozturk, M.; Kutuk, S. Digital image processing of warm mix asphalt enriched with nanocolemanite and nanoulexite minerals. Constr. Build. Mater. 2023, 399, 132542. [Google Scholar] [CrossRef]
- Kutuk, S.; Kutuk-Sert, T. An examination of nanoparticle colemanite mineral added warm mix asphalt. Constr. Build. Mater. 2020, 243, 118252. [Google Scholar] [CrossRef]
- Zhao, Y.; Jiang, L.; Jiang, J.; Ni, F. Accuracy Improvement for Two-Dimensional Finite-Element Modeling while Considering Asphalt Mixture Meso-Structure Characteristics in Indirect Tensile Test Simulation. J. Mater. Civ. Eng. 2020, 32, 04020275. [Google Scholar] [CrossRef]
- Wang, Z.; Xie, J.; Gao, L.; Liu, M.; Liu, Y. Improvement of acoustic model and structural optimization design of porous asphalt concrete based on meso-structure research. Constr. Build. Mater. 2020, 265, 120327. [Google Scholar] [CrossRef]
- Kollmann, J.; Lu, G.; Liu, P.; Xing, Q.; Wang, D.; Oeser, M.; Leischner, S. Parameter optimisation of a 2D finite element model to investigate the microstructural fracture behaviour of asphalt mixtures. Theor. Appl. Fract. Mech. 2019, 103, 102319. [Google Scholar] [CrossRef]
- Wang, D.; Liu, P.; Xu, H.; Kollmann, J.; Oeser, M. Evaluation of the polishing resistance characteristics of fine and coarse aggregate for asphalt pavement using Wehner/Schulze test. Constr. Build. Mater. 2018, 163, 742–750. [Google Scholar] [CrossRef]
- Yang, B.; Li, H.; Zhang, H.; Xie, N.; Zhou, H. Laboratorial investigation on effects of microscopic void characteristics on properties of porous asphalt mixture. Constr. Build. Mater. 2019, 213, 434–446. [Google Scholar] [CrossRef]
- Cao, P.; Jin, F.; Changjun, Z.; Feng, D. Investigation on statistical characteristics of asphalt concrete dynamic moduli with random aggregate distribution model. Constr. Build. Mater. 2017, 148, 723–733. [Google Scholar] [CrossRef]
- Ma, H.; Xu, W.; Li, Y. Random aggregate model for mesoscopic structures and mechanical analysis of fully-graded concrete. Comput. Struct. 2016, 177, 103–113. [Google Scholar] [CrossRef]
- Ma, H.; Song, L.; Xu, W. A novel numerical scheme for random parameterized convex aggregate models with a high-volume fraction of aggregates in concrete-like granular materials. Comput. Struct. 2018, 209, 57–64. [Google Scholar] [CrossRef]
- Wang, Z. Material Design and Performance Simulation Evaluationof UTAC-10 Based on Discrete Element Method. Master’s Thesis, South China University of Technology, Guangzhou, China, 2019. [Google Scholar]
- Chen, C.; Zhang, Q.; Keer, L.M.; Yao, Y.; Huang, Y. The multi-factor effect of tensile strength of concrete in numerical simulation based on the Monte Carlo random aggregate distribution. Constr. Build. Mater. 2018, 165, 585–595. [Google Scholar] [CrossRef]
- Zhang, F.; Teng, X.; Binbin, L. Meso mesoscopic model of asphalt concrete based on random aggregate placement. J. Railw. Sci. Eng. 2019, 16, 1216–1223. [Google Scholar]
- Yuan, P.; Wang, D. Monte Carlo Simulation Analysis of Variability of Mechanical Responses for Asphalt Pavement. J. South China Univ. Technol. (Nat. Sci. Ed.) 2008, 36, 55–63. [Google Scholar]
- Cao, P.; Jin, F.; Feng, D.; Zhou, C.; Hu, W. Prediction on dynamic modulus of asphalt concrete with random aggregate modeling methods and viscoelastic theory. Constr. Build. Mater. 2016, 125, 987–997. [Google Scholar] [CrossRef]
- Xu, Z.J. Monte Carlo Methodology; Shanghai Science & Technology Publishers: Shanghai, China, 1985. [Google Scholar]


Disclaimer/Publisher’s Note: The statements, opinions and data contained in all publications are solely those of the individual author(s) and contributor(s) and not of MDPI and/or the editor(s). MDPI and/or the editor(s) disclaim responsibility for any injury to people or property resulting from any ideas, methods, instructions or products referred to in the content. |
© 2026 by the authors. Licensee MDPI, Basel, Switzerland. This article is an open access article distributed under the terms and conditions of the Creative Commons Attribution (CC BY) license.