Component Characterization
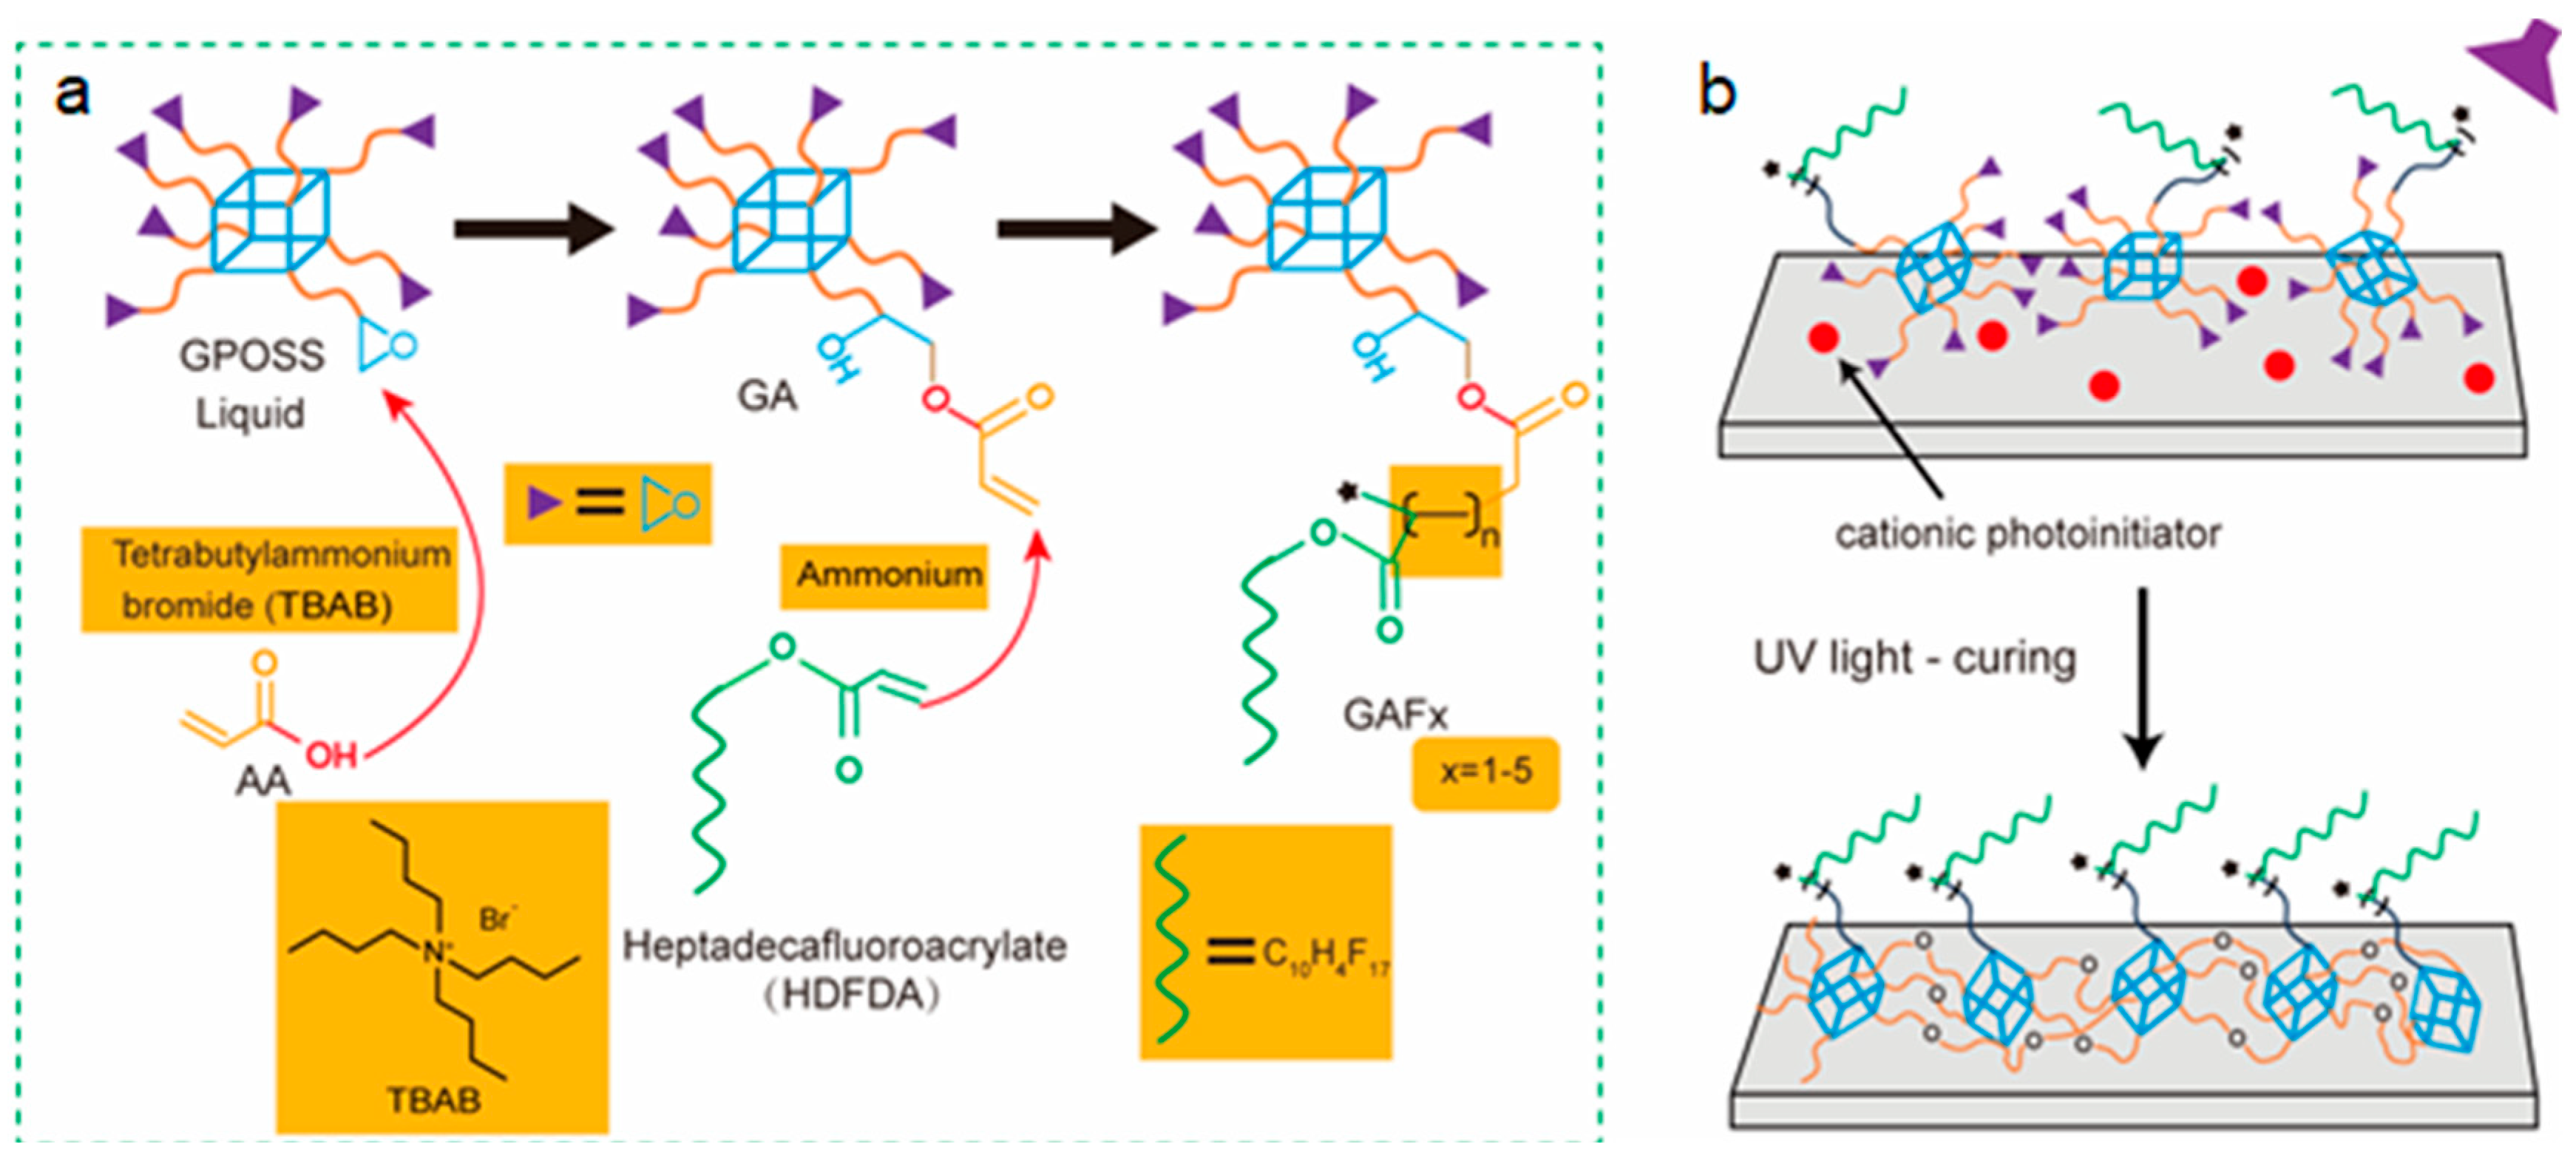
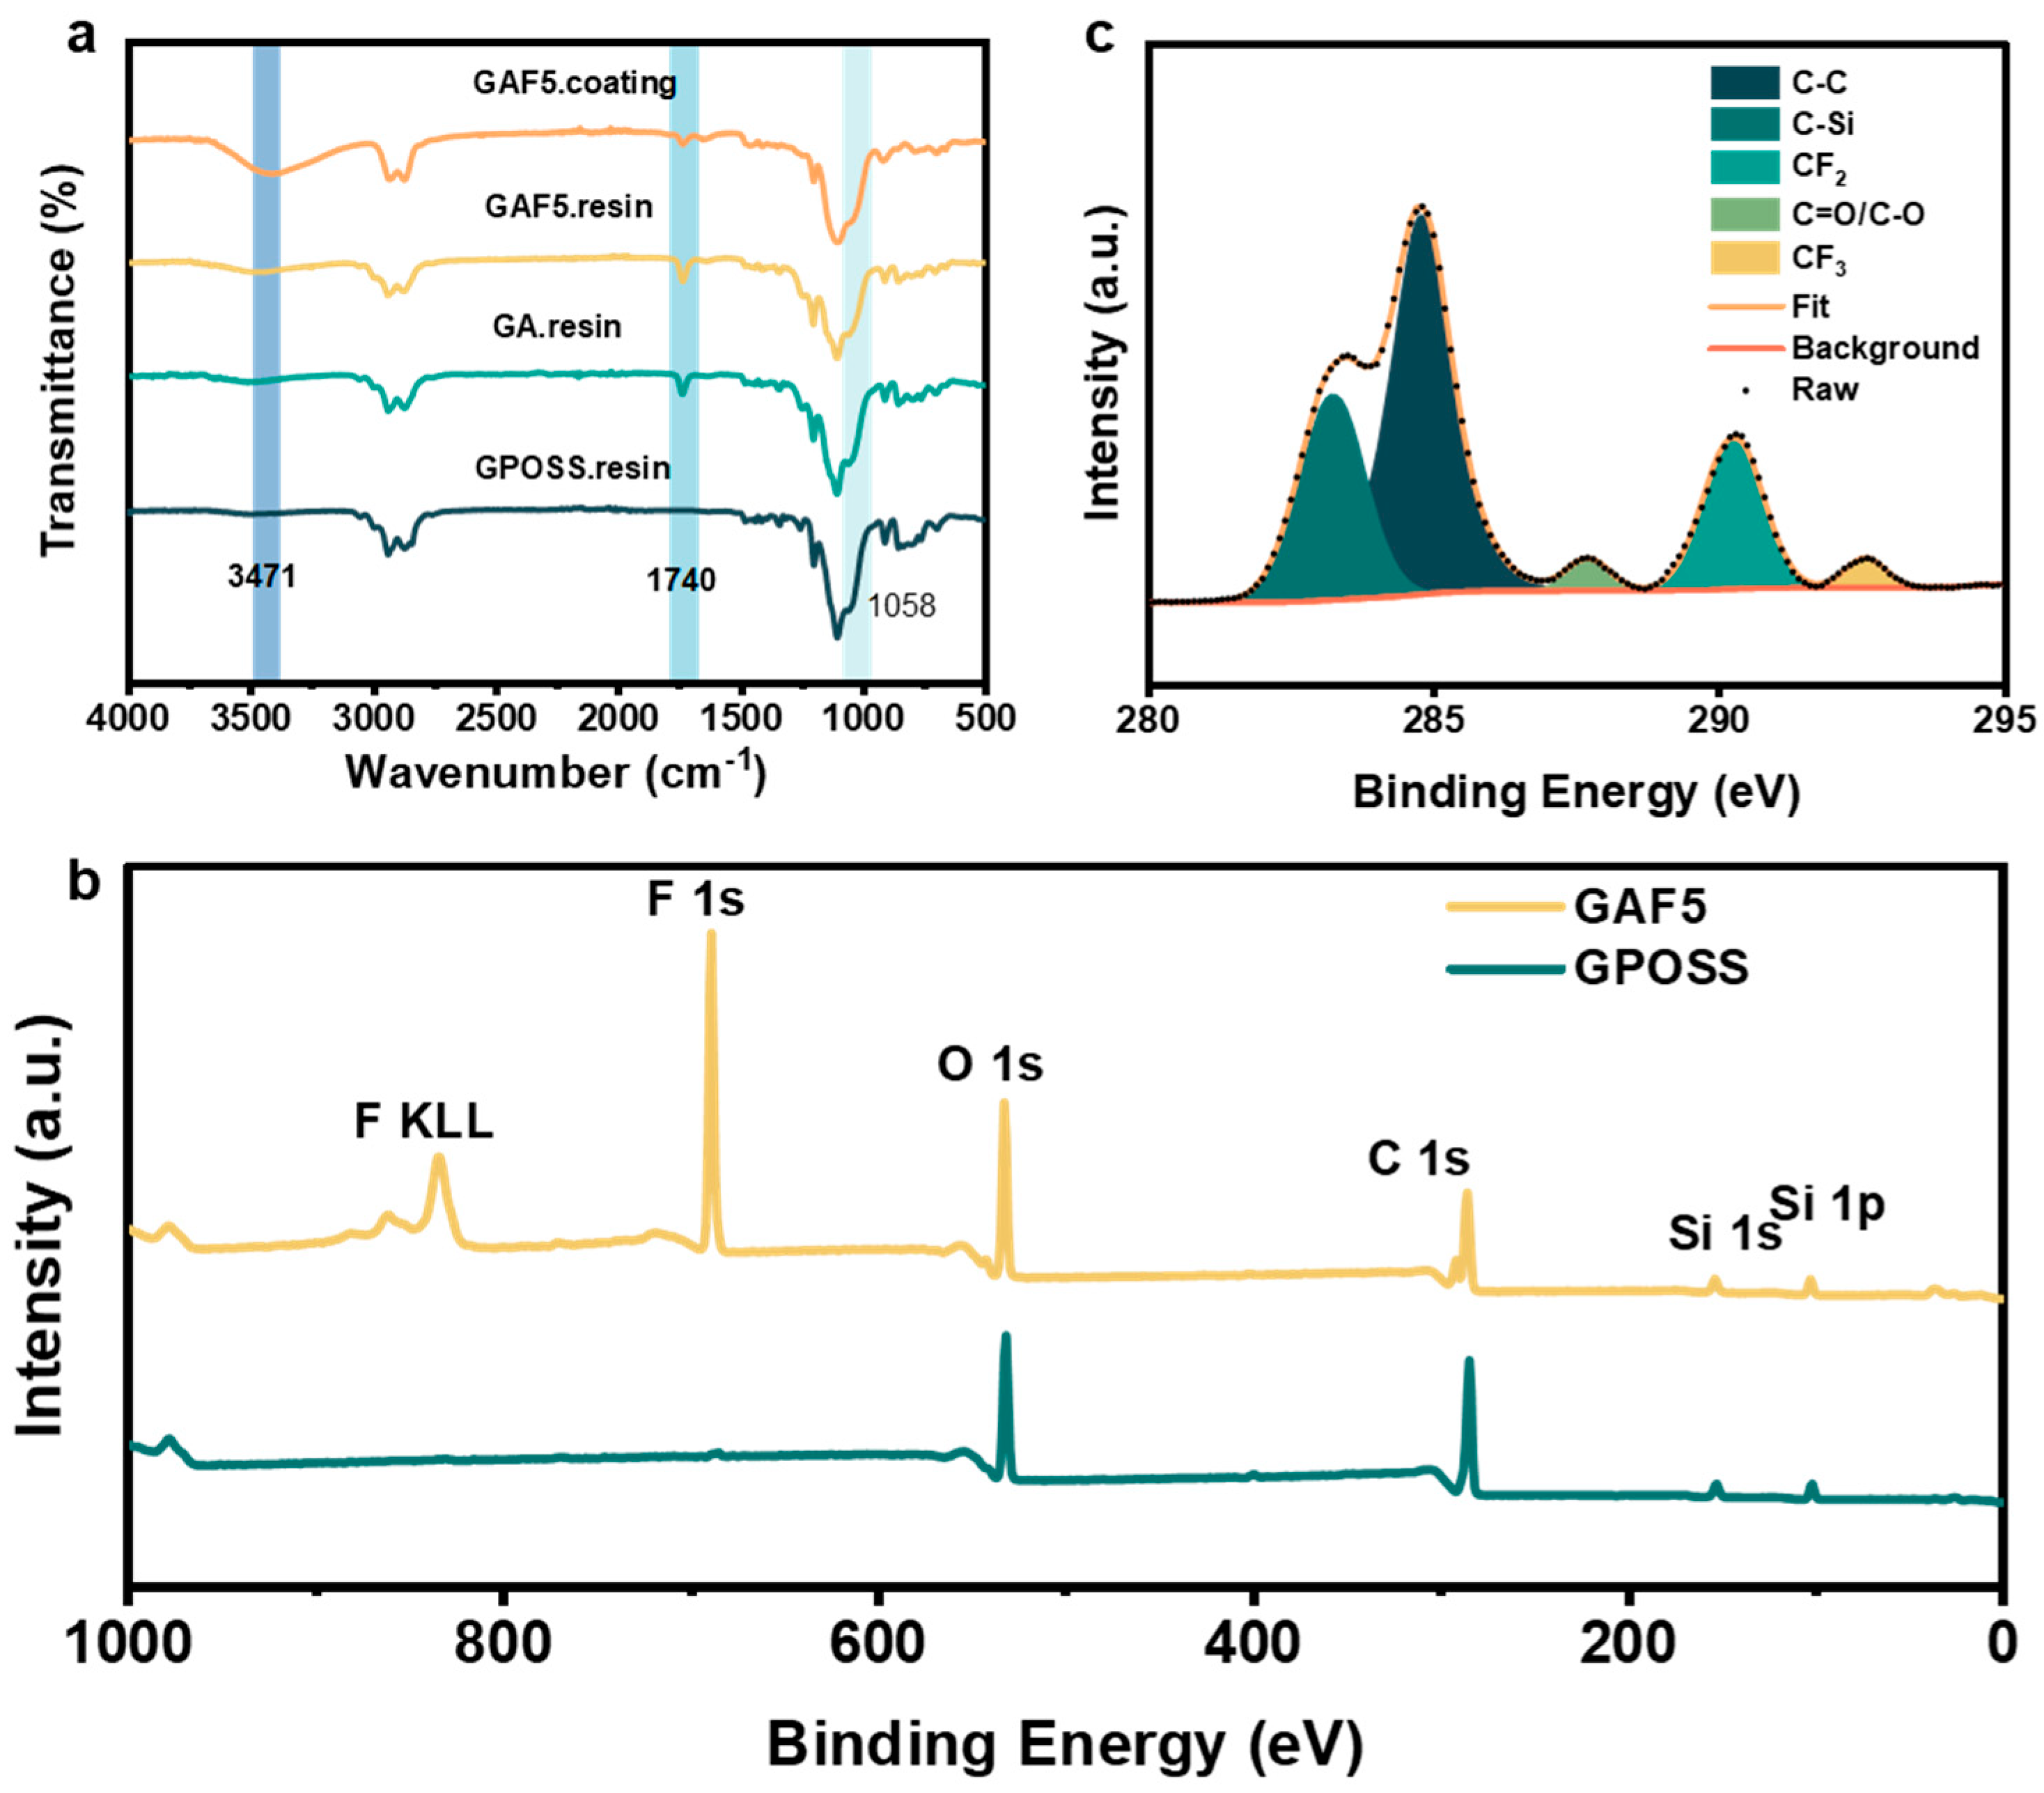
Figure 3a illustrates the FTIR spectra of GPOSS, its intermediate product GA (reaction product of GPOSS with acrylic acid), and the final product GAF5 (highest concentration of fluorinated modified GPOSS). The GPOSS modified with acrylic acid is designated as GA. In comparison to GPOSS, the FTIR spectrum of GA shows new characteristic absorption peaks at 3471 cm
−1 and 1740 cm
−1, corresponding to the O-H and C=O functional groups, respectively. This indicates that the epoxy groups in GPOSS have undergone ring-opening reactions with the carboxyl group of acrylic acid. When comparing GAF5 with GA, no significant differences in the characteristic peaks are observed. The C-F, C-F
2, and C-F
3 characteristic absorption peaks around 670 cm
−1, 1230 cm
−1, and 1200 cm
−1 are obscured by the epoxy characteristic peaks of GPOSS and other overlapping peaks, making them undetectable in the infrared spectrum. Additionally, the comparison of the coating before and after curing is shown in
Figure 3a. At 3420 cm
−1, 1740 cm
−1, and 1058 cm
−1, the characteristic absorption peaks of O-H, C=O and epoxy groups of GAF5 were observed, respectively. After curing, the characteristic absorption peak of O-H of GAF5 increased, and the characteristic absorption peak of epoxy group decreased. To further verify the fluorine modification, XPS characterization was conducted, as illustrated in
Figure 3b. Furthermore, the synthesis of GAF5 was confirmed by nuclear magnetic resonance (
1H NMR), as presented in
Figure S1.
The cured GPOSS coating show strong characteristic elemental peaks for O 1s and C 1s at approximately 532.4 eV and 284.8 eV, respectively. Additionally, the observed peaks at 152.4 eV and 103.6 eV are attribute to Si 2s and Si 2p, respectively. Notably, the cured GAF5 coating displays newly emerged elemental peaks at 689.4 eV and 835.4 eV, corresponding to F 1s signal and F KLL signals. These XPS results confirm the successful synthesis of GAF5.
Based on the analysis of
Figure 3c, the C 1s spectrum of GAF5 can be deconvoluted into five distinct peaks, with binding energies approximately at 283.21 eV, 284.76 eV, 287.70 eV, 290.24 eV, and 292.56 eV. These peaks are, respectively, attributed to C-Si, C-C, C-O/C=O, CF
2, and CF
3 species. The observed spectral features provide compelling evidence that, following the chemical reaction, 1H, 1H, 2H, 2H-perfluorodecyl acrylate successfully reacted with GPOSS.
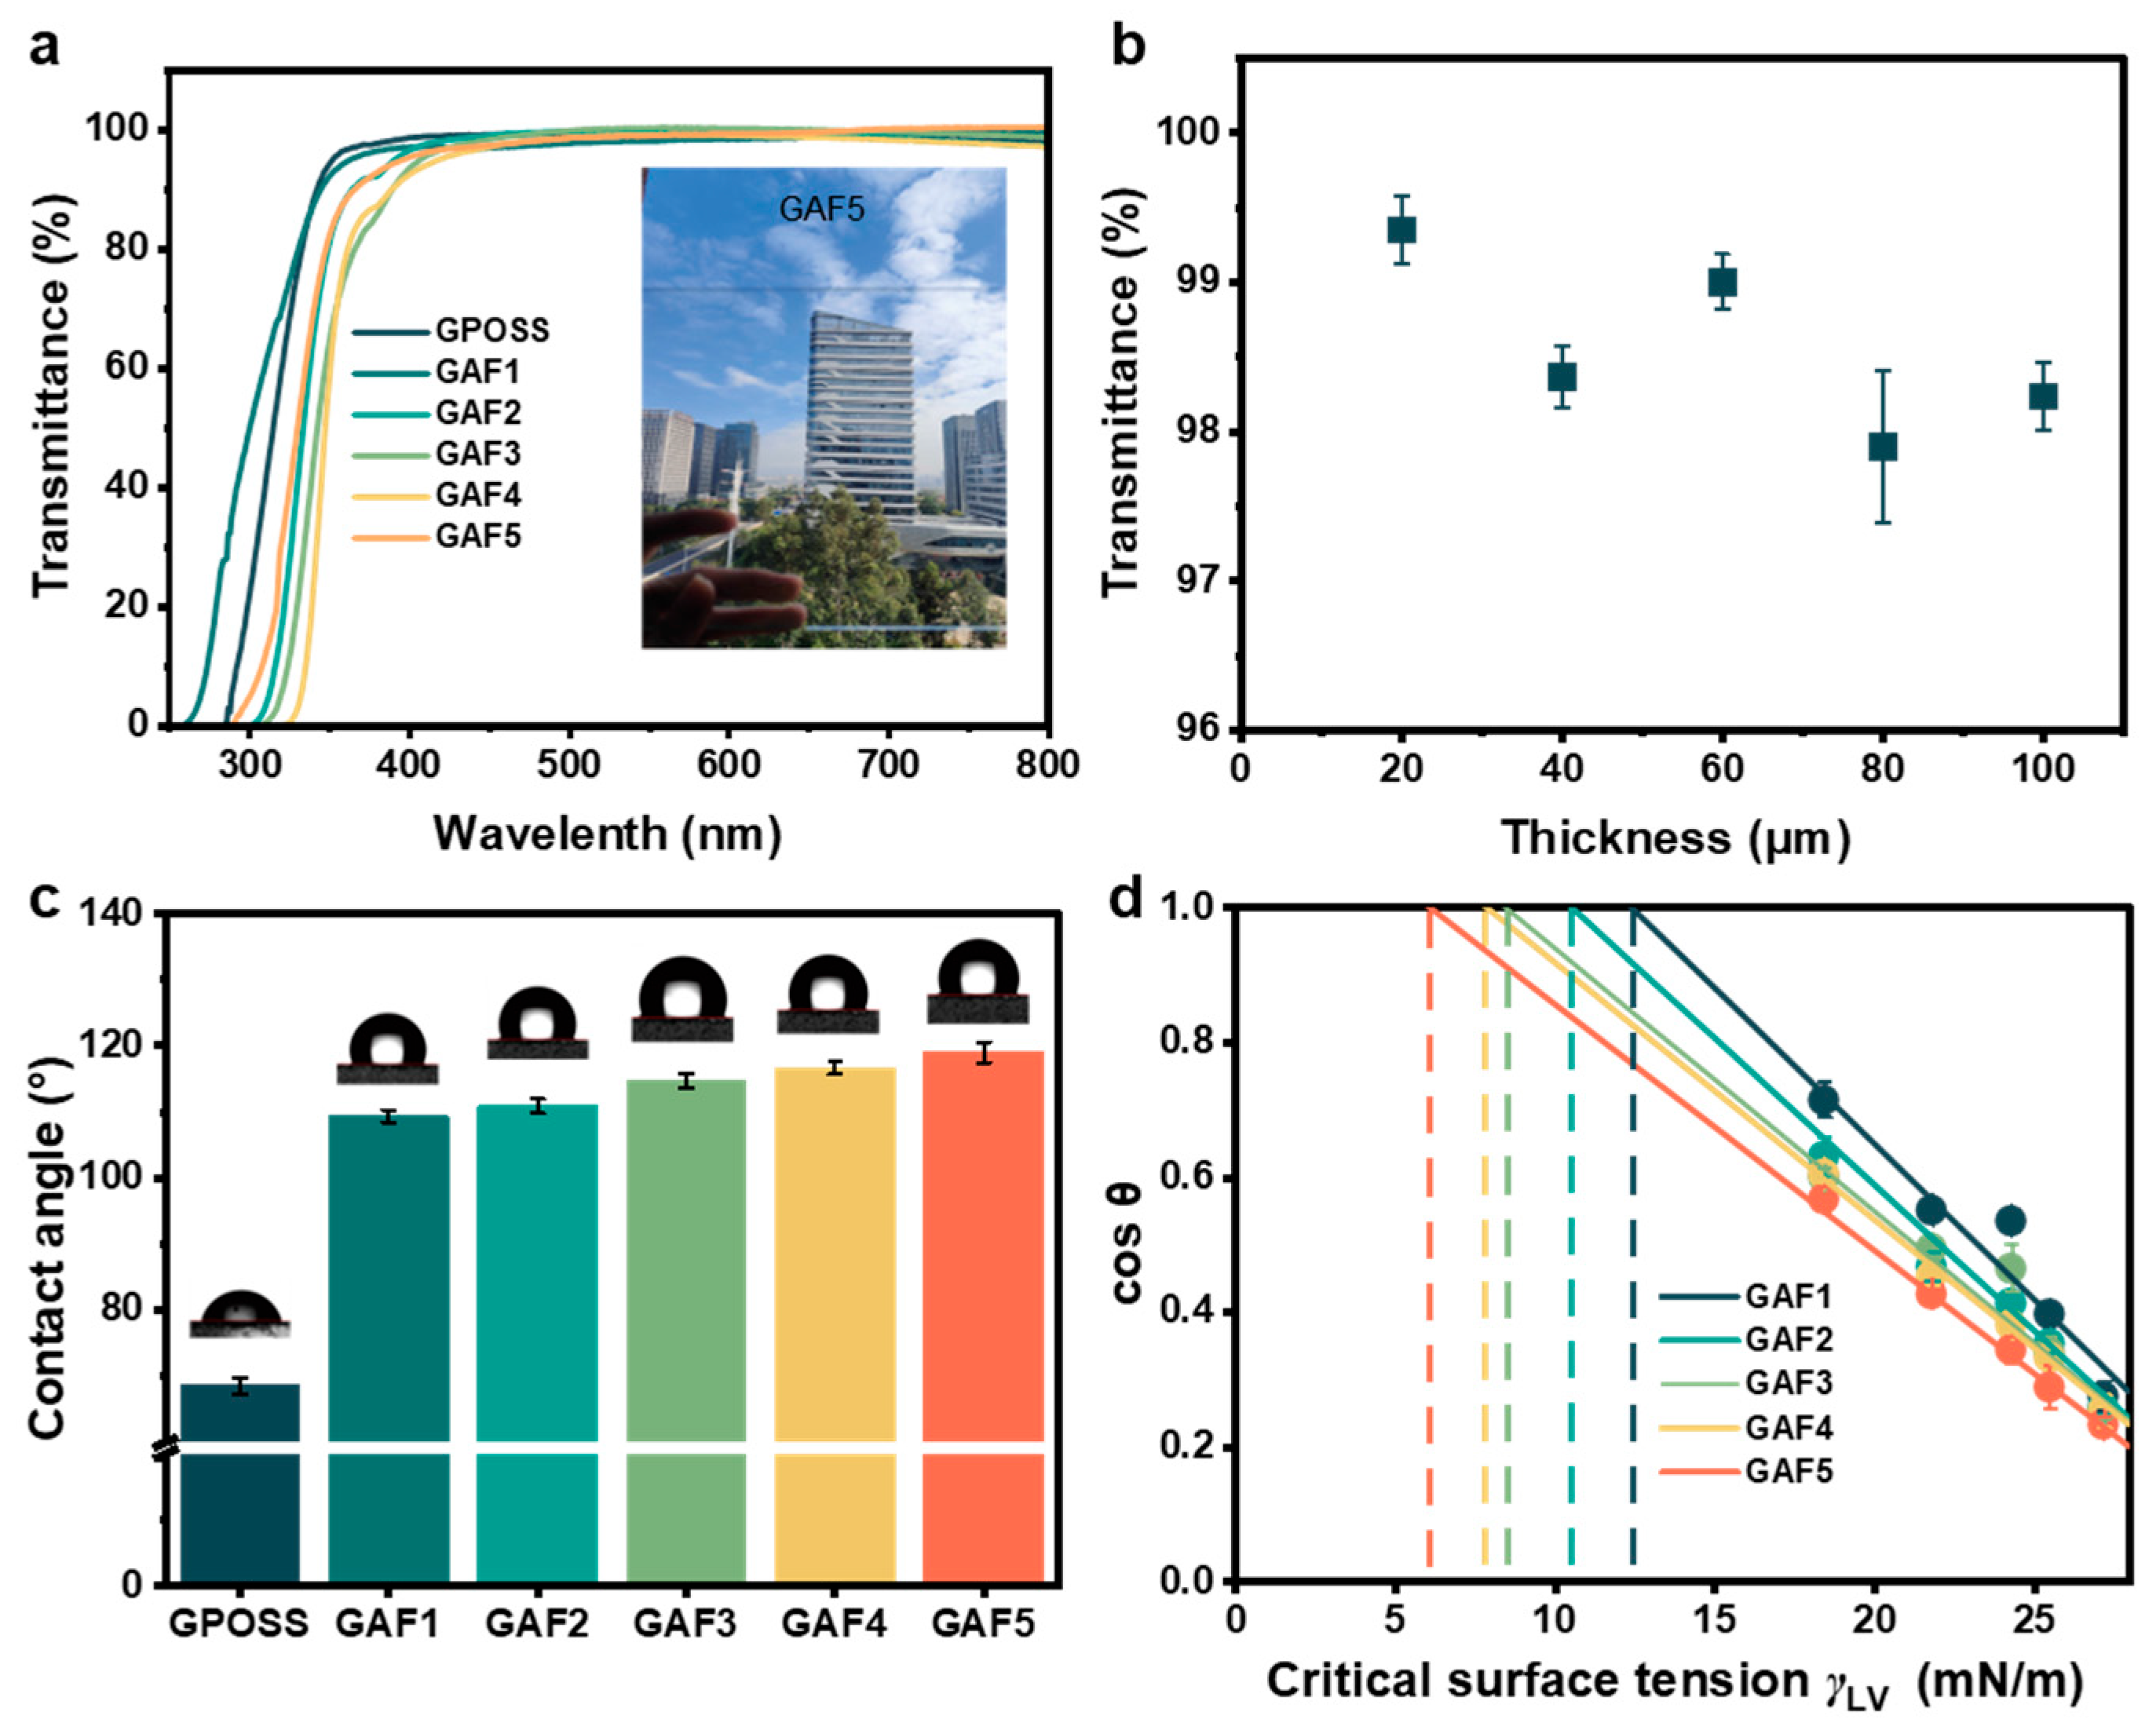
The corresponding UV-vis spectrums are presented in
Figure 4a. It can be observed that within the wavelength range of 400–800 nm, there were no significant differences in the transmittance of these coatings compared to that of the bare glass. Moreover, the transmittance of the coating itself, independent of the glass substrate, was characterized. The obtained results are compiled in
Figure 4a. Furthermore,
Figure 4a shows the variation in transmittance values at a wavelength of 500 nm with respect to the thickness of the GAF5 coating. The transmittance values do not increase with the coating thickness but remain consistently high at 98.4 ± 0.6%, even at a thickness of 100 μm. This result again suggests the uniform distribution of fluorinated GPOSS within the GAF5 coating. From the spectrum, both GPOSS and GAF1-5 coatings exhibit a transmittance of nearly 99% within the 400–800 nm range. Additionally, the fluorine content in GAF does not significantly influence their transmittance. In the subsequent characterization, measurements of the static contact angle of water on GPOSS and GAF1-5 coatings were conducted. The results indicate that the static contact angle of water on the unmodified GPOSS coating was 69°. After fluorination treatment, there was a significant increase in the static contact angle of water, from 69° to 109° for GAF1. As the fluorine content increased, the static contact angle of the coating with water also increased, ultimately reaching 120° for GAF5, as shown in
Figure 4c. To further investigate the hydrophobic performance, the surface energy of as-prepared coating was also calculated. The hydrophobic performance of a coating is closely correlated with its surface energy. To further validate the hydrophobic performance of the coating, the Zisman critical surface tension method [
18] was employed. Specifically, the static contact angle of a series of normal alkanes (n-hexane, n-octane, decane, dodecane, and hexadecane) on the coating surface were measured. After converting the obtained values into cosine values, a linear regression analysis was performed using the known surface tension of the corresponding test liquids. The surface tension of the coating surface values was defined as the surface tension value at the intersection of the extrapolated line with cos(
θ) = 1. The fitting results are shown in
Figure 4d. The results indicate that GAF5 exhibited the lowest critical surface tension, measured at 6.10 mN/m. These findings also correlate with the static contact angle measurements of the coating with water, demonstrating that coatings with lower critical surface tension exhibit larger static contact angles with water.
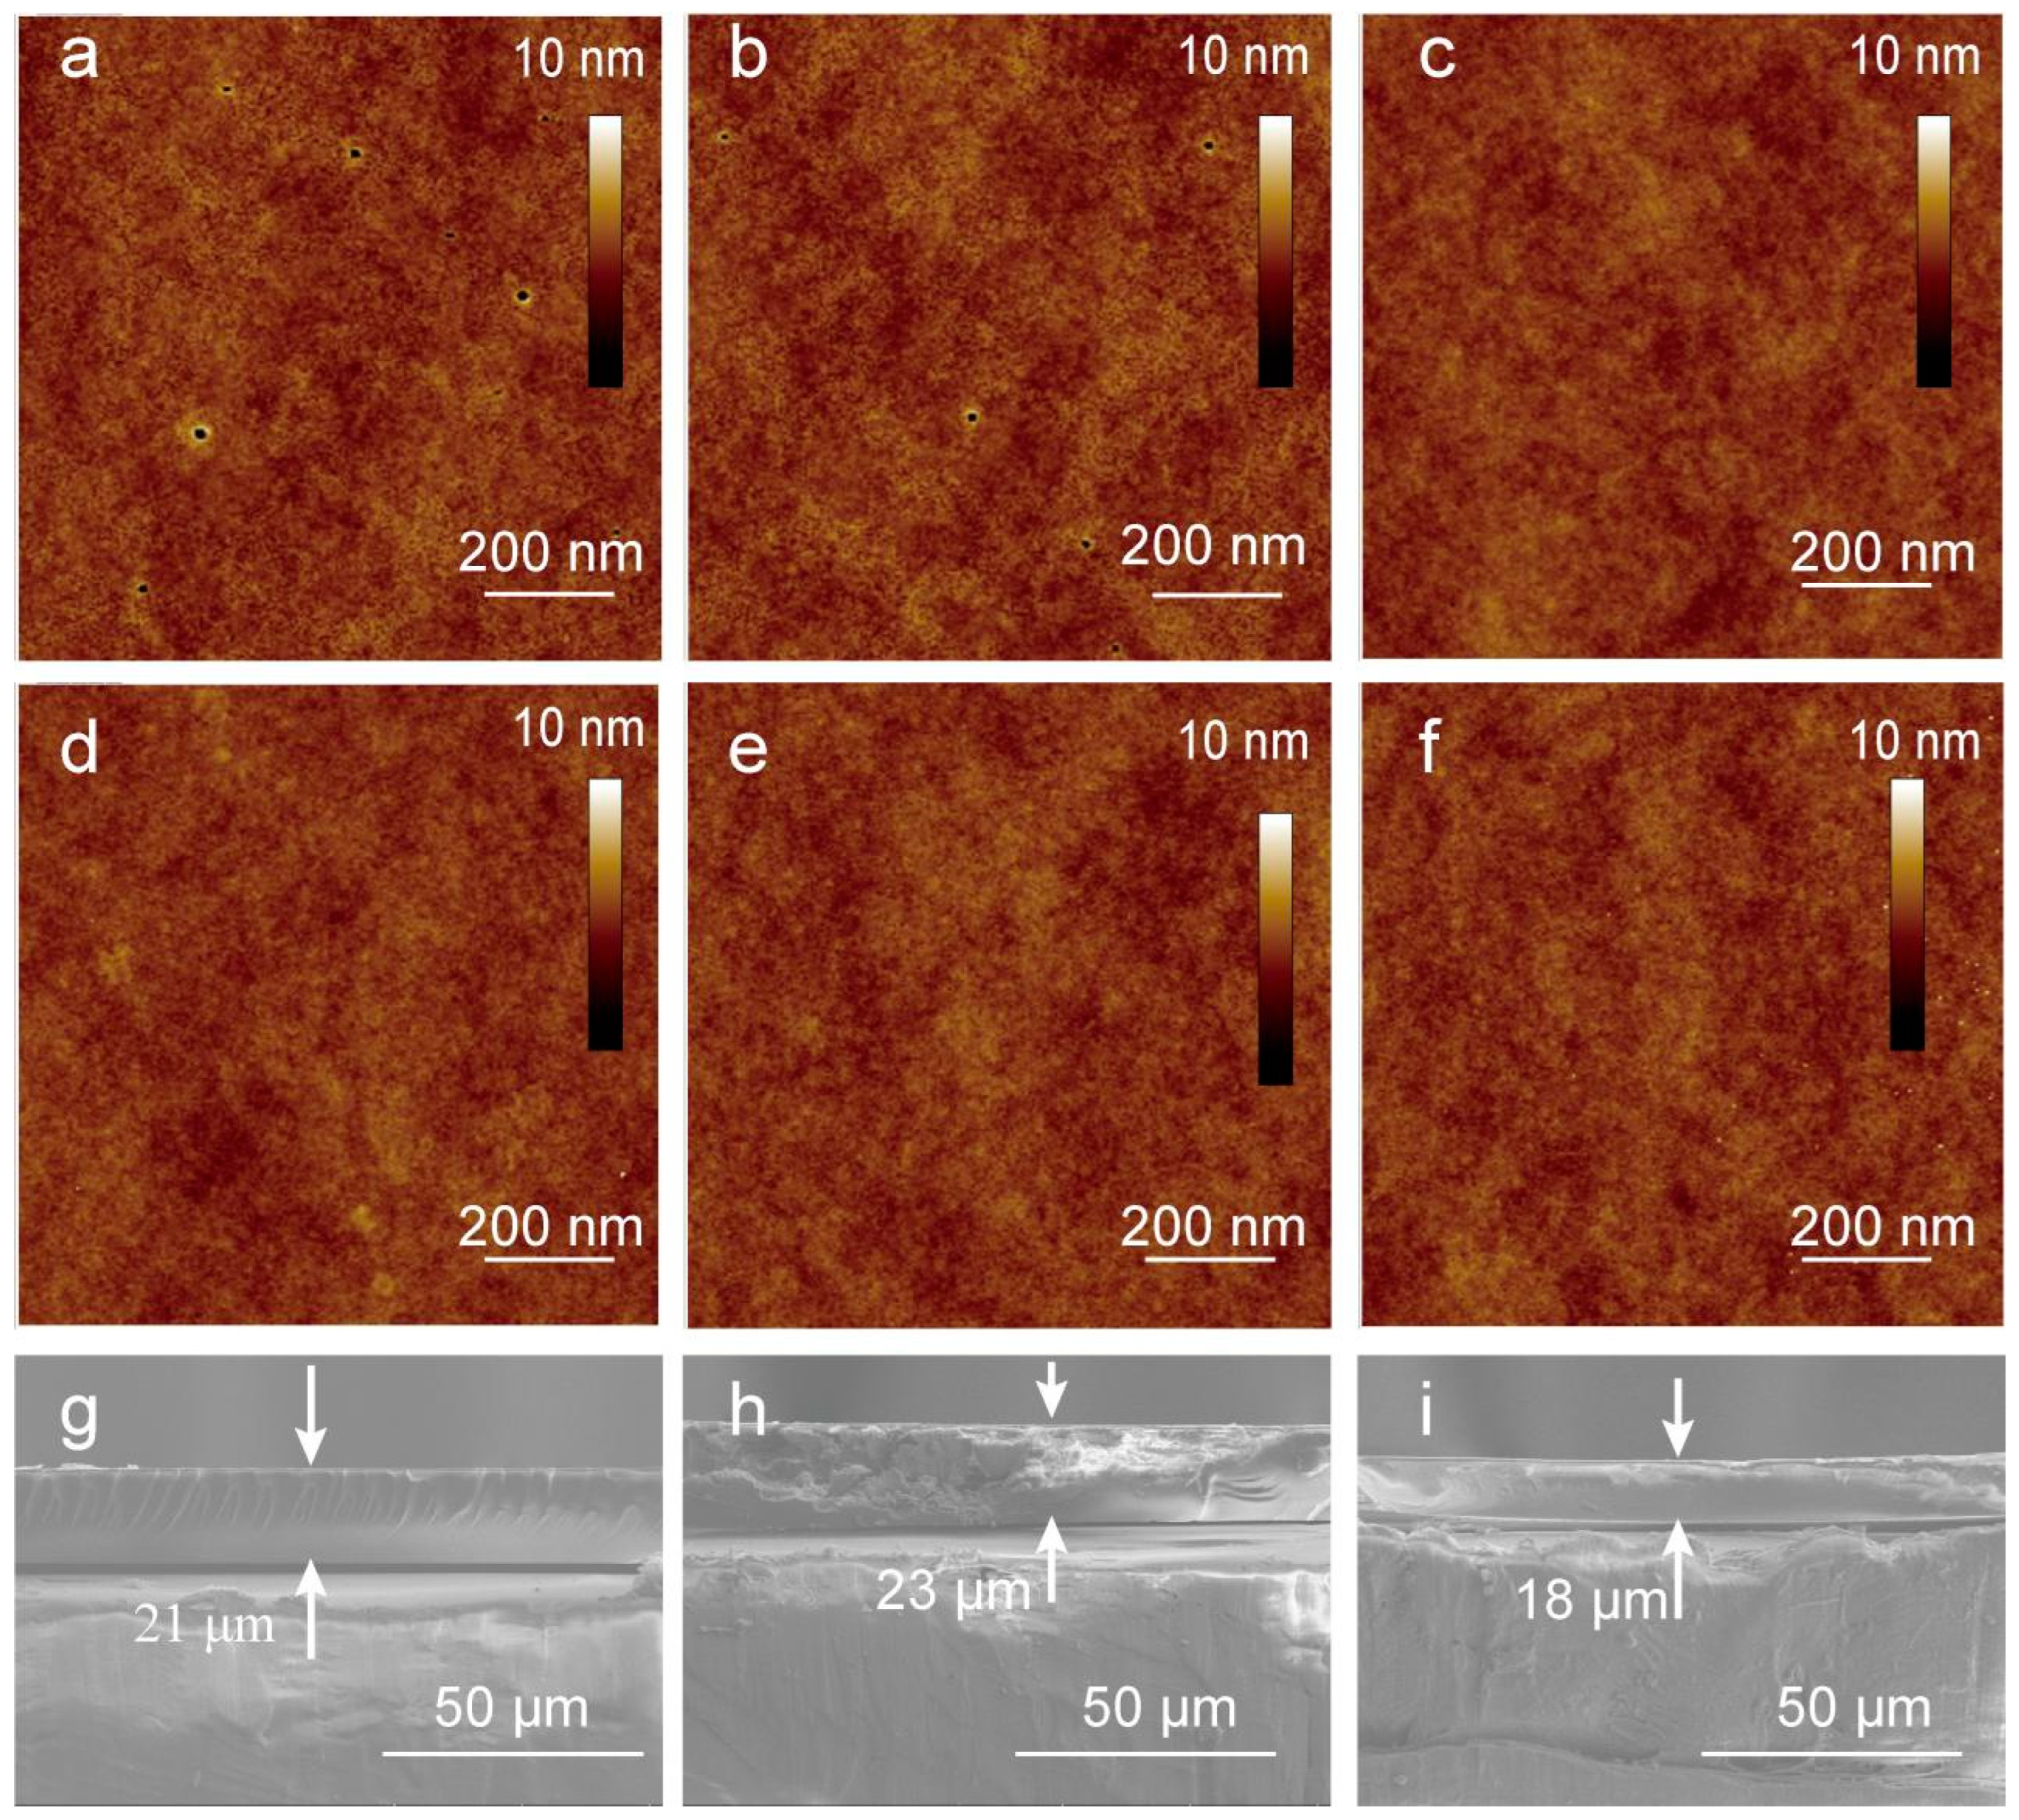
The results from the Atomic Force Microscopy (AFM) study further elucidate the structural morphology of the prepared coatings. The AFM images (
Figure 5a–f) show minimal discernible differences between the GPOSS and GAF1-5 coatings. The similarity in the surface morphology across different samples suggests that the AFM characterization lacks sufficient sensitivity in identifying the type and concentration of fluorine side chains on the surface of the modified coatings. Therefore, the arrangement of the GPOSS units determines the appearance of the surface image. The Scanning Electron Microscopy (SEM) images in
Figure 5g–i reveal the cross-sectional morphology of the GPOSS, GA, and GAF5 coatings. These images indicate that all three coatings exhibit a consistent thickness of approximately 20 μm, suggesting no significant correlation between coating thickness and fluorine content. Additionally, we examined the thermodynamic stability of the coating, as shown in
Figure S2.
As illustrated in
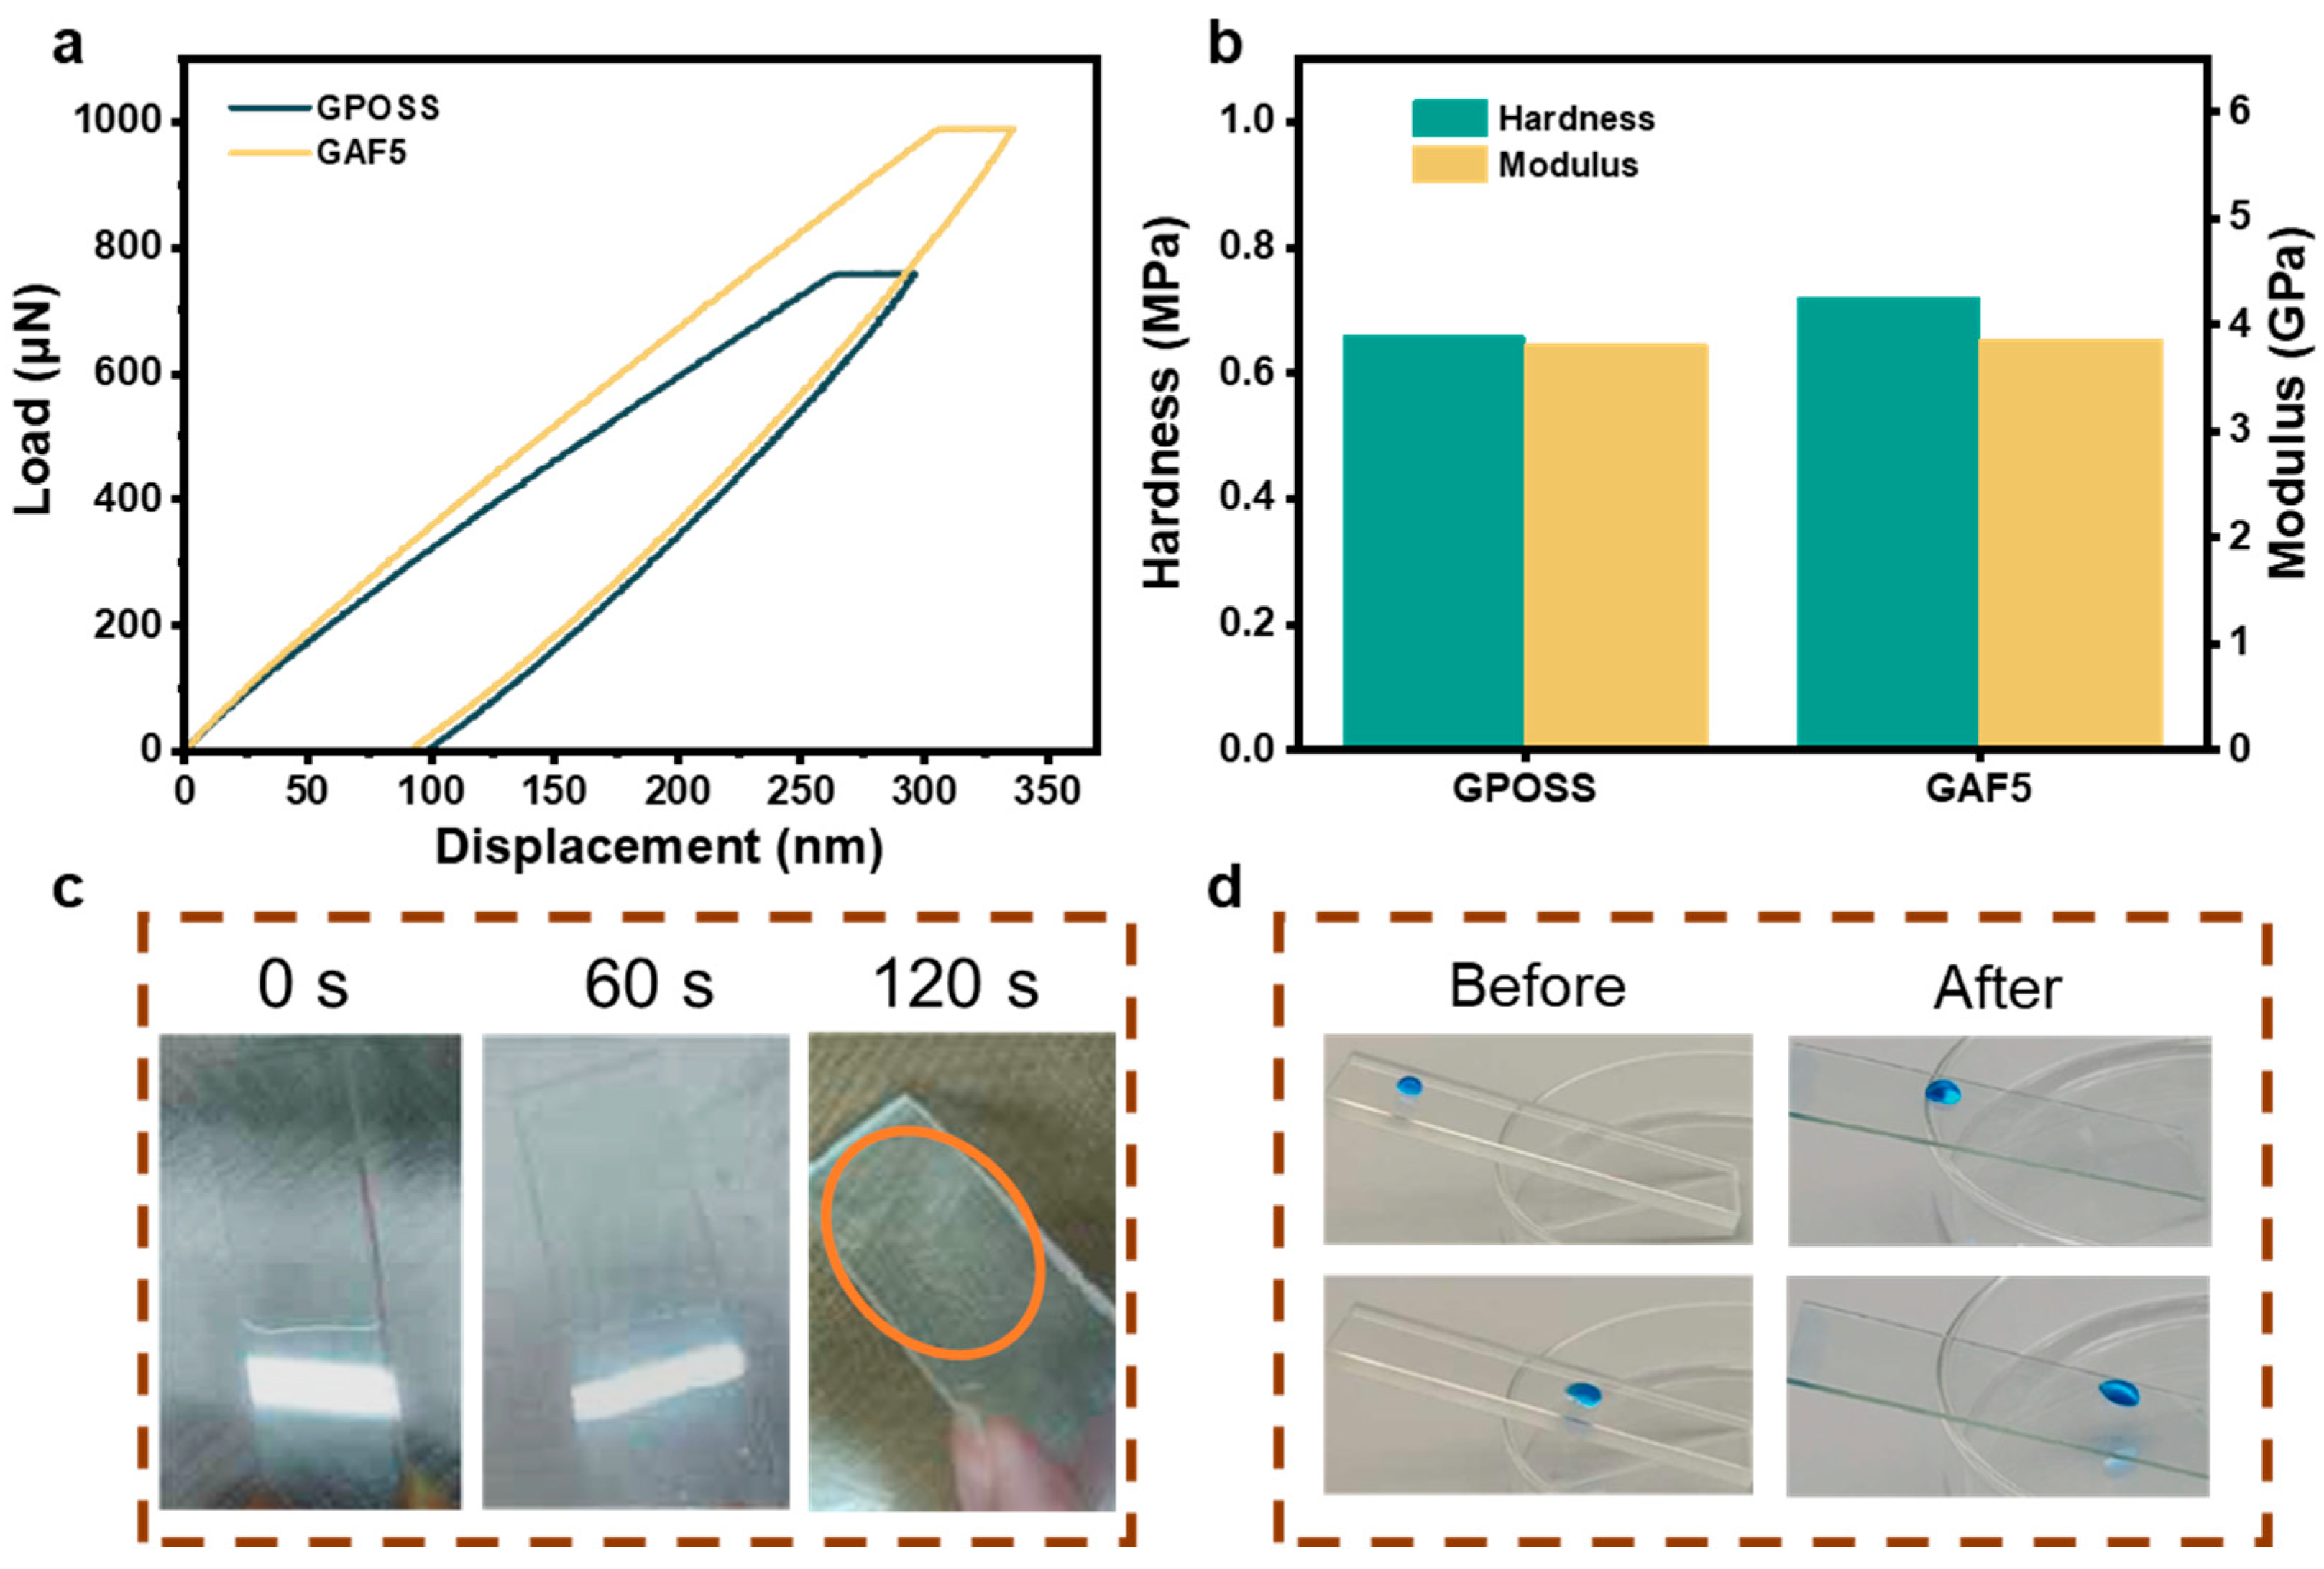
Figure 6, the wear hardness of two types of coatings was characterized through nanoindentation tests.
Figure 6a shows the load, hold, and release curves for both GPOSS and GFAF5 coatings. Hardness is determined through the load–displacement curve, where the slope of the curve (
Pmax/
hmax) was determined as the hardness. The hardness (
H) and elastic modulus (
E) of the GPOSS coating are 0.6567 GPa and 3.7985 GPa, respectively, while those of the GAF5 coating are 0.7179 GPa and 3.8490 GPa, as shown in
Figure 6b. A quantitative analysis using the Oliver-Pharr method reveals that the
H/
E ratio for the GPOSS coating is 17.3%, with an elastic recovery (
we) value of 82.7%, whereas for the GAF5 coating, the H/E ratio is 18.7%, with a
we value of 81.3%. Corresponding calculation method is depicted in
Supporting Information. The results indicate that the H/E and
we values for both coatings are similar, thereby meeting the criteria for high wear resistance [
6,
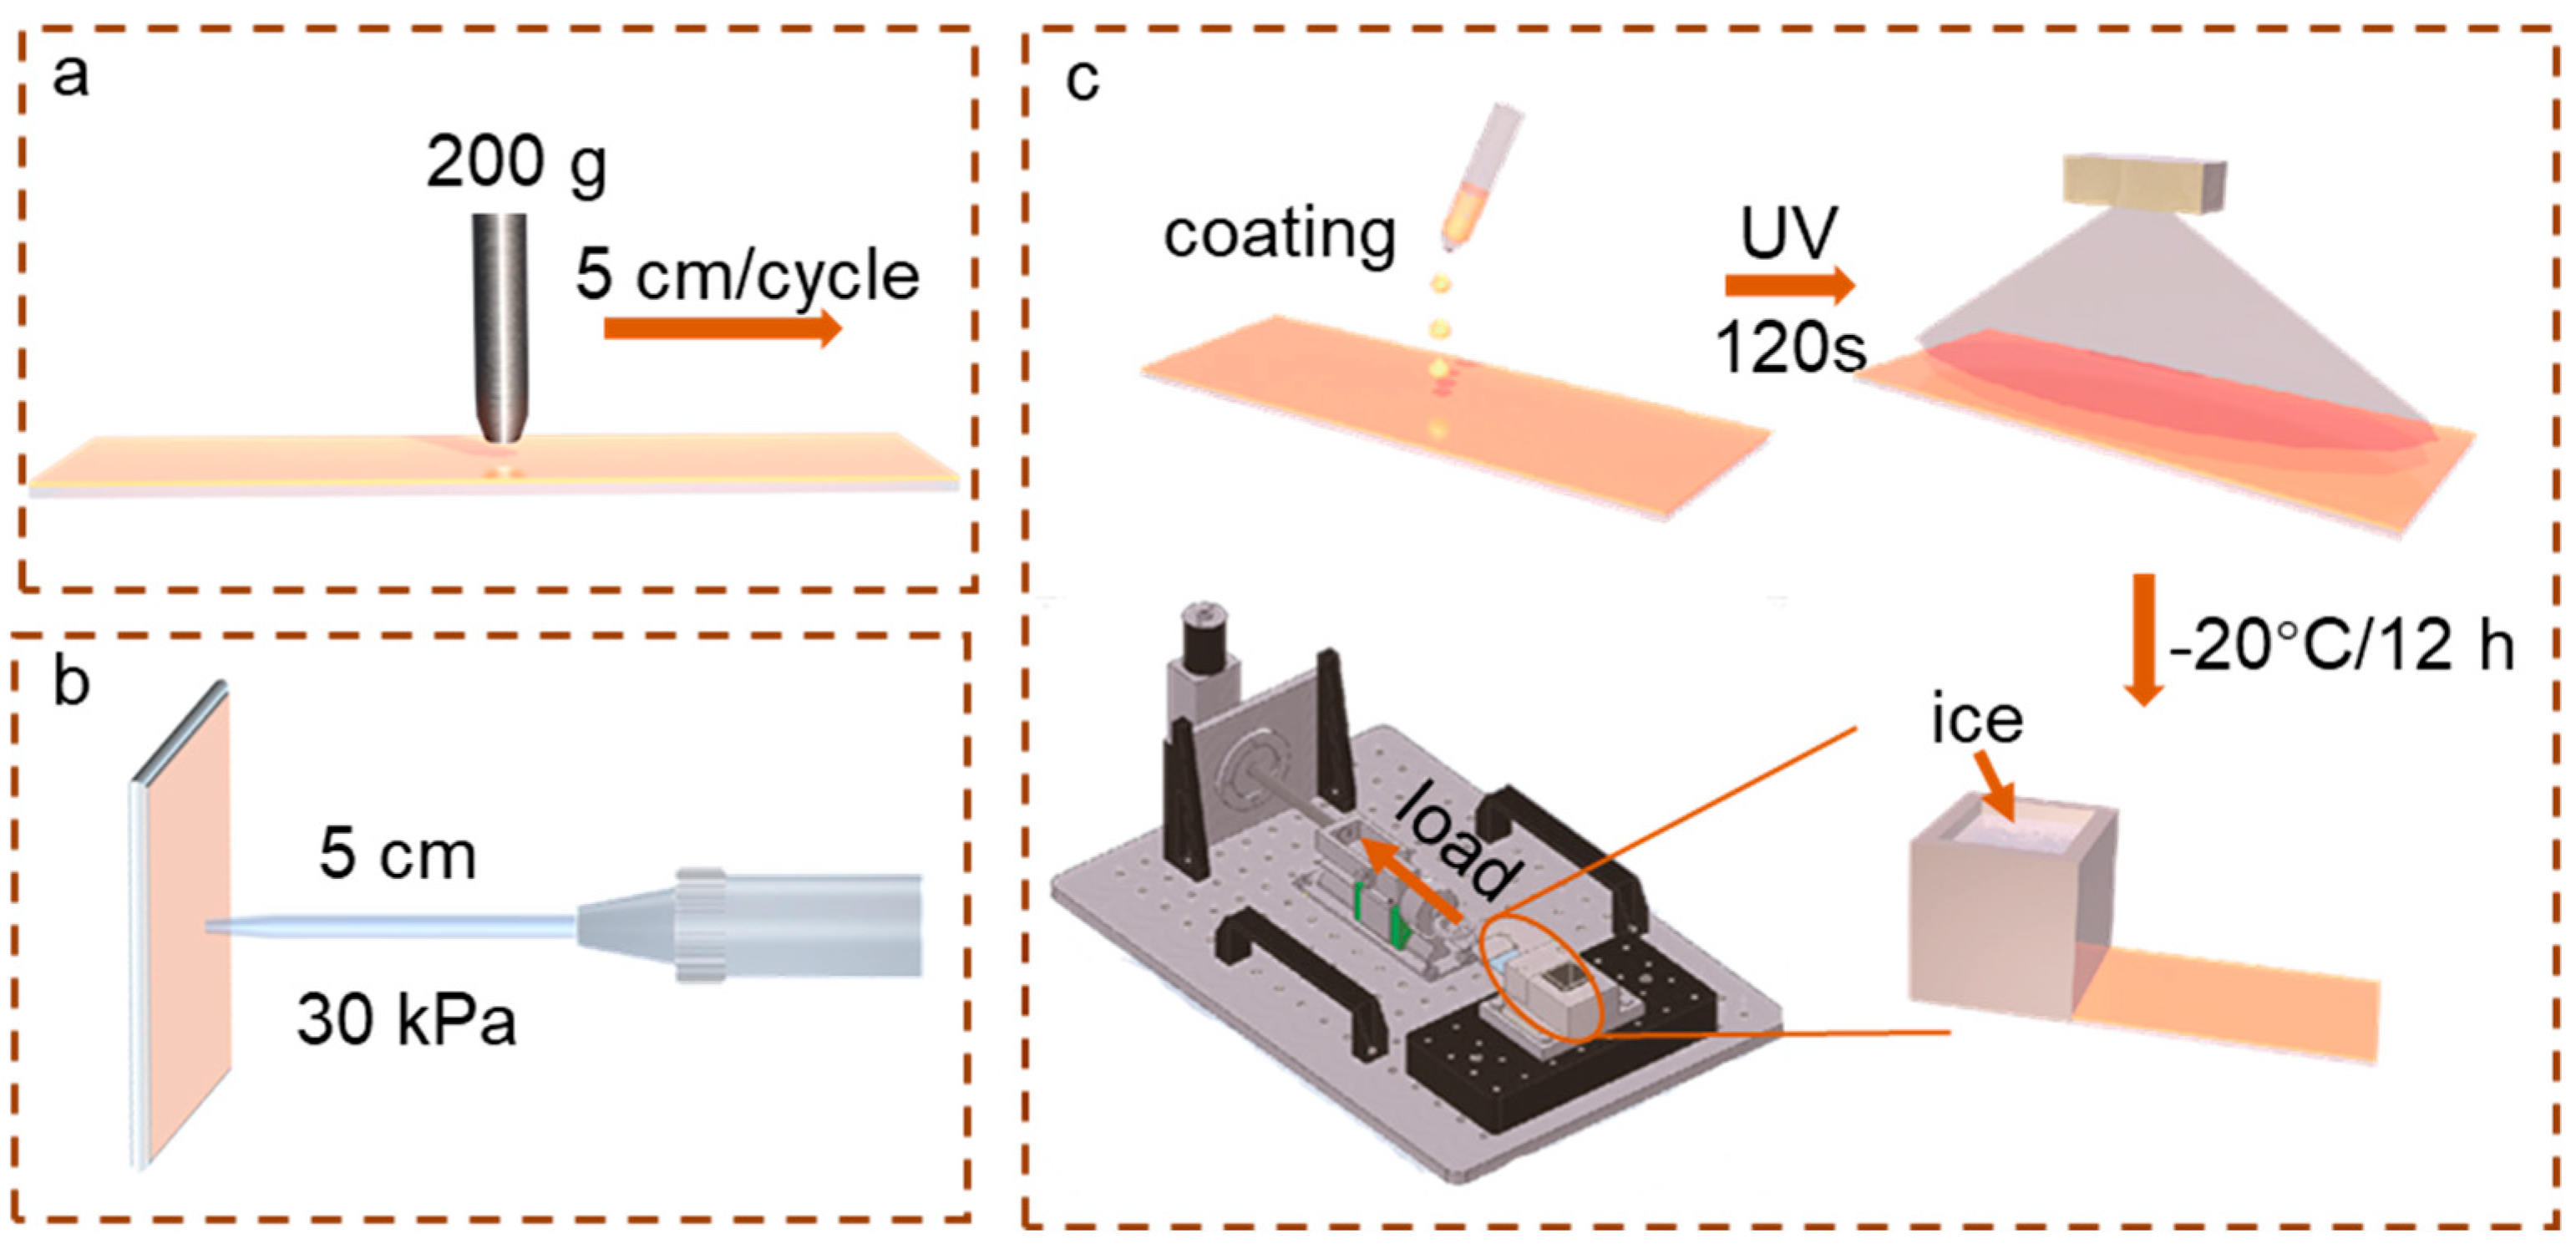
19]. Considering that automotive windshields are frequently exposed to harsh conditions, the durability of glass coatings has become a critical concern. In this study, we conducted hydro-pressure testing on GAF5 coatings to simulate the environmental conditions encountered during car washes. The test equipment is shown in
Figure S3. To simulate these challenging environments and assess the service life of the coating, an impact resistance test was conducted using a spray test with water pressure of 30 kPa for 60 s (
Movie S3). Notably, during the initial 60 s impact cycle, the glass surface coating remained intact. However, when the impact duration extended to 120 s (
Movie S4), the coating eventually fractured, demonstrating its excellent impact resistance, as shown in
Figure 6c. To further evaluate the abrasion resistance of the coating, a soft abrasive cloth was used as the friction medium, applying a load of 200 g for water immersion wear resistance testing. The GAF5 coating endured 500 cycles of friction (
Movies S5 and S6). Remarkably, even after this rigorous testing, the GAF5 coating surface showed no signs of wear, as shown in
Figure 6d. The contact angle was 120° before the abrasion test, 113° for the abrasion test, and the contact angle after the abrasion test decreased, but did not change much, as shown in
Figure S4.
To evaluate the liquid repellency of the as-prepared coating, tests on the static contact angle, advancing angle, and receding angle of the sample with respect to water and other organic reagents were conducted. Samples include GPOSS and GAF1-5 (GPOSS modified by fluorination at different concentrations).
Table 1 compiles the static contact angles of hexane, octane, decane, dodecane, and hexadecane. These static contact angle measurements were subsequently utilized to determine the critical surface tension of the coating. Concurrently,
Table 2 compiles the advancing and receding contact angles of water, diiodomethane, and hexadecane on the surface of the as-prepared samples, along with the calculated contact angle hysteresis (expressed as CAHs =
θACA −
θRCA). Generally, a smaller contact angle hysteresis indicates superior liquid-repellent properties of the coating. The results show that the CAH value for the GPOSS coating without fluorine modification is 38°. After fluorine modification, the CAH value of the coating decreases significantly to a minimum value of 19°. For organic solvents, hexadecane droplets cannot coalesce on the unmodified GPOSS coating, resulting in the very low contact angle of 3.1°, as shown in
Figure S5. After fluorine modification, the coating exhibits enhanced liquid repellency to hexadecane. Based on calculations, the CAH value of hexadecane on the as-prepared coating is only 11°.
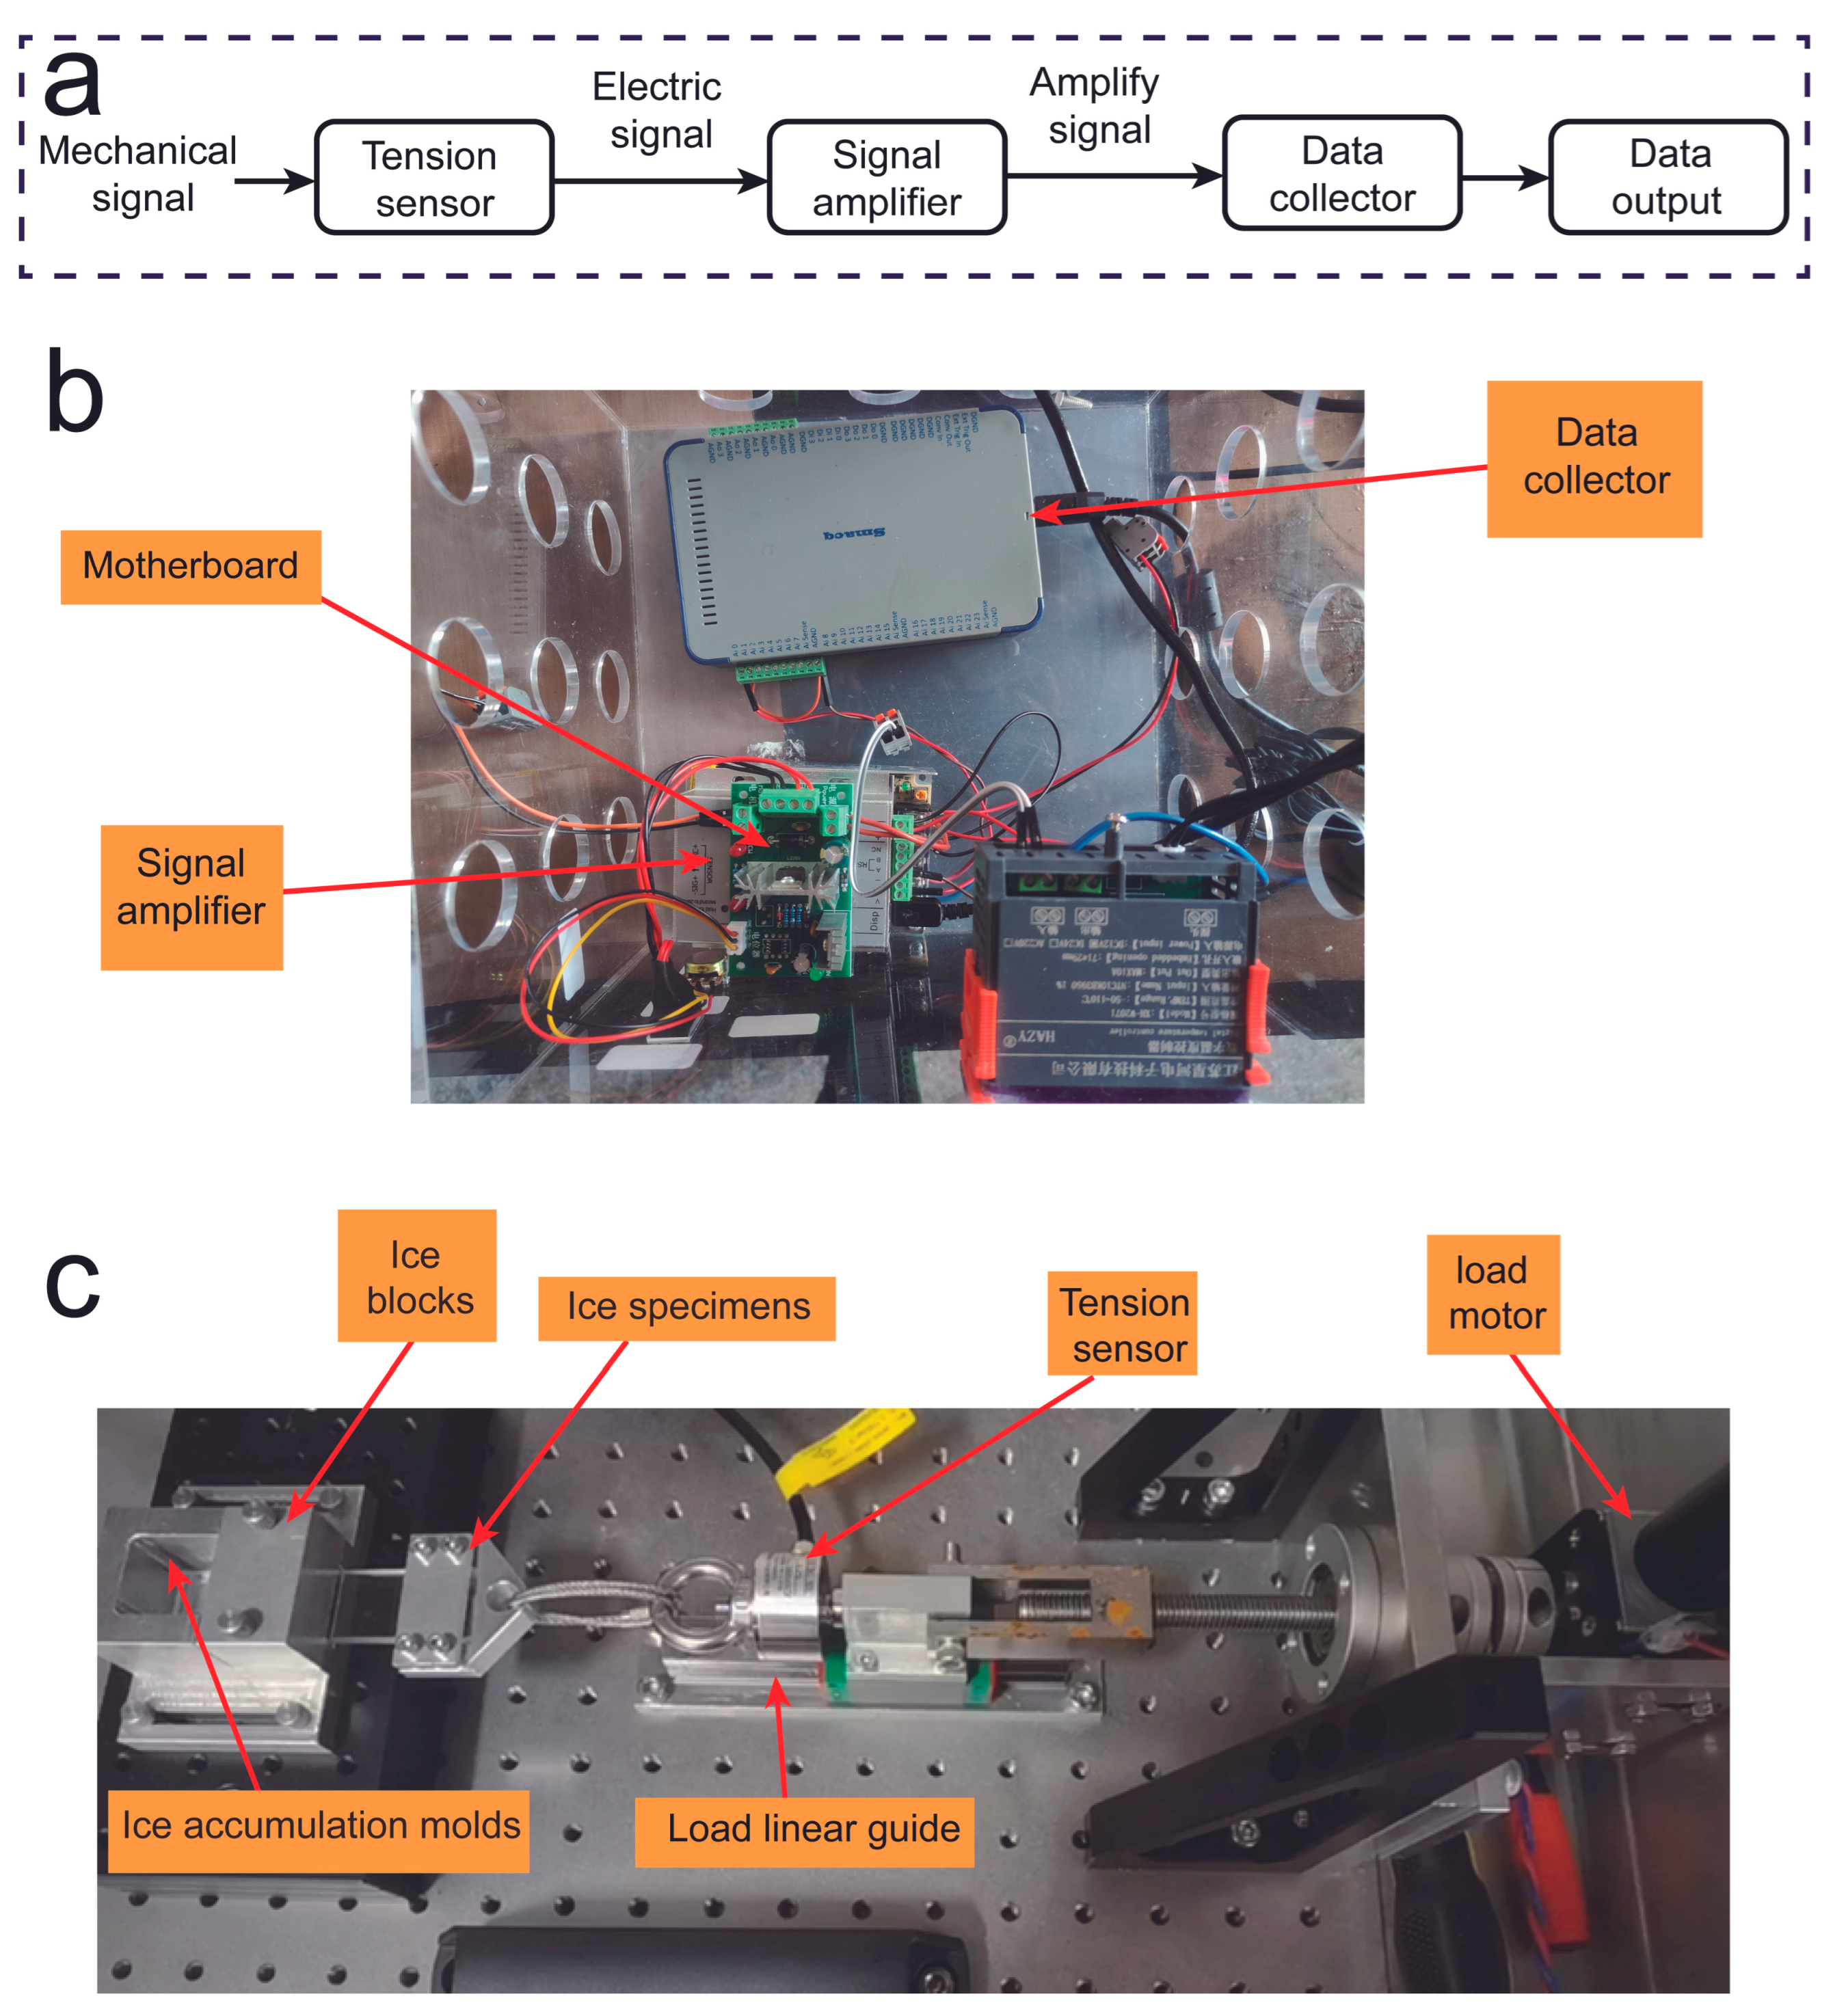
A critical parameter for evaluating the anti-icing performance of a coating is the ability to remove ice from the coating surface under low shear force. To quantify this anti-icing effect, de-icing shear force data were collected using a specially designed evaluation instrument, as illustrated in
Figure 7a. The working mechanism of this instrument is to convert the analog shear force generated by moving ice into a digital signal. However, the analog signals produced during de-icing are often too weak to be reliably detected, necessitating the use of a signal amplifier. The amplified electrical signal is received and processed by the data acquisition system. The de-icing data acquisition kit includes a motherboard, a signal amplifier, and a data acquisition device, as shown in
Figure 7b. Specifically, the motherboard connects to the power supply and controls the motor, which can control the speed at which the ice is removed from the glass sample by adjusting the motor speed. As shown in
Figure 7c, the physical de-icing mechanical assembly includes a load motor that transfers force to the fixed coating test sample via a transmission rod. The tension sensor is mounted on a load linear guide rail to ensure consistent force application on the test sample.
During the testing process (
Movie S1), ice cubes were prepared using a cubic mold with a side length of 2.3 cm to ensure consistent contact area dimensions (
Figure S6). Meanwhile, the tested glass surfaces were uniformly sized at 4 mm × 2.3 mm × 10 cm. The testing environment was maintained at −20 °C, and tests were conducted once a steady temperature was reached, as illustrated in
Figure S7.
Low ice adhesion strength, freezing time delay, reduced freezing temperature and frost resistance are the criteria for evaluating anti-icing surfaces [
20]. Therefore, the de-icing shear force test is carried out on the fluorinated modified glass. To obtain a more accurate de-icing shear force for the coating, three samples of the same type were tested. The de-icing shear force data from of each sample were aggregated, and an analysis of variance was performed on the collected data.
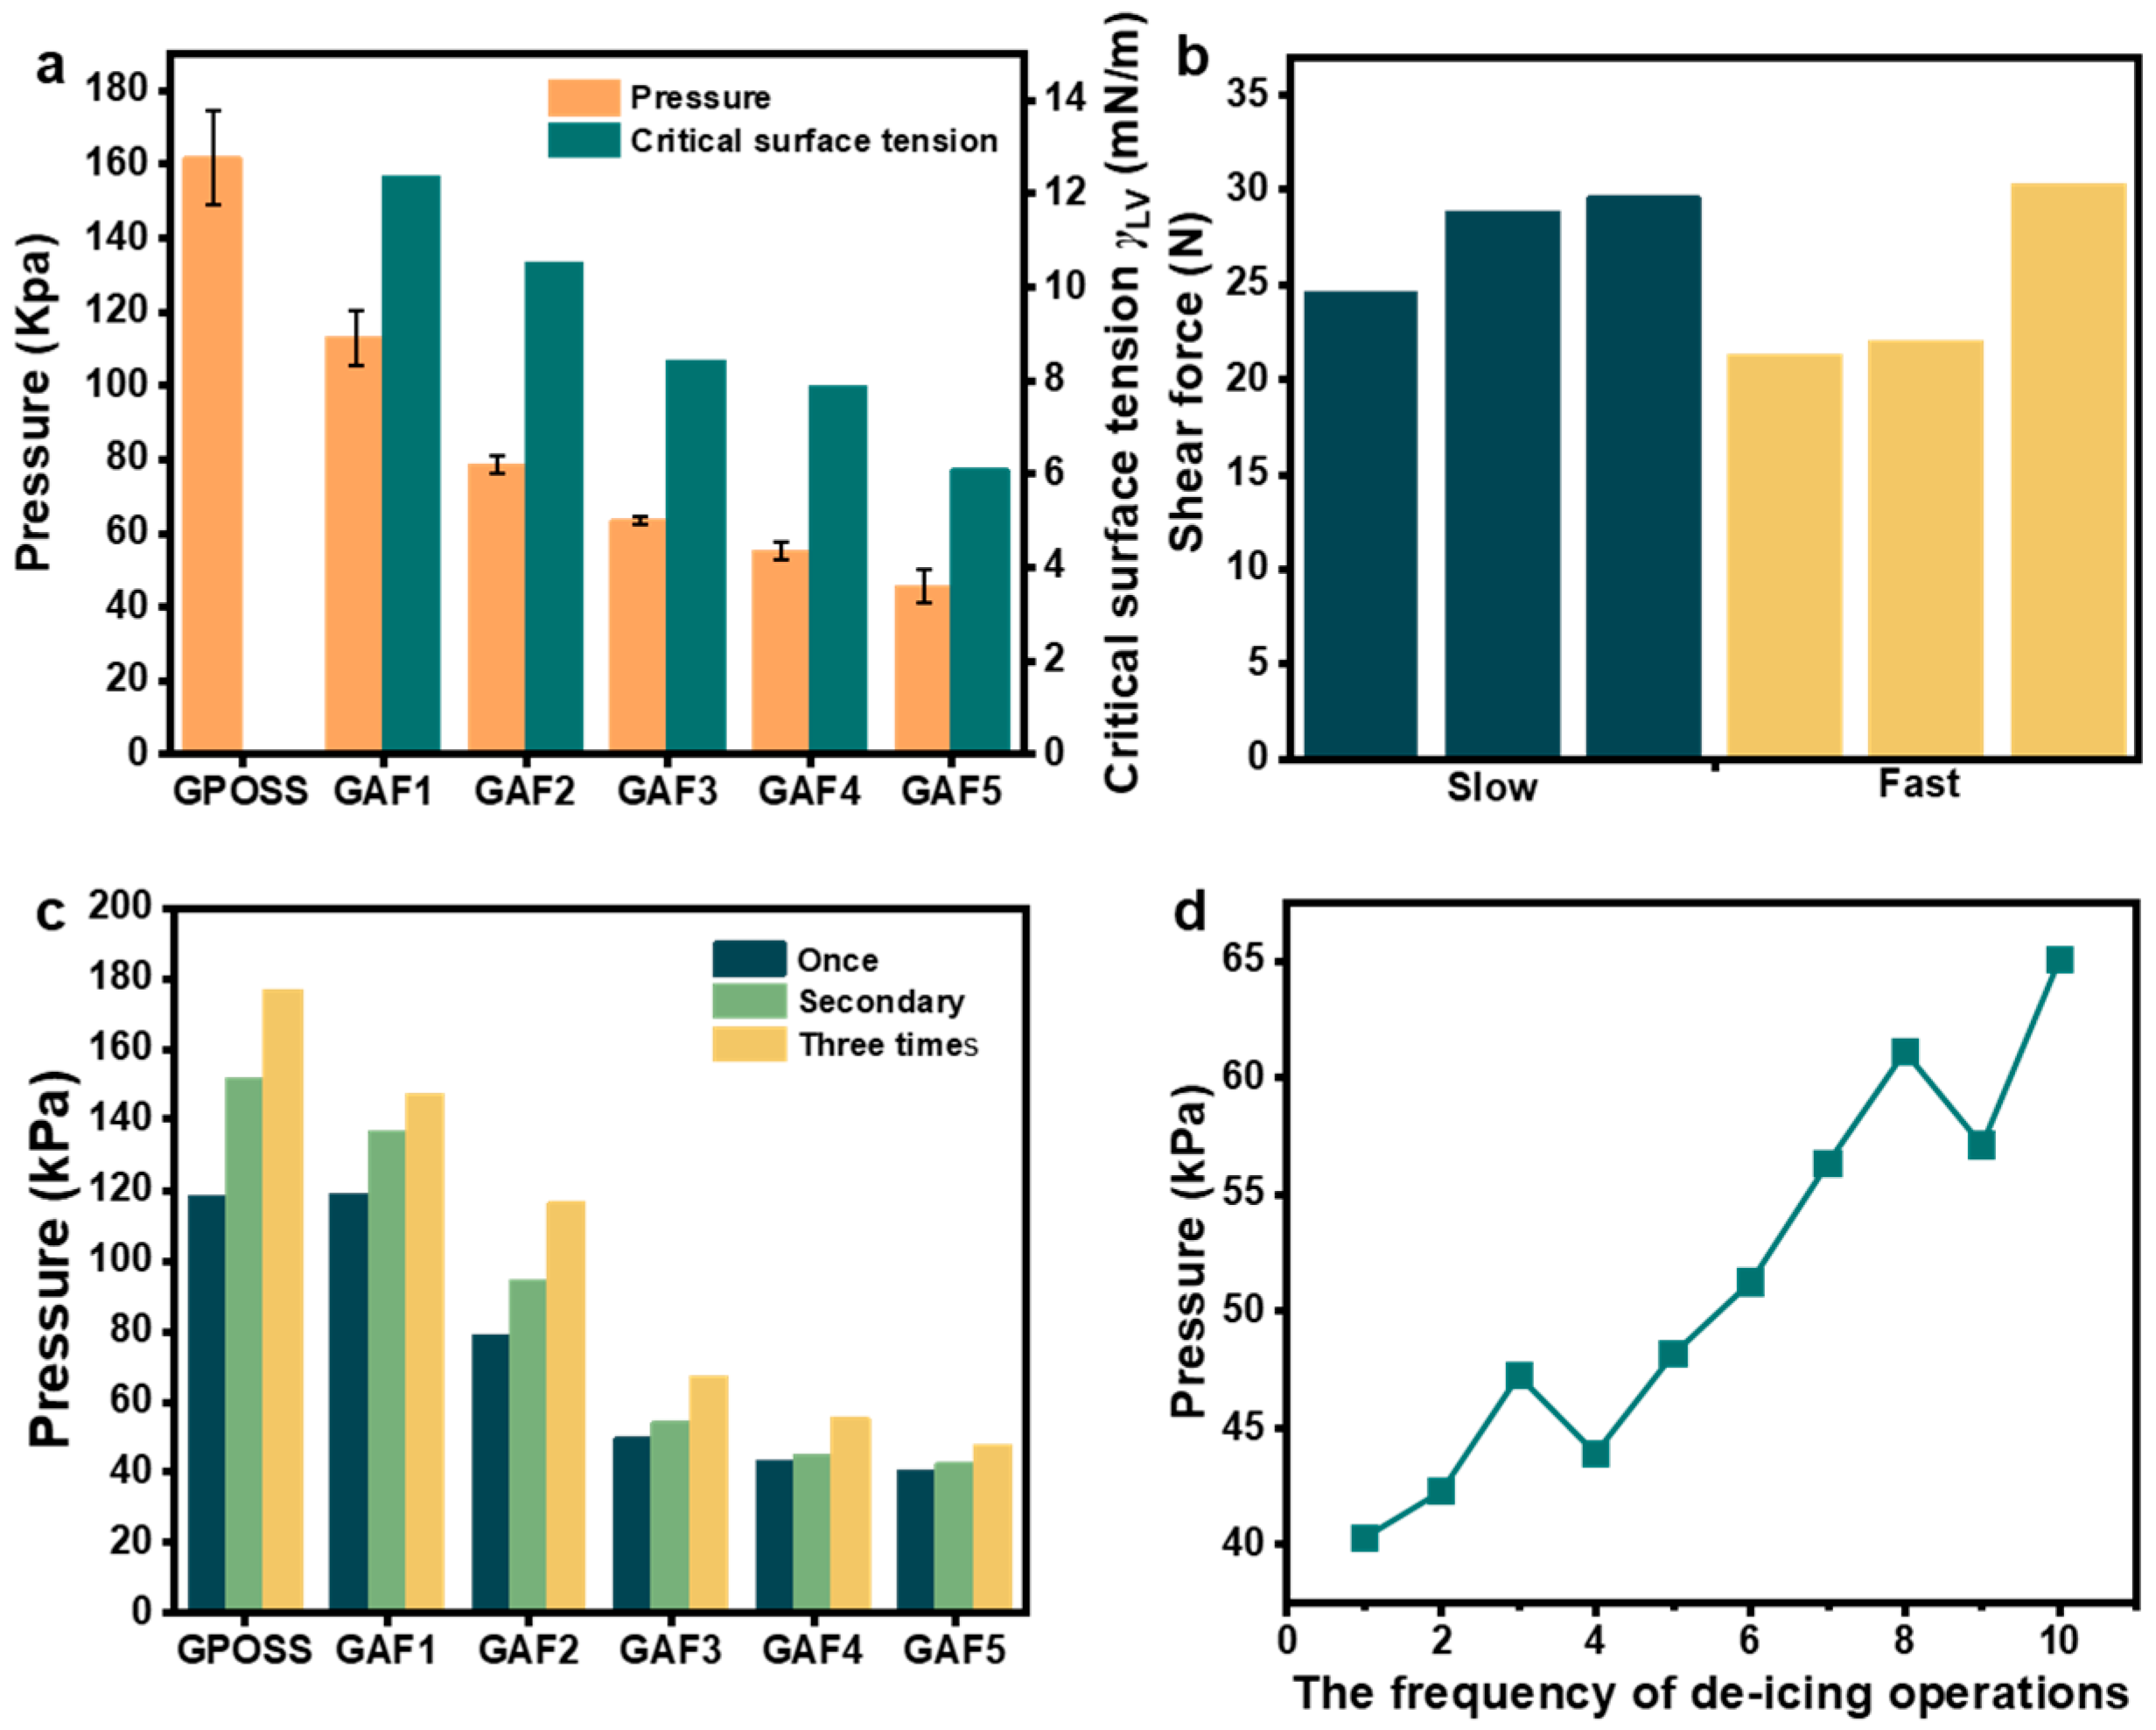
Figure 8a presents a comparison of ice removal pressure and critical surface tension for GPOSS and GAF1-5 coatings, showing that the average de-icing pressure of the GAF5 coating is 45 kPa with a minimum of 40.3 kPa, significantly lower than the unmodified GPOSS coating, and revealing a close relationship between de-icing pressure and the coating’s critical surface tension where lower surface tension corresponds to reduced de-icing shear force. Furthermore, we investigated the impact of the drive rod speed on the de-icing efficiency and de-icing shear force. The de-icing shear forces were measured for slow speed (0.3 mm/s) and fast speed (1.4 mm/s).
Figure 9b compares critical surface tension and shear force under slow and fast conditions, indicating that the de-icing shear forces of GAF5 coatings are significantly lower than that of GPOSS regardless of speed, with minimal differences between speeds, suggesting that the coating’s anti-icing performance is mainly determined by its chemical structure rather than drive rod speed.
Figure 8c contrasts pressures of GPOSS and GAF1-5 under different de-icing frequencies, showing that the unmodified GPOSS has high de-icing pressure with little change across tests, while GAF series coatings, though showing a gradual increase in pressure with repeated de-icing, still maintain much lower values than GPOSS, demonstrating their durability in practical applications.
Figure 8d illustrates the pressure variation of GAF5 under different de-icing operation frequencies, where the first five de-icing shear test data of GAF5 are below 48 kPa and then the de-icing shear force increases with the number of operations, reflecting that while repeated de-icing may slightly affect the coating’s surface, GAF5 still retains excellent anti-icing performance overall due to its chemical cross-linking structure. Taken together, these figures comprehensively validate the superior anti-icing performance and durability of the fluorinated GAF coatings, particularly GAF5, through quantitative data and comparative analyses under various conditions.
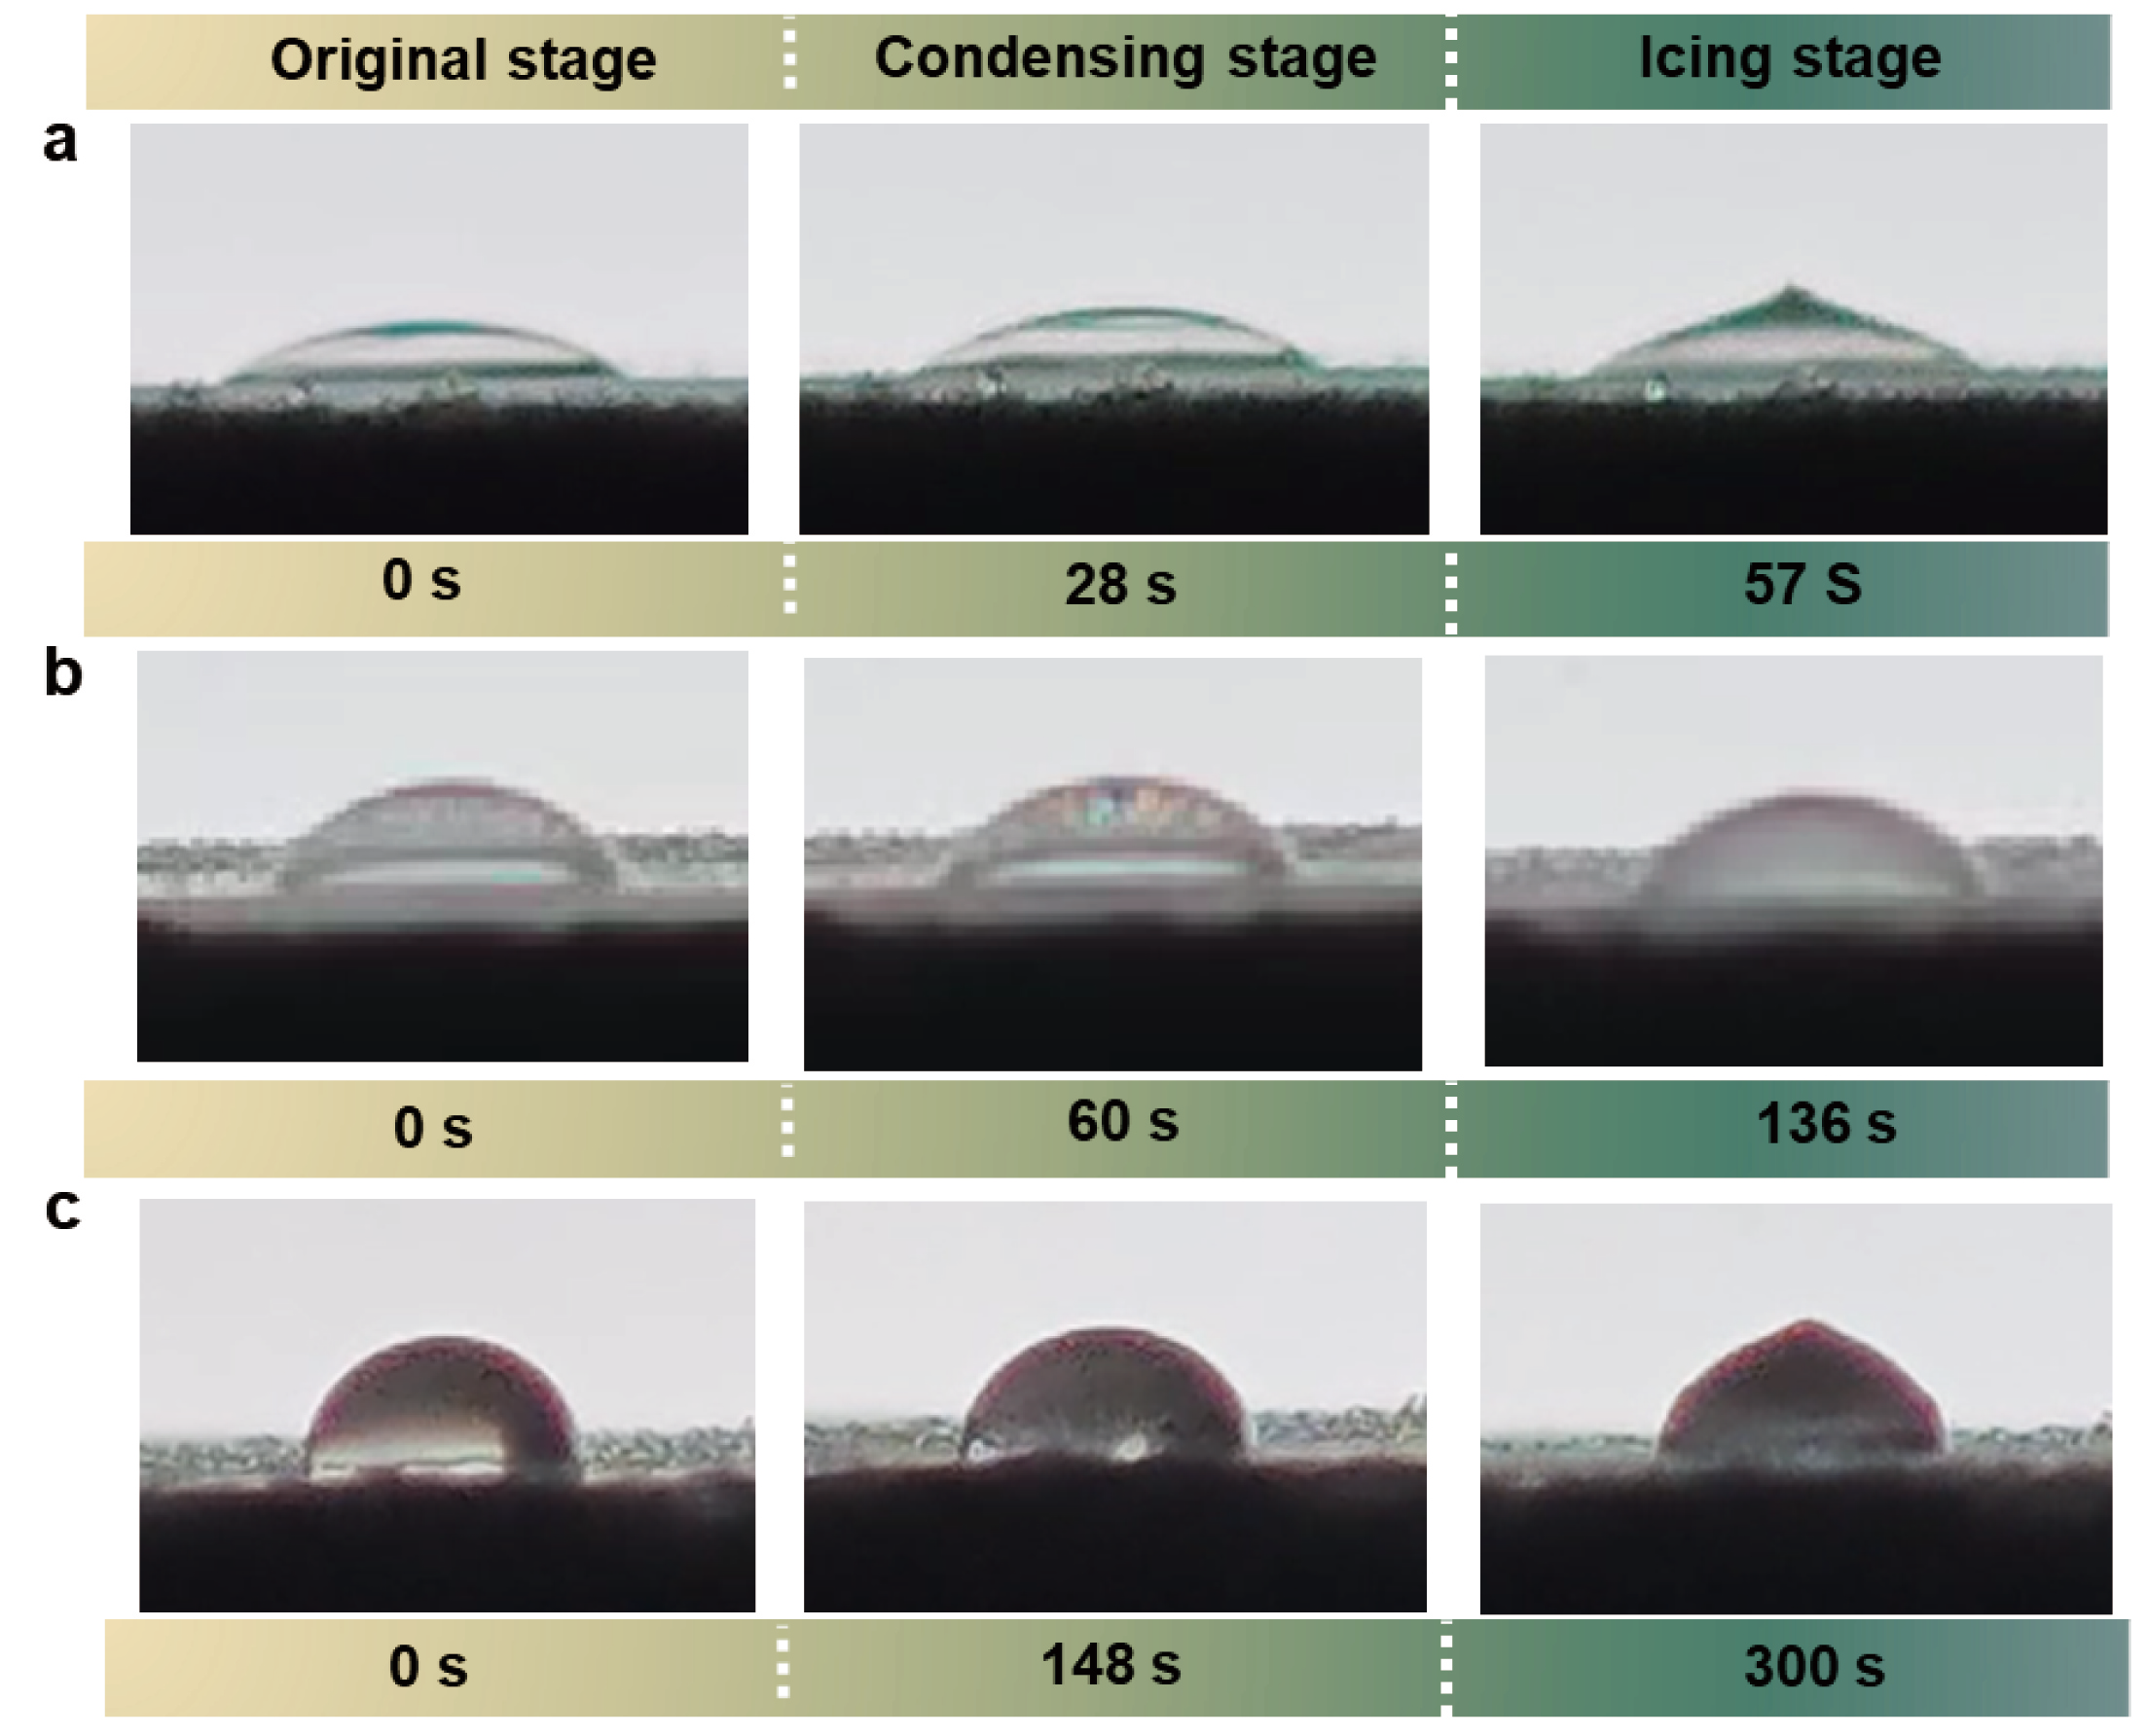
Figure 9 captures the ice formation dynamics on three distinct surfaces—bare glass (
Figure 9a), GPOSS coated glass (
Figure 9b), and GAF5 coated glass (
Figure 9c)—under controlled condensation conditions at −20 °C, illustrating the critical role of fluorine modification in enhancing anti-icing performance. For the bare glass substrate (
Figure 9a), ice nucleation initiates rapidly upon condensation, with dense ice crystals forming uniformly across the surface within 28 s, and by 57 s, the entire surface is covered by a thick, cohesive ice layer that demonstrates strong ice adhesion and rapid freezing kinetics typical of hydrophilic surfaces. On the GPOSS coated glass (
Figure 9b), the ice formation process is slightly delayed compared to bare glass, with initial ice crystals appearing at 60 s, though the coating’s moderate hydrophobicity allows partial water droplet aggregation before freezing; by 136 s, while the ice layer is less dense than on bare glass, significant ice accumulation still occurs, indicating limited anti-icing improvement from GPOSS alone. In stark contrast, the GAF5 coated glass (
Figure 9c) exhibits remarkable anti-icing behavior, with water droplets on the fluorinated surface remaining in a supercooled liquid state for an extended period and no visible ice nucleation until 148 s; even at 300 s, the surface only shows isolated, sparse ice patches rather than a continuous ice layer. This dramatic reduction in ice adhesion and coverage highlights the GAF5 coating’s ability to suppress ice formation through low surface energy and enhanced liquid repellency, directly verifying its superior anti-icing performance compared to unmodified or minimally modified counterparts. Taken together,
Figure 9 provides visual evidence of how fluorine-modified inorganic/organic composite coatings like GAF5 can fundamentally alter ice-substrate interactions, offering a promising strategy for practical anti-icing applications in cold environments.
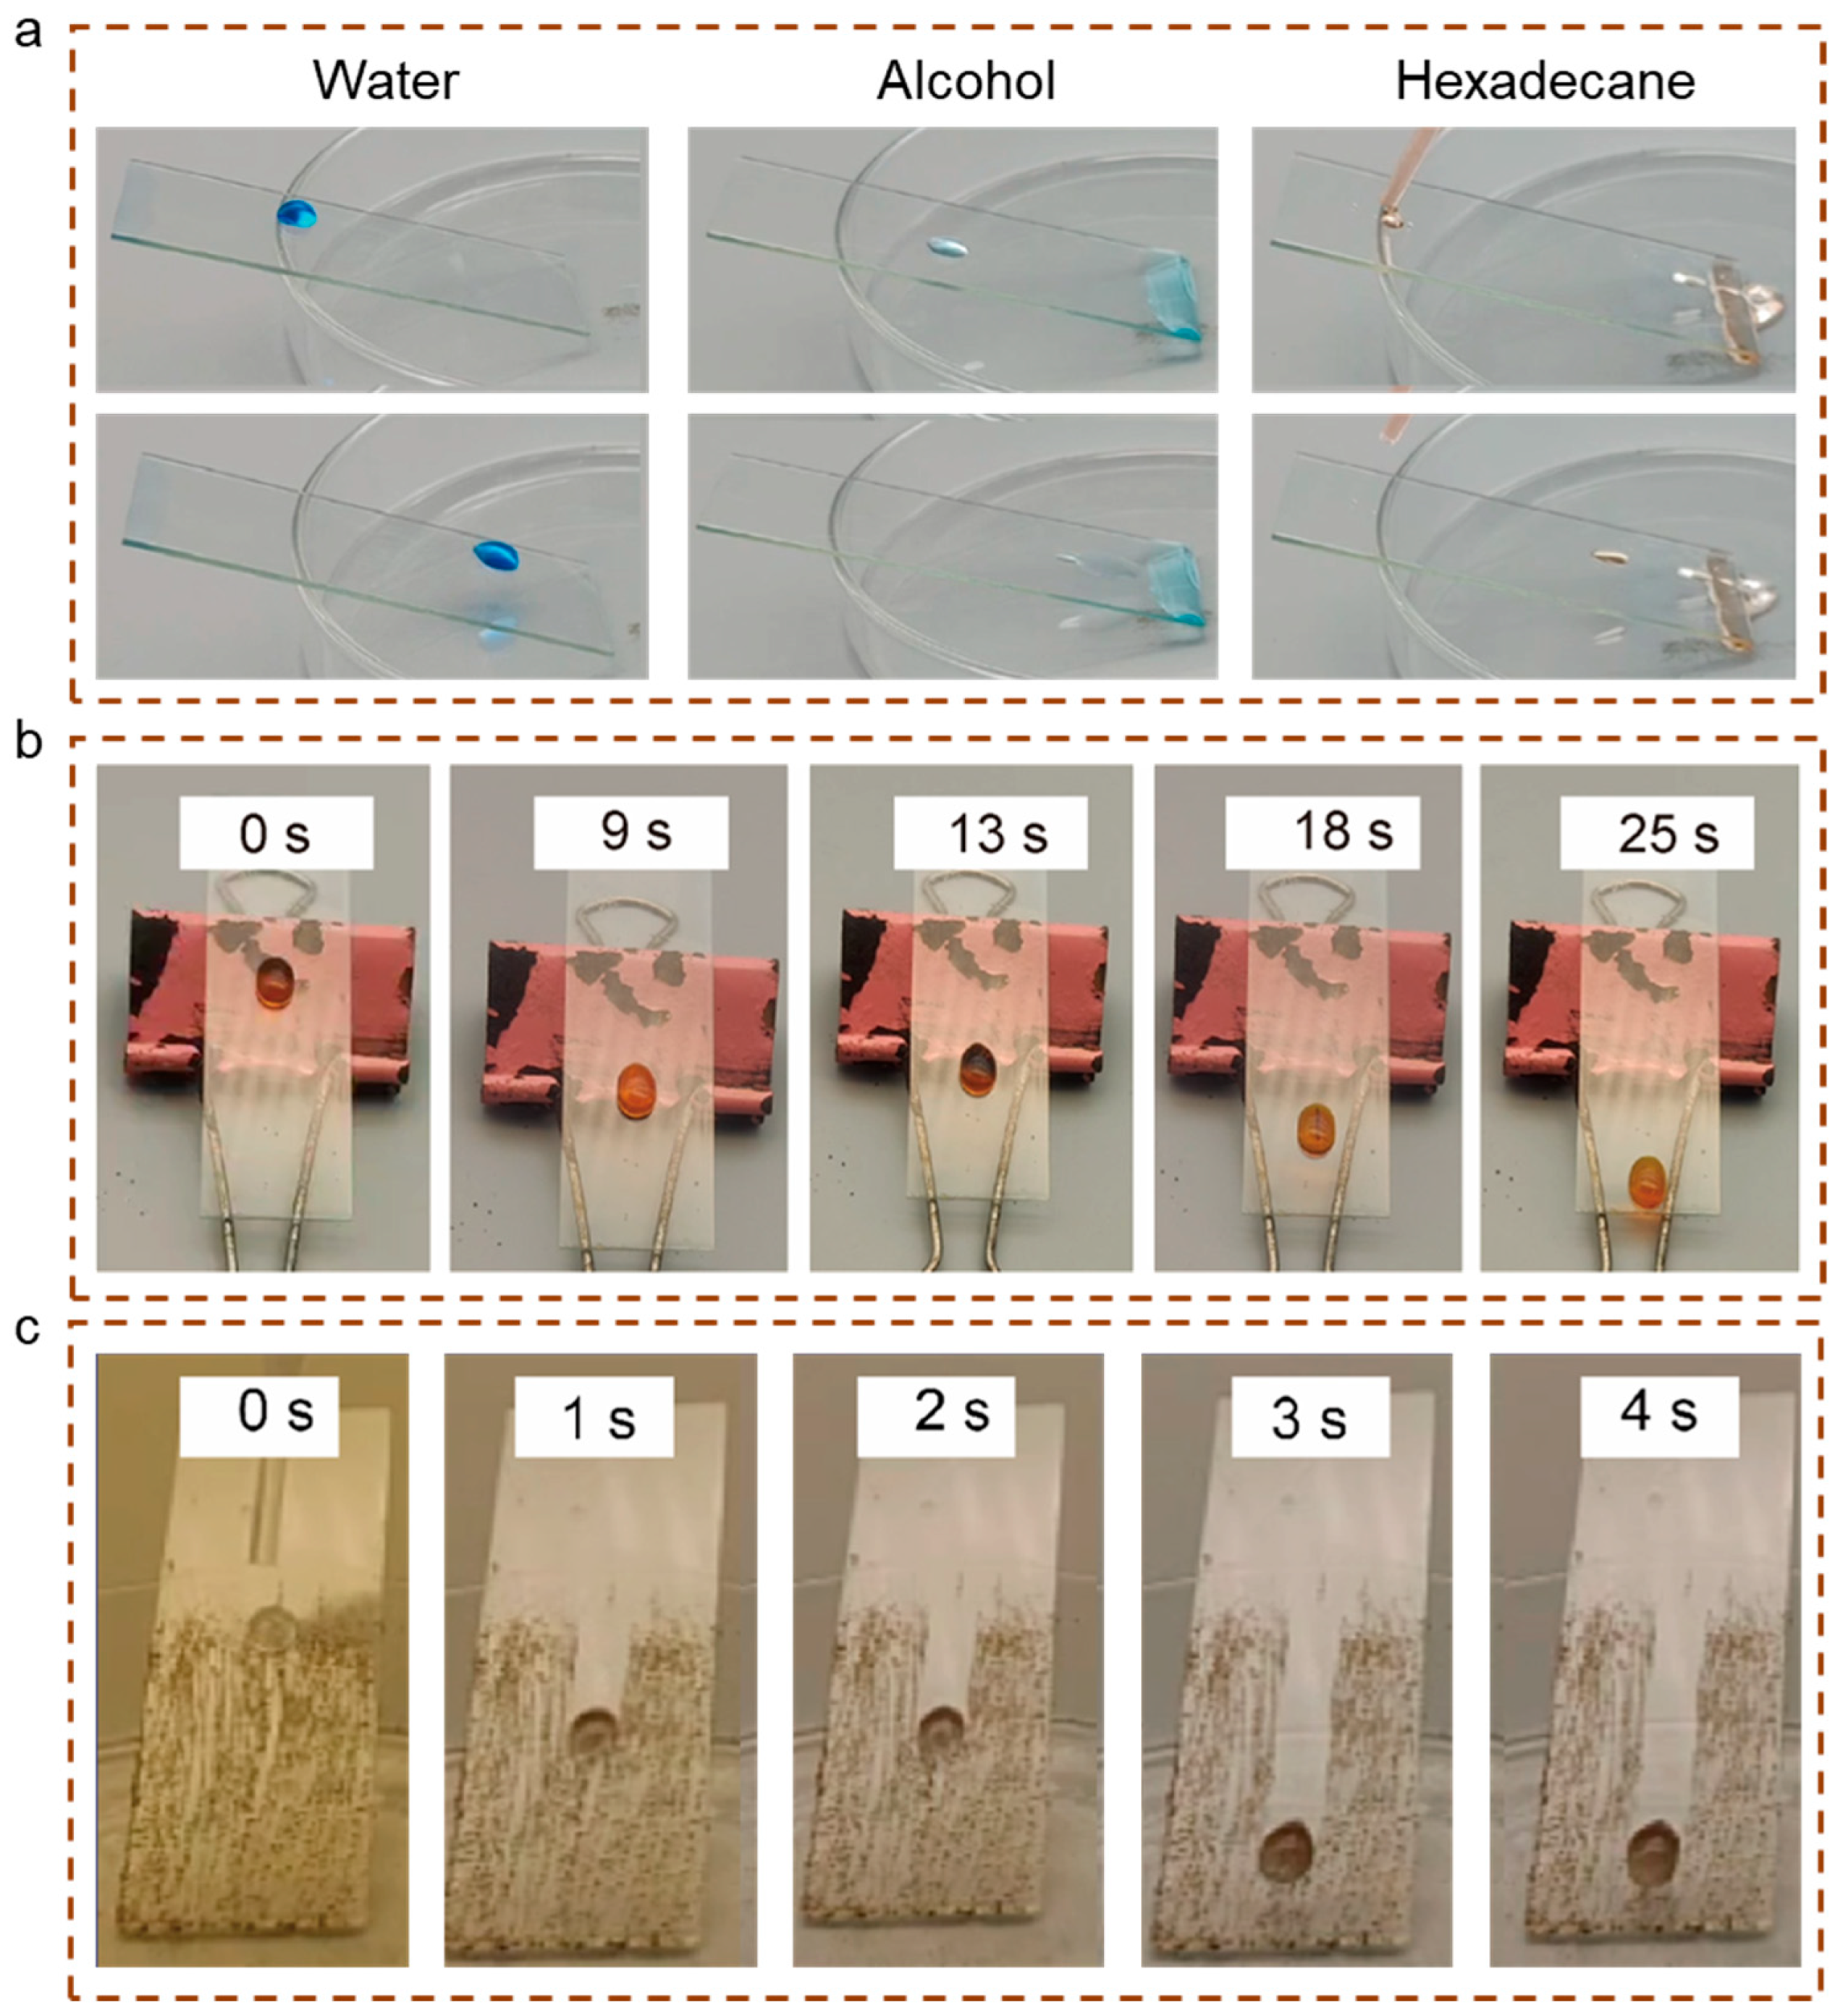
These coatings effectively protect object surfaces from erosion and contamination caused by liquids like water and oil. This study evaluates the performance of as-prepared modified coatings in terms of stain resistance and self-cleaning capabilities across a range of liquid types. In
Figure 10a, three distinct droplets were observed: blue (water), light blue (ethanol), and pink (hexadecane). The results show that these liquids exhibited excellent repellency on the GAF5 coated surface at an inclination angle of 25°, allowing substrate rubbing. As a liquid-like coating, GAF5 demonstrated outstanding anti-soiling properties and remarkable repellency toward low-viscosity polar and non-polar liquids. Furthermore, to demonstrate the coating’s ability to repel high-viscosity liquids, glycerol was selected as the test liquid. As shown in
Figure 10b, a yellow glycerol droplet exhibited slow rubbing behavior at a 30° inclination angle (
Movie S2). Besides good anti-icing performance in glass coatings, self-cleaning glass is also widely used in architecture and automotive industries [
21]. Therefore, in addition to evaluating the anti-icing performance of the glass, this study also assessed the self-cleaning capability of the modified glass. To simulate natural environmental conditions, a thin layer of a fine particle and oil mixture was evenly spread across the prepared sample. At a 25° incline, water droplets exhibited free-rubbing or scratching behavior on the surface of the GAF5 coating, effectively removing surface contaminants, as shown in
Figure 10c.
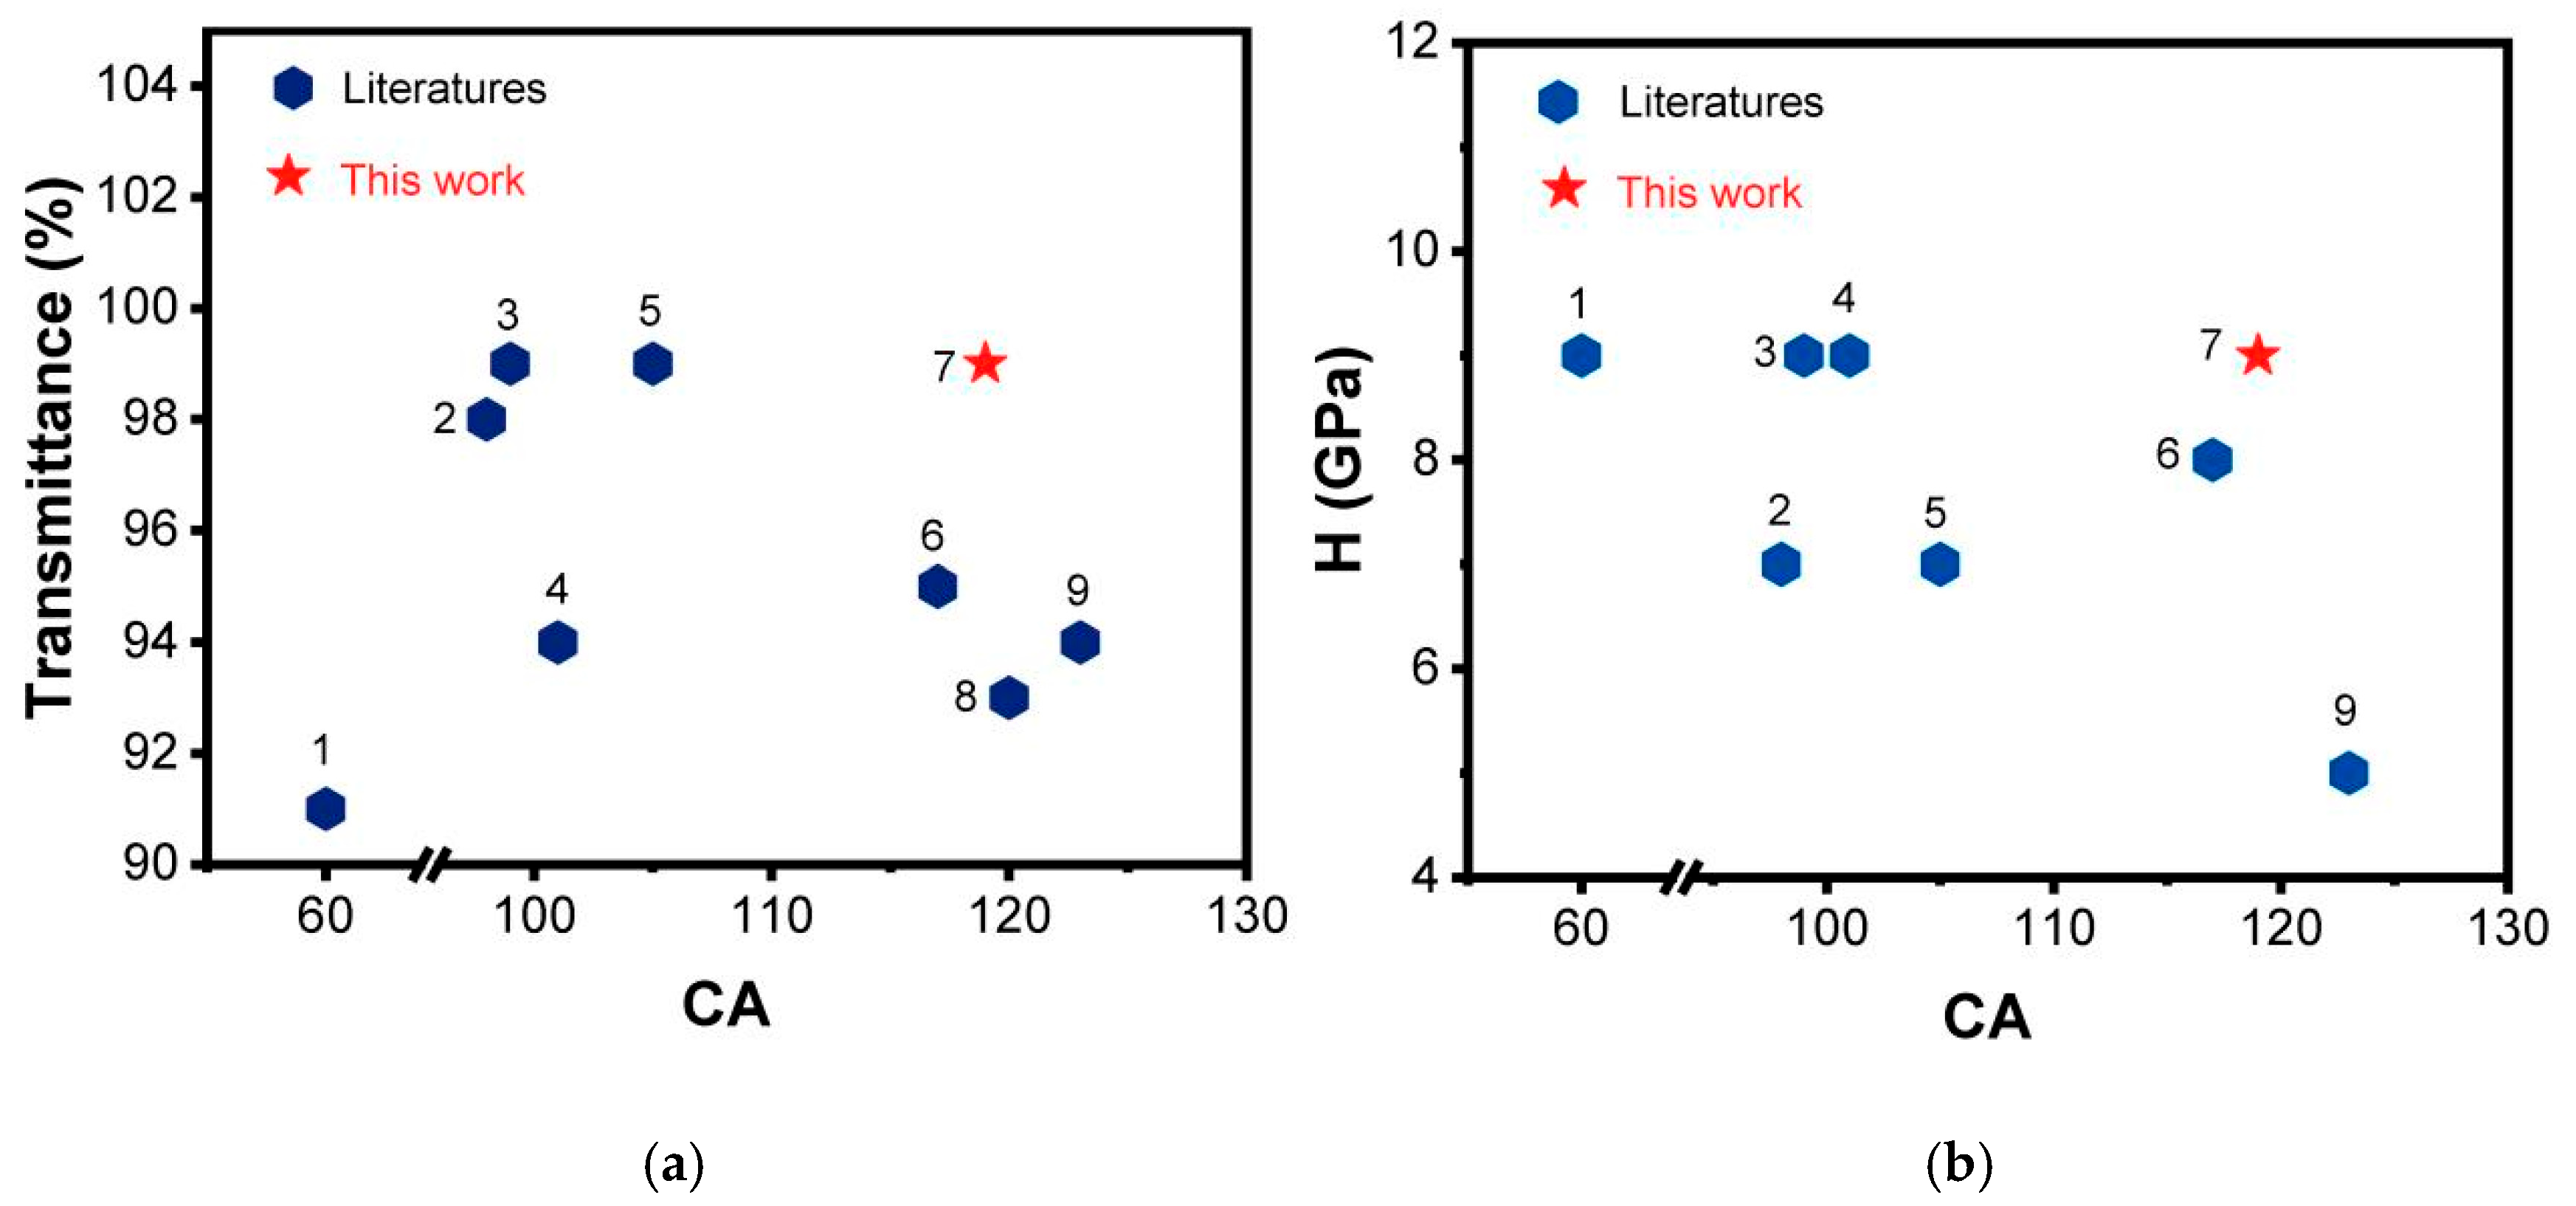
Compared to other glass coatings of similar types, the GAF5 coating prepared in this study exhibits a higher static contact angle with water, as well as superior optical transparency and hardness, as illustrated in
Figure 11. Specifically,
Figure 11a presents an Ashby plot comparing static contact angles and transmittance for various coatings, where our GAF5 coating achieves a remarkable transmittance of up to 99%. Additionally, the static contact angle of GAF5 with water surpasses that of other coatings in this category.
Figure 11b provides a comparison of static contact angles and hardness for different coatings, underscoring the exceptional hardness of the GAF5 coating.


