Article

Numerical Simulation and Modeling of Powder Flow for Rectangular Symmetrical Nozzles in Laser Direct Energy Deposition

1
College of Physics and Electronic Engineering, Xinyang Normal University, Xinyang 464000, China
2
School of Mechatronics Engineering, Henan University of Science and Technology, Luoyang 471003, China
*
Author to whom correspondence should be addressed.
Coatings 2025, 15(7), 744; https://doi.org/10.3390/coatings15070744
Submission received: 17 April 2025 / Revised: 17 June 2025 / Accepted: 18 June 2025 / Published: 23 June 2025
(This article belongs to the Special Issue Laser Surface Engineering and Additive Manufacturing)

Abstract

Wide-beam laser direct energy deposition (LDED) has been widely used due to its superior deposition efficiency. To achieve optimal laser-powder coupling, this technique typically employs rectangular powder nozzles. This study establishes a simulation model to systematically investigate the powder flow field characteristics of rectangular symmetric nozzles. Through parametric analysis of powder feeding rate, carrier gas flow rate, and shielding gas flow rate, the effects on powder stream convergence behavior are quantitatively evaluated to maximize powder utilization efficiency. Key findings reveal that, while the powder focal plane position is predominantly determined by nozzle geometry, powder feeding parameters exhibit negligible influence on flow field intersections. The resulting powder spot demonstrates a rectangular profile slightly exceeding the laser spot dimensions, and the powder concentration exhibits a distinctive flat-top distribution along the laser’s slow axis, contrasting with a Gaussian distribution along the scanning direction. Experimental validation through powder collection tests confirms strong agreement with the simulation results. Furthermore, a mathematical model was developed to accurately describe the powder concentration distribution at the focal plane. These findings provide fundamental theoretical guidance for optimizing powder feeding systems in wide-beam LDED applications.

1. Introduction

Laser direct energy deposition (LDED) is one of the main technologies for additive manufacturing. LDED deposits powder or wire materials on the substrate, which has a very flexible build direction due to the use of a multi-axis robot arm [1]. A small heat-affected zone (HAZ) and good metallurgical bonding can be easily gained, and the mechanical properties of the parts can also be significantly improved due to the fine microstructure [2]. Therefore, LDED has unique advantages in the field of parts repairing and re-manufacturing.
Powder feeding LDED blows the powder material into the laser melt pool by inert gas, and a powder stream is ejected from single or multiple pipes. The powder flows converge into the melt pool and then experience rapid melting and solidification. The coupling of the melt pool and powder stream is very important for the geometry and properties of the cladding layer. The powder quantity trapped in the melt pool and spatial powder concentration mainly rely on the nozzle geometry and powder feeding parameters. Both lateral and coaxial powder nozzles are widely employed in LDED. However, the powder stream and the melt pool are prone to being unstable due to the change of laser scanning direction in the lateral feeding system [1,3]. Therefore, the coaxial powder nozzles have been more widely used because the relative location of the powder stream to the melt pool is not affected by the laser scanning direction [4,5,6]. The powder distribution of coaxial nozzles exhibits an annular profile near the nozzle outlets and a Gaussian profile at the convergence plane [7]. Li et al. [8] found that the powder spot diameter reduced with the increase in nozzle length, and the powder concentration became more uniform. Increasing the nozzle diameter can improve the powder convergence significantly, but it brings the risk of powder nozzle blockage [8]. Doubenskaia et al. [9] reported consistent findings demonstrating that long nozzles produce denser and more focused powder streams, whereas shorter nozzles exhibit larger inclination angles and more dispersed powder deposition patterns.
Previous studies have reported that key nozzle geometric parameters—including tip angle, outlet spacing, and outlet dimensions—significantly influence powder stream convergence characteristics, deposition efficiency, and resulting clad morphology [10,11,12]. Gao et al. [13] conducted a comparative study of powder flow characteristics among three nozzle configurations (annular, three-jet, and four-jet), revealing that the annular nozzle design achieved minimal divergence angle (only 8°), higher powder concentration, and greater energy efficiency. To eliminate the gravity effects on the powder stream, Nasiri et al. [5] designed a continuous coaxial nozzle to improve the powder stream convergence. Unlike the aforementioned outside-laser coaxial powder feeding, the inside-laser powder feeding only has a single vertical pipe in the ring laser beam for enhancing the powder convergence [14,15]. For a given powder nozzle structure, the process optimization has attracted significant attention from many researchers. Wang et al. [14] found that the powder divergence can be reduced by increasing the shielding gas flow rate or decreasing the carrier gas flow rate. In order to optimize the powder catchment efficiency, Pant et al. [16] confirmed an optimal stand-off distance corresponding to the maximum powder concentration and minimum powder spot. Optimizing the carrier gas flow rate and powder feeding rate is also an effective approach to improve powder utilization efficiency. By using this method, the powder utilization efficiency can exceed 80% in Ref [17].
Analytical and numerical simulation models are extensively utilized to characterize powder flow field dynamics, enabling the prediction of powder utilization efficiency and the optimization of both nozzle geometry and feeding parameters. Lin [12] established an analytical model of powder mass concentration distribution, demonstrating that the concentration on the focal plane exhibits a Gaussian-like distribution. This model was subsequently improved and validated by Pinkerton and Li [18]. Based on a similar model, Lin et al. [19] developed an analytical model about laser attenuation and powder particle temperature to reveal the relationship between the particle heating process and particle trajectory. These analytical models effectively elucidate the relationships among nozzle geometry, powder stream morphology, and feeding parameters, offering significant advantages in both qualitative analysis and computational simplification. However, the powder stream divergence angle, powder spot size, and focal position exhibit significant dependence on feeding parameters [1,17]; current analytical models face inherent limitations in adequately incorporating these relationships, consequently compromising computational accuracy. Computational fluid dynamics (CFD) models typically employ the finite volume method to solve gas–solid two-phase flow characteristics based on fundamental conservation laws of mass and momentum [3]. This approach offers significant advantages in reducing experimental costs and facilitating process parameter optimization. Based on a CFD model, Zhang et al. [20] found that the powder stream obtains the best convergence when the carrier gas flow is between 2.0 and 3.0 L/min, which is helpful to improve the powder utilization efficiency and deposition quality. Chu et al. [21] developed a CFD model to optimize nozzle stand-off distance and carrier gas flow for improved powder concentration and utilization efficiency. Another advantage of the CFD model is to reveal the underlying physical mechanism of the powder flow field. The influences of particle size distribution, collision recovery coefficient, and even nozzle abrasion on the powder flow field can be clarified by CFD models [22,23], and the mechanism by which the turbulent flow affects the particle speed and the powder flow convergence can also be clarified by CFD models [16].
In recent years, LDED systems with high power and large spot (i.e., wide-beam LDED) have been developed and widely used to promote the deposition efficiency [24,25]. The laser beam is converted from a round spot to a band spot, the width of the slow axis is markedly increased, and the laser beam is homogenized to diminish the negative effects caused by the excessive temperature gradient of the melt pool [26]. The wide-beam LDED is usually equipped with rectangular powder nozzles to achieve optimal laser-powder coupling. Present studies mainly focus on geometric optimization for rectangular nozzles [10,27]. There is a lack of an analytical model of powder concentration distribution for wide-beam LDED, unable to provide a theoretical foundation on the forming mechanism of wide-beam laser cladding. Therefore, further studies are required to analyze the powder flow field properties and to develop a practical model for the rectangular symmetric powder nozzle.
In this study, a CFD model was developed to analyze the powder flow field characteristics of rectangular symmetric powder nozzles. The model was employed to systematically investigate the influence of powder feeding parameters on focal position, powder concentration distribution, and powder spot dimensions. Furthermore, a two-dimensional mathematical model was derived to describe the powder concentration distribution on the focal plane. The model’s accuracy was experimentally validated through systematic powder collection tests. This model provides a fundamental theoretical framework for investigating geometric control methodologies in wide-beam LDED processes.

2. Materials and Methods

2.1. Materials

For this research, 316 L stainless steel powder (Hebei Jingye Additive Manufacturing Technology Co., Ltd., Shijiazhuang, China) is used as powder feeding material. Its chemical composition is listed in Table 1. The particle size distribution and powder morphology characteristics are listed in Table 2. All the data are from the powder supplier.

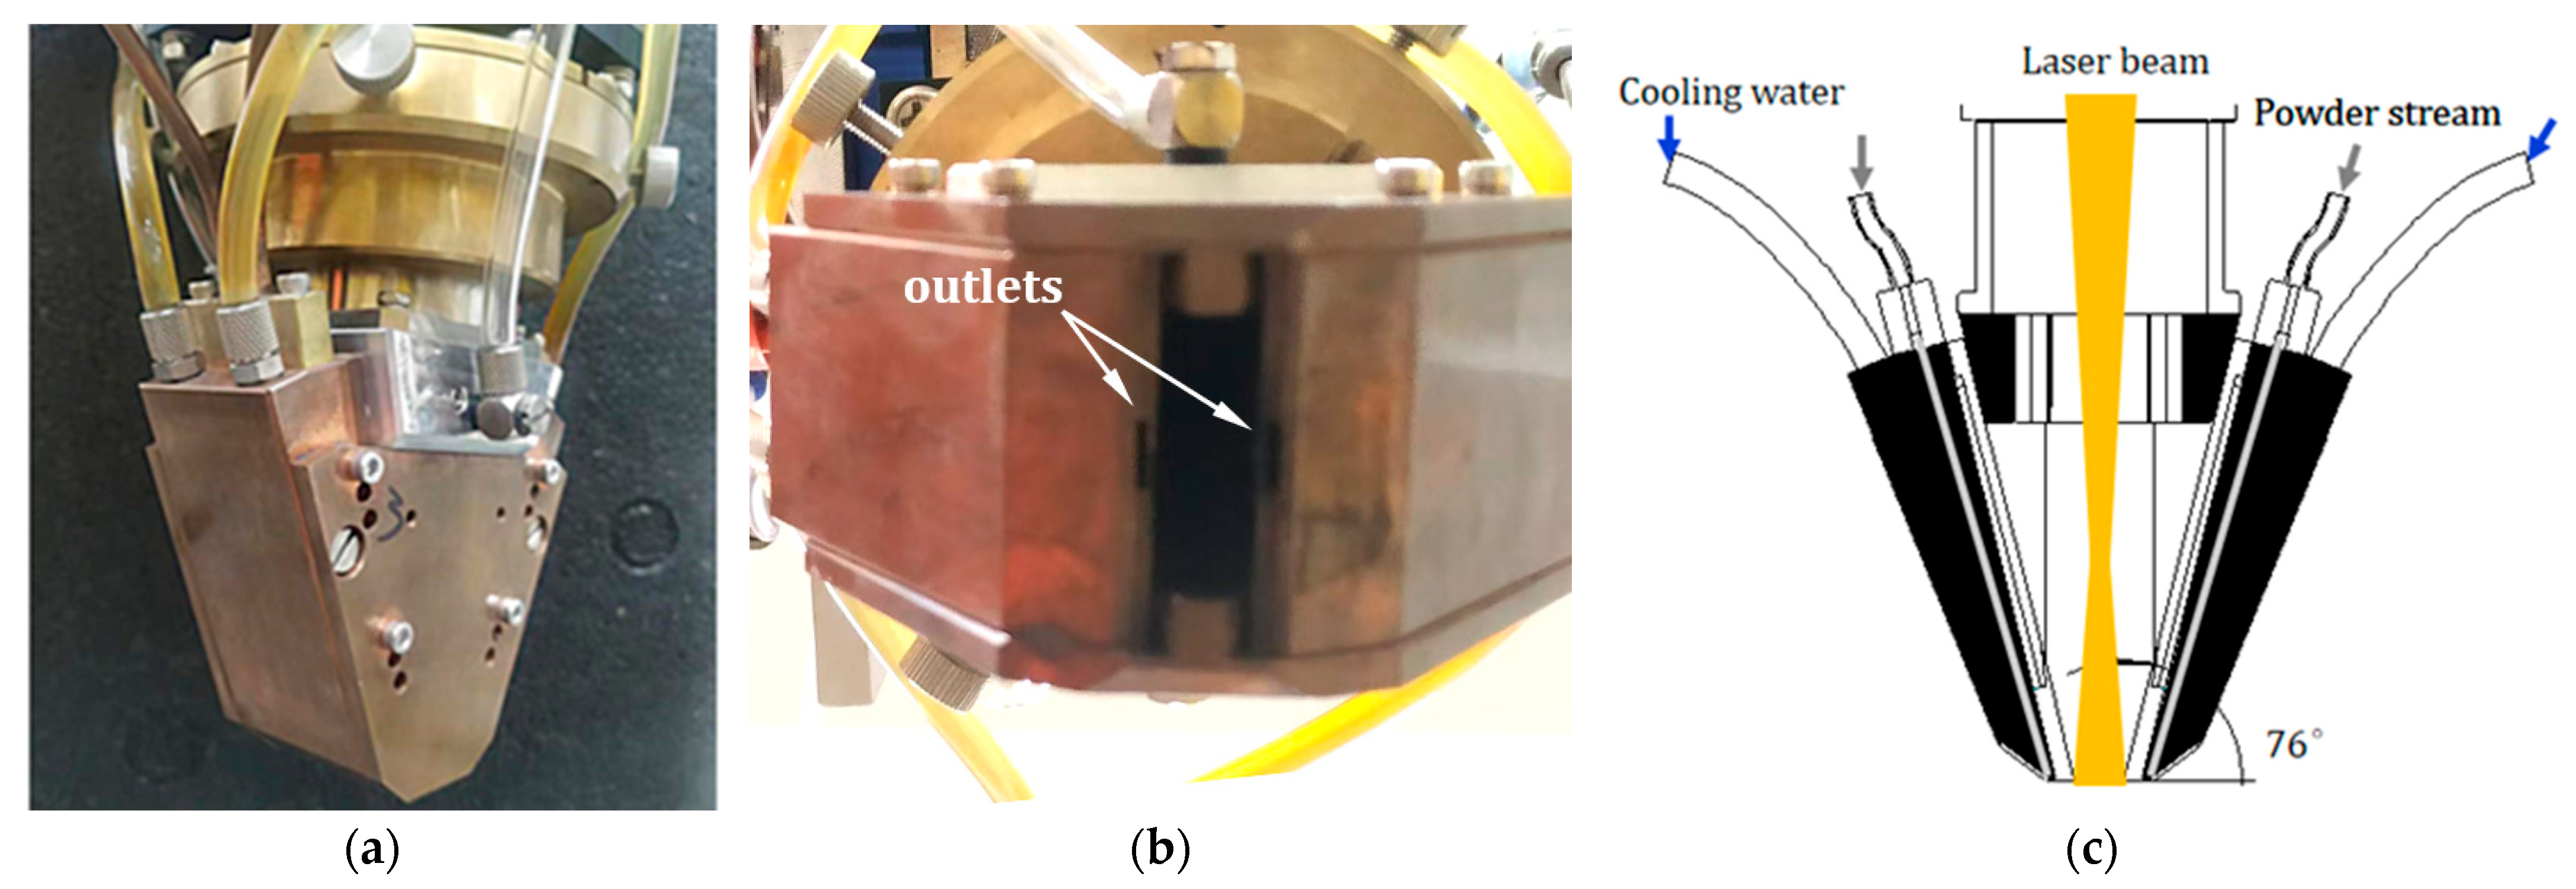
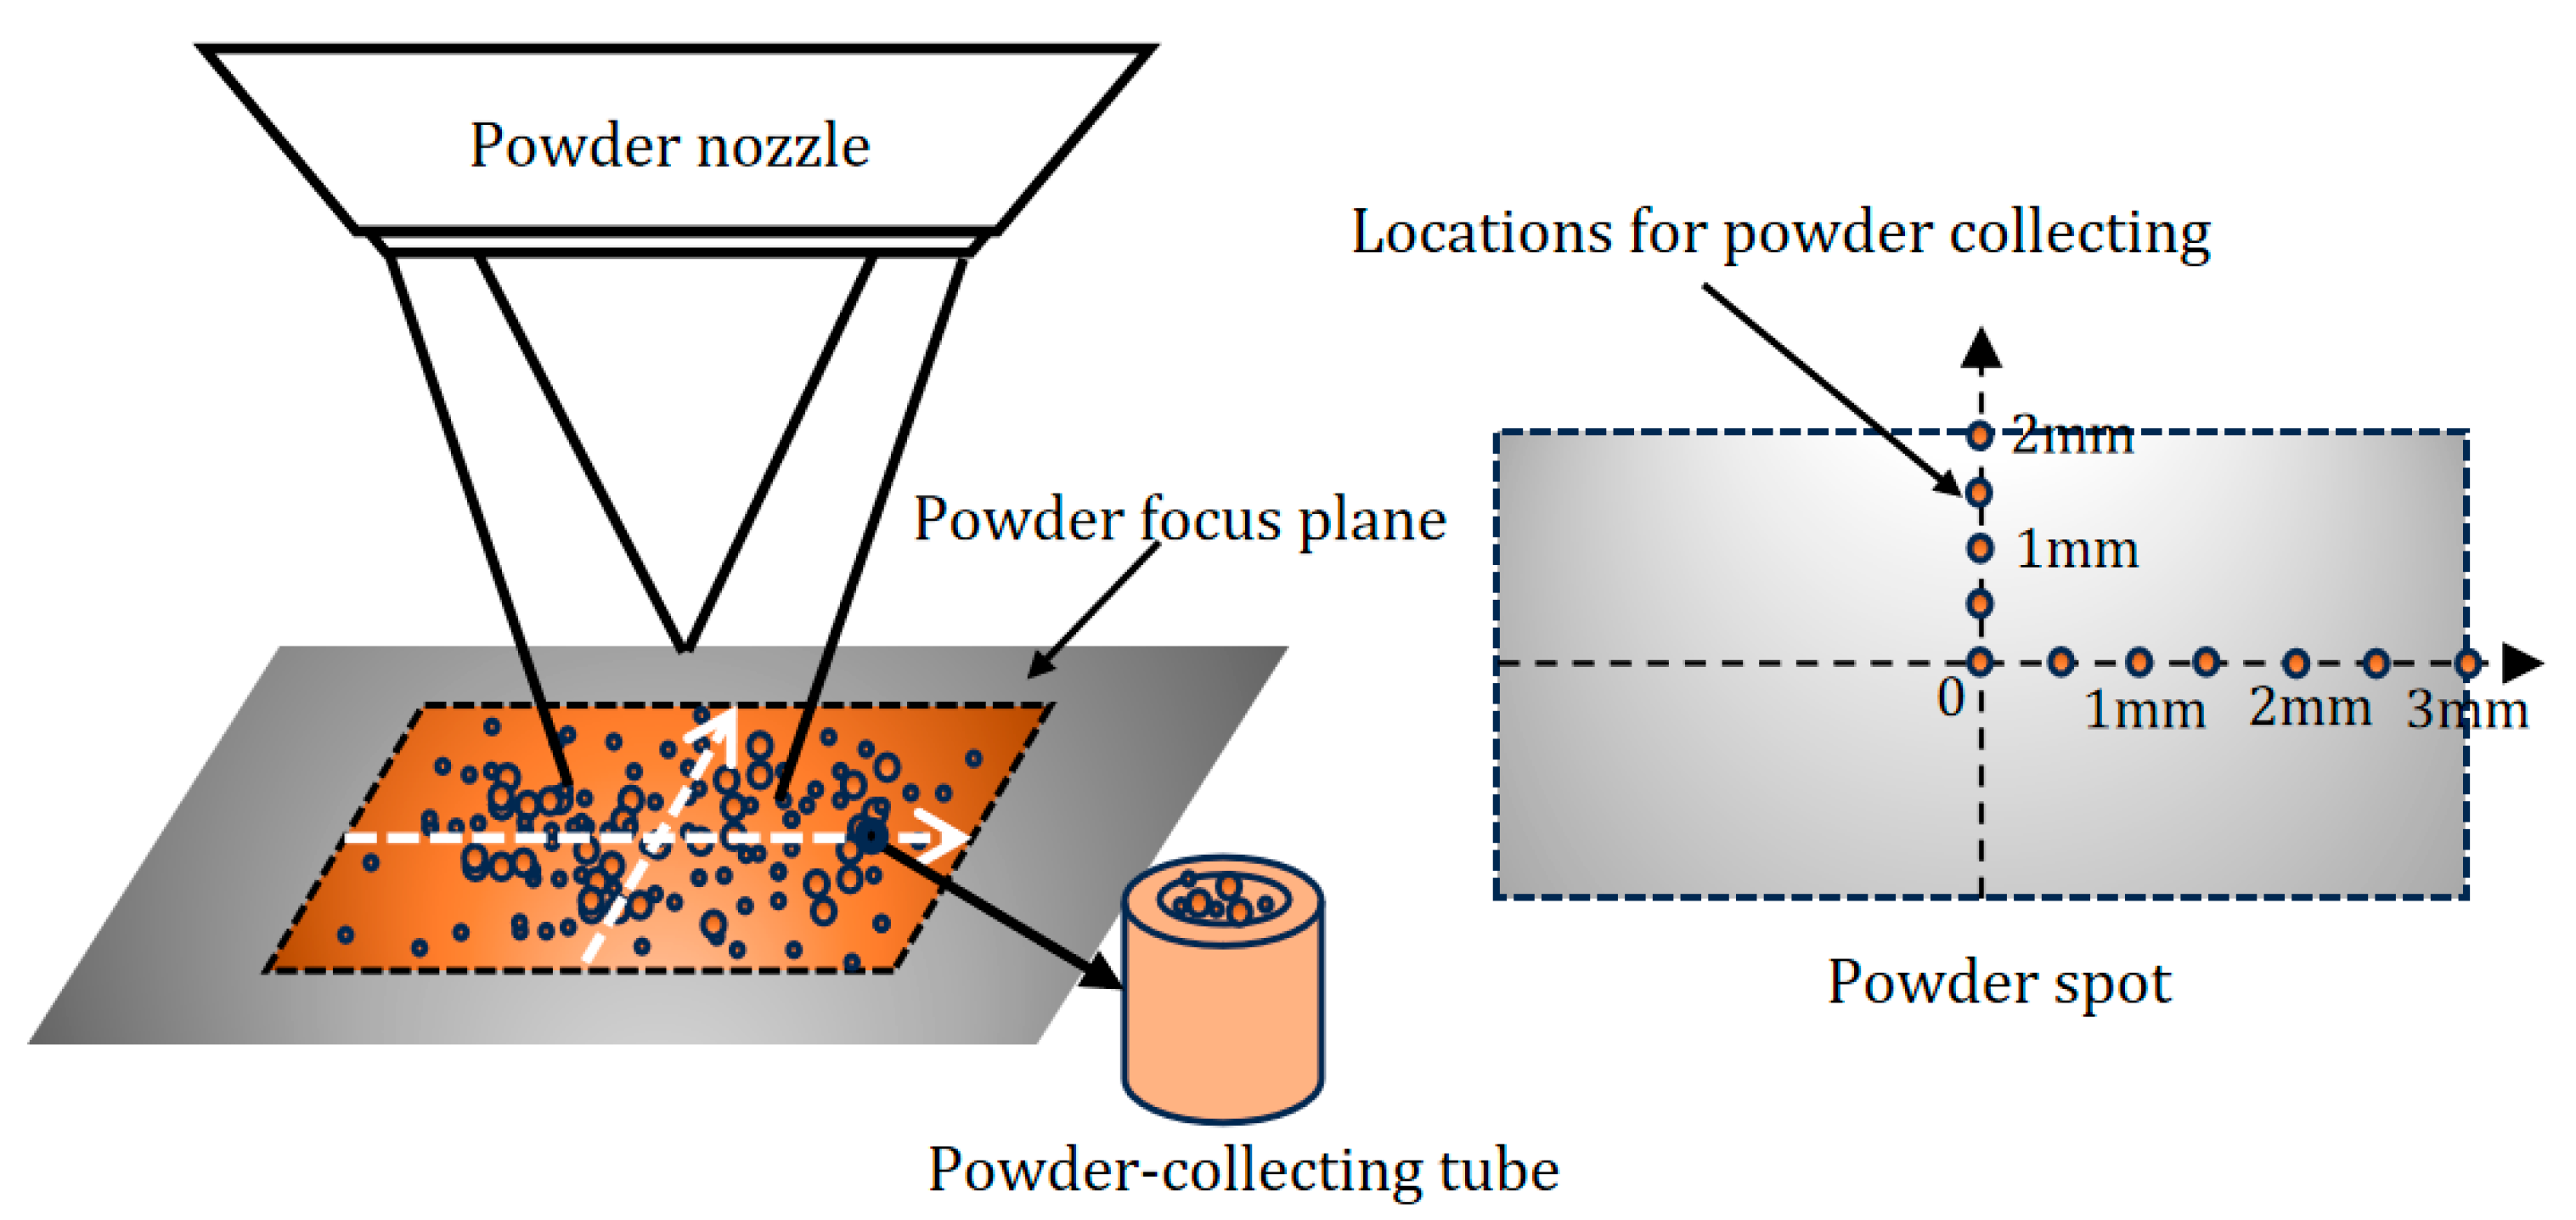
2.2. Experimental Setup

The wide-beam LDED system was utilized to conduct related studies and experiments. The system contains a fiber laser (TruFiber Cut 3000, Dichengen, Germany), a 6-axis robot arm (Kuka KR 20, Augsburg, Germany) equipped with a laser head, a chiller, a double-tank powder feeder, and a worktable. The laser focus length is 330 mm, and the laser spot size on the substrate surface is 6 × 2 mm. The powder feeder disk rotates at 0–10 r/min. A 99.99% argon gas is utilized as carrier gas and shielding gas.

2.3. Methods

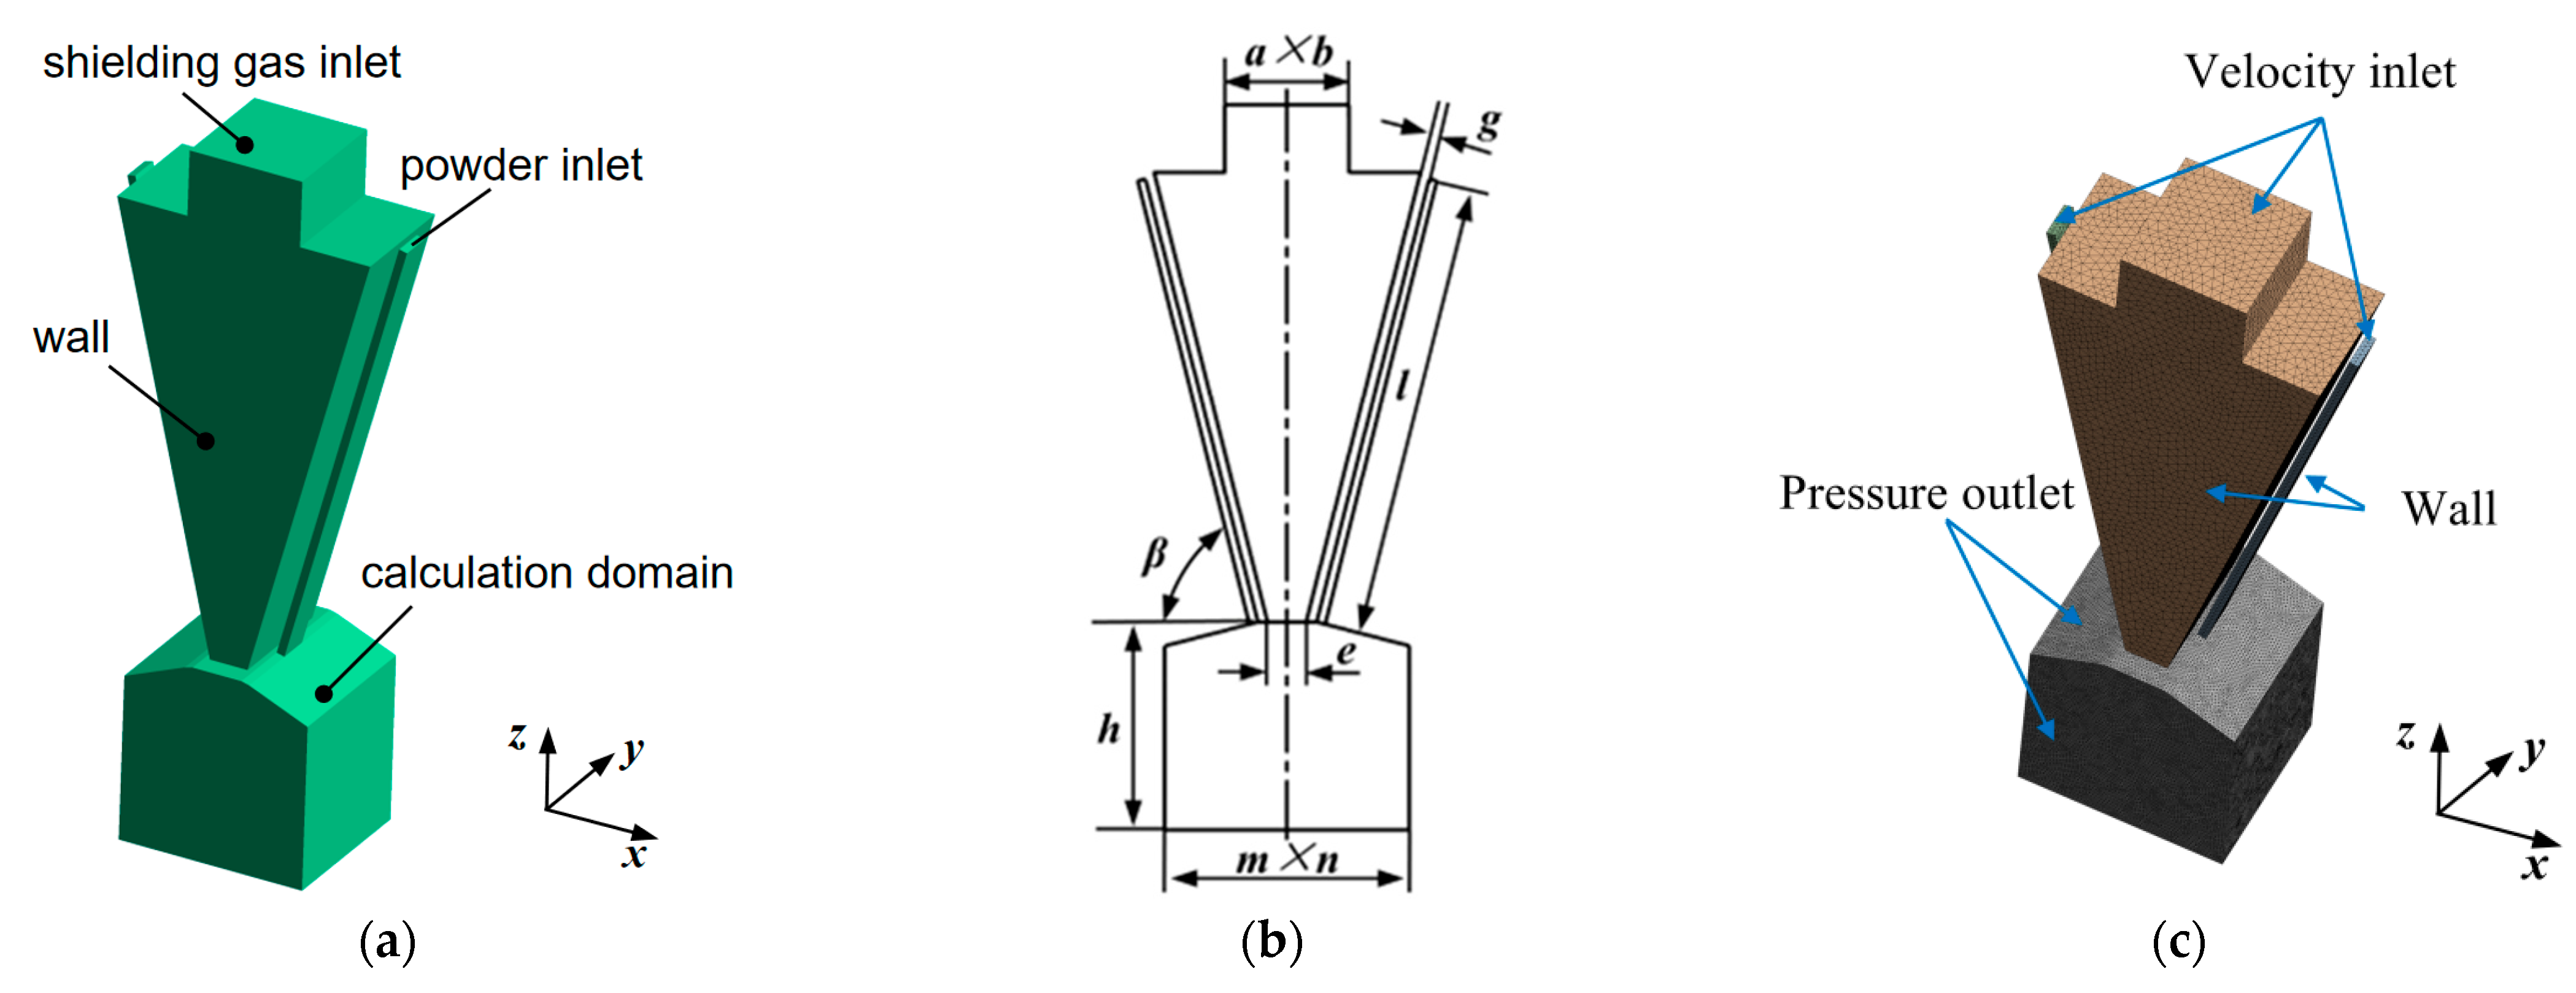
2.3.1. Physical Model of the Rectangular Powder Nozzle

In wide-beam LDED systems, the rectangular geometry of the laser spot needs a corresponding rectangular powder spot configuration to ensure optimal spatial matching between the energy input and material deposition. As seen in Figure 1, the laser beam enters the laser head along its axis, while two symmetrically arranged powder feeding pipes with rectangular outlets (76° tilt from horizontal) deliver material to both sides.
A physical model of the powder nozzle is required to calculate the powder flow field. It is necessary to make reasonable simplifications to facilitate computational efficiency due to the complex structure. Therefore, the delivery pipes and the shielding gas enclosure were collectively designated as the computational domain for the CFD analysis. Figure 2 shows the physical model of the rectangular powder nozzle built by commercial 3D software SolidWorks 2016. The simplified model contains a shielding gas region, powder pipes, and a calculation domain below the nozzle outlets (Figure 2a). The shielding gas zone was isolated from the laser head assembly, with its boundary surfaces defined by the surrounding laser head cavity walls. Taking the powder divergence into account, the calculation domain below the nozzle outlets has sufficient volume to wrap the powder flow field and the shielding gas region. The geometric parameters are shown in Figure 2b, where a and b are the length and width of the shielding gas inlet, respectively. e is the width of the shielding gas outlet, g is the distance between the nozzle and the shielding gas wall, l is the pipe length, and β denotes the inclination angle between the nozzle’s central axis and the horizontal reference plane. h, m, and n are the height, length, and width of the calculated domain below the powder nozzle, respectively. The specific dimensions of the model are provided in Table 3.
The meshing of the powder nozzle is very simple due to the reasonable simplification of the model. As shown in Figure 2c, the flow field was meshed with the Fluent 19.0 meshing tool, and a tetrahedral mesh was adopted to improve the computational speed and grid quality. Dense mesh and sparse mesh were applied to different areas to guarantee the computational accuracy and speed; the grid size of the shielding gas zone was set to 0.8 mm, and the nozzle pipes grid size was 0.7 mm. It has been reported that grids with suitable sizes can catch the powder more efficiently; both overly coarse and overly fine grids would reduce the particle capture efficiency, resulting in simulation errors of CFD models [28,29]. Considering particle capture efficiency and calculation accuracy, a 0.5 mm grid size was adopted for the domain below the nozzle. The total number of grids in the computational domain is 389,649. Considering random collisions between the particles and the nozzle wall, the particle tracks and their final landing locations are different on both sides, which may cause asymmetric powder distribution of the two nozzle pipes. To ensure modeling accuracy, we deliberately avoided adopting nozzle geometric symmetry in our simulations.

2.3.2. Assumptions

The powder flow gas–solid field is computed by Fluent 19.0. The powder stream and the shielding gas are simulated as discrete phases and continuous phases, respectively. Some necessary preconditions and assumptions are presented to solve the model.
(1)
Since the volume fraction of powder particles in the feeding gas is less than 10%, the discrete phase model (DPM) is utilized to simulate the movement of powder particles [3]. The interactions among particles are ignored; the Lagrange method and Euler method are used to calculate the movement of particles and gas, respectively.
(2)
The heat transfer between the powder and the laser during flight is negligible; the particle shape and flight track have also not been affected.
(3)
The particle size conforms to the Rosin–Rammler distribution [14].
(4)
The inertia, gravity, and drag force of powder particles are considered [7].
(5)
The initial velocity and direction of the particles at the nozzle inlets are the same as the carrier gas [7,29].
(6)
The steady state is adopted to solve the powder flow field.

2.3.3. Parameter Configurations for Solution

A pressure-based steady-state solver was chosen to calculate the powder flow field. The gravity is −9.81 m/s2 down the Z axis. The standard k-ε turbulence model was utilized to calculate the continuous gas phase, considering the low flow speed of the feeding gas and shielding gas. The k-ε model is a semi-empirical model based on experiments, which has good feasibility to ensure the computational accuracy for high Reynolds number turbulence.
Assuming that the powder particles have the same velocity as the carrier gas when they are shot into the nozzle pipe, and the two inlets have equal velocity, then the incident velocity is as follows:
v = Q f 2 S ,
where Qf is carrier gas flow rate (L/min) and S is cross-section area of the rectangular powder pipe (mm2). When the carrier gas flow rate is 10 L/min, the calculated incident velocity v is 9.26 m/s according to Equation (1). The incident velocity of shielding gas can be solved in the same way.
The powder particle size distribution follows the Rosin–Rammler rule, the minimum particle size is 67.3 μm, the maximum particle size is 219.8 μm, and the average particle size is 110 μm. The parameters of the continuous phase and discrete phase are listed in Table 4.
For boundary conditions, the inlets of the two nozzle pipes were set as velocity inlets, and the region below the powder nozzle was set as a pressure outlet with zero static pressure. The pipe’s inner wall was treated as a surface of the reflecting type with a rebound coefficient of 0.95. The relax factor was set to 0.3, the density was set to 1, and the body forces were 1.

3. Results and Discussion

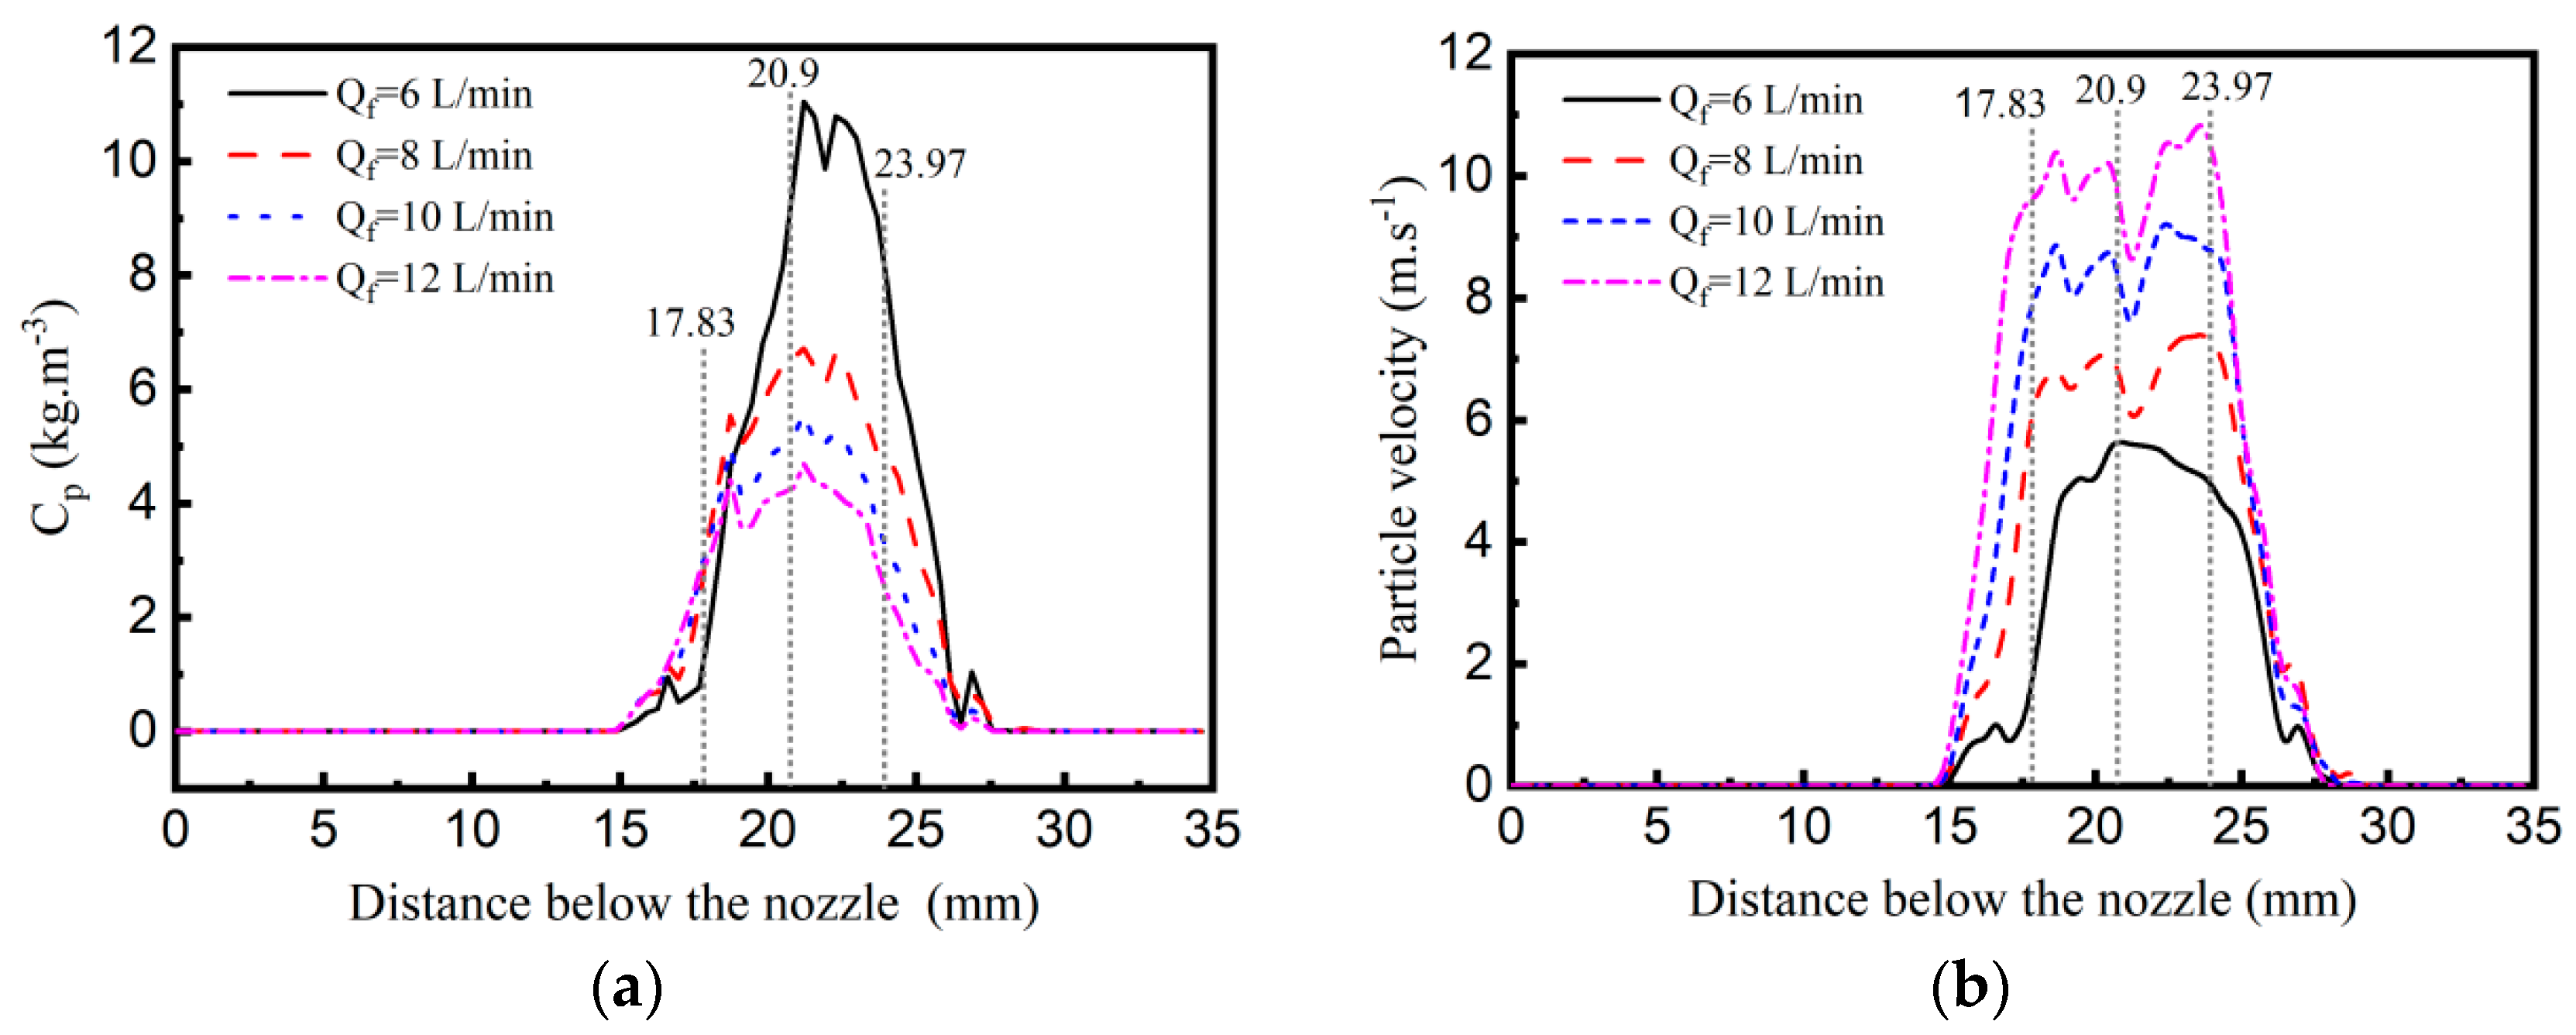
3.1. Dynamic Properties of the Powder Flow Field

The powder particles are subject to different forces and flow fields when they are in the pipes or leave the outlets. Inside the pipes, there exist frequent collisions among particles or between particles and the inner wall. Once the particles fly out of the outlets, the relative static pressure drops to zero, and the gas flow disperses rapidly, the particles are mainly affected by inertia and gravity, while the drag effect is relatively weakened. Therefore, it is important to study the dynamic properties of the powder flow field.
The velocity field of the gas flow was computed when the carrier gas flow rate was 10 L/min and the shielding gas flow rate was 18 L/min. Figure 3 shows the velocity distributions on different longitudinal planes. Plane y0 is the symmetrical plane of the powder stream (i.e., x–z plane); plane y3 is parallel to plane y0 and 3 mm away from it. As seen in Figure 3a, the gas flow velocity remains almost unchanged due to the constant cross-sectional area of the pipes. The velocity near the outlets increases slightly, and the maximum velocity is about 10.7 m/s. The flow velocity near the inner wall is lower mainly due to the influence of viscosity between the gas flow and the pipe wall. Both the shielding gas pressure and the flow speed increase because of the narrowed outlet; however, the outlet velocity is only 2.8 m/s due to the large cross-sectional area. Furthermore, the gas flow velocity varies greatly at different longitudinal cross-sections. In Figure 3b, the velocity decreases markedly on the y3 plane.
The gas flow spreads out quickly at the outlets, and it can be divided into a central region, a divergent region, and a vortex region according to the flow velocity (Figure 3b). The central region has the highest velocity and can keep its previous flow direction; there is a triangular region formed with significant convergence. The divergent region is adjacent to the central region and has a small divergence angle within 20°. It can be seen that the flow velocity is relatively uniform and slows down a little. The feeding gas flows converge very close to the outlets, by which the protective gas flow is obstructed to some extent. There are two possible reasons for the vortex region forming. One reason may be the interaction between the diffused gas and the surrounding air, and the interaction of two gas flows (carrier gas and shielding gas) with different velocities can also cause the vortex formation. It is noticeable that the highest flow velocity does not emerge at the outlets but at the gas intersection (Figure 3b), which is because of the vortex effect from the central region. Figure 3c shows the flow velocity distribution at the powder stream focal plane, which exhibits approximately a Gaussian distribution. The flow velocity remains stable over a large region, which is helpful to avoid the cladding layer from oxidation, and prevent the spattering powders into the laser head.

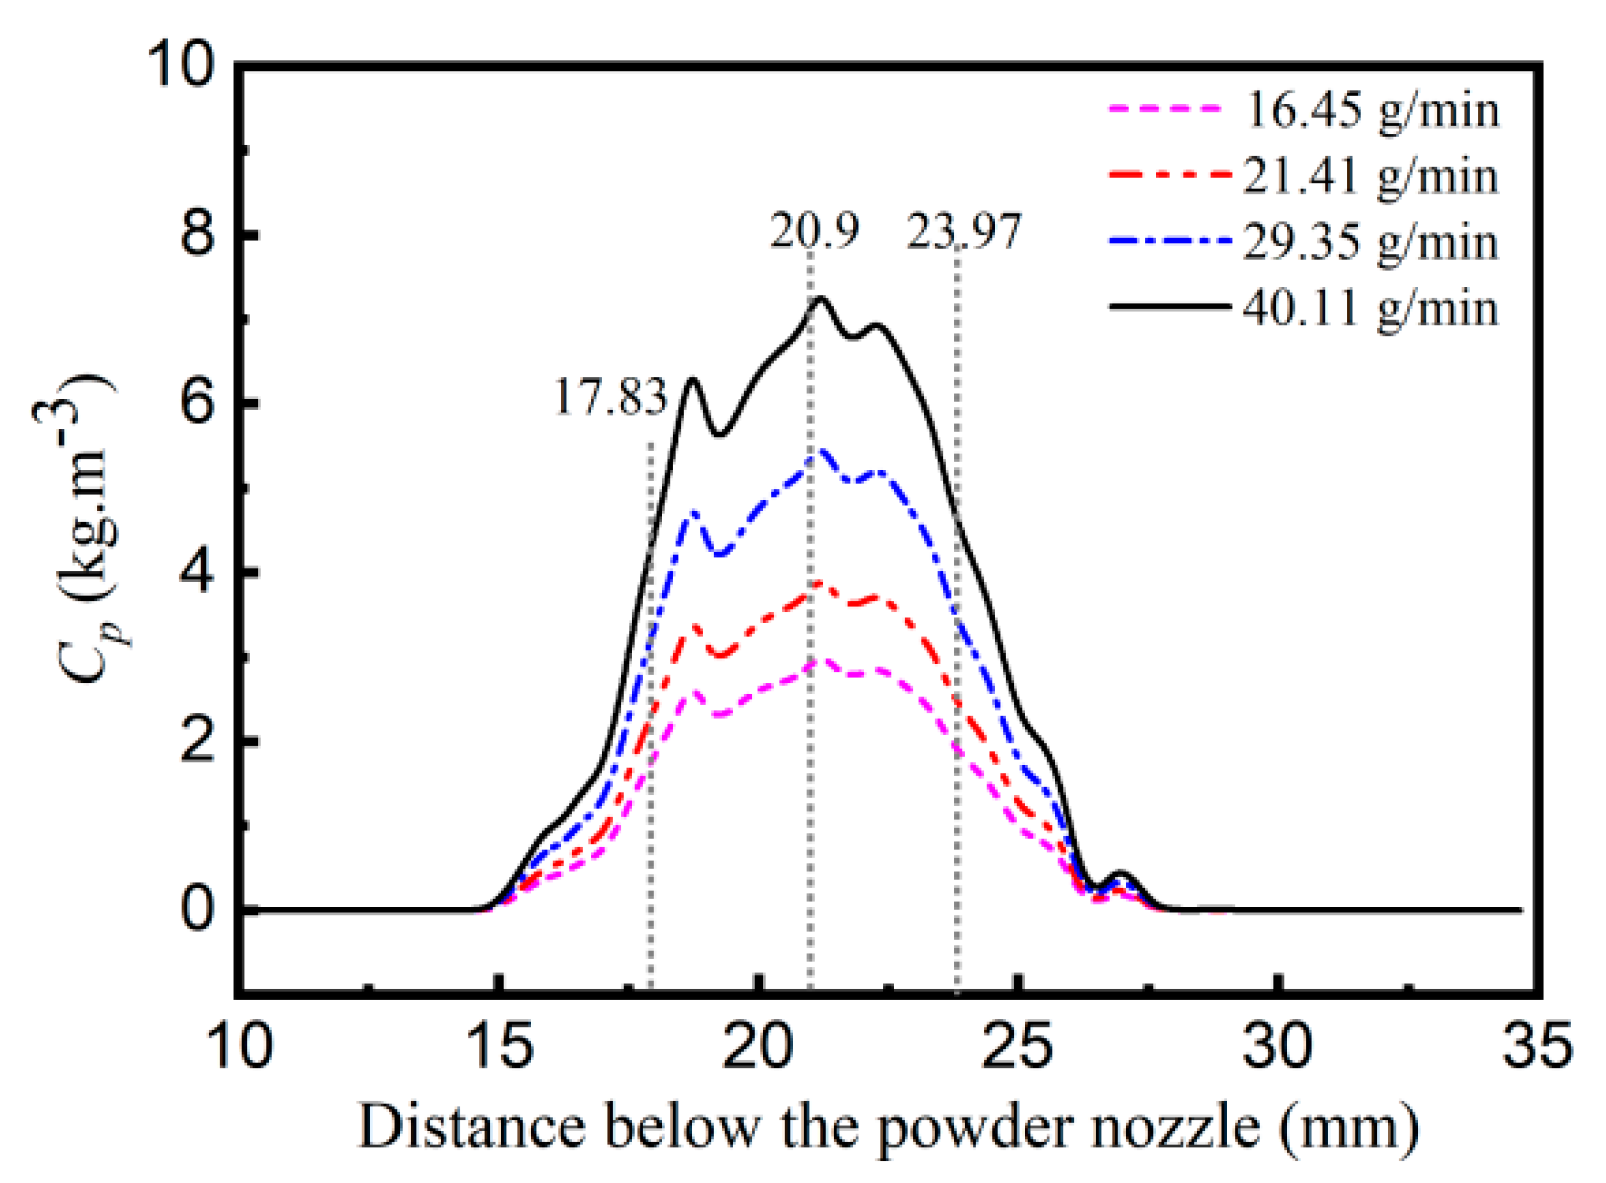
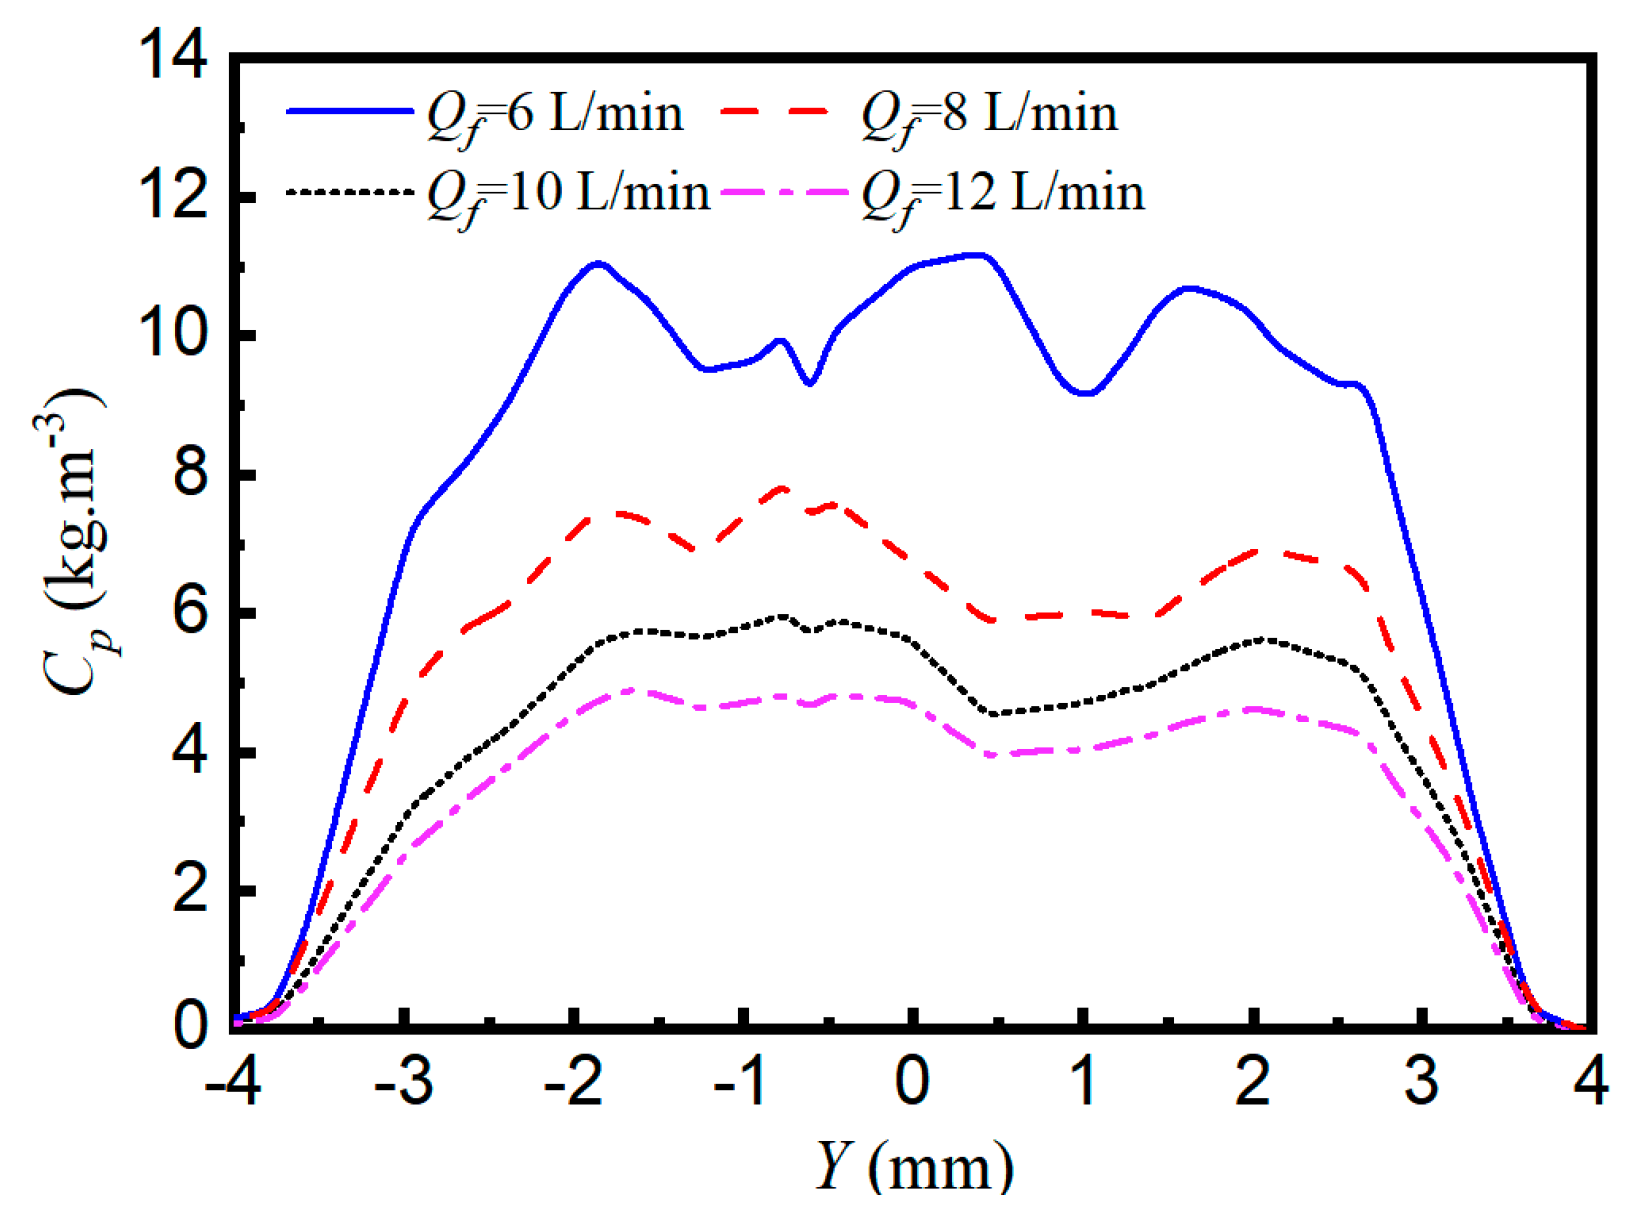
3.2. Powder Concentration Distribution of the Rectangular Nozzle

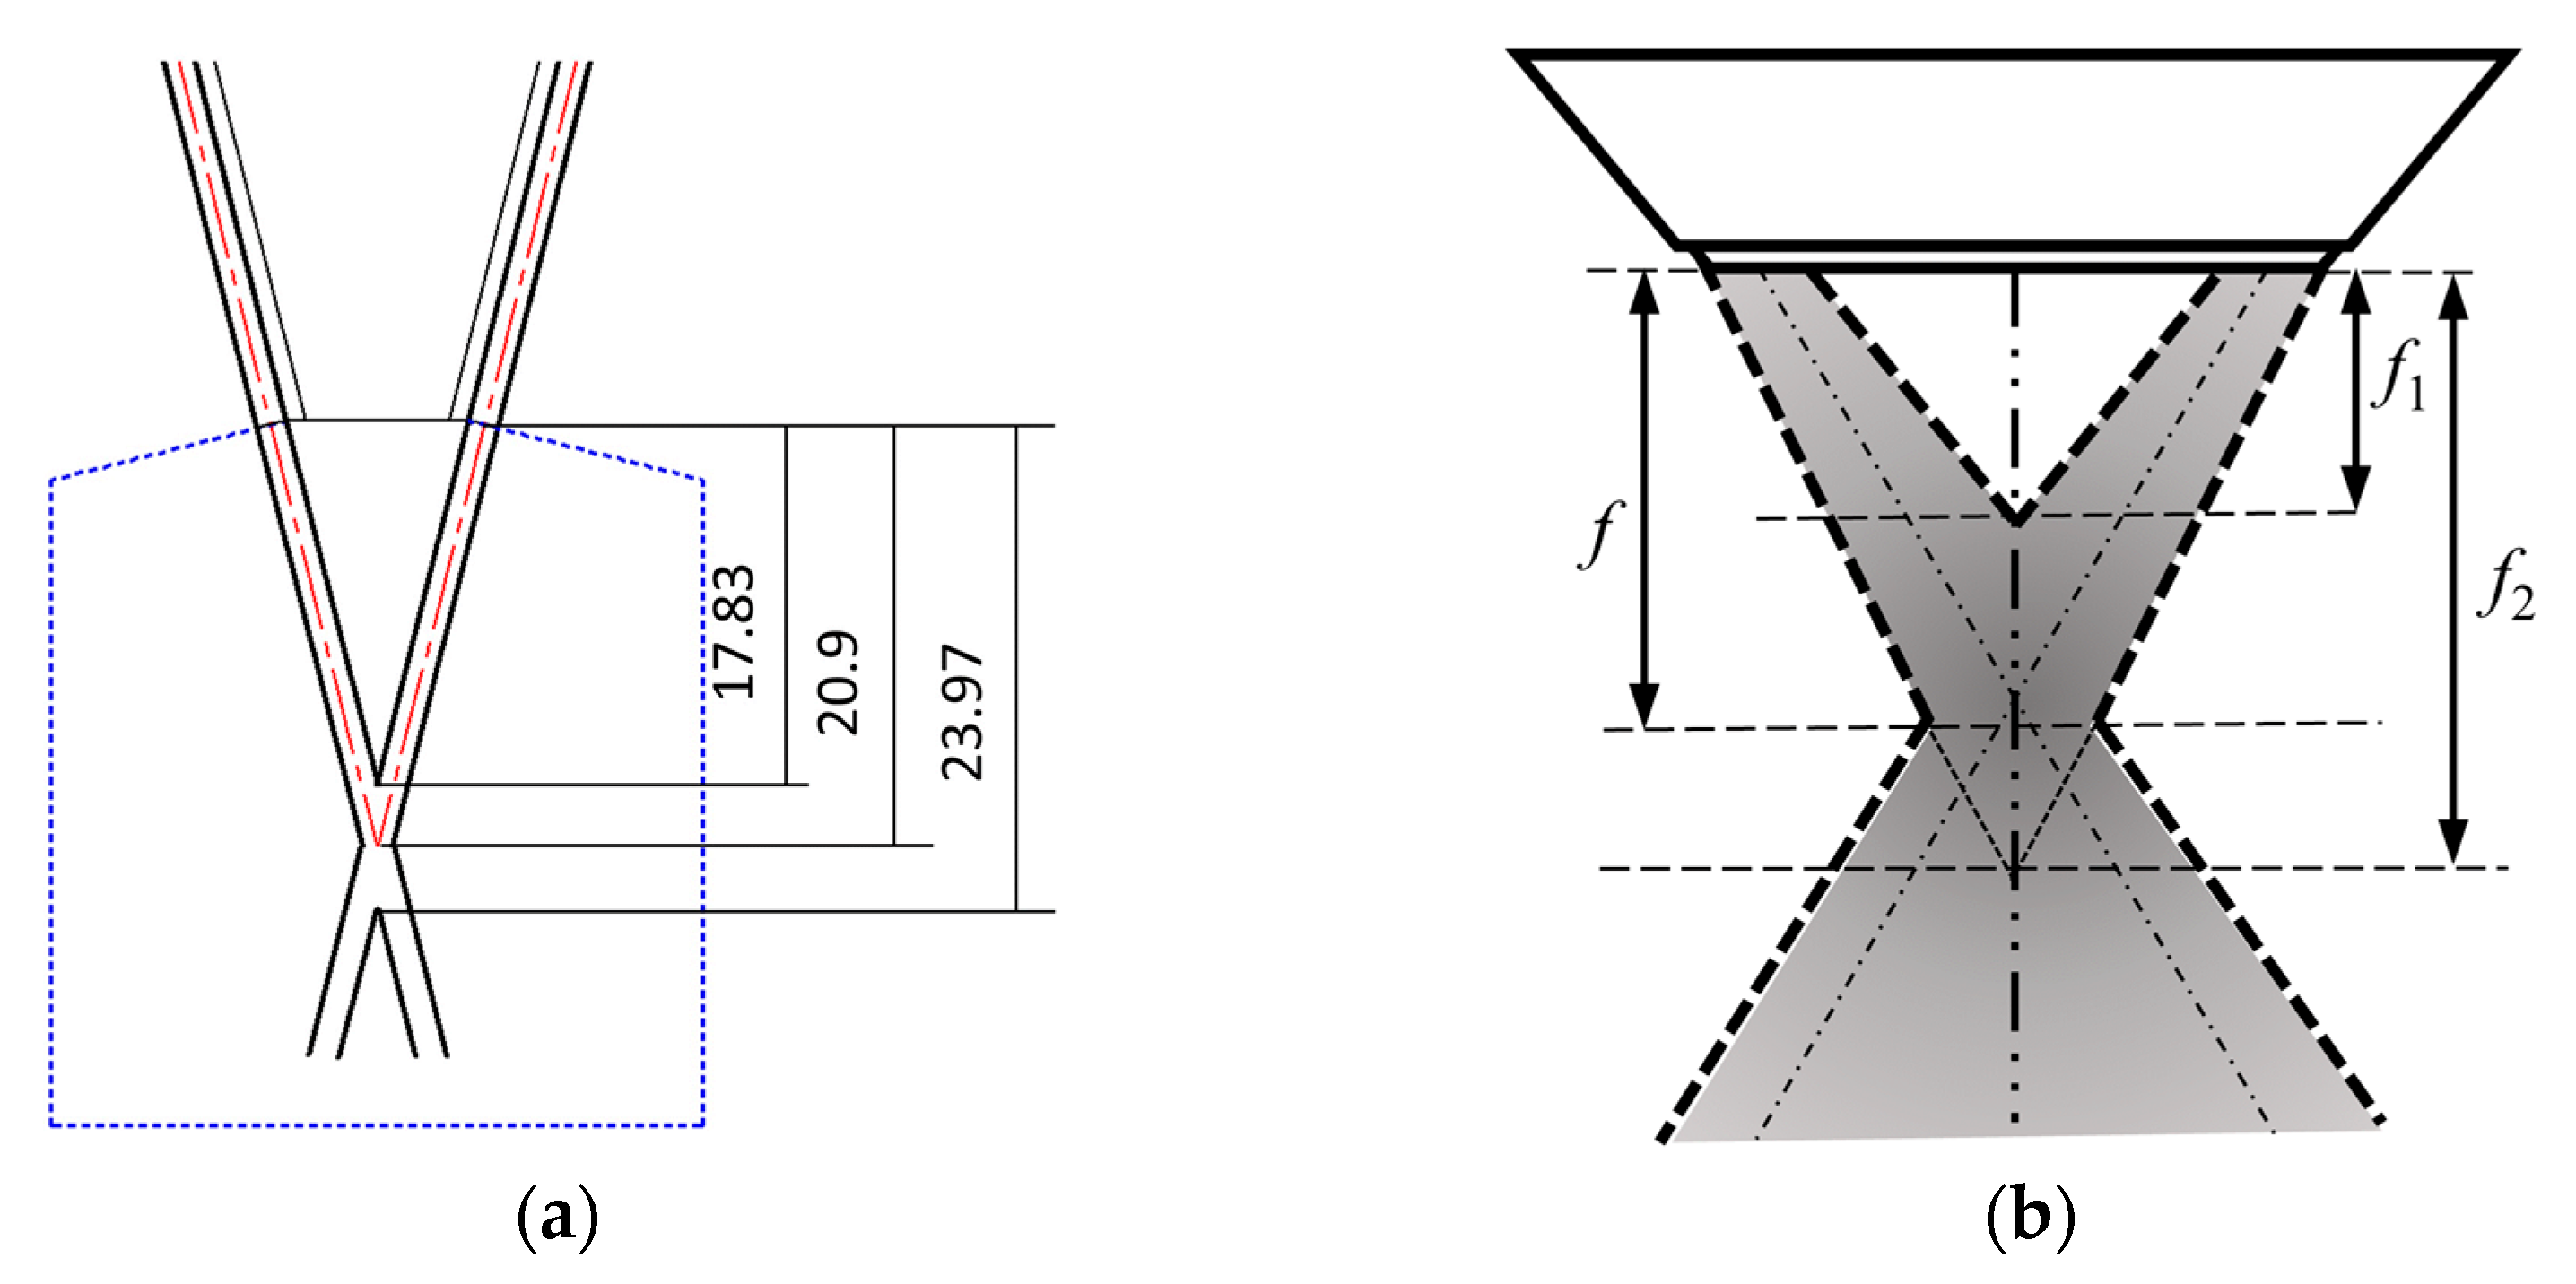
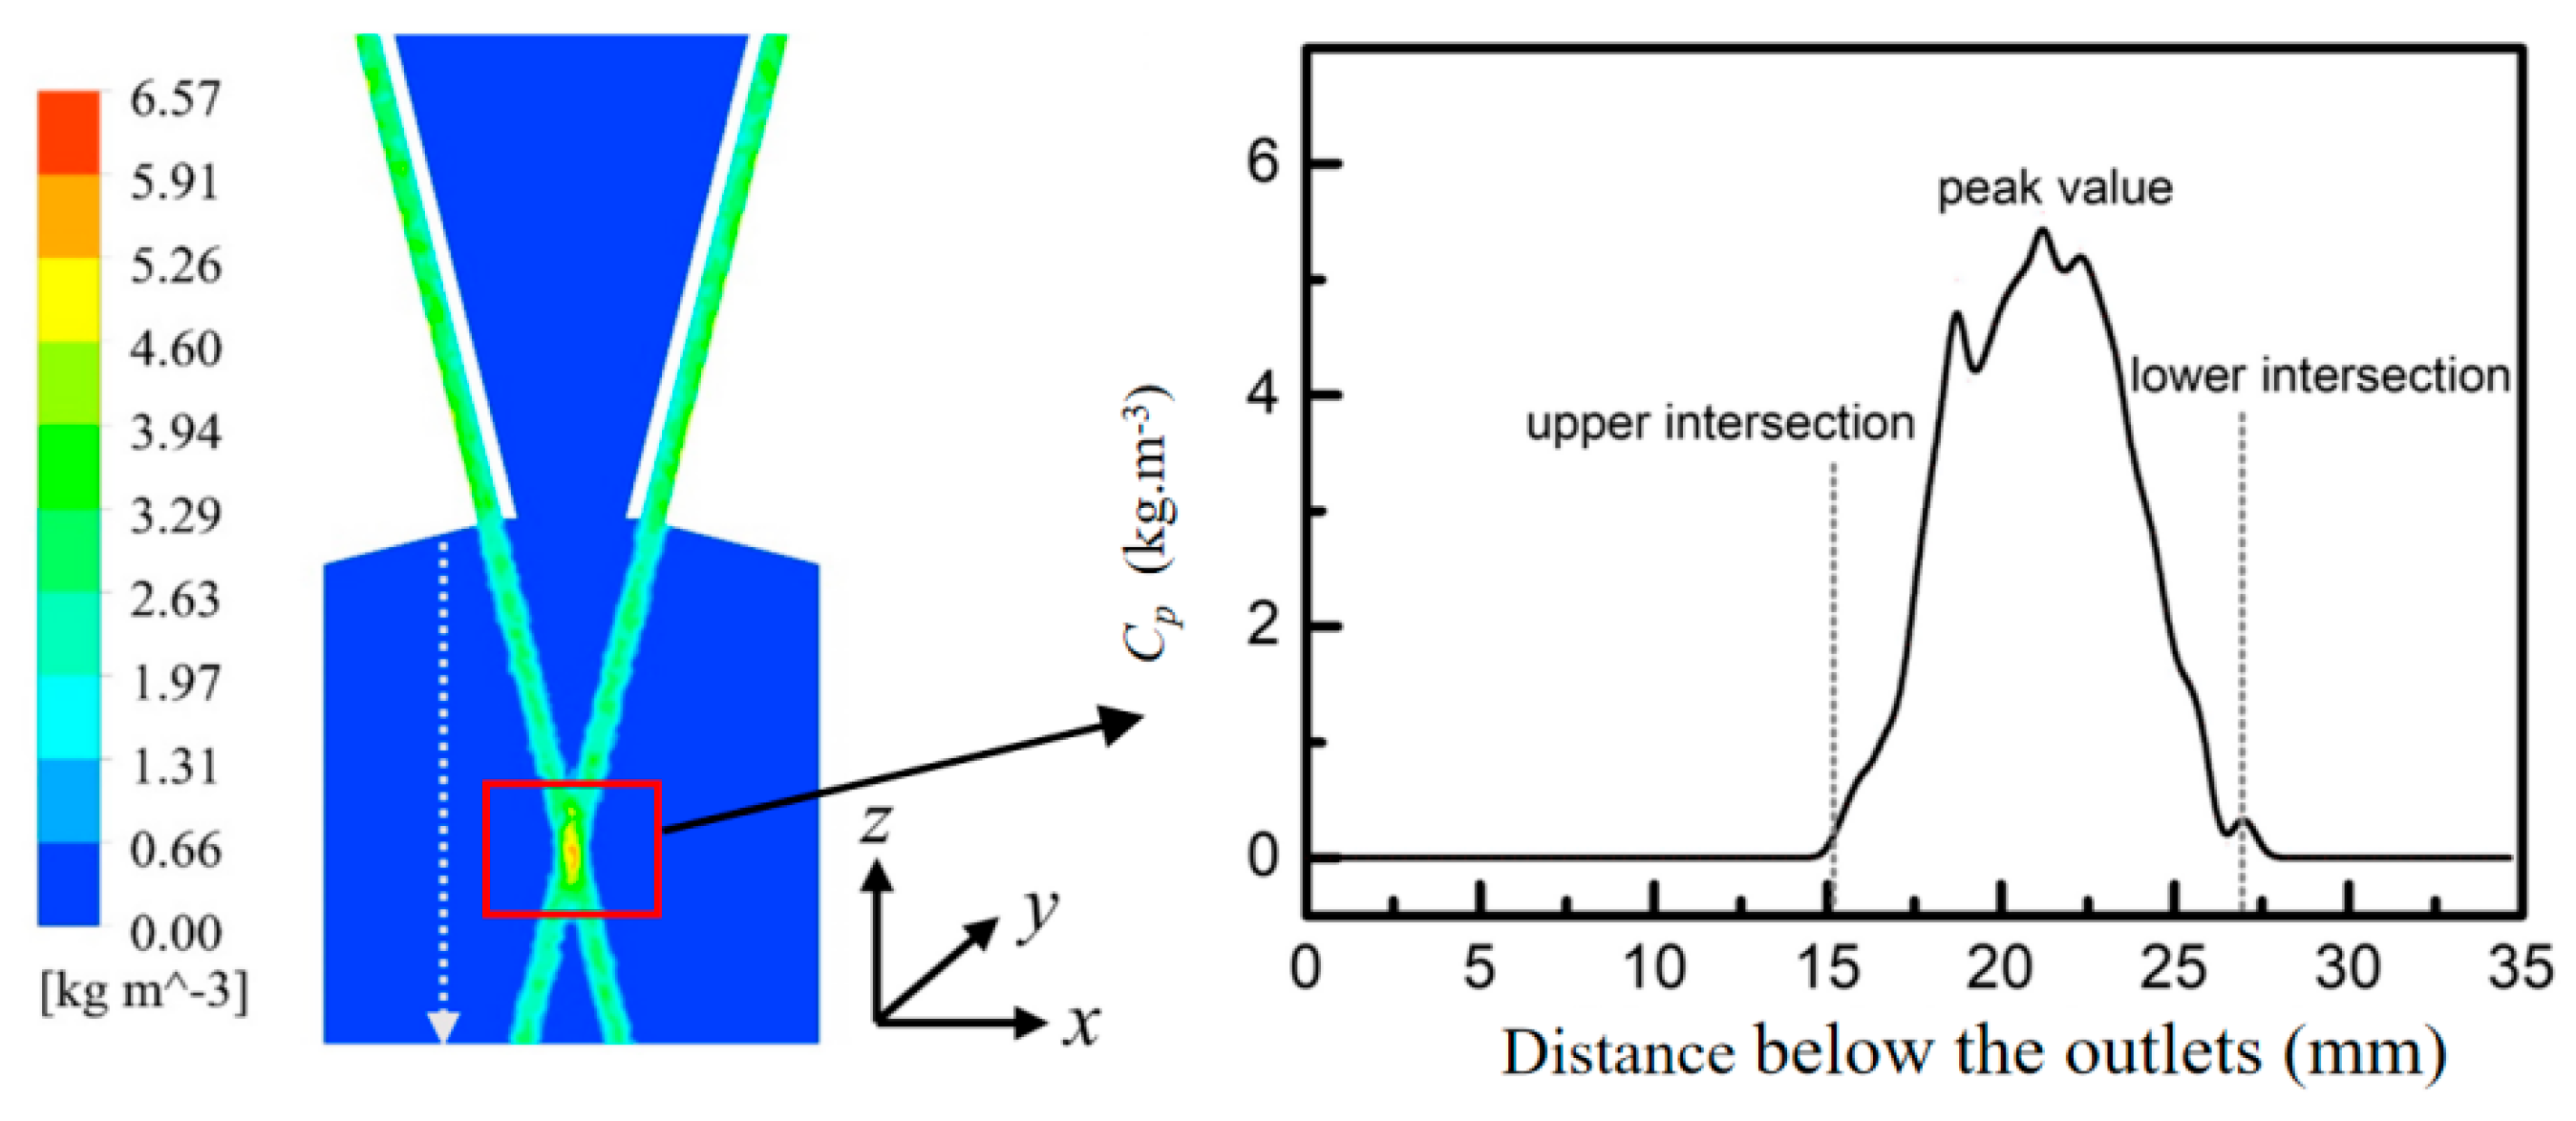
3.2.1. Location of Powder Stream Focal Plane

The two powder flows converge below the outlets, where there exists an upper intersection and a lower intersection. The location of convergence mainly depends on the geometric parameters of the powder nozzle, such as the nozzle pipe tilt angle and distance between the two outlets (β, e in Figure 2b). The ideal powder convergence condition can be obtained if the aforementioned two geometric parameters are known (Figure 4a). Due to the divergence of the powder stream, the upper intersection f1 would rise up while the lower intersection f2 would go down (Figure 4b). There exists the maximum powder mass concentration Cp between f1 and f2, named the focal line; the plane where Cp is located is the focal plane of the powder stream. In order to improve powder utilization efficiency, the focal plane where f is located is usually adopted as the deposition surface of the LDED [30]. Given the ideal situation, the distances of f1 and f2 from the nozzle outlets are 17.83 mm and 23.97 mm, respectively. The length of the focal line is 6.14 mm, and the distance between the focal plane and the outlets is 20.9 mm. For a given geometric structure, the location of the powder focal plane mainly relies on the powder stream divergence extent. Therefore, it is necessary to clarify the effects of powder feeding parameters (powder feeding rate, carrier gas flow rate, and shielding gas flow rate) on the location of the powder focal plane.
The powder concentration distribution on the xz plane is shown in Figure 5. The peak powder concentration can be easily found at the center of the focal line. The powder concentration (Cp) profile exhibits an approximately Gaussian distribution, with its peak located precisely at the focal plane (21.7 mm from the outlets).
Two secondary concentration peaks (Cp) flank the primary peak, corresponding to the upper and lower intersections of the powder stream. The upper intersection is located 15.2 mm from the nozzle, while the lower intersection lies approximately 27.3 mm away. Notably, the focal line measures 14 mm in length, significantly exceeding the ideal theoretical value (6.14 mm).
There are two smaller Cp on each side of the peak value, the upper intersection and the lower intersection of the powder stream. The distance of the upper intersection from the nozzle is 15.2 mm, while the lower is about 27.3 mm. The length of the focal line is 14 mm, which is much longer than the ideal value (6.14 mm).
The powder flow field was computed at different feeding gas flow rates Qf (6, 8, 10, and 12 L/min) when the powder feeding rate and the shielding gas flow rate remained unchanged. As seen in Figure 6a, the peak Cp decreases markedly as Qf increases. The peak Cp is 11 kg/m3 at Qf = 6 L/min, but drops to 4.7 kg/m3 when Qf rises to 12 L/min. This indicates that the particles fly faster due to high Qf, keeping large kinetic energy after passing the nozzle. The gravity and drag force effects are weakened due to the domination of inertia, thus making the powder easier to disperse and resulting in powder concentration reduction in the middle of the powder stream. However, the location where peak Cp emerges almost has no change, in contrast to Figure 5, nor do the locations of powder flow intersections with Qf increasing. It is notable that, when Qf is 6 L/min, only the location close to the focal plane exhibits high Cp; positions far away from the focal plane exhibit much lower Cp. As Qf increases, Cp rises sharply from 0 to maximum, and changes little throughout the focal line. In Figure 6b, the particle speed varies little through the focal line, reaching the maximum ultimately at the lower intersection. The particle speed descends significantly at the focal plane due to the gas flow interaction, which explains why Cp can reach to maximum at the focal plane. It can be deduced that it is where the lowest particle speed location is just the powder focal plane. Furthermore, there are multiple peaks and troughs both in Cp and particle velocity profiles. In Figure 6b, these fluctuations are almost invisible when the carrier gas flow rate is relatively low (6 L/min). This indicates that, the stronger the gas flows interact, the more significantly the particle velocity of the convergence zone descends.
The powder concentration distribution along the longitudinal axis was computed at different powder feeding rates m ˙ p (16.45, 21.41, 29.35, and 40.11 g/min) when Qf (10 L/min) and Qp (18 L/min) were kept consistent. As seen in Figure 7, the peak Cp grows markedly with increasing m ˙ p , while the intersection points and focal plane positions stay virtually constant. This occurs because of the low volumetric concentration of particles in the carrier gas, making the system relatively insensitive to increases in particle population. Furthermore, the particles fly fast enough to overcome the gravity effects, powder feeding rate has a negligible influence on the powder flow divergence.
Figure 8a presents a comparative analysis of the velocity fields below the nozzle with and without shielding gas at a fixed carrier gas flow rate (Qf = 10 L/min). When Qp is 0, the gas velocity field mainly aligns along the nozzle axis due to the slight flow divergence. However, when Qp increases to 22 L/min, the outlet velocities show a significant enhancement and exert an obvious impact on the lower carrier gas flow. The shielding gas clearly promotes lateral divergence in the carrier gas velocity field, effectively disrupting the convergence of high-velocity particle streams. Notably, the protected area beneath the powder nozzle expands considerably with shielding gas application, providing enhanced oxidation protection for the cladding layer.
Figure 8b displays the axial particle velocity distributions at Qp = 0 and Qp = 22 L/min. The results demonstrate that the shielding gas has a negligible impact on both the axial particle velocities and the positions of the intersections and focal plane. This phenomenon occurs because the carrier gas velocity substantially exceeds that of the shielding gas, and the rapid flow expansion following pressure reduction at the outlet further diminishes the shielding gas’s influence on particle dynamics.
It can be concluded that the actual powder focal plane position is lower than the theoretical ideal due to powder stream divergence, while the focal line length exceeds the predicted value. Maximum powder concentration occurs along the focal line, coinciding with the region of minimum particle velocity. Analysis reveals that the positions of both upper and lower intersections, as well as the focal plane location, are predominantly determined by the powder nozzle’s geometric configuration. In contrast, process parameters including carrier gas flow rate, powder feeding rate, and shielding gas flow rate exhibit negligible influence on these spatial characteristics. These findings show excellent agreement with previous research reported in reference [31].

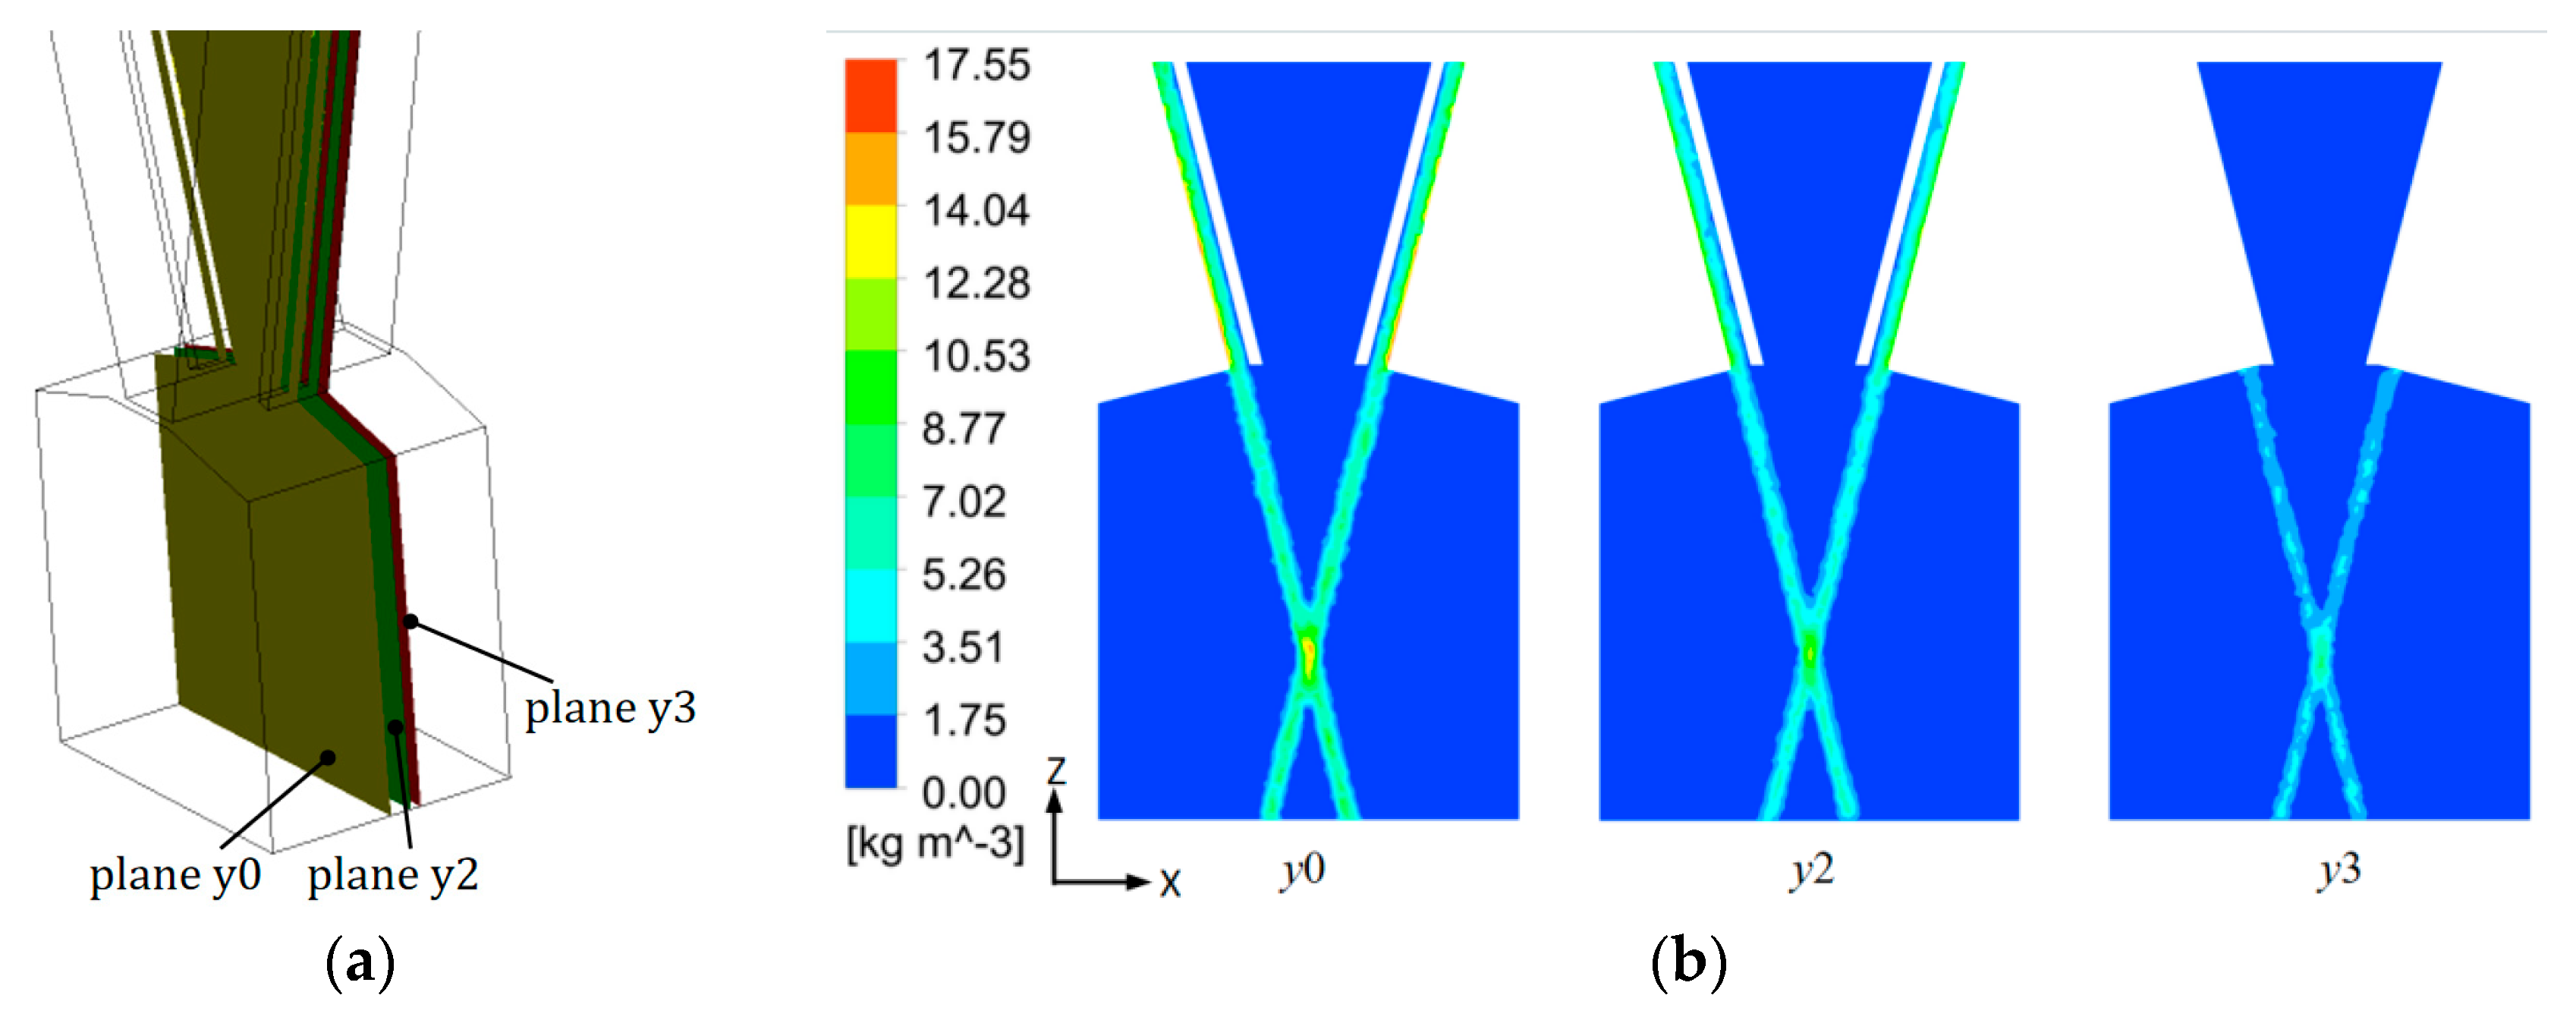
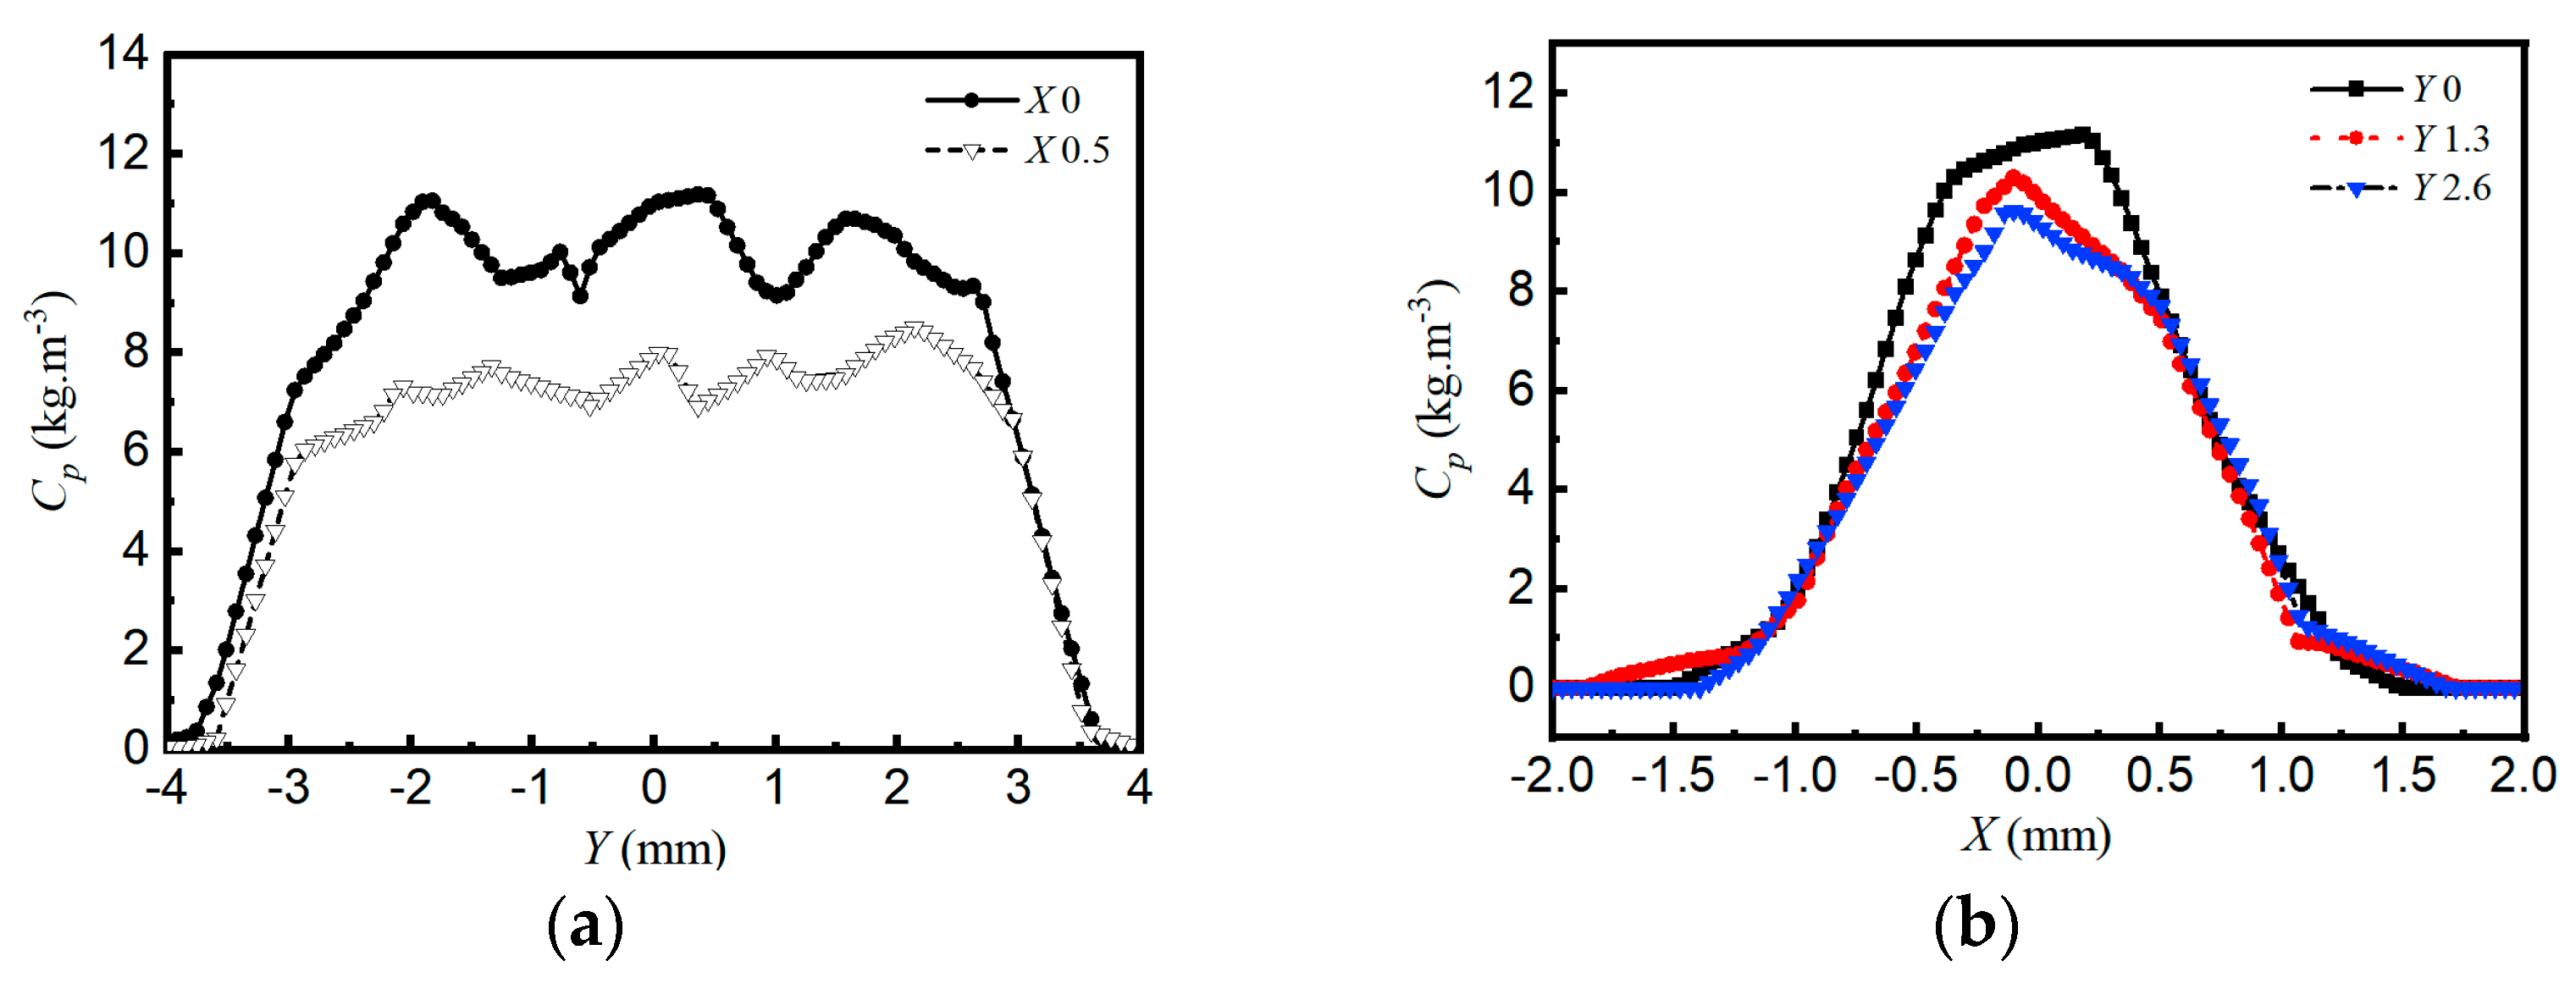
3.2.2. Spatial Powder Concentration Distribution

Figure 9 illustrates the powder concentration distribution across various cross-sections under specified conditions (Qf = 6 L/min, m ˙ p = 30 g/min). Plane y0 represents the powder stream’s symmetry plane (i.e., x–z plane), exhibiting the maximum powder concentration. Planes y2 and y3 are 2 mm and 3 mm from plane y0, respectively (Figure 9a). The analysis reveals an inverse relationship between powder concentration and distance from the symmetry plane. Even plane y3, located at the powder nozzle boundary, still shows residual powder distribution beneath the nozzle due to powder divergence. The focal line demonstrates the highest concentration region, with the peak concentration position aligning precisely with the focal plane where powder stream convergence occurs.
Figure 10 presents the powder concentration distribution on the focal plane, with the laser spot demarcated by a black rectangular box. The spatial coincidence between the powder scattering region and the laser spot facilitates higher powder utilization efficiency. It should be noted that the powder concentration contours exhibit slight asymmetry, which may be attributed to turbulence effects in the simulation model. Additionally, random collisions and rebounds of the particles cause unavoidable velocity differences when they leave the pipes. For quantitative analysis, two transverse (X0, X0.5) and three longitudinal (Y0, Y1.3, Y2.6) measurement paths were established (Figure 10).
Figure 11 displays the powder concentration distribution profiles along the chosen paths. It is evident that peak concentration occurs at the powder spot center; X0 maintains higher concentrations than X0.5 (Figure 11a); and the profiles have the same results along the longitudinal paths. Transverse profiles show minor fluctuations with quasi-flat-top characteristics, while longitudinal profiles follow Gaussian distributions (Figure 11b). This directional anisotropy contrasts with the reported bidirectional Gaussian distributions [10], potentially arising from simulation contour symmetrization and nozzle structural differences.
Figure 12 presents the powder concentration contours on the focal plane at different m ˙ p . The powder concentration increases evidently as m ˙ p increases, indicating that m ˙ p has a significant influence on powder concentration. This relationship stems from enhanced laser–powder coupling efficiency—as m ˙ p increases, more powder particles are effectively captured by the melt pool. Given adequate laser energy input, this mechanism promotes the formation of thicker cladding layers through increased material deposition.
Figure 13 demonstrates the relationship between powder concentration (Cp) distribution along the y0 plane and carrier gas flow rate (Qf). Cp exhibits an inverse relationship with Qf, showing a progressive decrease as Qf increases. The symmetry characteristics of Cp profiles vary significantly with Qf = 6 L/min; the profile shows near-perfect symmetry with maximum Cp at the focal plane center, while higher Qf values induce noticeable profile asymmetry. The turbulence effect is more dominant in affecting the Cp distribution. Notably, this asymmetry partially mitigates at 12 L/min, suggesting turbulence suppression by increased gas flow velocity. These findings lead to two important conclusions: First, shielding gas flow rate exhibits negligible influence on powder concentration distribution. Second, since focal plane powder distribution primarily depends on m ˙ p and Qf, optimal powder stream convergence can be achieved by appropriately reducing Qf at constant m ˙ p .
Figure 14a illustrates the relationship between the maximum Cp and Qf on the focal plane; it conforms to an exponential function and can be expressed as follows:
y = 95.95 x 1.198
The R2 value reaches to 0.99 and indicates a high degree of fitting accuracy. In Figure 14b, the maximum Cp on the focal plane has a liner positive relationship with m ˙ p , with the corresponding fitting function expressed as follows:
y = 0.155 + 0.196 x

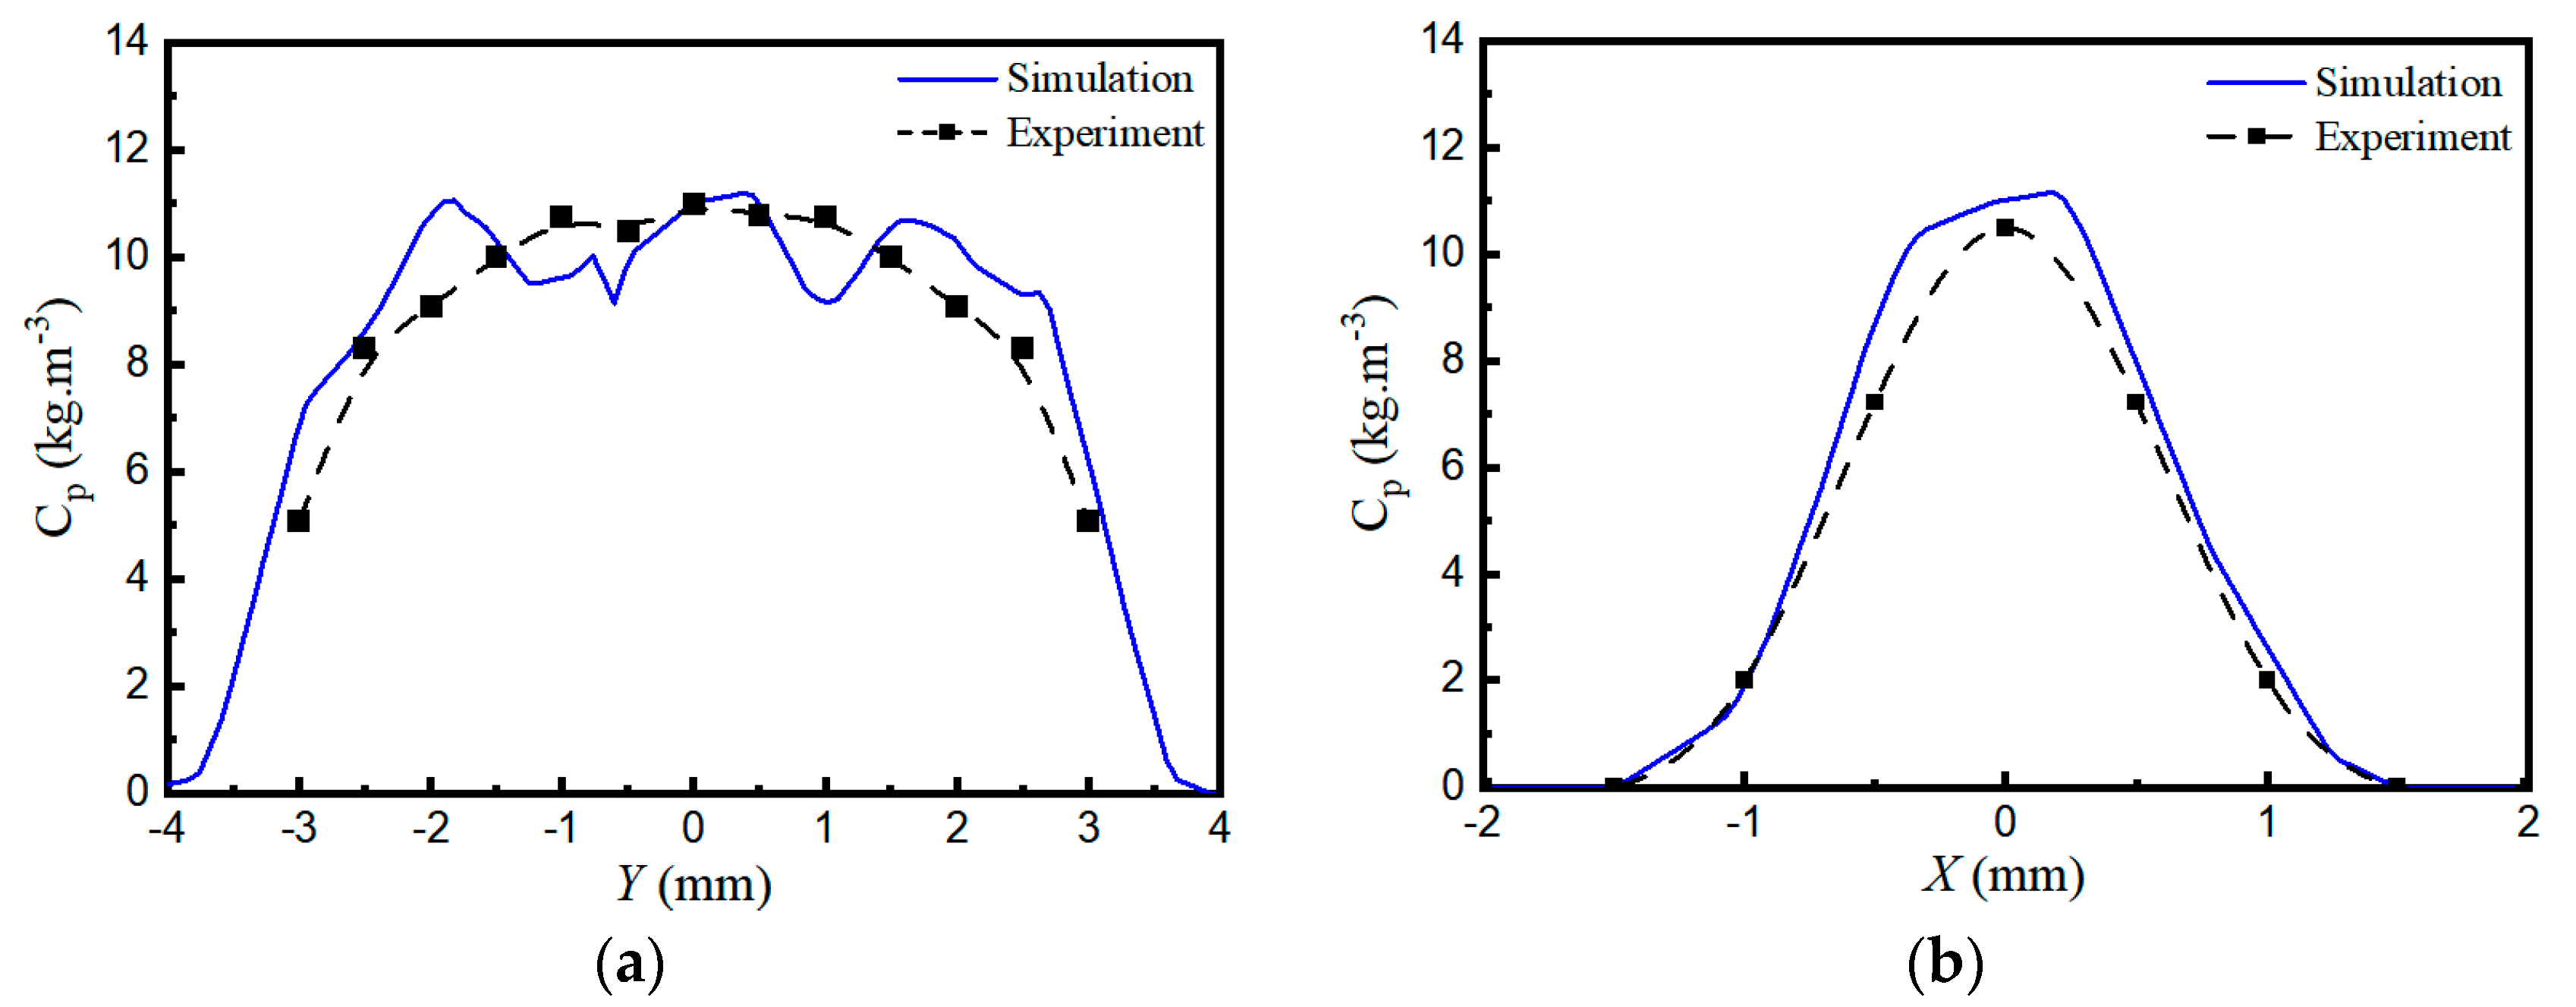
3.2.3. Verification of Powder Concentration Distribution on the Focal Plane

Powder collection experiments were carried out to verify the fidelity of the CFD model, the test method is shown in Figure 15. The substrate was placed on the powder focal plane by adjusting the laser head. The powder feeder was activated and operated continuously until a stable powder flow was achieved. A tube with inner diameter 1 mm was utilized for powder collecting. Following a predetermined collection period, the accumulated powder was quantitatively measured to determine the mass concentration. As depicted in the diagram, the sampling positions were systematically arranged with a uniform 0.5 mm grid spacing in both transverse and longitudinal directions. Powder collecting was started at the center of the powder spot, and, finally, all the data were obtained by moving the tube step by step. The powder mass concentration at each location can be expressed as follows:
C p = m S × t ,
where m is the mass of collected powder, S is the cross-sectional area of the tube, and t is the time taken to collect the powder.
A comparative analysis between experimental measurements and numerical simulations is presented in Figure 16. The numerical simulation results demonstrate good agreement with experimental measurements, though an underprediction of approximately 3–10% is observed in the experimental data. This discrepancy may be attributed to incomplete powder collection, where the current tube configuration demonstrates insufficient capacity to capture all the scattered particles. Figure 16a shows that the experimental profile maintains remarkable consistency with the simulation result, exhibiting a distinct flat-top feature near the powder spot center. Furthermore, as illustrated in Figure 16b, the vertical axis distribution of experimental data conforms well to a Gaussian distribution.

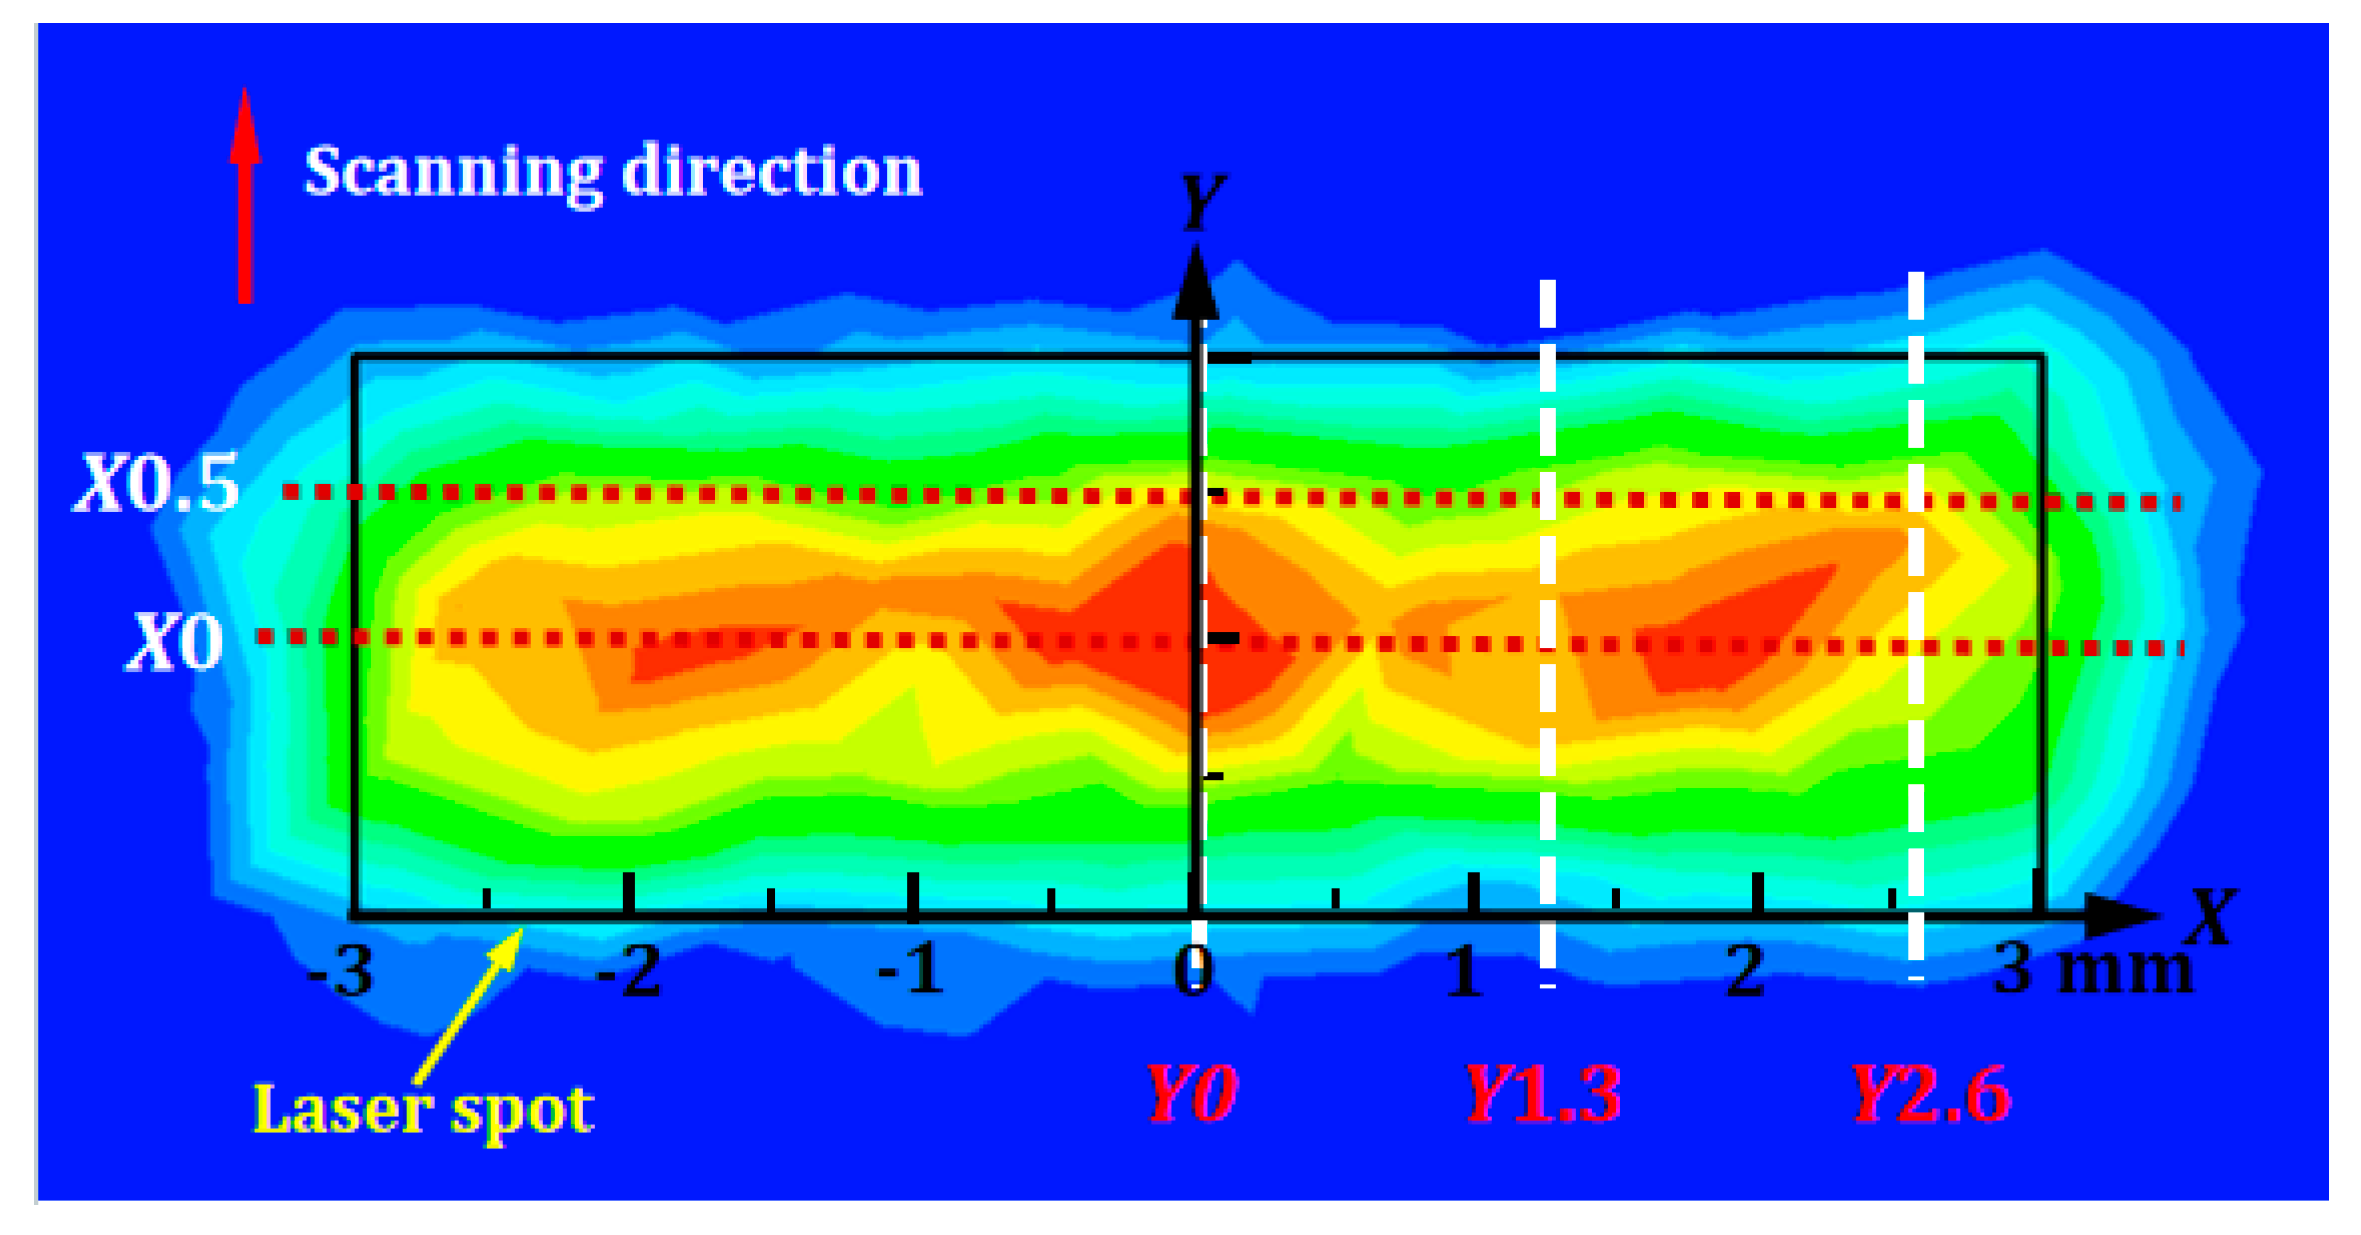
3.3. Powder Spot on the Focal Plane

It has been reported that optimal powder utilization efficiency can be achieved when the powder focal plane coincides precisely with the cladding substrate surface [30]. Adopting the method proposed by Liu et al. [32], the powder spot center was defined as the point of maximum concentration within the focal plane, with the boundary determined by the radial position where the concentration decays to 1/e2 of its peak value. Figure 12 reveals that the powder distribution exhibits a quasi-rectangular profile, with dimensions determined by the concentration boundaries. Based on the data presented in Figure 14, the powder spot dimensions were calculated at different Qf and m ˙ p .
Table 5 demonstrates that the powder spot size remains relatively stable while the peak powder concentration varies significantly with the variation of Qf and m ˙ p . The powder spot size is about 7.15 × 2.3 mm, slightly exceeding the laser beam size. It means that most of the powders are concentrated in the laser irradiation region, which contributes to enhanced powder utilization efficiency during the deposition process.

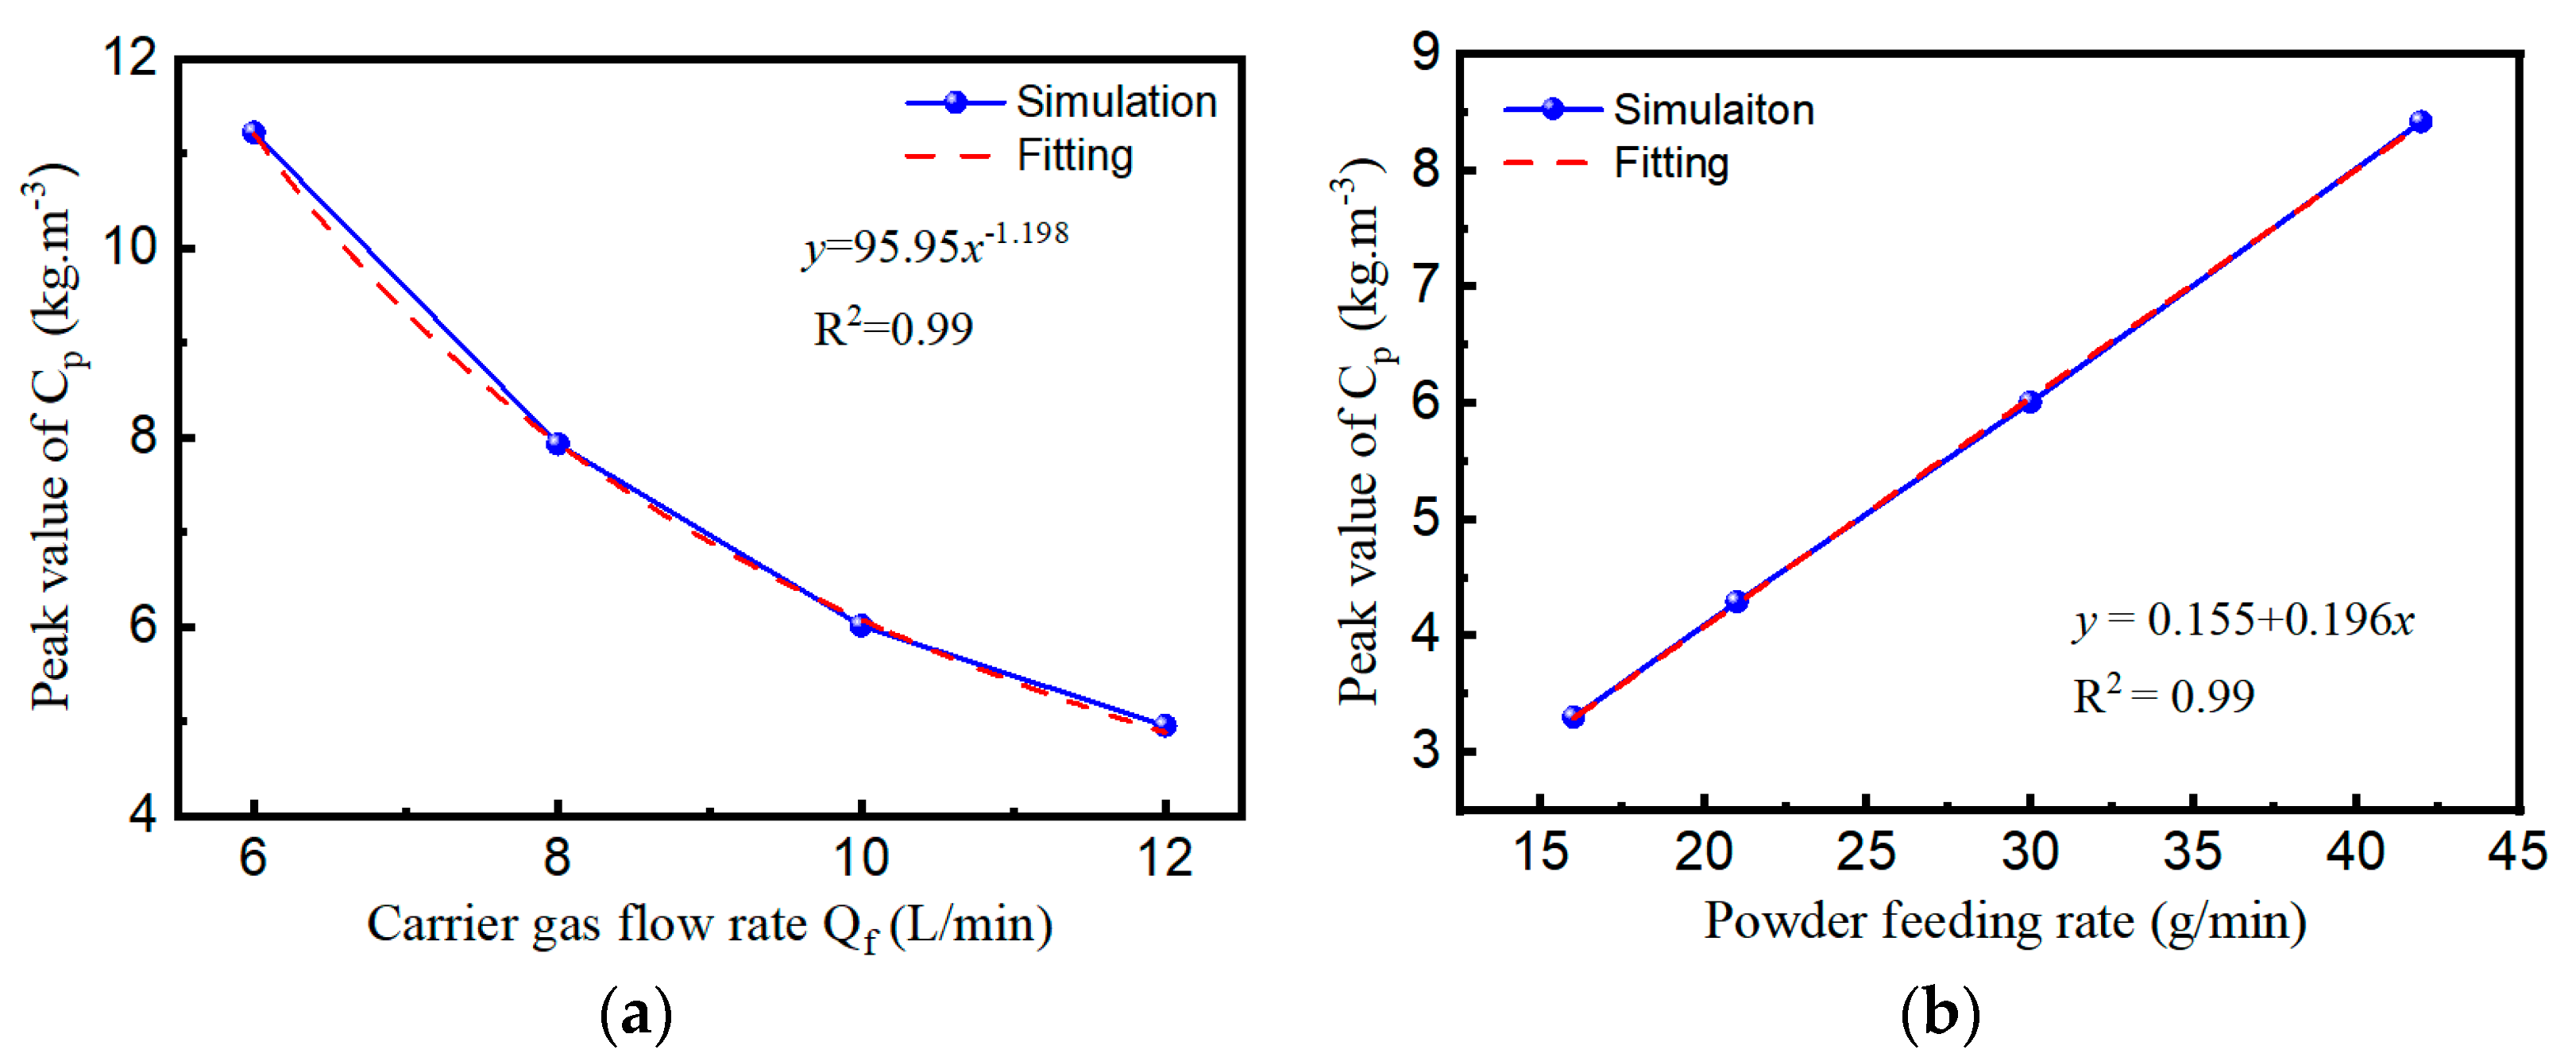
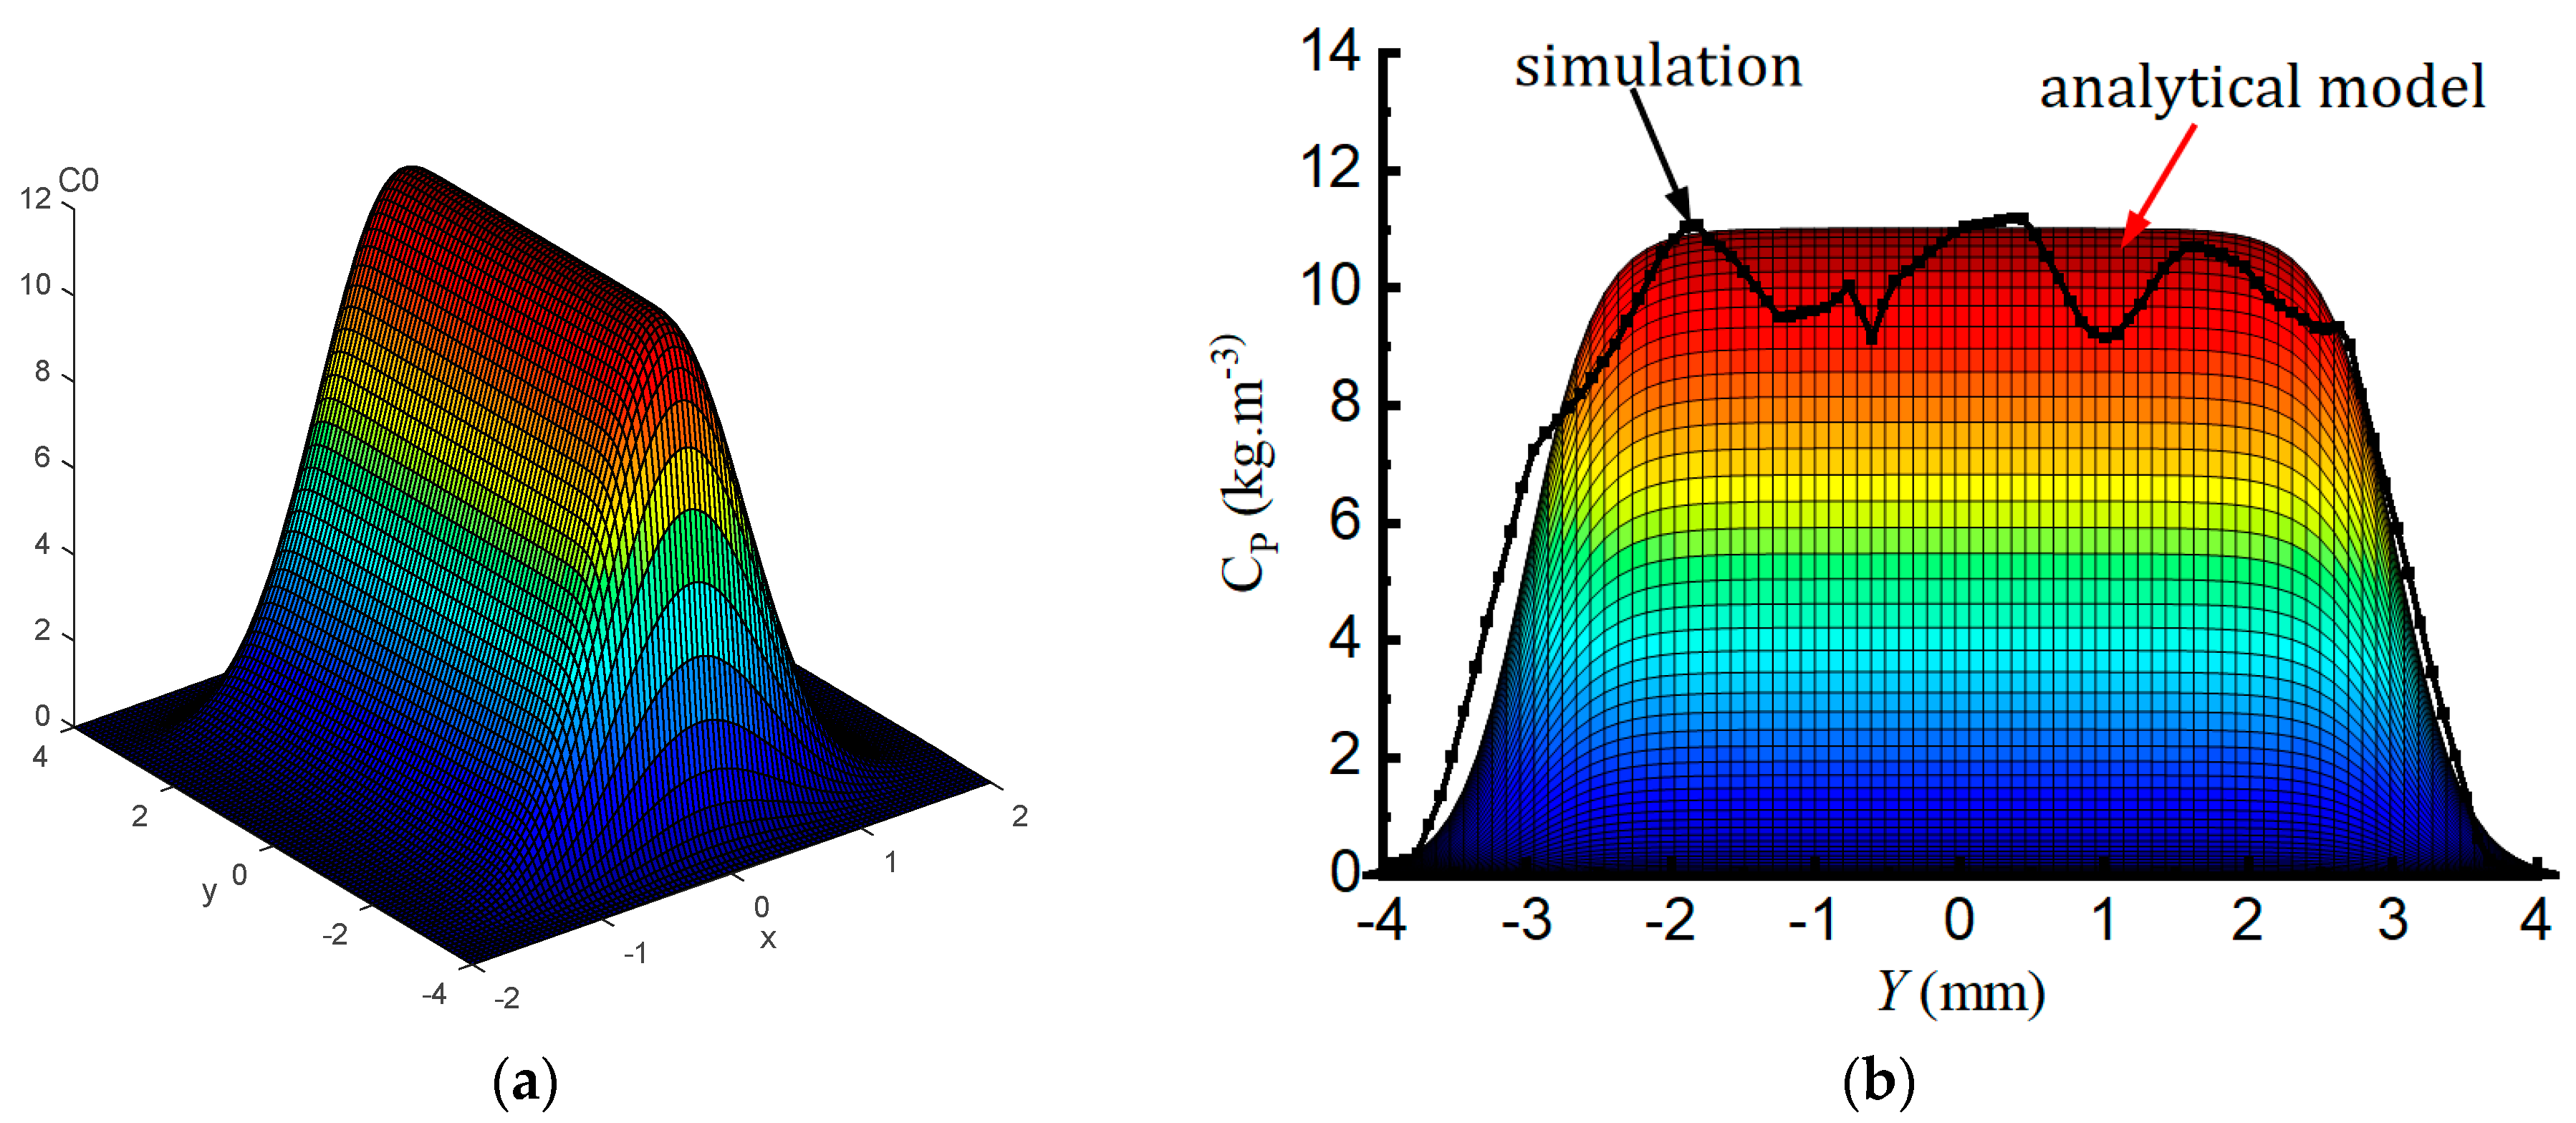
3.4. Mathematical Model of Powder Flow Field for Rectangular Nozzle

The powder distribution varies with different standoff distance; the maximum powder concentration emerges on the powder focal plane [18,33]. Consequently, optimal powder utilization efficiency is achieved by strategically positioning the deposition plane coincident with this focal plane. This study focuses on developing a simplified analytical model to characterize powder flow distribution patterns in laser cladding processes. The model aims to quantitatively describe the spatial concentration profile within the deposition zone. According to the aforementioned findings, the powder concentration on the focal plane approximately conforms to a Gaussian distribution. This can be mathematically described using a two-dimensional Gaussian function, expressed as follows:
f ( x , y ) = A   exp x 2 2 σ x 2 + y 2 2 σ y 2
where A is peak the value of the Gaussian function and σx and σy are the variances of x and y, respectively. As for the coaxial circular powder nozzle, the powder concentration exhibits isotropic distribution characteristics along both the x- and y-axes, with σx = σy in the covariance matrix σ x 0 0 σ y . The powder concentration of the coaxial circular powder nozzle on the focal plane can be expressed as follows:
C ( x , y ) = 2 m ˙ p π r p 2 exp 2 x 2 + y 2 r p 2
where rp is the powder spot diameter corresponding to 1/e2 of the maximum powder concentration.
The rectangular powder nozzle generates a distinctly powder deposition pattern at the focal plane, differing from the conventional Gaussian circular powder spot. In order to mathematically characterize this rectangular symmetry, a novel hybrid model combining a two-dimensional Gaussian function with a Sigmoid function is proposed to characterize the powder concentration distribution, formulated as follows:
C ( x , y ) = 2 m ˙ p π w p l p exp 2 x 2 w p 2 1 1 + exp [ 5 ( y + 0.5 l p ) ] 1 1 + exp [ 5 ( y 0.5 l p ) ]
where wp and lp are the powder spot width (along x axis) and length (along y axis), which correspond to 60% of the maximum powder concentration. Substituting Equation (3) into Equation (7) yields enhanced accuracy in the resulting solution.
C ( x , y ) = ( 0.155 + 0.196 m ˙ p ) exp 2 x 2 w p 2 1 1 + exp [ 5 ( y + 0.5 l p ) ] 1 1 + exp [ 5 ( y 0.5 l p ) ]
Figure 17 shows the powder concentration distribution described by the proposed model. Figure 17a illustrates a two-dimensional surface generated by Equation (8), exhibiting a rectangular projection on the horizontal plane. As illustrated in Figure 17b, the analytical model demonstrates excellent agreement with the simulation results. The flat-top distribution is accurately characterized, with the exception of undesirable fluctuations. Quantitative analysis reveals an 18% overestimation in the maximum Cp compared to simulation results due to the troughs. The deviations are more acceptable at the locations away from the powder spot center. In general, this analytical model has advantages in simplified function and fast computation; it can be employed to calculate the cross-sectional profile of single-track clad [32]. Therefore, given a certain powder feeding rate and powder spot size, the model provides deterministic solutions for transient powder concentration distributions across the focal plane.

4. Conclusions

A CFD model was developed to study the powder flow field of rectangular symmetric powder nozzles. Given the unique nozzle configuration in wide-beam LDED, more attention was paid to the influences of powder feeding parameters on the powder concentration and resultant flow field characteristics. A practical mathematical model was derived to characterize the powder concentration distribution at the focal plane. The developed models demonstrate excellent correlation with experimental results. The key findings are summarized as follows:
(1)
The powder focal plane exhibits two characteristic phenomena: peak powder concentration and minimal particle velocity. The locations of the powder flow intersections and the focal plane strongly depend on the nozzle geometry. Powder feeding parameters (carrier gas flow rate, shielding gas flow rate, and powder feeding rate) have negligible effects on the waist position of the powder flow.
(2)
The maximum powder concentration on the focal plane has a linear positive correlation with the powder feeding rate and decreases exponentially with the increase in the powder gas flow rate. Different from conventional annular nozzles, wide-beam LDED employs rectangular powder delivery profiles to achieve optimal laser-powder coupling.
(3)
Round-beam LDED demonstrates a typical Gaussian powder concentration profiles in both the fast axis and slow axis. Wide-beam LDED exhibits hybrid distribution patterns: Gaussian distribution along the scanning direction and quasi-uniform flat-top distribution perpendicular to the scanning direction. This optimized energy-powder spatial coupling configuration improves clad layer homogeneity.

Author Contributions

Conceptualization, B.H.; formal analysis, L.Z.; investigation, B.H. and L.Z.; resources, J.W.; writing—review and editing, B.H.; supervision, J.W.; funding acquisition, B.H. All authors have read and agreed to the published version of the manuscript.

Funding

This research was funded by the Science and Technology Program of Henan Province, grant number 252102220103.

Institutional Review Board Statement

Not applicable.

Informed Consent Statement

Not applicable.

Data Availability Statement

Data are contained within the article.

Conflicts of Interest

The authors declare no conflicts of interest.

References

  1. Singh, A.; Kapil, S.; Das, M. A comprehensive review of the methods and mechanisms for powder feedstock handling in directed energy deposition. Addit. Manuf. 2020, 35, 101388. [Google Scholar] [CrossRef]
  2. Liu, Z.; Zhao, D.; Wang, P.; Yan, M.; Yang, C.; Chen, Z.; Lu, J.; Lu, Z. Additive manufacturing of metals: Microstructure evolution and multistage control. J. Mater. Sci. Technol. 2022, 100, 224–236. [Google Scholar] [CrossRef]
  3. Zekovic, S.; Dwivedi, R.; Kovacevic, R. Numerical simulation and experimental investigation of gas–powder flow from radially symmetrical nozzles in laser-based direct metal deposition. Int. J. Mach. Tool Manu. 2007, 47, 112–123. [Google Scholar] [CrossRef]
  4. Ostolaza, M.; Urresti, A.; Arrizubieta, J.I.; Lamikiz, A.; Ortiz, M. CFD simulation for the modelling of the powder flow on continuous coaxial nozzles in the laser DED process. Procedia CIRP 2022, 111, 282–286. [Google Scholar] [CrossRef]
  5. Nasiri, M.T.; Movahhedy, M.R. A new design of continuous coaxial nozzle for direct metal deposition process to overcome the gravity effect. Prog. Addit. Manuf. 2022, 7, 173–186. [Google Scholar] [CrossRef]
  6. Han, B.; Li, R.; Pi, Q.; Shi, Y.; Qi, H.; Bi, K.; Sun, G. Prediction of deposit characteristics based on the discrete coaxial nozzle during laser direct metal deposition. Opt. Laser Technol. 2023, 163, 109385. [Google Scholar] [CrossRef]
  7. Tabernero, I.; Lamikiz, A.; Ukar, E.; López De Lacalle, L.N.; Angulo, C.; Urbikain, G. Numerical simulation and experimental validation of powder flux distribution in coaxial laser cladding. J. Mater. Process. Technol. 2010, 210, 2125–2134. [Google Scholar] [CrossRef]
  8. Li, L.; Huang, Y.; Zou, C.; Tao, W. Numerical Study on Powder Stream Characteristics of Coaxial Laser Metal Deposition Nozzle. Crystals 2021, 11, 282. [Google Scholar] [CrossRef]
  9. Doubenskaia, M.; Kulish, A.; Sova, A.; Petrovskiy, P.; Smurov, I. Experimental and numerical study of gas-powder flux in coaxial laser cladding nozzles of Precitec. Surf. Coat. Technol. 2021, 406, 126672. [Google Scholar] [CrossRef]
  10. Ni, M.; Qin, X.; Liu, H.; Hu, Z. Analysis and design of coaxial nozzle with rectangular outlet for high power diode laser in laser metal deposition. Int. J. Adv. Manuf. Technol. 2020, 106, 4789–4803. [Google Scholar] [CrossRef]
  11. Lee, H.-K. Effects of the cladding parameters on the deposition efficiency in pulsed Nd:YAG laser cladding. J. Mater. Process. Technol. 2008, 202, 321–327. [Google Scholar] [CrossRef]
  12. Lin, J. Laser attenuation of the focused powder streams in coaxial laser cladding. J. Laser Appl. 2000, 12, 17–23. [Google Scholar] [CrossRef]
  13. Gao, X.; Yao, X.X.; Niu, F.Y.; Zhang, Z. The influence of nozzle geometry on powder flow behaviors in directed energy deposition additive manufacturing. Adv. Powder Technol. 2022, 33, 103487. [Google Scholar] [CrossRef]
  14. Wang, K.; Tong, Y.; Chen, Y.; Kong, L.; Lu, K.; Wang, J.; Liang, X. Powder stream performance of a novel annular laser direct metal deposition with inside-laser coaxial powder feeding nozzle: Simulation and experimental perspectives. Opt. Laser Technol. 2024, 175, 110723. [Google Scholar] [CrossRef]
  15. Guner, A.; Bidare, P.; Jiménez, A.; Dimov, S.; Essa, K. Nozzle Designs in Powder-Based Direct Laser Deposition: A Review. Int. J. Precis. Eng. Manuf. 2022, 23, 1077–1094. [Google Scholar] [CrossRef]
  16. Pant, P.; Chatterjee, D.; Samanta, S.K.; Lohar, A.K. Experimental and Numerical Analysis of the Powder Flow in a Multi-Channel Coaxial Nozzle of a Direct Metal Deposition System. J. Manuf. Sci. Eng. 2021, 143, 071003. [Google Scholar] [CrossRef]
  17. Wang, Z.; Hu, K.; Yang, L.; Zhang, J.; Ding, H.; Pan, Z. Coupling Characteristics of Powder and Laser of Coaxial Cone Nozzle for Laser Direct Metal Deposition: Numerical Simulation and Experimental Study. Materials 2023, 16, 3403. [Google Scholar] [CrossRef] [PubMed]
  18. Pinkerton, A.J.; Li, L. Modelling powder concentration distribution from a coaxial deposition nozzle for laser-based rapid tooling. J. Manuf. Sci. Eng. 2004, 126, 33–41. [Google Scholar] [CrossRef]
  19. Liu, Q.; Li, W.; Yang, K.; Gao, Y.; Wang, L.; Chu, X. Analytical investigation into the powder distribution and laser beam-powder flow interaction in laser direct energy deposition with a continuous coaxial nozzle. Adv. Powder Technol. 2023, 34, 104058. [Google Scholar] [CrossRef]
  20. Zhang, J.; Yang, L.; Zhang, W.; Qiu, J.; Xiao, H.; Liu, Y. Numerical simulation and experimental study for aerodynamic characteristics and powder transport behavior of novel nozzle. Opt. Laser. Eng. 2020, 126, 105873. [Google Scholar] [CrossRef]
  21. Chu, M.; Lian, G.; Yao, M.; Feng, M.; Chen, C.; Huang, X. Numerical simulation and experimental investigation of gas-powder flow feed behavior in laser cladding with coaxial nozzle. Int. J. Adv. Manuf. Technol. 2022, 122, 881–894. [Google Scholar] [CrossRef]
  22. Liu, H.; He, X.; Yu, G.; Wang, Z.; Li, S.; Zheng, C.; Ning, W. Numerical simulation of powder transport behavior in laser cladding with coaxial powder feeding. Sci. China Phys. Mech. Astron. 2015, 58, 104701. [Google Scholar] [CrossRef]
  23. DeWitte, L.; Saldana, C.; Kurfess, T.; Fu, K. Effect of coaxial nozzle wear on catchment efficiency in direct energy deposition built components. J. Manuf. Syst. 2022, 63, 524–538. [Google Scholar] [CrossRef]
  24. Lei, K.; Qin, X.; Liu, H.; Ni, M. Analysis and modeling of melt pool morphology for high power diode laser cladding with a rectangle beam spot. Opt. Laser. Eng. 2018, 110, 89–99. [Google Scholar] [CrossRef]
  25. Zhu, H.; Lin, X.; Xue, X.; Zhang, Y.; Wang, L.; Ning, Y.; Dong, Y.; Fang, X. Laser cladding of stainless-steel ball valves by a high-power diode laser source with a rectangular beam spot. Opt. Laser Technol. 2024, 169, 110123. [Google Scholar] [CrossRef]
  26. Hu, B.; Han, J.; Li, X.; Wang, J. Modeling of melt pool and thermal field simulation for wide-band laser cladding. Opt. Eng. 2023, 62, 116103. [Google Scholar] [CrossRef]
  27. Lu, L.; Shi, T.; Li, G.; Wei, C.; Fu, G. Design and Numerical Analysis of an Inside-Beam Powder Feeding Nozzle for Wide-Band Laser Cladding. Materials 2024, 17, 12. [Google Scholar] [CrossRef]
  28. Nogdhe, Y.; Rai, A.K.; Manjaiah, M. Numerical study of powder flow characteristics of coaxial nozzle direct energy deposition at different operating and design conditions. Prog. Addit. Manuf. 2024, 10, 701–723. [Google Scholar] [CrossRef]
  29. Alya, S.; Singh, R. Discrete Phase Modeling of the Powder Flow Dynamics and the Catchment Efficiency in Laser Directed Energy Deposition with Inclined Coaxial Nozzles. J. Manuf. Sci. Eng. 2021, 143, 081004. [Google Scholar] [CrossRef]
  30. Liu, S.; Farahmand, P.; Kovacevic, R. Optical monitoring of high power direct diode laser cladding. Opt. Laser Technol. 2014, 64, 363–376. [Google Scholar] [CrossRef]
  31. Lin, J. Concentration mode of the powder stream in coaxial laser cladding. Opt. Laser Technol. 1999, 31, 251–257. [Google Scholar] [CrossRef]
  32. Liu, J.; Li, L. Study on cross-section clad profile in coaxial single-pass cladding with a low-power laser. Opt. Laser Technol. 2005, 37, 478–482. [Google Scholar] [CrossRef]
  33. Mazzarisi, M.; Errico, V.; Angelastro, A.; Campanelli, S.L. Influence of standoff distance and laser defocusing distance on direct laser metal deposition of a nickel-based superalloy. Int. J. Adv. Manuf. Technol. 2022, 120, 2407–2428. [Google Scholar] [CrossRef]
Figure 1. Schematic of the rectangular powder nozzle. (a) Front view of the nozzle; (b) bottom view of the nozzle; (c) powder nozzle structure.
Coatings 15 00744 g001
Figure 2. Physical model of the rectangular powder nozzle. (a) Simplified model structure; (b) geometric parameters of the physical model. (c) Meshing and geometrical boundary conditions of the powder nozzle.
Coatings 15 00744 g002
Figure 3. Gas coupling and velocity distribution of the powder nozzle on different planes. (a) Velocity distribution on y0 plane; (b) velocity distribution on y3 plane and different gas flow regions; (c) velocity distribution on the focal plane.
Coatings 15 00744 g003
Figure 4. Schematic of the powder flow convergence. (a) Standoff distance of the powder flow intersections from the nozzle outlets when the powder flows have no divergence; (b) standoff distance of intersections with divergent powder flows.
Coatings 15 00744 g004
Figure 5. Powder concentration distribution along the Z axis. (Left): powder concentration distribution on xz plane, the white arrow indicates the direction of data collection; (right): powder concentration profile along the focal line.
Coatings 15 00744 g005
Figure 6. Effects of Qf on the powder concentration and the powder particle velocity. (a) Powder concentration profiles along the focal line when Qf varies; (b) powder particle velocity profiles along the focal line when Qf varies.
Coatings 15 00744 g006
Figure 7. Axial distribution of Cp at different powder feeding rates.
Coatings 15 00744 g007
Figure 8. Effect of shielding gas on the location of the focal plane. (a) Particle velocity contours at Qp = 0 and Qp = 22 L/min; (b) particle velocity profiles along the longitudinal axis with and without shielding gas.
Coatings 15 00744 g008
Figure 9. Powder concentration distribution of various axial cross-sections. (a) Positions of plane y0, y2, and y3; (b) powder concentration clouds at plane y0, y2, and y3.
Coatings 15 00744 g009
Figure 10. Powder concentration contour on the powder focal plane.
Coatings 15 00744 g010
Figure 11. Powder concentration distribution of various locations on the focal plane. (a) Powder concentration profiles along the transverse direction of the focal plane; (b) powder concentration profiles along the longitudinal direction of the focal plane.
Coatings 15 00744 g011
Figure 12. Powder concentration contours on the focal plane with various m ˙ p .
Coatings 15 00744 g012
Figure 13. Powder concentration profiles along X0 line on the focal plane at different Qf ( m ˙ p = 21.4 g/min).
Coatings 15 00744 g013
Figure 14. Relationship between powder feeding parameters and peak Cp. (a) The peak Cp decrease exponentially as Qf increases; (b) the peak Cp increases linearly as m ˙ p increases.
Coatings 15 00744 g014
Figure 15. Schematic diagram of powder collecting experiment.
Coatings 15 00744 g015
Figure 16. Comparison between experimental Cp and simulated Cp of the powder spot (Qf = 6 L/min, m ˙ p = 21.4 g/min). (a) Experimental and simulated results along the transverse axis; (b) experimental and simulated results along the longitudinal axis.
Coatings 15 00744 g016
Figure 17. The powder concentration distribution described by the proposed model. (a) Two-dimensional distribution of the analytical model, C0 represents the peak powder concentration at the powder spot center; (b) comparison between the analytical model and simulation results (Qf = 6 L/min, m ˙ p = 21.4 g/min).
Coatings 15 00744 g017
Table 1. Chemical composition of 316 L stainless steel powder (wt.%).
CrNiMnMoSiPCFeS
16.212.60.622.480.850.0110.006Bal.0.006
Table 2. Particle size distribution and morphology characteristics of 316 L stainless steel powder.
Size Distribution (μm)Flow Rate (s/50 g) Degree of Spherical
D10D50D90D97
66.71108.8177.6219.615.19 0.835
Table 3. Geometry parameters of the powder nozzle.
Para.a/mmb/mmg/mml/mmβe/mmh/mmm/mmn/mm
Value2221182767353426
Table 4. Parameters of the continuous phase and particle phase.
PhaseParameterValue
Continuous phase (argon)Density1.613 kg/m3
 Viscosity2.262 × 10−5 Pa.s
Discrete phase (powder)Density7800 kg/m3
 Minimum size67.3 μm
 Maximum size219.8 μm
 Average size110 μm
 Coefficient of rebound0.95
Table 5. Powder spot size at different powder feeding parameters.
Qf (L/min) m ˙ p (g/min)Powder Spot Size (mm)
6307.20 × 2.33
8307.15 × 2.28
10307.10 × 2.33
12307.10 × 2.37
1016.457.15 × 2.36
1021.417.18 × 2.35
1029.357.10 × 2.33
Disclaimer/Publisher’s Note: The statements, opinions and data contained in all publications are solely those of the individual author(s) and contributor(s) and not of MDPI and/or the editor(s). MDPI and/or the editor(s) disclaim responsibility for any injury to people or property resulting from any ideas, methods, instructions or products referred to in the content.

