Abstract
Investigating the relationship between coating structure and thermal stress is crucial for improving the service performance of double-ceramic-layer (DCL) thermal barrier coatings (TBCs). This study systematically examines a DCL TBC comprising a Gd2O3-Yb2O3-Y2O3 co-doped ZrO2 (GYYZ) top layer and Y2O3-stabilized ZrO2 (YSZ) intermediate layer. Using combined finite element analysis and experimental validation, the influence of top-layer structural parameters (porosity, pore size, thickness) on thermal stress distribution under thermal shock conditions and resultant coating performance was investigated. Results indicate that coating interfaces, particularly GYYZ/YSZ and YSZ/bond coat (BC) interfaces, exhibit high sensitivity to top-layer structural parameters. Optimal GYYZ top-layer parameters were identified as: 10–15 vol.% porosity, 10–20 μm pore diameter, and ~0.15 mm thickness. Reducing the top-layer porosity from 20 vol.% to 15 vol.% increased microhardness by 12.8% and extended thermal cycling life by 87.5%. The coating failure mode shifted from the YSZ/BC interface to the GYYZ/YSZ interface, aligning with simulated thermal stress distributions.
1. Introduction
Modern aero-engines’ pursuit of higher thrust-to-weight ratios elevates operating temperatures of critical components such as turbine blades. Compressors outlet temperatures now exceed 650 °C, while combustion chambers inlet surpass 1200 °C, demanding enhanced thermal barrier coatings (TBCs) performance [1,2]. Conventional YSZ coatings exhibit low thermal conductivity and relatively high thermal expansion coefficients, demonstrating good durability below 1200 °C [3]. However, beyond this threshold, accelerated sintering and martensitic phase transformation accompanied by 4%–6% volumetric expansion occur, leading to premature failure of YSZ coating [4]. In contrast, double-ceramic-layer (DCL) TBCs provide critical performance advantages due to their superior heat resistance, reduced thermal conductivity, enhanced sintering resistance, and good chemical stability [5,6]. Typically, ceramic materials with superior high-temperature performance such as La2Zr2O7 [7], Gd2Zr2O7 [8], and rare-earth-doped YSZ [9,10,11] serve as the top layer, while the YSZ coating functions as the internal ceramic layer to alleviate thermal expansion coefficient mismatch with the bond coat (BC) [12]. Among these, Gd2O3-Yb2O3-Y2O3 co-doped zirconia (GYYZ) is an important variant of rare-earth-doped YSZ that exhibits superior phase stability, lower thermal conductivity, and enhanced sintering resistance compared to single-doped systems such as conventional YSZ or Yb2O3-stabilized ZrO2. The co-doping with multiple rare-earth cations (Gd3+, Yb3+, Y3+) effectively inhibits the detrimental tetragonal-to-monoclinic phase transformation during thermal cycling. The incorporation of Gd3+, with its large ionic radius, contributes to reduced thermal conductivity and improved fracture toughness, albeit with a tendency to destabilize the tetragonal phase. Conversely, Yb3+, with its smaller ionic radius, promotes tetragonal phase stability but at the cost of lower fracture toughness. By leveraging a synergistic “cocktail effect” through multi-component doping, GYYZ achieves an optimal balance of these properties, making it a promising material for extreme high-temperature applications [13,14,15]. This GYYZ/YSZ DCL TBC structure further improves the coating’s high-temperature resistance and anti-sintering performance. Given that TBC service life is closely related to internal residual thermal stress evolution during thermal cycling [16], assessing stress behavior under thermal shock remains essential for durability prediction and mechanical performance enhancement [17,18].
Finite element analysis (FEA) enables efficient, low-cost, and reliable predication of temperature and stress distributions in coatings, and has been widely adopted worldwide [19,20]. S. Wu et al. evaluated stress evolution in 8YSZ TBCs during thermal shock cycling, with simulation results showing good consistency with experimental data [21]. L.H. Liang et al. employed a combined experimental and finite element simulation approach to investigate the influence of ceramic coating thickness on the thermal shock resistance of YSZ [22]. H.P. Pan et al. utilized the FEA method to probe the influence of top-layer thickness on the thermal insulation performance and residual stress distribution of La2Zr2O7/8YSZ DCL TBC [23]. J.X. Li et al. used the finite element method to optimize the thickness of a YSZ/YTO (YTaO4) DCL TBC [24]. Z. Li et al. investigated the influence of porous microstructures on the cracking behavior of Gd2Zr2O7 coatings [25]. L. Liu et al. analyzed the impact of gradient porosity on bonding strength and thermal shock performance of coatings [26]. The above FEA studies indicate that the structure of TBCs has a significant impact on their thermal stress and performance. However, most existing research has focused on optimizing individual coating parameters, and the relationship between the top-layer structure, specifically in GYYZ/YSZ DCL TBCs, and thermal stress remains scarcely investigated.
This study focuses on Gd2O3-Yb2O3-Y2O3 co-doped ZrO2 (GYYZ)/YSZ DCL TBCs, employing finite element methods to investigate the effects of GYYZ top-coating porosity, pore diameter, and thickness on transient thermal stress during thermal shock cooling. A mapping relationship between coating structural parameters and thermal stress was established. Coatings with different top-layer porosities were prepared through process adjustments, and their thermal shock lifetimes and failure locations were analyzed, with comparisons made to simulation results. This research aims to deepen the understanding of the structure-thermal stress relationship in DCL TBCs and provide guidance for coating design.
2. Materials and Methods
2.1. FEA Process
2.1.1. Geometric Model
Figure 1a schematically illustrates the geometric model for the thermal shock specimen of the GYYZ/YSZ DCL TBC. From top to bottom, the model comprises a GYYZ ceramic top layer, a YSZ ceramic intermediate layer, a NiCoCrAlYHfSi bond coat, and a GH5188 nickel-based alloy substrate. The substrate dimensions are Φ30 mm × 3 mm, with the bond coat and YSZ intermediate layer having thicknesses of 0.1 mm and 0.15 mm, respectively. Based on previously published studies on similar coating systems [27,28], the structural variable parameters of the GYYZ top layer were selected and are summarized in Table 1. A corresponding 2D axisymmetric finite element model was established using the commercial software Abaqus 2024, as shown in Figure 1b, where the X-axis denotes the radial direction of the cylindrical specimen, and the Y-axis denotes the axial direction.
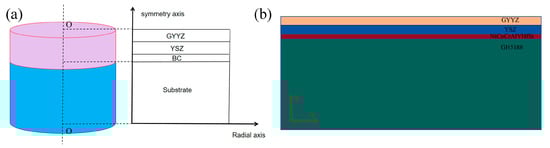
Figure 1.
(a) Geometric model and (b) two-dimensional axisymmetric finite element model of the GYYZ/YSZ DCL TBC.

Table 1.
Top-coating structural parameters of GYYZ/YSZ DCL TBC.
The Abaqus software was subjected to secondary development using the Python 2024 programming language, with loop control employed to achieve random distribution of circular pores within the top layer. Considering that the coating constitutes the critical region for stress distribution, a finer meshing scheme was adopted. In contrast, the mesh size of the substrate was gradually coarsened from the coating-substrate interface toward the substrate bottom to enhance computational efficiency. The CAX4T element type was selected for meshing.
2.1.2. Material Properties
The substrate material is GH5188 nickel-based alloy, the ceramic top and intermediate layers are GYYZ and YSZ, respectively, and the bond coat is NiCoCrAlYHfSi. The thermophysical properties of each material are summarized in Table 2. It should be noted that the simplification of temperature-independent elastic modulus and Poisson’s ratio may lead to an overestimation of thermal stresses at elevated temperatures, as the decrease in elastic modulus at high temperature is not captured. However, since the primary objective of this study was to compare the relative performance among coatings with different top-coating structures under identical conditions, the assumption of temperature-independent elastic property provides a consistent and conservative basis for such comparison. Furthermore, the use of a constant elastic modulus aligns with the methodology employed in several similar studies [20]. Temperature-dependent thermal conductivity and coefficient of thermal expansion were defined using tabulated data, with Abaqus employing piecewise linear interpolation between the specified points.
Table 2.
Thermophysical properties of each material [29].
2.1.3. Boundary Conditions and Calculations
According to the flame thermal shock test conditions, the simulation process was divided into three stages: (1) Heating phase: A heat flux corresponding to a temperature range of 500 °C to 1300 °C was applied to the top surface of the specimen for 30 s; (2) Holding phase: The heat flux maintaining the temperature at 1300 °C was sustained for 60 s; and (3) Cooling phase: The specimen was placed in a 25 °C environment for 15 s to simulate air cooling. It should be noted that a highly intense forced convection heat transfer process occurs when a high-velocity, high-temperature gas flame is directly impinged upon the coating surface during flame thermal shock testing. Furthermore, relevant literature [30] indicates that convective heat transfer is widely adopted as the boundary condition in thermal shock simulation, even at the temperature as high as 1500 °C. Accordingly, convective heat transfer was applied to the upper and right surfaces of the model, with the surface film coefficients set to 100 W/(m2·°C) during the heating and holding phases, and adjusted to 3000 W/(m2·°C) during the cooling phase. The left and lower surfaces were defined as adiabatic boundaries (i.e., no heat exchange occurred), and radiation heat transfer was neglected. The initial ambient temperature was set to 25 °C.
The fundamental assumptions adopted in the simulation are as follows: (1) No residual stresses exist in the model initially; (2) thermal radiation effects are ignored; (3) all interfaces are idealized as perfectly smooth and flat; (4) initial cracks or defects are not taken into account; and (5) all pores are assumed to be spherical in shape [31]. Under thermal shock conditions, the residual thermal stresses generated within the TBC are predominantly radial stresses, and their magnitudes are significantly greater than those of axial and shear stresses [32]. This is further supported by numerical results from the model with 15 vol.% porosity, 30 μm pore diameter, and 150 μm top-coating thickness, which show that the peak tensile axial stress and peak shear stress account for only approximately 33% and 31% of the peak radial stress, respectively (see Supplemental Figure S1). Therefore, this study specifically focuses on investigating the influence of radial stresses.
2.2. Experimental Process
2.2.1. Coating Preparation
A slurry was prepared using the following raw materials: 2 wt.% gadolinium oxide (Gd2O3), 2 wt.% ytterbium oxide (Yb2O3), 4 wt.% yttrium oxide (Y2O3), and 84 wt.% zirconium oxide (ZrO2). All powders with a purity of 99.9%, were supplied by Beijing DK nano technology Co., Ltd., Beijing, China, and were homogenized through ball milling. The ball milling process was conducted in a 25-L polyurethane jar using 25 mm zirconia balls as the grinding medium and deionized water as the liquid medium. The process was operated at 200 r/min and room temperature under a pressure of 15 psi. The sample was fed at a rate of 10–15 g/min for a total duration of 16 h.
Subsequently, the milled slurry was transferred to a spray drying tower (LZ-8) for spray drying and agglomeration, resulting in the formation of spherical agglomerated powder. The process was carried out with the spray dryer inlet temperature set at 300 °C, the outlet temperature at 130 °C, and the disk rotation speed maintained at 30 rpm. The spherical agglomerated powder was then sintered in a high-temperature sintering furnace (TH-1400) at 1300 °C for 3 h, using a heating rate of 5 °C/min. After the holding period, the sample was cooled inside the furnace, yielding GYYZ powders, yielding GYYZ powders.
For coating preparation, GH5188 alloy served as the substrate, while NiCoCrAlYHfSi (BGRIMM Advanced Materials Science & Technology Co., Ltd., Beijing, China) and 8YSZ powders were used as the bonding and intermediate coating materials, respectively. GYYZ powders was employed as the top coating materials. All coatings were prepared utilizing an atmospheric plasma spraying equipment (GTVF6). Due to the significant challenges and resource constraints associated with the fabrication of a large set of coatings with systematically varied microstructures, experimental validation was focused on a select set of representative cases identified by FEA as the most promising. Specifically, coatings with two varying top-coat porosities (15 vol.% and 20 vol.%) were fabricated by controlling plasma spraying parameters.
2.2.2. Microstructure and Porosity Characterization
The phase compositions of the top coatings were characterized by X-ray diffraction (XRD, Bruker Corporation, Billerica, MA, USA) using a Bruker D8 Advance diffractometer. The measurements were conducted in continuous scan mode over a 2θ range from 10° to 90° at a scan rate of 0.2 °s−1. The microstructure of the coatings was analyzed in accordance with the national standard GB/T 13298-2015 “Metallographic Examination Methods” [33]. The samples were prepared via cold embedding with resin. After curing at room temperature, they were ground and polished to obtain metallographic specimens. The microstructure of the specimens was observed using a scanning electron microscope (SEM, SU5000, Hitachi Ltd., Tokyo, Japan). The SEM observations and energy-dispersive X-ray spectroscopy (EDS) analysis were conducted at an acceleration voltage of 15 kV. The thickness of each coating layer was determined based on measurements performed at a minimum of three different locations on the SEM images [34]. To evaluate the pore structure, at least five distinct regions were selected for analysis, and the average porosity of the coating was quantified using ImageJ 2024 software.
2.2.3. Microhardness and Thermal Shock Resistance Testing
In accordance with the national standard GB/T 4340.1-2024 “Vickers Hardness Test for Metallic Materials” [35], the Vickers hardness test was performed on the sample surface at room temperature after the surface had been polished. The test for each coating was conducted on five independent samples with a loading force of 500 gf and a holding time of 15 s. The average values and standard deviations were obtained from these measurement.
The thermal shock test was conducted in accordance with the Chinese national standard GB/T 42261-2022 [36], entitled “Metallic and other inorganic coatings—Test method of cyclic heating for thermal-barrier coatings under temperature gradient”. This standard is specifically applicable to thermal cycle testing of thermal barrier coatings used on hot-section components such as aero-engine combustors, rocket engine thrust chambers, and rotating or stationary turbine blades. Specifically, the flame thermal shock resistance of the coating was evaluated using a Metco F4 (F4MB-XL, Oerlikon Metco, Switzerland) spray gun. The test temperature was set at 1300 °C, and the test cycle was defined as follows: the coated sample was heated from 500 °C to 1300 °C with a heating duration of approximately 30 s, held at 1300 °C for 1 min, and then cooled to room temperature with a cooling duration of approximately 15 s. The thermal shock tests for each coating were conducted on three samples. The average values and standard deviations were obtained from these measurement. The coating was considered to have failed when the area of surface peeling exceeded 30% of the total coating area.
3. Results and Discussion
3.1. Thermal Stress Simulation Results
3.1.1. Effect of Top-Coating Porosity on Thermal Stress
The thickness and the pore diameter of the GYYZ top coating were set to 0.15 mm and 30 μm, respectively. This study investigated the characteristics of the maximum instantaneous stress distribution in the coating during the cooling phase under thermal shock by varying the porosity of the top coating from 0 to 25 vol.%. Figure 2 presents the radial stress distribution within the coating at different porosity levels, where positive and negative values denote tensile and compressive stresses, respectively. Specifically, Figure 2a,b show the instantaneous stress distribution during cooling for the entire model at 0 vol.% and 15 vol.% porosity. It indicates that the coating section of the model is primarily subjected to tensile stress, with more pronounced deformation occurring at both ends. In contrast, the substrate region is almost entirely under compressive stress. Figure 2c–h provide detailed views of the stress distribution in the central and edge regions of the coating. For the non-porous coating (0 vol.%), the maximum tensile stress occurs within the GYYZ surface layer, exhibiting a decreasing trend from the center towards the edge (Figure 2c). Conversely, the maximum compressive stress is concentrated near the BC/substrate interface, particularly in the edge region (Figure 2c). Notably, the introduction of pores induces significant stress concentration around the pores, as illustrated in Figure 3. Furthermore, the presence of pores substantially elevates the peak tensile stress in the coating (Figure 2d–h), with these high-stress zones predominantly localized around the pores. Crucially, as the porosity increases from 0 to 25 vol.%, the peak tensile stress exhibits a non-monotonic variation (Figure 2d–h): it initially decreases, reaches a minimum at 15 vol.%, and subsequently rises to its maximum value at 25 vol.%. The non-monotonic variation in stress with porosity can be attributed to the competing effects of stress relaxation and stress concentration. At low porosity levels, isolated pores act as stress-relief features by increasing strain tolerance, reducing effective stiffness, and accommodating part of the thermal mismatch strain. This leads to a decrease in overall residual stress at the interface. However, beyond a critical porosity threshold, the pores significantly reduce the load-bearing cross-section and act as potent stress concentrators. In this regime, the local stress intensification around pore edges outweighs the benefits of stress relaxation, resulting in an increase in interfacial stress. Thus, the observed “decrease-then-increase” trend results from a transition in the dominant mechanism: from stress relaxation facilitated by isolated pores to stress concentration caused by the reduction in effective load-bearing cross-section.
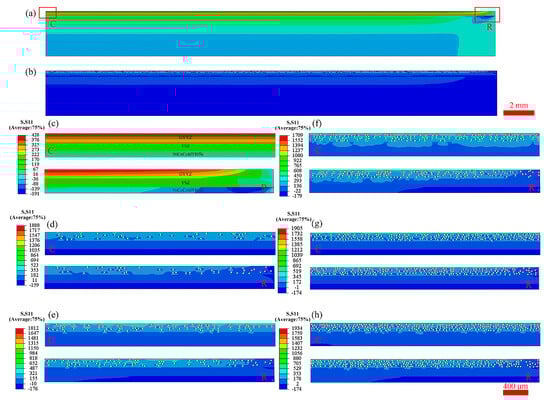
Figure 2.
Contour plots of instantaneous stress distribution during cooling under different GYYZ top-coating porosities: (a,b) Entire model at 0 vol.% and15 vol.%, respectively. (c–h) Detailed views within the coating at (c) 0 vol.%, (d) 5 vol.%, (e) 10 vol.%, (f) 15 vol.%, (g) 20 vol.%, and (h) 25 vol.%. (Positive and negative values represent tensile and compressive stress, respectively. C and R denote the center and edge regions, respectively).
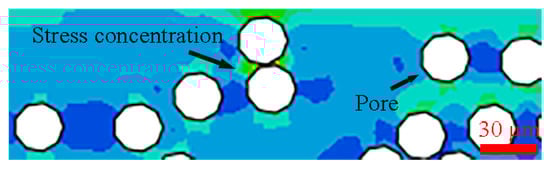
Figure 3.
Schematic of stress concentration around pores in the GYYZ top coating (magnified view).
To quantitatively evaluate the influence of the top-coat porosity on the stress distribution at all coating interfaces, three key stress analysis paths were established: along the GYYZ/YSZ interface (O1A), YSZ/BC interface (O2B), and BC/substrate interface (O3C), as shown in Figure 4. Peak tensile stress data along each path under different top-coat structural parameters were extracted to systematically examine the variation in interface stress states.
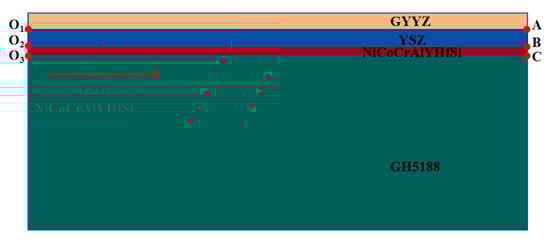
Figure 4.
Schematic of stress analysis paths at coating interfaces.
Figure 5 illustrates the peak tensile stress variation at the three key interfaces with increasing top-coat porosity. The peak tensile stress at the BC/substrate interface remains stable (32–36 MPa) across the entire porosity range and shows no clear trend (Figure 5a). This stability, attributed to the interface’s distance from the porous top coat region where pore effects attenuate significantly, indicates limited influence of top-coat porosity on the BC/substrate stress level. In contrast, the peak tensile stress at the YSZ/BC interface exhibits a distinct non-monotonic variation (Figure 5b). As porosity increases, the stress decreases significantly, reaching a minimum (4.8% lower than the dense coating) within the 10–15 vol.% range, before increasing markedly. This decrease-then-increase behavior suggests an optimal porosity range of 10–15 vol.% for effectively mitigating stress concentration at the YSZ/BC interface. Similarly, the GYYZ/YSZ interface peak tensile stress displays a characteristic nonlinear decrease-then-increase response (Figure 5c). Initial pore introduction (5 vol.%) reduces the stress by 5.1% compared to the dense coating. Within the 10–20 vol.% porosity range, the stress stabilizes at 145–148 MPa, representing a 6.3%–8.2% reduction, demonstrating the pronounced stress-reducing effect of the porous structure. However, beyond 20 vol.%, the stress undergoes a significant reversal, exhibiting a gradual increase. This reversal indicates a critical porosity threshold near 20 vol.%, beyond which the stress-mitigating effect diminishes. Analysis of these interfacial stress distributions reveals that controlling the GYYZ top-coat porosity within 10–15 vol.% optimizes the coating system’s interfacial stress state, thereby enhancing its thermal shock resistance.
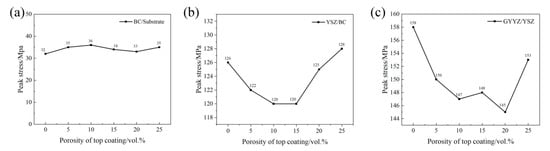
Figure 5.
Variation in peak tensile stress at key interfaces with top-coating porosity: (a) BC/matrix; (b) YSZ/BC; (c) GYYZ/YSZ.
3.1.2. Effect of Top-Coating Pore Diameter on Thermal Stress
The GYYZ top coat thickness was fixed at 0.15 mm with 15 vol.% porosity. To investigate pore diameter effects on coating stress distribution, diameters of 10, 15, 20, 25, and 30 μm were systematically evaluated. Figure 6 presents radial stress distributions under varying pore diameters. The maximum compressive stress localized near the edge of the BC/substrate interface, while the maximum tensile stress concentrated around the pores following pore introduction.
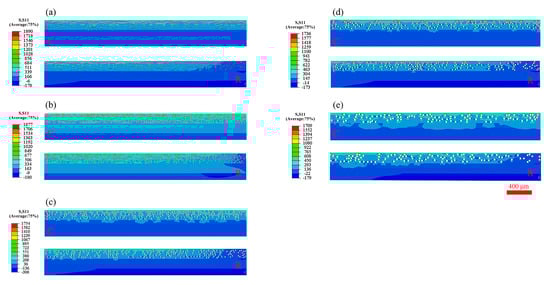
Figure 6.
Contour plots of instantaneous stress distribution during cooling under different pore diameters of GYYZ top coating: (a) 10 μm; (b) 15 μm; (c) 20 μm; (d) 25 μm; (e) 30 μm.
Figure 7 demonstrates the influence of GYYZ top-coat pore diameter on interfacial peak tensile stress. The BC/substrate interface maintains exceptional diameter insensitivity, with peak stress confined to 32–34 MPa across all diameters (Figure 7a). This stability, resulting from the interface’s distance from the porous top coat and substrate-dominated stress distribution, confirms minimal pore structure impact. Both the YSZ/BC and GYYZ/YSZ interfaces show a clear dependence on pore diameter (Figure 7b,c), though the extent of this dependence differs between the two. Specifically, the YSZ/BC interfacial stress remains stable within the 10–20 μm pore diameter range but increases sharply by 5.9% when the diameter exceeds 20 μm, particularly between 20 and 25 μm (Figure 7b). In contrast, the GYYZ/YSZ interfacial stress increases almost linearly across the 10–30 μm range, with a more pronounced rise observed between 10 and 15 μm (Figure 7b). This discrepancy arises from differences in material properties and interfacial proximity. The GYYZ/YSZ interface is more sensitive to pore diameter changes within the GYYZ layer due to its direct proximity. Under a fixed porosity, a decrease in pore diameter leads to a significant increase in the number of pores, as shown in Figure 8. This higher pore density reduces the inter-pore spacing, causing the stress fields of adjacent pores to interact. Such synergistic effects enhance stress relief (Figure 8a). In contrast, when the pore size increases, the reduced pore density results in larger inter-pore spacing, allowing the pores to be treated as isolated entities with negligible mutual interaction. This diminished interaction reduces the capacity for stress redistribution, ultimately leading to an increase in localized stress (Figure 8b). On the other hand, the YSZ/BC interface is located farther from the GYYZ layer and is backed by a more ductile BC metallic coating, making it less sensitive to variations in GYYZ pore size. As a result, the YSZ/BC interfacial stress remains unaffected at smaller pore diameters but rises noticeably once the diameter exceeds 20 μm, likely due to intensified stress concentration effects [37]. Multi-interface stress optimization identifies 10–20 μm as the optimal pore diameter range for GYYZ top coat.
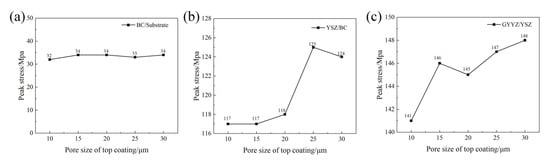
Figure 7.
Variation in peak tensile stress at key interfaces with top-coating pore diameter: (a) BC/matrix; (b) YSZ/BC; (c) GYYZ/YSZ.
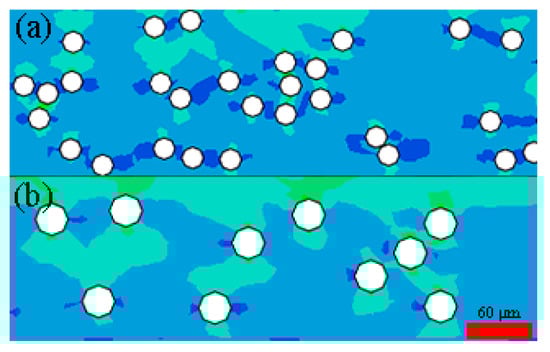
Figure 8.
Local stress contour plots of the top coat with a fixed porosity of 15 vol.% and varying pore diameters: (a) 10 μm and (b) 30 μm.
3.1.3. Effect of Top-Coating Thickness on Thermal Stress
The GYYZ top-coat porosity and pore diameter were fixed at 15 vol.% and 10 μm, respectively. The study systematically analyzed thermal stress distributions across top-coat thicknesses of 0.1, 0.15, 0.2, 0.25, and 0.3 mm. Figure 9 presents radial stress plots under these thickness variations. Consistent with other top-coat structural parameters, maximum tensile stress localized around pores, and maximum compressive stress concentrated at the BC/substrate interface near model edge. Crucially, peak tensile stress of the coating exhibited non-monotonic variation with increasing thickness, reaching its minimum at 0.15 mm.
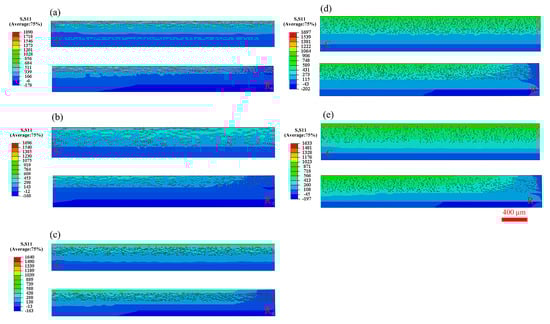
Figure 9.
Contour plots of instantaneous stress distribution during cooling under different thicknesses of GYYZ top coating: (a) 0.10 mm; (b) 0.15 mm; (c) 0.20 mm; (d) 0.25 mm; (e) 0.30 mm.
Figure 10 demonstrates the influence of top-coat thickness (100–300 μm) on peak tensile stress at the three key coating interfaces. Notably, the GYYZ/YSZ interface exhibits significant thickness sensitivity (Figure 10c). At 100 μm thickness, peak tensile stress reaches its maximum (162 MPa). This decreases sharply by 13.0% at 150 μm, followed by a gradual increase to 146–153 MPa across 150–300 μm. The increase in stress beyond the critical thickness of 150 µm, as shown in Figure 10c, results from the dominant contribution of intrinsic stress and thermal mismatch stress induced by thicker coatings, which eventually outweighs the stress-relieving effect provided by the enhanced strain tolerance of a thicker layer with pores and microcracks. Analysis of interfacial stress distributions reveals that maintaining top-coat thickness at 150 μm optimizes the coating’s stress state.
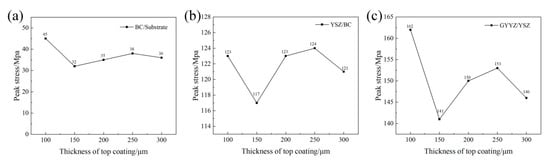
Figure 10.
Variation in peak tensile stress at key interfaces with top-coating thickness: (a) BC/substrate; (b) YSZ/BC; (c) GYYZ/YSZ.
While the current finite element model provides valuable insights into the thermal stress distribution within the GYYZ/YSZ DCL TBC system, it relies on several simplifying assumptions that influence the quantitative stress results. On one hand, the assumption of perfectly smooth interfaces and ideal bonding neglects the inherent roughness and complex morphology of real thermally grown oxide (TGO) and coating interfaces. In reality, interface roughness can act as a significant stress concentrator, potentially leading to localized stress values higher than those predicted here, particularly at the peaks and valleys of the undulating interface. This may accelerate the initiation of micro-cracks and delamination. On the other hand, the model does not explicitly simulate the growth of the TGO layer due to bond coat (BC) oxidation. The progressive thickening of the TGO (primarily α-Al2O3) during service generates substantial growth stresses and significantly alters the thermomechanical response of the system. Neglecting this phenomenon likely leads to an underestimation of the in-plane compressive stresses within the ceramic layers and the resultant driving force for buckling-driven delamination upon cooling. Therefore, the stress values reported in this study should be interpreted as a conservative estimate representative of an ideal, as-processed system under initial thermal cycles. The qualitative trends and comparative analysis between different structural parameters remain valid and insightful. Future work will incorporate more sophisticated models, including interface roughness, TGO growth, pore shape, and fracture mechanics, to achieve a more precise quantitative prediction of the coating’s lifetime.
3.2. Coating Performance Test Results
3.2.1. Microstructures
The simulation results in Section 3.1.1 demonstrate that GYYZ top-coat porosity significantly influences coating thermal stress. Controlling porosity within 10–15 vol.% optimizes interfacial stress states and enhances thermal shock resistance. To validate the simulation results, coatings with top-coat porosities of 20 vol.% and 15 vol.% were fabricated, and their cross-sectional microstructures are presented in Figure 11. Both coatings exhibit identical microstructures, comprising a NiCoCrAlYHfSi bond coat (~100 μm), a YSZ interlayer (~150 μm), and a GYYZ top coat (~150 μm). All interfaces are continuous and homogeneous, with no detectable defects. Figure 12 shows magnified views of the top-coat microstructures, revealing uniform microstructures with homogeneously distributed pores in both coatings. ImageJ porosity analysis indicates that the two top coatings have porosities of 19.8 ± 0.9 vol.% and 14.8 ± 0.7 vol.%, respectively, consistent with the designed porosity values. Figure 13 presents the XRD patterns of the two as-prepared coatings with porosities of 15 vol.% and 20 vol.%. The result confirm the presence of a single-phase Gd2O3-Yb2O3-Y2O3 co-Stabilized c-ZrO2 in the top coat.
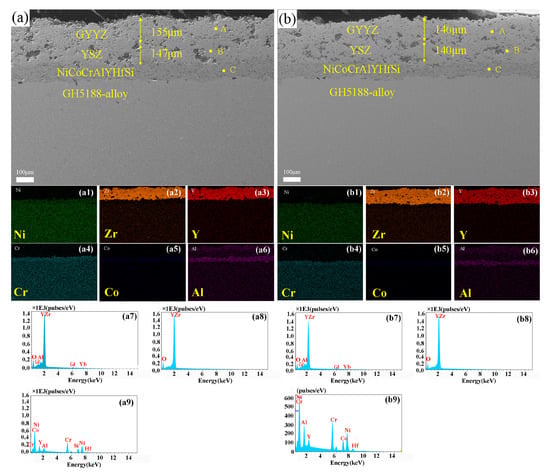
Figure 11.
Cross-sectional SEM images and EDS element maps of coatings with top-coat porosities: (a) 20 vol.% (a1–a6) EDS; (b) 15 vol.% (b1–b6) EDS. (a1–a6) EDS elemental maps corresponding to (a); (a7–a9) EDS spectra for points A, B, and C in (a); (b1–b6) EDS elemental maps corresponding to (b); (a7–a9) EDS spectra for points A, B, and C in (b).
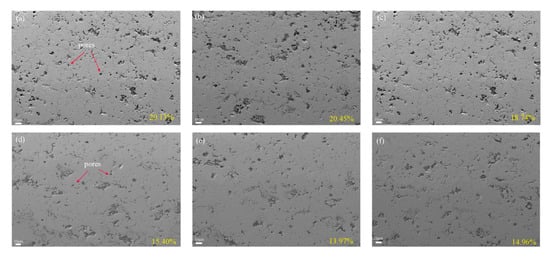
Figure 12.
Magnified SEM images of top coatings with different porosities: (a–c) 20 vol.%; (d–f) 15 vol.%.
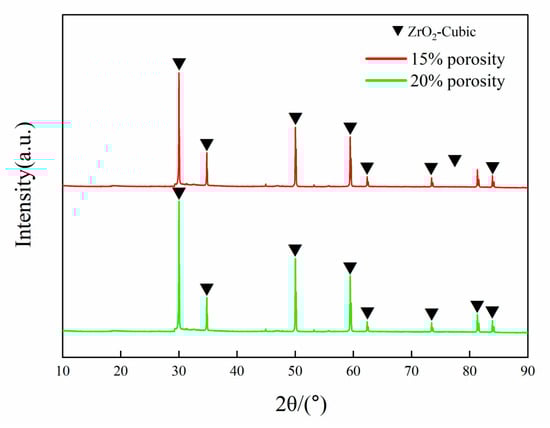
Figure 13.
XRD pattern for the two coatings with porosities of 15 vol.% and 20 vol.%.
3.2.2. Microhardness and Thermal Shock Performance
The Vickers hardness values of coatings with different top-coat porosities are shown in Figure 14. The coating with 20 vol.% porosity exhibits a microhardness of 657 ± 27 HV0.5, while that with 15 vol.% porosity reaches 741 ± 22 HV0.5, which is a significant increase of 12.8%. This demonstrates that reduced top-coat porosity enhances coating microhardness.
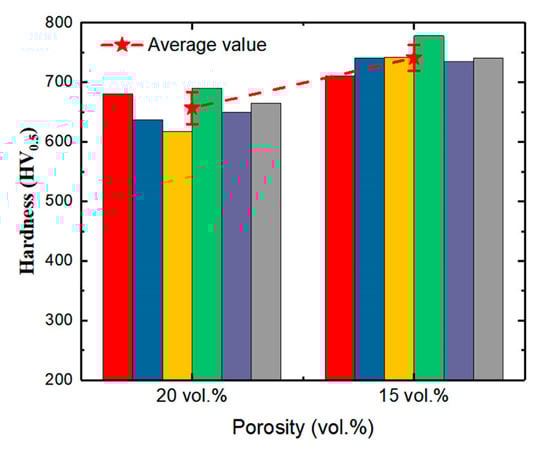
Figure 14.
Vickers hardness values of coatings with different top-coat porosities.
Thermal shock tests at 1300 °C were performed on coating samples with different top-coat porosities. The coating with 20 vol.% porosity failed after ~800 cycles (783 ± 54), while the 15 vol.% porosity coating sustained ~1500 cycles (1497 ± 95). This represents an 87.5% increase in thermal cycle life for the lower-porosity coating, demonstrating that reducing top-coat porosity from 20 vol.% to 15 vol.% significantly enhances thermal shock resistance, which is consistent with thermal stress simulations.
Post-failure morphology analysis (Figure 15) revealed distinct failure mechanisms. The 20 vol.% porosity coating exhibited macroscopic cracking at the YSZ/BC interface (Figure 15a,b), indicating YSZ/BC interfacial failure. Conversely, the 15 vol.% porosity coating maintained YSZ/BC interface integrity but developed cracks at the GYYZ/YSZ interface, causing partial spallation (Figure 15c,d). These failure mode differences correlate with simulated interfacial peak tensile stress under thermal shock conditions (Figure 5). The BC/substrate interface stress showed minimal porosity dependence. The YSZ/BC interface stress was 4.2% higher at 20 vol.% porosity than at 15 vol.% porosity, while the GYYZ/YSZ interface stress was 2.1% higher at 15 vol.% porosity than at 20 vol.% porosity. Thus, the failure location shifts from YSZ/BC interface to GYYZ/YSZ interface when the top-coating porosity decreases from 20 vol.% to 15 vol.%, consistent with the respective stress concentration zones.
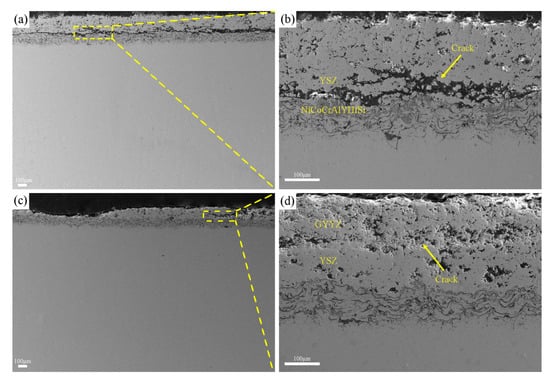
Figure 15.
Cross-sectional morphology of thermally shocked coatings with different top-coat porosities: (a,b) 20 vol.%; (c,d) 15 vol.%.
Detailed microstructure and elemental analyses (including high-magnification scanning electron microscopy (SEM) and energy dispersive spectroscopy (EDS) imaging for oxygen and aluminum) were conducted at the YSZ-BC interface in samples with 15% and 20% porosity, as shown in Figure 16 and Figure 17. These analyses were carried out before and after the thermal shock test, respectively. No significant oxide accumulation was detected along the crack path or near the delaminated interface after thermal shock. Based on these observations, it is concluded that oxide-induced stresses did not play a major role in the observed delamination and fracture behavior. Instead, the failure is primarily attributable to mechanical stress concentrations resulting from the porosity-dependent mismatch in thermomechanical properties between the layers. Compared to 15 vol.% porosity, the stress relaxation capacity of the GYYZ coating at 20 vol.% porosity is enhanced, which reduces interfacial stress at GYYZ/YSZ and leads to stress concentration at the YSZ/BC interface. In contrast, when porosity decreases to 15 vol.%, the stress relaxation capability diminishes, resulting in stress concentration at the GYYZ/YSZ interface. Therefore, the shift in failure location from YSZ/BC to GYYZ/YSZ with porosity reduction from 20 vol.% to 15 vol.% is attributed to the redistribution of internal stresses under thermal shock conditions due to variations in structural parameters, which alters the crack nucleation and propagation pathways.
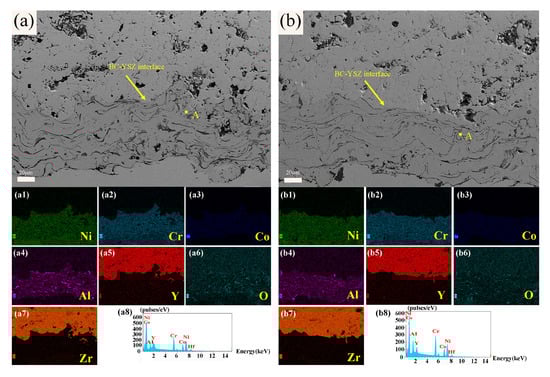
Figure 16.
Cross-sectional SEM images and corresponding elemental mappings at the YSZ-BC interface in coatings with (a) 20% and (b) 15% top-coat porosities before thermal shock test. (a1–a7) EDS elemental maps corresponding to (a); (a8) EDS spectrum from point A in (a); (b1–b7) EDS elemental maps corresponding to (b); (b8) EDS spectrum from point A in (b).
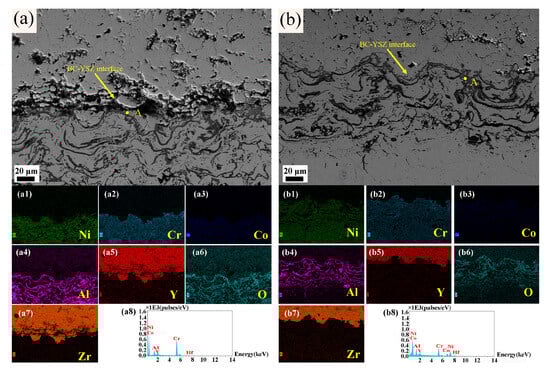
Figure 17.
Cross-sectional SEM images and corresponding elemental mappings at the YSZ-BC interface in coatings with (a) 20% and (b) 15% op-coat porosities after thermal shock failure. (a1–a7) EDS elemental maps corresponding to (a); (a8) EDS spectrum from point A in (a); (b1–b7) EDS elemental maps corresponding to (b); (b8) EDS spectrum from point A in (b).
4. Conclusions and Future Work
4.1. Conclusions
To investigate the influence of the top-layer structure on the thermal stress distribution and the performance of GYYZ/YSZ DCL TBC under thermal shock conditions, this work studies the influence of GYYZ top-coat structure (porosity, pore diameter, and thickness) on mechanical properties of the coating through coupled finite element simulation and experimental validation. Key conclusions are summarized as follows:
(1) Simulation-based predictions indicate that the BC/substrate interface stress exhibits minimal fluctuation with increasing top-coat porosity (0–25 vol.%), while the YSZ/BC and GYYZ/YSZ interface stresses display nonlinear decrease-then-increase response. The optimal interfacial stress state achieved at 10–15 vol.% porosity.
(2) According to simulation results, the BC/substrate interface stress remains invariant to top-coat pore diameter changes (10–30 μm), while the YSZ/BC interface demonstrates maximum stress sensitivity at 20–25 μm. The GYYZ/YSZ interface stress increases monotonically over the studied range. The optimum pore diameter range is 10–20 μm.
(3) Simulations predict that the BC/substrate interface shows heightened stress sensitivity below 150 μm thickness. The YSZ/BC interface stress remains stable except for a significant reduction at 150 μm. The GYYZ/YSZ interface stress follows a decrease-then-increase trend with a distinct minimum at 150 μm. This confirms 150 μm as the critical thickness for interface stress optimization.
(4) The fabricated GYYZ/YSZ DCL TBCs exhibit top-coat porosities of 19.8 ± 0.9 vol.% and 14.8 ± 0.7 vol.%, respectively, matching the designed porosity targets. Compared to the 20 vol.% porosity coating, the 15 vol.% variant demonstrates a 12.8% increase in microhardness and an 87.5% extension in thermal cycling life. Failure modes transition from YSZ/BC interfacial cracking to GYYZ/YSZ interface delamination, validating thermal stress simulation models.
4.2. Future Work
While this study has elucidated the influence of the GYYZ top-layer structure on the thermal shock performance of GYYZ/YSZ DCL TBCs, further investigations are essential to advance toward practical application:
(1) Coupling effects of service environmental factors: Future studies should incorporate the synergistic impacts of high-temperature oxidation, CMAS corrosion, and long-term sintering to better simulate real service environments.
(2) Refinement of simulation models: Existing simulations incorporate significant simplifications, such as assumed spherical pore shapes, and perfectly bonded interfaces, which deviate from actual material conditions. Future modeling efforts should strive to incorporate more realistic microstructural features and initial conditions as computational capabilities advance.
(3) Extensive experimental validation: There is a critical need for systematic experimental validation across a broader range of samples, mirroring the parametric diversity explored in the finite element analysis. Such efforts would strengthen the correlation between simulation predictions and practical performance.
Supplementary Materials
The following supporting information can be downloaded at https://www.mdpi.com/article/10.3390/coatings15101141/s1. Figure S1: Distribution contour plots of (a) radial, (b) axial, and (c) shear stresses in the model with 15 vol.% porosity, 30 μm pore diameter, and 150 μm top-coating thickness during the cooling phase.
Author Contributions
Conceptualization, H.Y. and S.Z.; methodology, Y.Z.; software, Y.Z.; validation, T.S. and Y.W.; formal analysis, X.P.; investigation, Y.Z.; resources, H.Y. and C.C.; data curation, X.P.; writing—original draft preparation, H.Y.; writing—review and editing, P.O.; visualization, H.Y.; supervision, S.Z., Y.W. and C.C.; project administration, P.O.; funding acquisition, P.O. All authors have read and agreed to the published version of the manuscript.
Funding
This work was supported by the National Natural Science Foundation of China (Grant No. 52305328), and National Major Science and Technology Project of China (2024ZD0705101).
Institutional Review Board Statement
Not applicable.
Informed Consent Statement
Not applicable.
Data Availability Statement
Data are available from the corresponding author by request.
Conflicts of Interest
Author Haitao Yun and Yuncheng Wang were employed by the AECC South Industry Company Limited. The remaining authors declare that the research was conducted in the absence of any commercial or financial relationships that could be construed as a potential conflict of interest.
References
- Sezavar, A.; Sajjadi, S.A. A review on the performance and lifetime improvement of thermal barrier coatings. J. Eur. Ceram. Soc. 2025, 45, 117274. [Google Scholar] [CrossRef]
- Mehboob, G.; Liu, M.; Xu, T.; Hussain, S.; Mehboob, G.; Tahir, A. A review on failure mechanism of thermal barrier coatings and strategies to extend their lifetime. Ceram. Int. 2020, 46, 8497–8521. [Google Scholar] [CrossRef]
- Liu, Q.; Huang, S.; He, A. Composite ceramics thermal barrier coatings of yttria stabilized zirconia for aero-engines. J. Mater. Sci. Technol. 2019, 35, 2814–2823. [Google Scholar] [CrossRef]
- Song, X.; Liu, Z.; Kong, M.; Lin, C.; Huang, L.; Zheng, X.; Zeng, Y. Thermal stability of yttria-stabilized zirconia (YSZ) and YSZ-Al2O3 coatings. Ceram. Int. 2017, 43, 14321–14325. [Google Scholar] [CrossRef]
- Yang, K.; Shi, J.; Tian, F.; Chen, X.; Zhang, K.; Zhang, X. Lanthanide co-doped YSZ double-ceramic-layer thermal barrier coatings: Unlocking superior sintering resistance, thermal durability, and insulation for extreme environments. Surf. Coat. Technol. 2025, 504, 132069. [Google Scholar] [CrossRef]
- Shvydyuk, K.O.; Nunes-Pereira, J.; Rodrigues, F.F.; Silva, A.P. Review of ceramic composites in aeronautics and aerospace: A multifunctional approach for TPS, TBC and DBD applications. Ceram. Switz. 2023, 6, 195–230. [Google Scholar] [CrossRef]
- Cheng, B.; Yang, G.J.; Zhang, Q.; Yang, N.; Zhang, M.; Zhang, Y.; Li, C.X.; Li, C.J. Gradient thermal cyclic behaviour of La2Zr2O7/YSZ DCL-TBCs with equivalent thermal insulation performance. J. Eur. Ceram. Soc. 2018, 38, 1888–1896. [Google Scholar] [CrossRef]
- Zhu, R.B.; Zou, J.P.; Mao, J.; Deng, Z.Q.; Zhang, X.F.; Deng, C.M.; Liu, M. A comparison between novel Gd2Zr2O7 and Gd2Zr2O7/YSZ thermal barrier coatings fabricated by plasma spray-physical vapor deposition. Rare Met. 2021, 40, 2244–2253. [Google Scholar] [CrossRef]
- Han, J.; Zou, Y.; Wu, D.; Zhang, Y. Investigating the thermal, mechanical and thermal cyclic properties of plasma-sprayed Al2O3-7YSZ/7YSZ double ceramic layer TBCs. J. Eur. Ceram. Soc. 2023, 43, 4124–4135. [Google Scholar] [CrossRef]
- Xiang, Y.; Yan, K.; Yu, H.; Guo, Y.; Ying, Y.; Li, Z.; Sun, J.; Fang, C. Comparative investigation on the hot corrosion failure of YSZ and GdYb-YSZ double-ceramic-layer thermal barrier coatings under Na2SO4+V2O5 molten salts. Ceram. Int. 2023, 49, 18678–18688. [Google Scholar] [CrossRef]
- Wang, P.; Chen, D.; Wang, Q.; Ma, Z.; Liu, L. Thermal stability and thermal cycling behavior of LGYYSZ/YSZ thermal barrier coatings fabricated by atmospheric plasma spraying. Surf. Coat. Technol. 2025, 505, 132038. [Google Scholar] [CrossRef]
- Diwahar, D.; Manivachakan, V.; Syed, R.B. An overview of rare earth-doped ceramic thermal barrier coatings for high-temperature performance of nickel-based superalloys. High Temp. Corr. Mater. 2025, 102, 17. [Google Scholar] [CrossRef]
- Guo, Y.; Guo, L.; Liu, K.; Qiu, S.; Guo, H.; Xu, H. Mechanical properties and simulated thermal conductivity of biomimetic structured PS-PVD (Gd0.9Yb0.1)2Zr2O7 thermal barrier coatings. J. Mater. Sci. Technol. 2024, 182, 33–40. [Google Scholar] [CrossRef]
- Chen, D.; Wang, Q.; Liu, Y.; Ning, X. Microstructure, thermal characteristics, and thermal cycling behavior of the ternary rare earth oxides (La2O3, Gd2O3, and Yb2O3) co-doped YSZ coatings. Surf. Technol. 2020, 403, 126387. [Google Scholar] [CrossRef]
- Shi, Q.; Yuan, W.; Chao, X.; Zhu, Z. Phase stability, Thermal conductivity and crystal growth behavior of RE2O3 (RE = La, Yb, Ce, Gd) co-doped Y2O3 stabilized ZrO2 powder. J. Sol-Gel Sci. Technol. 2017, 84, 341–348. [Google Scholar] [CrossRef]
- Yang, K.; Shi, J.; Liu, L.; Chen, X.; Xu, W.; Zhao, Z.; Tian, F.; Zhang, X. Ablation behavior and delamination mechanism of air plasma sprayed (Gd, Yb) doped YSZ double ceramic layer thermal barrier coatings at 1500 °C. Surf. Coat. Technol. 2025, 496, 131679. [Google Scholar] [CrossRef]
- Jiang, C.; Hao, W.; Liu, C.; Shi, D.; Song, W. Thermal cycling performance of GYbZ/YSZ thermal barrier coatings with different microstructures based on finite element simulation. J. Alloys. Compd. 2025, 1010, 177185. [Google Scholar] [CrossRef]
- Yang, P.; Yang, D.; Hao, E.; An, Y.; Li, Y.; Wang, Z. Thermal shock resistance and failure analysis of La2(Zr0.75Ce0.25)2O7-based TBCs produced by atmospheric plasma spraying. Surf. Coat. Technol. 2021, 409, 126903. [Google Scholar] [CrossRef]
- Rajabi, M.; Aboutalebi, M.R.; Seyedein, S.H.; Ataie, S.A. Simulation of residual stress in thick thermal barrier coating (TTBC) during thermal shock: A response surface-finite element modeling. Ceram. Int. 2022, 48, 5299–5311. [Google Scholar] [CrossRef]
- Wang, L.; Wang, Y.; Zhang, W.Q.; Sun, X.G.; He, J.Q.; Pan, Z.Y.; Wang, C.H. Finite element simulation of stress distribution and development in 8YSZ and double-ceramic-layer La2Zr2O7/8YSZ thermal barrier coatings during thermal shock. Appl. Surf. Sci. 2012, 258, 3540–3551. [Google Scholar] [CrossRef]
- Wu, S.; Zhao, Y.T.; Li, W.G.; Zhao, Z.X.; Liu, W.L.; Wu, Y.P. Research progress on surface materials of zirconia-based dual-ceramic layer thermal barrier coatings. Surf. Technol. 2020, 49, 101–108. [Google Scholar] [CrossRef]
- Liang, L.H.; Liu, X.H.; Chen, L.F.; Wei, Y.G. Effect of ceramic coating thickness on fracture behaviour of coating structure under thermal shock cycles. Ceram. Int. 2022, 48, 11435–11444. [Google Scholar] [CrossRef]
- Pan, H.P.; Yuan, X.D.; Xia, S.L.; Wang, M.J.; Li, X.F. Numerical simulation of the influence of La2Zr2O7 thickness on the thermal insulation performance and initial residual stress of La2Zr2O7-8YSZ dual-ceramic thermal barrier coating. Cast. Technol. 2020, 41, 831–834. [Google Scholar] [CrossRef]
- Li, J.X.; Zhao, W.L.; Yu, J.S.; Yang, Q.; He, D.H.; Wang, L. Thickness optimization and interfacial residual stress of YSZ/YTaO4 double-ceramic-layer thermal barrier coatings fabricated by atmospheric plasma spraying: A finite element simulation study. Ceram. Int. 2025, 51, 13674–13691. [Google Scholar] [CrossRef]
- Li, Z.; Wei, Z.; Li, X.; Wang, L.; Ma, Z.; Dong, L.; Dong, H.; Yao, J.; Zhou, Y.; Li, G. Matching design of porous microstructures for double-layered thermal barrier coatings composed of Gd2Zr2O7 and yttria-stabilized zirconia enables long protection. Ceram. Int. 2025, 51, 35092–35103. [Google Scholar] [CrossRef]
- Liu, L.; Xu, W.; Shi, J.; Zhang, X.; Tu, S. Plasma sprayed thermal barrier coatings with outstanding ultrahigh temperature thermal shock resistances through gradient porosity level optimizations. Ceram. Int. 2025, 51, 17484–17491. [Google Scholar] [CrossRef]
- Montakhabi, F.; Poursaeidi, E.; Rahimi, J.; Sigaroodi, M.R.J. Investigation of the effect of BC layer surface roughness and TC layer porosity on stress values in plasma sprayed coatings based on SEM images. Mater. Today Commun. 2022, 33, 104737. [Google Scholar] [CrossRef]
- Yang, T.; Wang, W.; Tang, Z.; Liu, Y.; Li, K. Structural optimization for porous thermal barrier coating and analysis of thermomechanical properties by experimental and computational investigation. Surf. Technol. 2023, 458, 129347. [Google Scholar] [CrossRef]
- Zhao, K.; Huang, W.; Deng, P.; Zhong, R.; Tan, Z.; Hu, Y.; Li, J.; Mao, W. Mechanical properties, thermal shock resistance and stress evolution of plasma-sprayed 56 wt% Y2O3-stabilized ZrO2 thick thermal barrier coatings. Surf. Coat. Technol. 2024, 494, 131352. [Google Scholar] [CrossRef]
- Liu, P.; Yang, S.; Li, K.; Wang, W.; Liu, Y.; Yang, T. Experimental and simulation studies on thermal shock of multilayer thermal barrier coatings with an intermediate transition layer at 1500 °C. Coatings 2024, 14, 1614. [Google Scholar] [CrossRef]
- Cui, S.; Miao, Q.; Domblesky, J.P.; Liang, W.; Song, Y. Modeling of the temperature field in a porous thermal barrier coating. Ceram. Int. 2019, 45, 12635–12642. [Google Scholar] [CrossRef]
- Hu, S.; Feng, Y.J.; Li, W.H.; Hu, S.Y.; Gong, X.; Xie, Z.W. Numerical simulation of residual thermal stress distribution and thermal stability of LaMgAl11O19 thermal barrier coating during annealing process. Surf. Technol. 2022, 51, 275–282. [Google Scholar] [CrossRef]
- GB/T 13298-2015; Metallic Materials—Micrographic Method for the Determination of Microstructure. Standardization Administration of China: Beijing, China, 2015.
- Abedi, H.R.; Salehi, M.; Shafyei, A. Microstructural, Mechanical and thermal shock properties of triple-layer TBCs with different thicknesses of bond coat and ceramic top coat deposited onto polyimide matrix composite. Ceram. Int. 2018, 44, 6212–6222. [Google Scholar] [CrossRef]
- GB/T 4340.1-2024; Metallic Materials—Vickers Hardness Test—Part 1: Test Method. Standardization Administration of China: Beijing, China, 2024.
- GB/T 42261-2022; Metallic Materials—Sheet and Strip—Determination of Tensile Strain Hardening Exponent. Standardization Administration of China: Beijing, China, 2022.
- Klym, H.; Kostiv, Y.; Kushnir, O.; Konuhova, M.; Kozlovskiy, A.L.; Popov, A.I. Influence of Eu3+ doping on the microstructure and nanoporous transformation of BaGa2O4 ceramics. J. Mater. Sci. 2025, 60, 12662–12672. [Google Scholar] [CrossRef]
Disclaimer/Publisher’s Note: The statements, opinions and data contained in all publications are solely those of the individual author(s) and contributor(s) and not of MDPI and/or the editor(s). MDPI and/or the editor(s) disclaim responsibility for any injury to people or property resulting from any ideas, methods, instructions or products referred to in the content. |
© 2025 by the authors. Licensee MDPI, Basel, Switzerland. This article is an open access article distributed under the terms and conditions of the Creative Commons Attribution (CC BY) license (https://creativecommons.org/licenses/by/4.0/).