1. Introduction
Demands for larger storage capacitors shifted semiconductor devices from a 2D planar structure to a 3D vertical structure, and ongoing issues in fabrication and the device design process remain a challenge [
1]. The fabrication of 3D-NAND flash employs a single plasma-enhanced chemical vapor deposition (PECVD) chamber to deposit multiple oxide/nitride layer of the dielectric gate stack. However, measuring the thickness of the multiple dielectric layers is still challenging [
2]. The deposition of multiple layers also increases the film thickness on the PECVD chamber wall to cause an extended time for the chamber cleaning with a nitrogen trifluoride (NF
3) remote plasma system, and an effort to investigate alternative gases for plasma chamber cleaning was presented because of the potent greenhouse effect of NF
3 [
3,
4,
5].
NF
3 gas is mainly used with Ar or O
2 gas for chamber cleaning. The dissociation of NF
3 into NF
x + F → NF
x + 2|x = 1, 2 can be explained by electron impact dissociation in plasma chemistry. Dilution of Ar in NF
3 also yields Ar
+ + NF
3 → Ar + F +
[
4]. The ionization energy of O
2 (12.07 eV) is lower than that of NF
3 (~14 eV), and a large fraction of
with a small fraction of O
+ in the plasma was observed. Therefore, O
2 acts as an energy sink, inhibiting reactions with the production of neutral and ionic fluorine species from NF
x. We can postulate that the mechanism of the surface material in chamber cleaning is similar to etching the wafer surface with a remote plasma system [
6,
7]. The use of NF
3 in remote plasma is not limited to PECVD chamber cleaning. Still, the feasibility of applying the etch process is continuously investigated. Selective etching of silicon nitride using NH
3/NF
3 remote plasma was investigated, and the increase in NF
3 flow in an NF
3/NH
3 gas mixture is more efficient for etching than that in an NH
3 flow [
8]. The reaction between NF
3/NH
3 remote plasma exposure and the SiN
* film forms an ammonium hexafluorosilicate, (NH
4)
2SiF
6. The role of NO in SiN etching over SiO
2 and Si substrate with NF
3/O
2 remote plasma was investigated [
9]. With relatively small activation energy, oxynitride (NO) increases the rate of fluorine migration from the nitrogen atom to the silicon atom on the silicon nitride surface. Thus, high etch selectivity can be achieved in SiN over SiO
2. In the Kushner group’s subsequent study on SiN etching with NF
3/O
2/Ar remote plasma, a remote plasma source was used to produce fluxes of radicals for low substrate damage in etching processing [
10]. The etch rate was increased along with the increase of NO molecules and N atoms. The electron impact dissociation produces N atoms of NO and NF
x using the increased electron density. More detailed investigations on the plasma source and surface reaction of NF
3/N
2/O
2/H
2 remote plasma in highly selective Si
3N
4/SiO
2 were performed for success in a 3D-NAND flash high aspect ratio etch [
11,
12]. It was discovered that the reaction of hydrogen with a fluorine radical dissociated in NF
3 plasma takes an important role in the selective etch of Si
3N
4 over SiO
2. Researchers from the Kushner group at the University of Michigan and the Samsung Electronics R&D Center recently reported a series of investigations on NF
3 remote plasma [
10,
11,
12]. The reference research explained the high selectivity with HF in the first vibrationally excited state.
PECVD chamber cleaning is the removal of the surface using NF
3 remote plasma, and concerns about the corrosive effects of NF
3 on chamber-coating ceramic materials were discussed [
13]. Ootomo et al. filed a patent on corrosion-resistant materials and their application to electrostatic chuck [
14]. Contamination particle and plasma corrosion behaviors of chamber walls with ceramic-coated materials by aerosol deposition have been reported [
15,
16]. A fluorine-based plasma resistant to O-rings elastomer was recently investigated [
17]. Expert Market Research reported that Asia would take 88% of the worldwide PFC market in 2019 because Asia heavily emphasizes the semiconductor/display manufacturing industry. Fluorine-based cold plasmas, including SF
6, CF
4, CHF
3, and C
4F
8, have been prevailing worldwide in the etching/cleaning of materials in the semiconductor/display manufacturing industry over the past 40 years worldwide [
18,
19], and the use of plasma with fluorine-based gases continues to overcome environment safety challenges. NF
3 is a toxic perfluoro compound (PFC) and a potential global warming gas, but NF
3 was not blanketed in the Kyoto Protocol [
20]. NF
3 is a synthetic inorganic chemical manufactured by the reaction of hydrogen fluoride (HF) and ammonia (NH
3), and it emerged as a replacement for hexafluoroethane (C
2F
6) as a “chamber cleaning gas” in the semiconductor/display industry due to its low cost as well as its absence from the Kyoto Protocol.
Fluorine-based compounds are essential in cleaning and etching processes during semiconductor manufacturing. Depending on the environmental issues, the use of SF
6 has been restricted, and NF
3 gas has still been used recently. It has the risk of corrosion and the possibility of receiving other environmental agents [
21]. However, there are few studies on NF
3 plasma under high-pressure conditions such as cleaning processes. As a result, this research aims to comprehend plasma containing fluorine by monitoring and using the comparative analysis of N
2 plasma and NF
3 plasma. As a test vehicle for spectroscopic analysis of the PECVD chamber cleaning gases, we investigated the plasma glow discharge during the PECVD chamber cleaning process using optical emission spectroscopy (OES).
2. Experimental Apparatus
We performed two sets of experiments with a nitrogen-based oxygen mixture (O
2/N
2) and NF
3-based oxygen mixture (O
2/NF
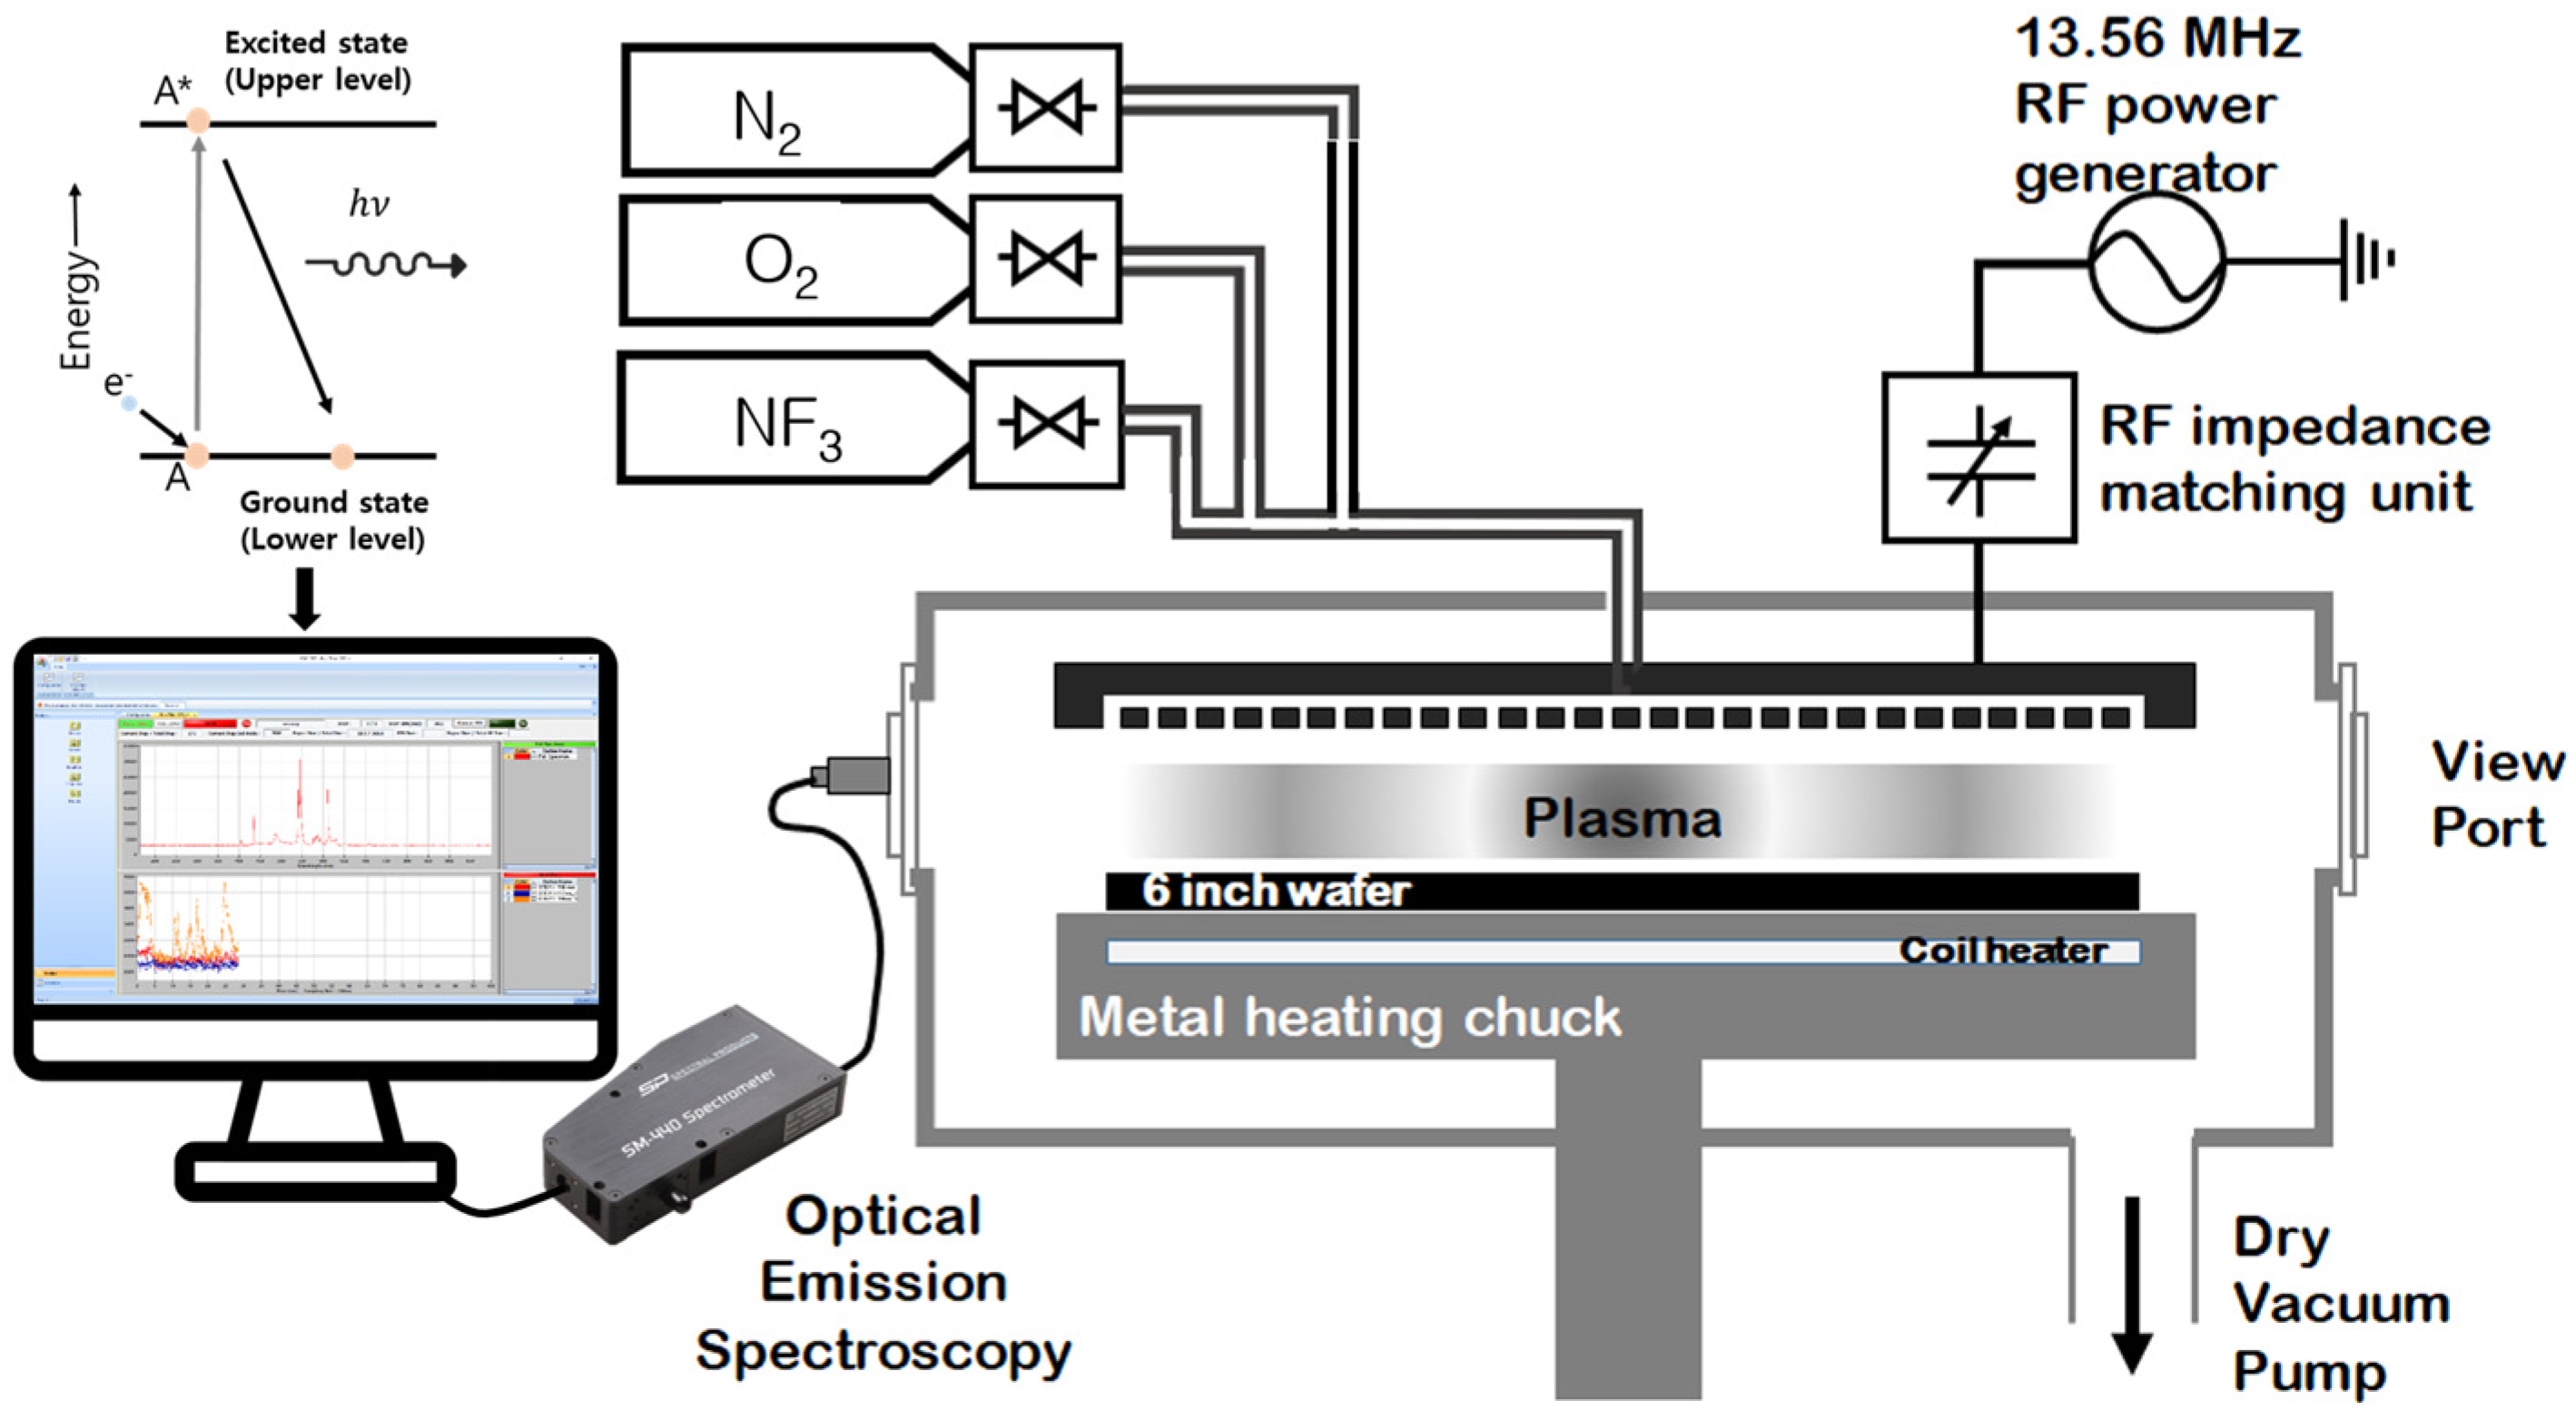
3) to understand plasma in the deposition pressure regime of a few Torrs. A schematic diagram of the employed PECVD system is shown in
Figure 1. As suggested above, O
2, N
2, and NF
3 gases were used, and the gas flow rate was controlled using a mass flow controller (MFC). Gases are injected into the showerhead through the gas line connected to the chamber. In this experiment, we used a 13.56 MHz RF-powered capacitively coupled plasma (CCP)–PECVD system for 6-inch wafer processing, manufactured by Plasmart, Daejeon, Korea. The system consists of a programmable logic controller-controlled gas delivery system with an automatic pressure controller, a metal heating chuck for wafer heating up to 400 °C, and a larger rotary pump for vacuum control. An OES sensor was used to collect the plasma light during the process. OES helps to understand the plasma chemistry noninvasively by observing through a viewport outside the chamber in a vacuum system [
22]. Particles in the plasma are excited by receiving the applied energy to gas species in the chamber and then fall to a lower energy state by yielding photon energy. Gas-phase atoms and molecules have energy levels, and the emitted light during the energy-releasing process is presented as a specific wavelength of the emitted light. OES captures light from the plasma via an optical cable and displays a spectrum of the collected emission discharge. It is used to explain the chemical composition and reaction mechanism of the plasma through the presence of substances corresponding to the wavelength [
23,
24,
25,
26]. An optical fiber-guided spectrometer, SM-440, manufactured by Korea Spectral Products, Seoul, Korea, with 90 cm of multicore silica optical fiber was used to collect the plasma emission discharge via a sidewall viewport of the PECVD system, and we ensured that none of the multicore fibers were broken before taking the emission spectroscopy data. We used our homemade semiconductor process diagnosis research center in Myongji University, Yongin, Korea, OES operational software (v.13.10.06), for the data acquisition and analysis as presented in
Figure 2.
The purpose of this research using the PECVD system is not for deposition of the thin film but to monitor and analyze N
2 and NF
3 plasma with OES. Because NF
3 is a well-known chamber-cleaning gas, we included 2 × 2 cm
2-sized ACL-deposited coupons on a 6-inch dummy wafer to see the result of the plasma condition with the variation of the oxygen contents beside the spectroscopic study of the plasma. A commercial PECVD system prepared ACL samples on 300 mm silicon wafers. Two sets of experiments were conducted with oxygen gas ratios of 0%, 20%, 50%, and 80% in nitrogen and trifluoride. Total gas flow rates of N
2 and NF
3 mixed with O
2 were set to be 50 sccm in both cases, with the addition of 2 sccm of argon for chemical actinometry. Before performing the experiments, we collected OES data with oxygen gas only in the same experimental condition to have an uncorrelated oxygen plasma discharge data set with nitrogen-related species as a reference for the following spectroscopic data analysis. The equipment setup was 300 °C of heating chuck temperature, 300 W of RF power, and 1000 mTorr of base pressure. The experimental conditions are summarized in
Table 1.
A series of plasma processes were performed simultaneously with in situ monitoring of the plasma glow discharge, and the spectroscopy data were stored in a local computer. Spectroscopic data collected from the plasma glow discharge can be used to determine the reaction with internal chemicals and substances. It also helps to understand the behavior of fluorine by analyzing plasma information (PI) such as electron temperature and density. The line-ratio method calculates PI from OES data [
29,
30,
31]. OES is a qualitative data acquisition sensor with a wide variety of spectral information, making quantitative analysis difficult. This research employs Ar actinometry and the line-ratio approach to attempt quantitative analysis utilizing OES data. The degree of transition from the ground state to the excited state varies depending on the material, causing the intensity of light to shift [
32]. The plasma intensity ‘I’ for the excited state
x is expressed as following Equations (1)–(3) [
33]. Here,
represents the population density of a species in this state.
represents the Einstein A coefficient.
The method devised here to obtain the radical density through the light emission intensity is the actinometry method in Equation (4). A minimal amount of inert argon gas must be injected into the plasma. It is assumed that the inert gas does not change the characteristics of the plasma, and at this time, the density of Ar is kept constant. The light emission of Ar is used as a measure of plasma excitation efficiency. The density of radicals can be obtained by dividing the light emitted by the radicals in the plasma and the light emitted by argon. By dividing two lines with similar threshold energies, the relative distribution of density can be confirmed. Although this method cannot measure the exact density, it can approximately check the density of radicals in the plasma. is the excitation rate coefficient from the ground state, is the electron kinetic energy, is the excitation threshold energy, is the excitation cross-section, is the electron mass, is the EEDF, is the electron energy probability function (EEPF) and is related to the EEDF, and by () = ().
The line-ratio method was used to obtain the electron temperature and electron density, which are plasma information [
34]. We augmented 2 sccms of Ar to the gas chemistry to apply the line-ratio method for the spectroscopic analysis. A small amount of Ar allows PI to be obtained without affecting the process since it is an inert gas. The line-ratio method can be applied to corona discharge and CRMs. Still, the pressure regime should be considered to employ a proper plasma model. Because the corona model is based on the exited species of the solar corona, it can be used under very low pressure (<1 Pa) and low ionization ratio (<10
−5) conditions and has low electron density and high electron temperature. CRM can be used at relatively high pressure (1–10 Pa or >10 Pa) and high ionization ratio (>10
−5) conditions. It is also suitable for high electron density and low electron temperature. Because the corona model has a very low electron density (<10
−5 cm
−3) and a high electron temperature (~10 eV), electron impact ionization from ground-state species and spontaneous radiation from the excited states are the most important processes [
35]. However, the CRM with high electron density and low electron temperature includes more diverse processes, such as excitation processes from metastable or excited states and the atom–atom collision processes, than the corona model [
36]. In this research, the argon CRM was simplified and utilized since the process was performed at 1 Torr (~133 Pa).
In plasma, electrons have the energy to trigger various reactions and are directly related to the efficiency and speed of the deposition or etching process. Electron temperature describes the electron’s energy. Because the corona model is dominated by the electron impact excitation process (
) and spontaneous radiation (
), a pair of excitation levels can be used to find the electron temperature and density. Expressed as
Q, the rate coefficient of an electron impact process, using the rate balance equation [
35].
is the electron kinetic energy,
is the electron mass,
is the EEDF, and
σ is the cross-section of the relevant electron impact transition. However, in the CRM, high-lying
ns or
nd levels (resonant levels
and non-resonant levels
) are considered in addition to the excitation process of the corona model. In addition to the excitation process, as radiation and transition processes are added, spontaneous radiation from
np levels to resonance levels (
) and metastable levels, cascade transitions between high-lying levels and
np levels, and resonance radiation from high-lying levels to the ground state are considered. However, because it is difficult to consider all responses, only the responses when the np level is
are considered to simplify the formula. At
np level with
, electric dipole transitions to an
ns or
nd resonance level with
are possible. However, because transitions at metastable or non-resonant
ns or
nd levels with
are forbidden, the relevant terms can be neglected. As a result, when
,
Q the total excitation rate coefficient is as follows in Equation (6) [
36].
is the sum of
(ground state to np levels) and
(ground state to high-lying ns and nd levels (resonance levels)). The constants
(volume-averaged diffusion-controlled reaction coefficients),
(excitation rate coefficient ratio), and
(activation energy) can be found in
Table 2. The rate equation for the reaction is written as Equation (7) [
36].
is the electron density,
is gas density,
is its total Einstein coefficient,
is the characteristic density of electron impact transition, and
is the population density of species in this state. The plasma emission intensity is expressed as a line ratio in Equation (8) [
36]. The intensity is expressed as
, where
is the branching ratio.
The Paschen 2p level can be used to find the electron temperature. For Ar 2p levels, electron impulse excitation and spontaneous emission by high-energy electrons dominate. The formula may not take the electron density into account because it shows a very weak dependence on the electron density. If the characteristic density of the electron impact transition is much greater than the electron density () or if the characteristic densities of the electron impact transitions of the two selected lines are similar (), the term of the electron density can be eliminated and the electron temperature can be expressed as shown in Equation (9). We decided to apply the wavelength of 2p1, 2p5 level () of the Ar 2p level emission line, which is the strongest emission line to Ar plasma, to the model. In the case of electron density, high-lying lines of 3p, 4p, and 5p are used at higher levels with less dependence on electron temperature. The terms related to the electron temperature can be eliminated by using a similar level of activation energy () and excitation rate coefficient ratio (). Alternatively, the electron density can be calculated by substituting the calculated electron temperature into Equation (8). In this paper, 3p5 was selected and 2p1 was used with a similar activation level. Although the calculated electron temperature and electron density are not exact values, they can explain the changes in the plasma because they reflect the trends of the electron temperature and density.
3. Results and Discussion
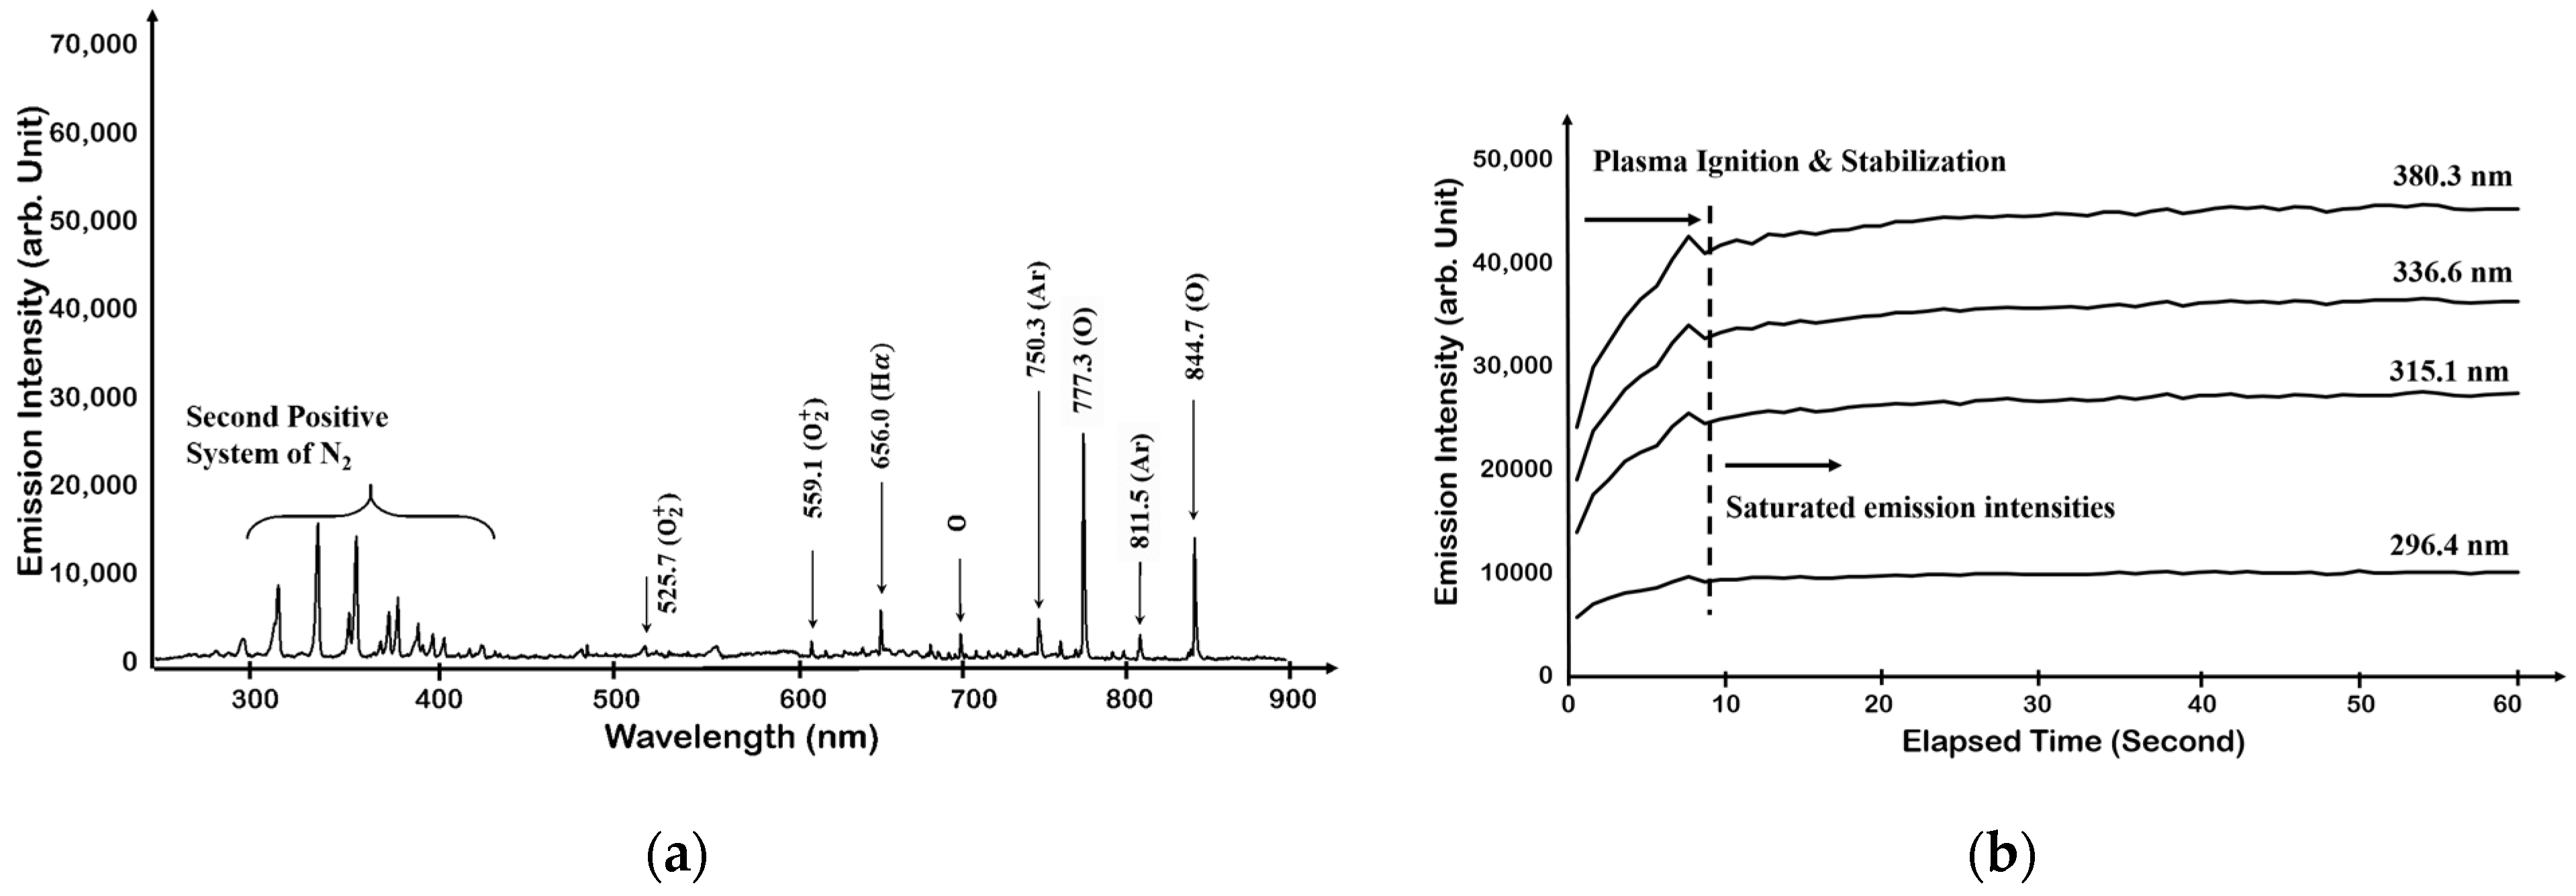
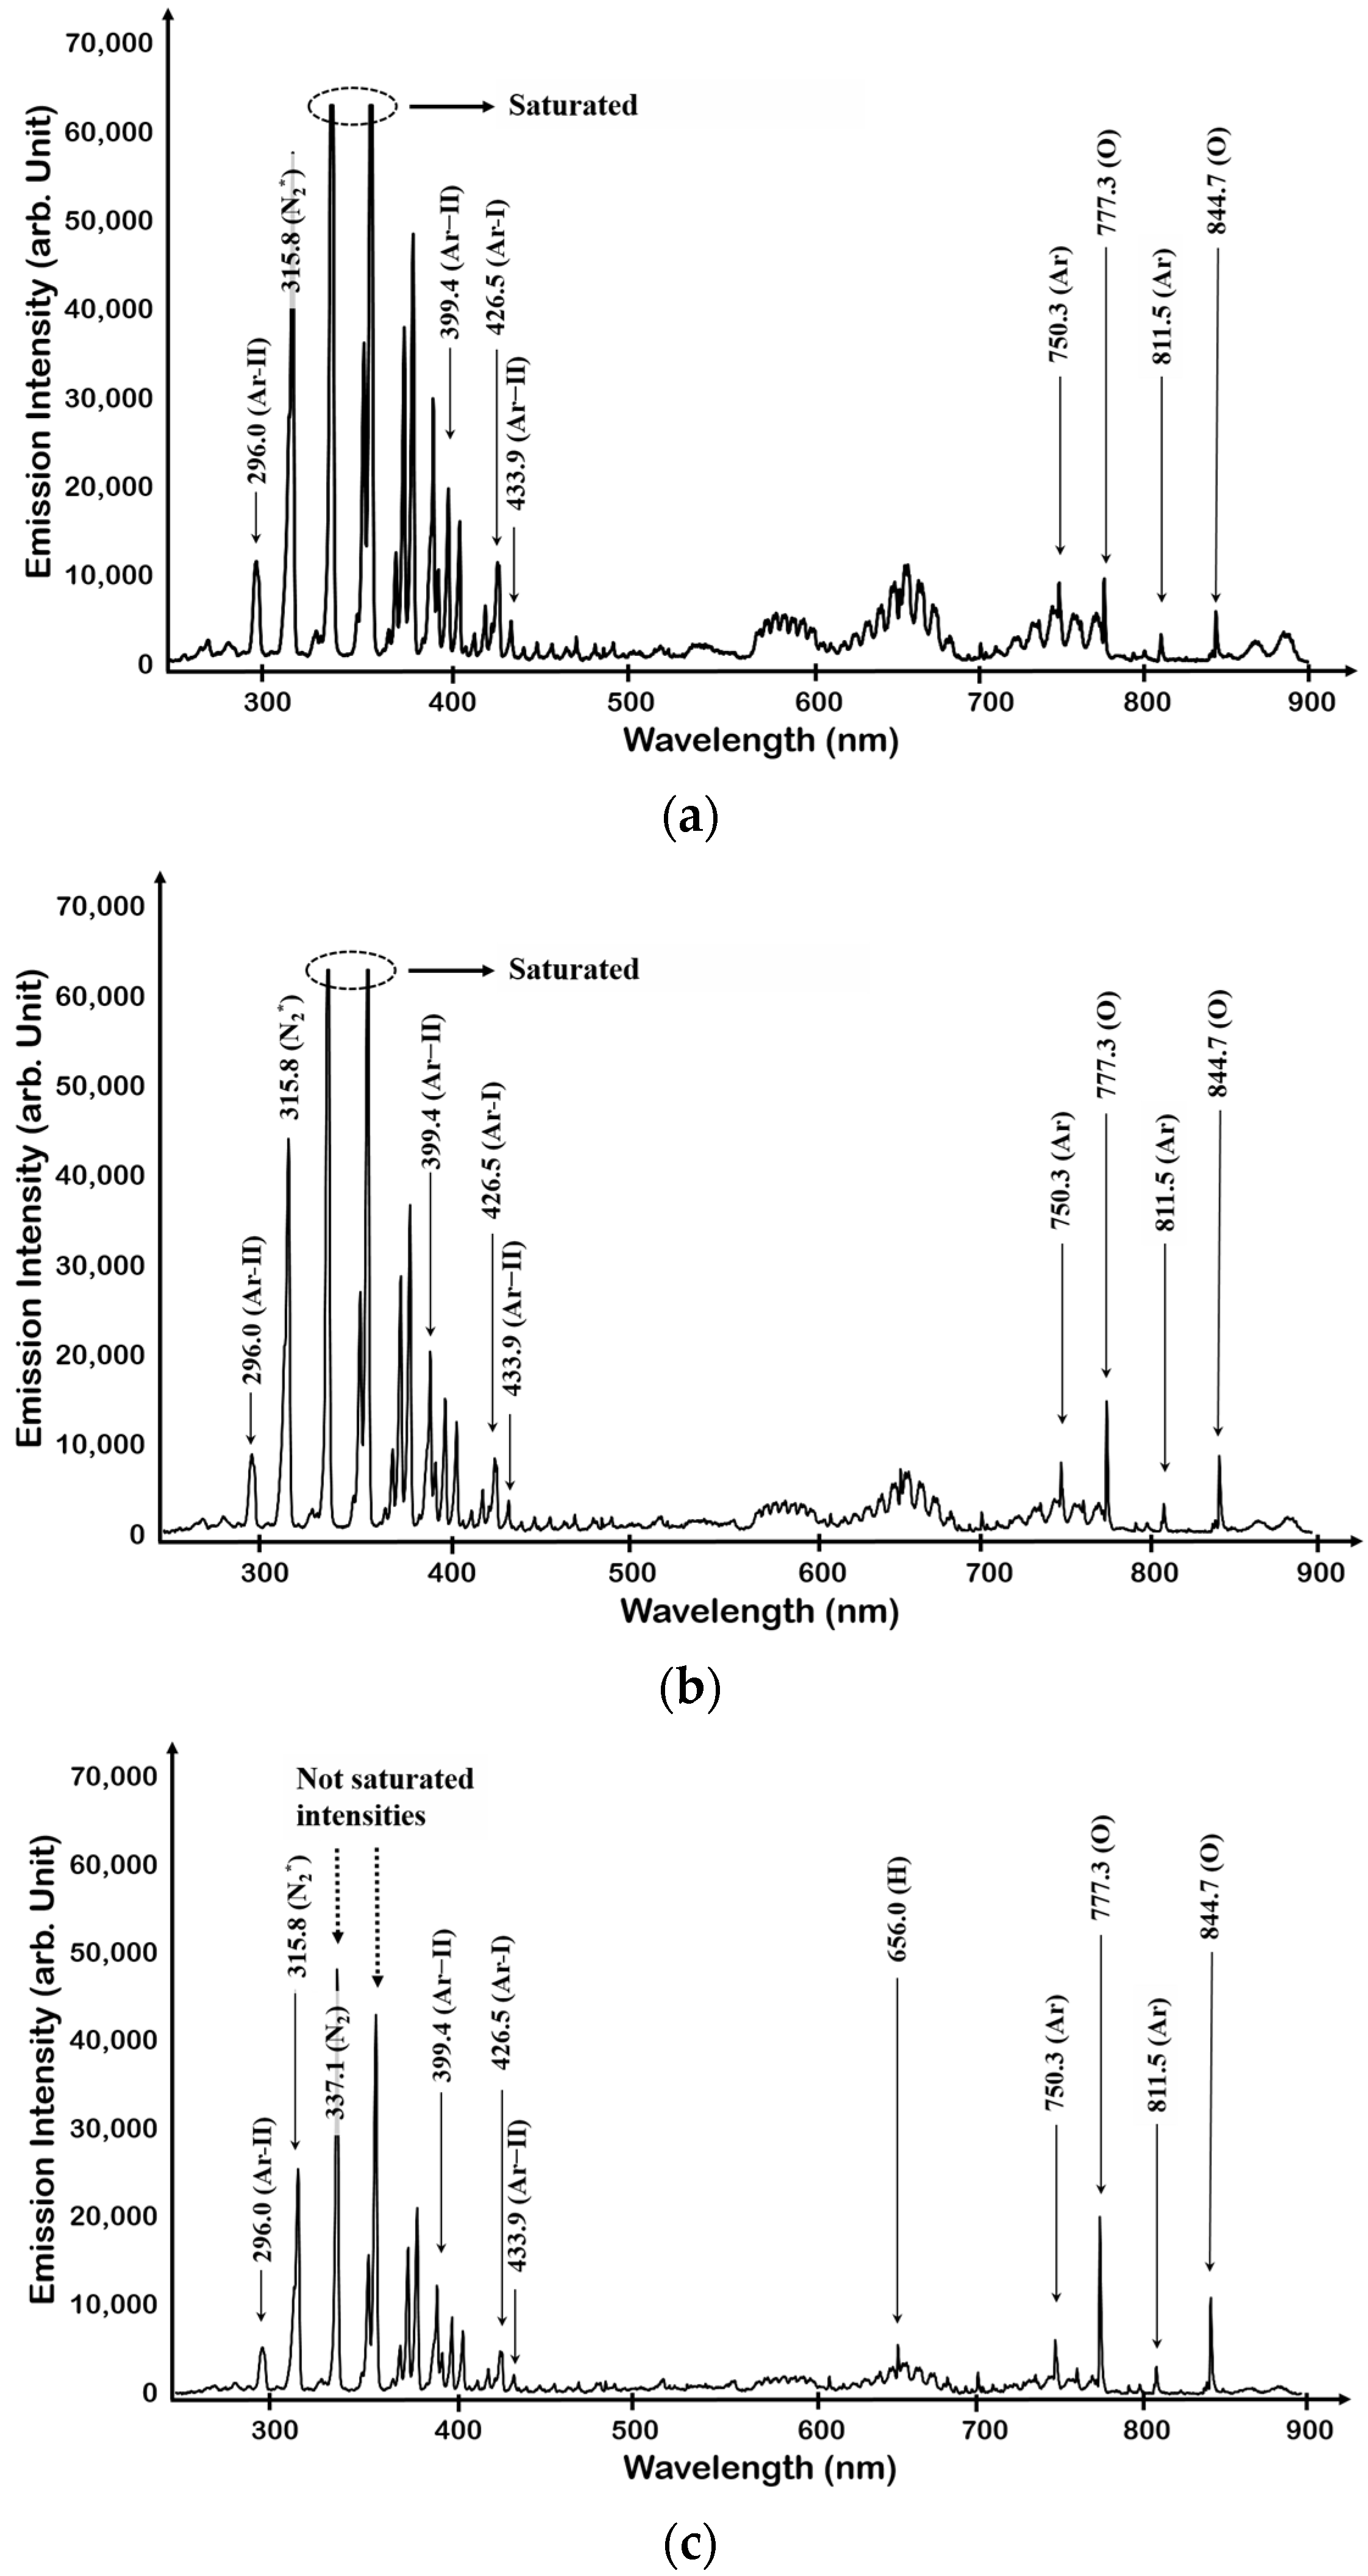
We first performed O
2 plasma monitoring by adding a minute amount, 2 sccm of Ar, to obtain a single oxygen plasma emission spectrum; however, we acquired a similar result from N
2 + O
2 plasma, and the observation of nitrogen species in oxygen plasma can be explained by either the influence of the residual nitrogen species from the previous experiment or the chamber leak, as shown in
Figure 2a. It is ideal to maintain the equipment in a perfect vacuum condition, but it is practically difficult to be free from a small number of chamber leaks in a vacuum system. One might think that the spectroscopic analysis of the proposed plasma observation experiment is not clear because the molecules in the air mostly consist of nitrogen, oxygen, argon, etc. However, the number of airborne molecules is limited without the change in the molecular composition ratio. The optical emission intensity of the N
2 peak observed in
Figure 2b did not increase even after the plasma was saturated. Therefore, we conducted an experiment considering that a small number of airborne molecules inside the chamber induced a small amount of chamber leak.
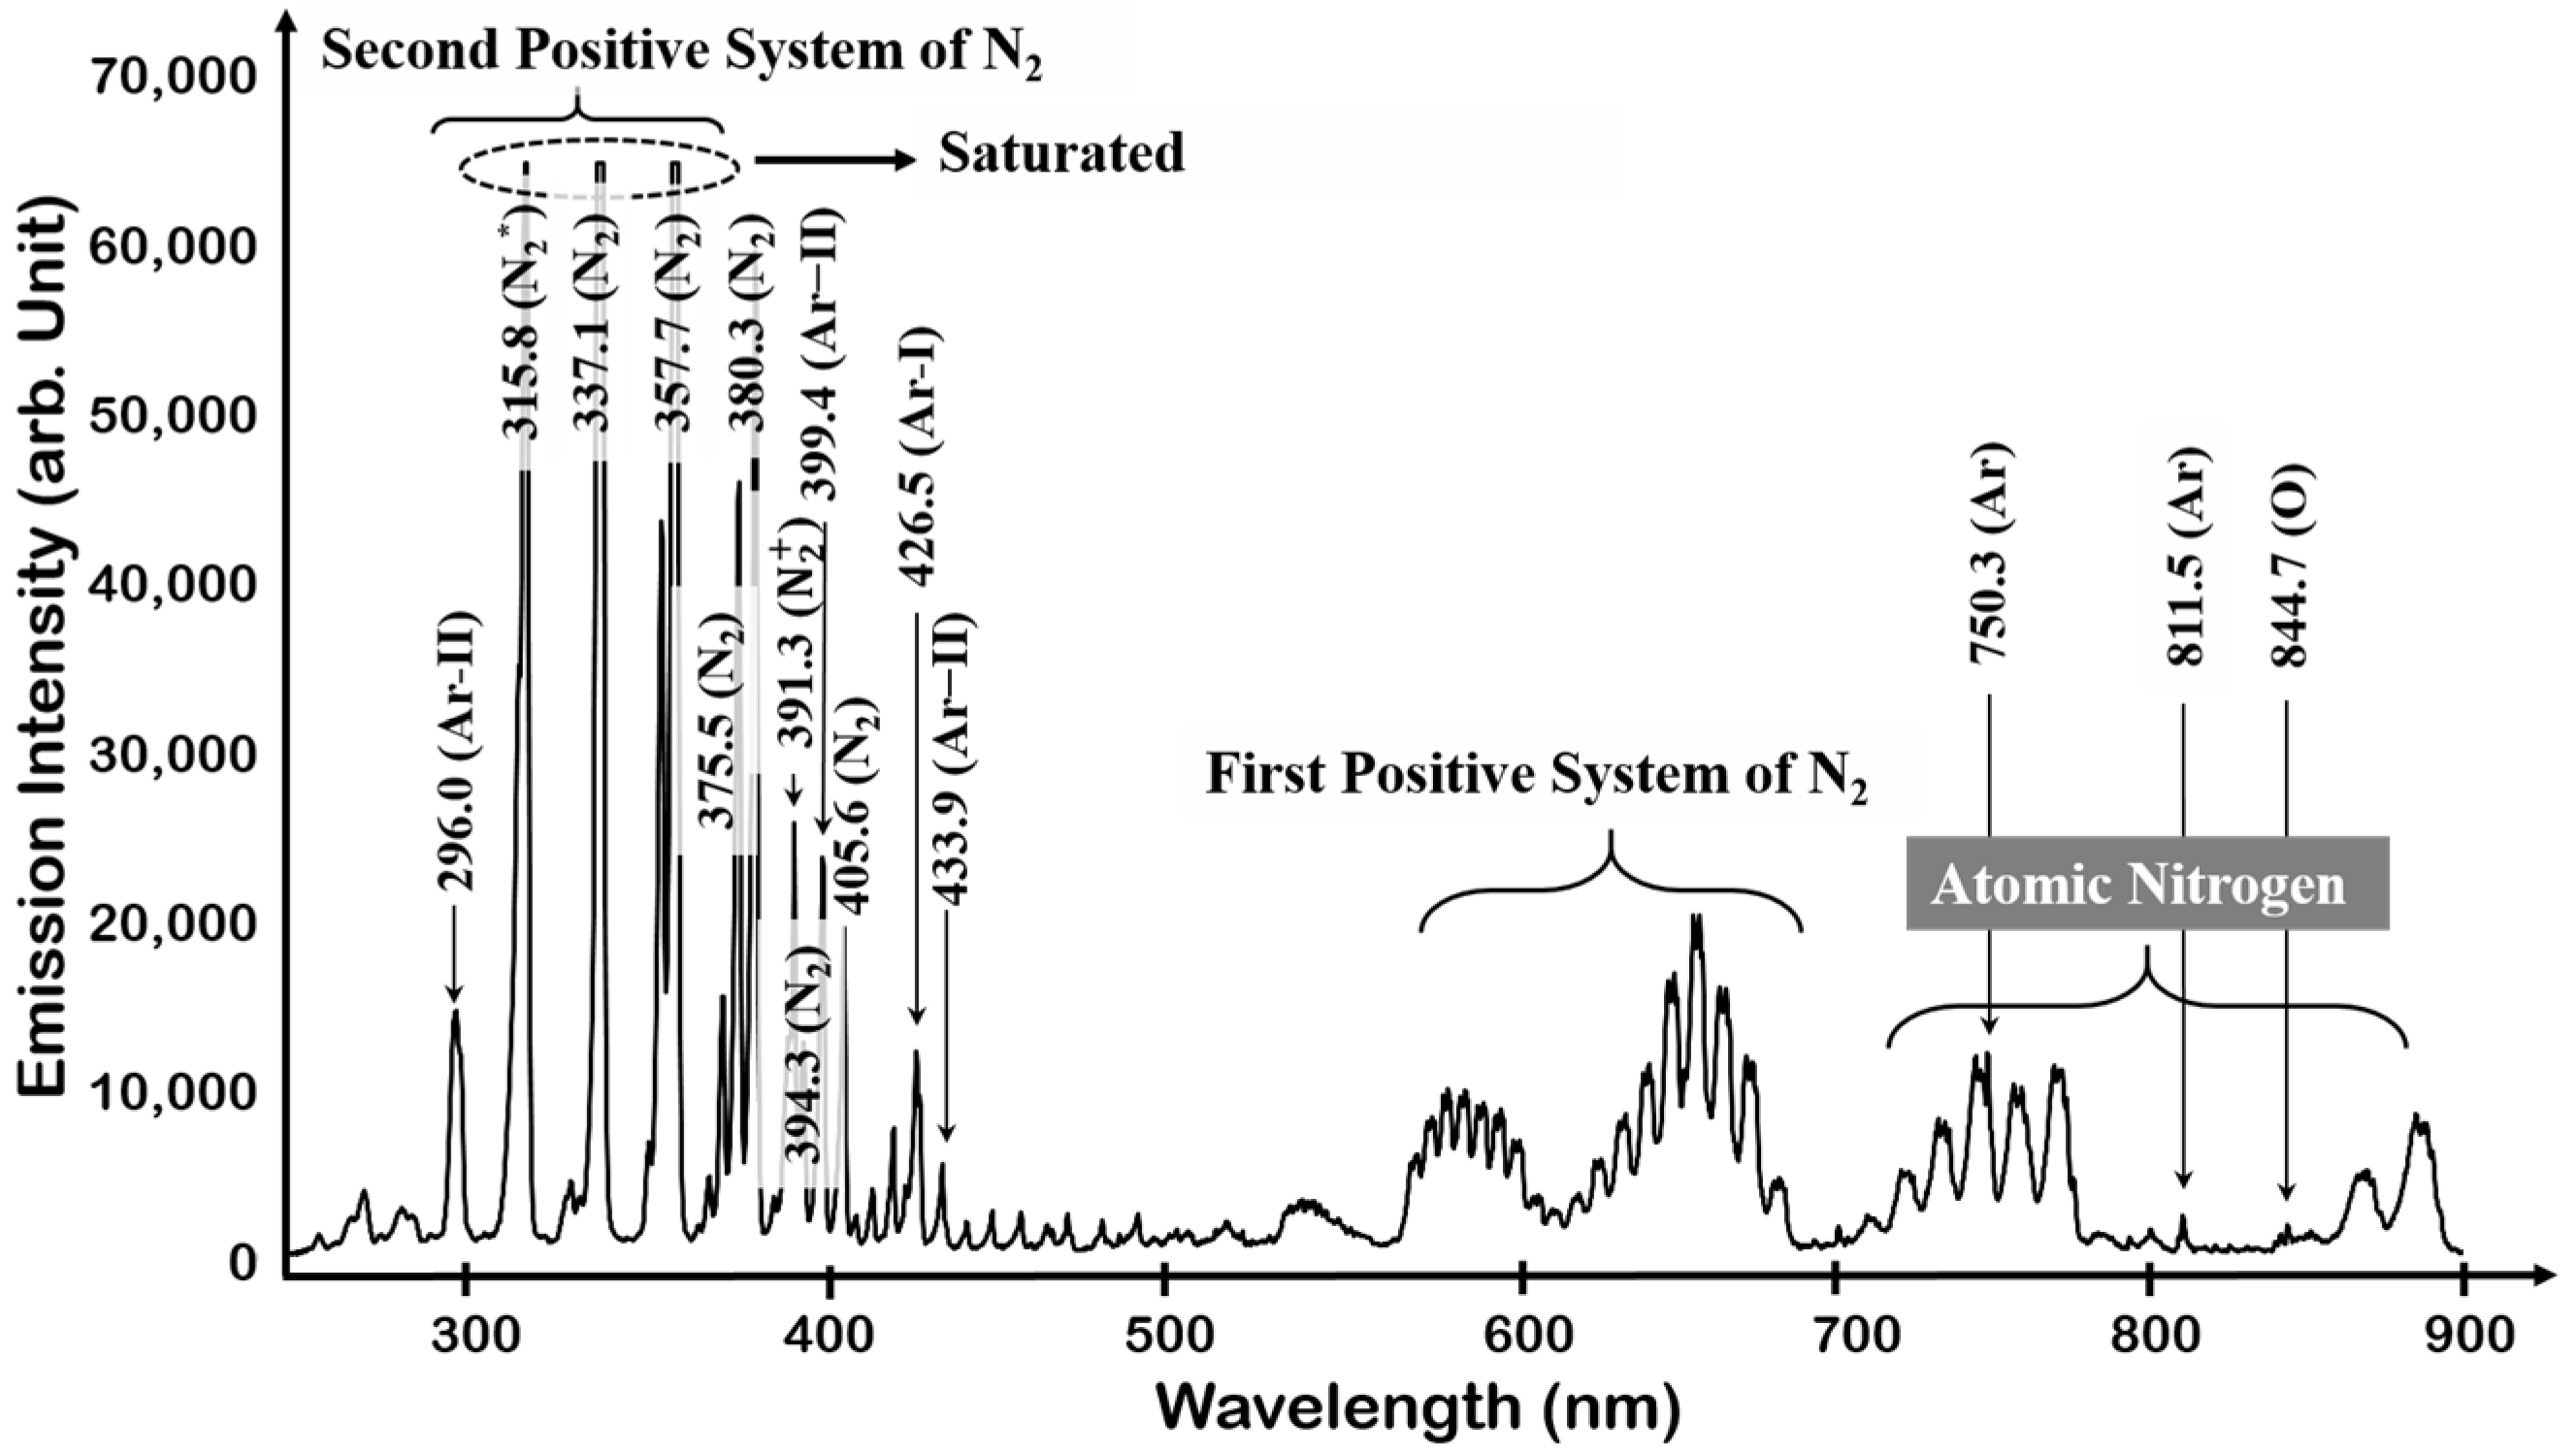
To better understand OES data acquired from the plasma process, the plasma light emissions of N
2 and the N
2 + O
2 mixture were investigated as a reference of the spectrum information. In the case of the N
2 plasma, the light emission from molecules and atoms was observed. The mainly observed 337 to 380 nm band was the N
2 second positive system (C
3Π
u), produced by many excitations and quenching processes (associative excitation, pooling reactions, transfer of energy between collisional partners, and penning excitation), such as electron impact excitation in the molecular ground state (
) and the first metastable state (
) [
37]. The emission of
negative system (
) at 391.4 nm was also observed [
38,
39]; 700–900 nm is the nitrogen atomic region generated by electron impact dissociation (N
2 + e → 2N + e). The N
2 first positive system (
) emission from 550 to 700 nm was also observed. Light emission by the additional Ar was also confirmed at 750.3 nm. The observed N
2 plasma emission spectrum is shown in
Figure 3.
When N
2 and O
2 are mixed, O
2-related peaks can be observed, as shown in
Figure 4a–c. The second and first positive and first negative systems observed in the N
2 single gas plasma were the same, and atomic 777.3 nm (3
p5P → 3
s5S) and 844.7 nm (3
p5P → 3
s5S) O peaks were observed from O
2. It can be seen that as the amount of O
2 injection increased, the N
2 related peak (318.5 nm, 337.1 nm, 357.7 nm) decreased and the O
2 related peak (777.3 nm, 844.7 nm) increased. A small change in peak intensity was observed, depending on the number of mixed gases, but some peaks were still optically saturated (315.8 nm, 337.1 nm, and 357.7 nm). An increase in the amount of O
2 gas was observed as an increase in the associated radical. However, in order to confirm the change of the actual radical, the Ar photometric method was used. Ar actinometry divided the peaks of radicals to be identified using the 750.4 nm peak.
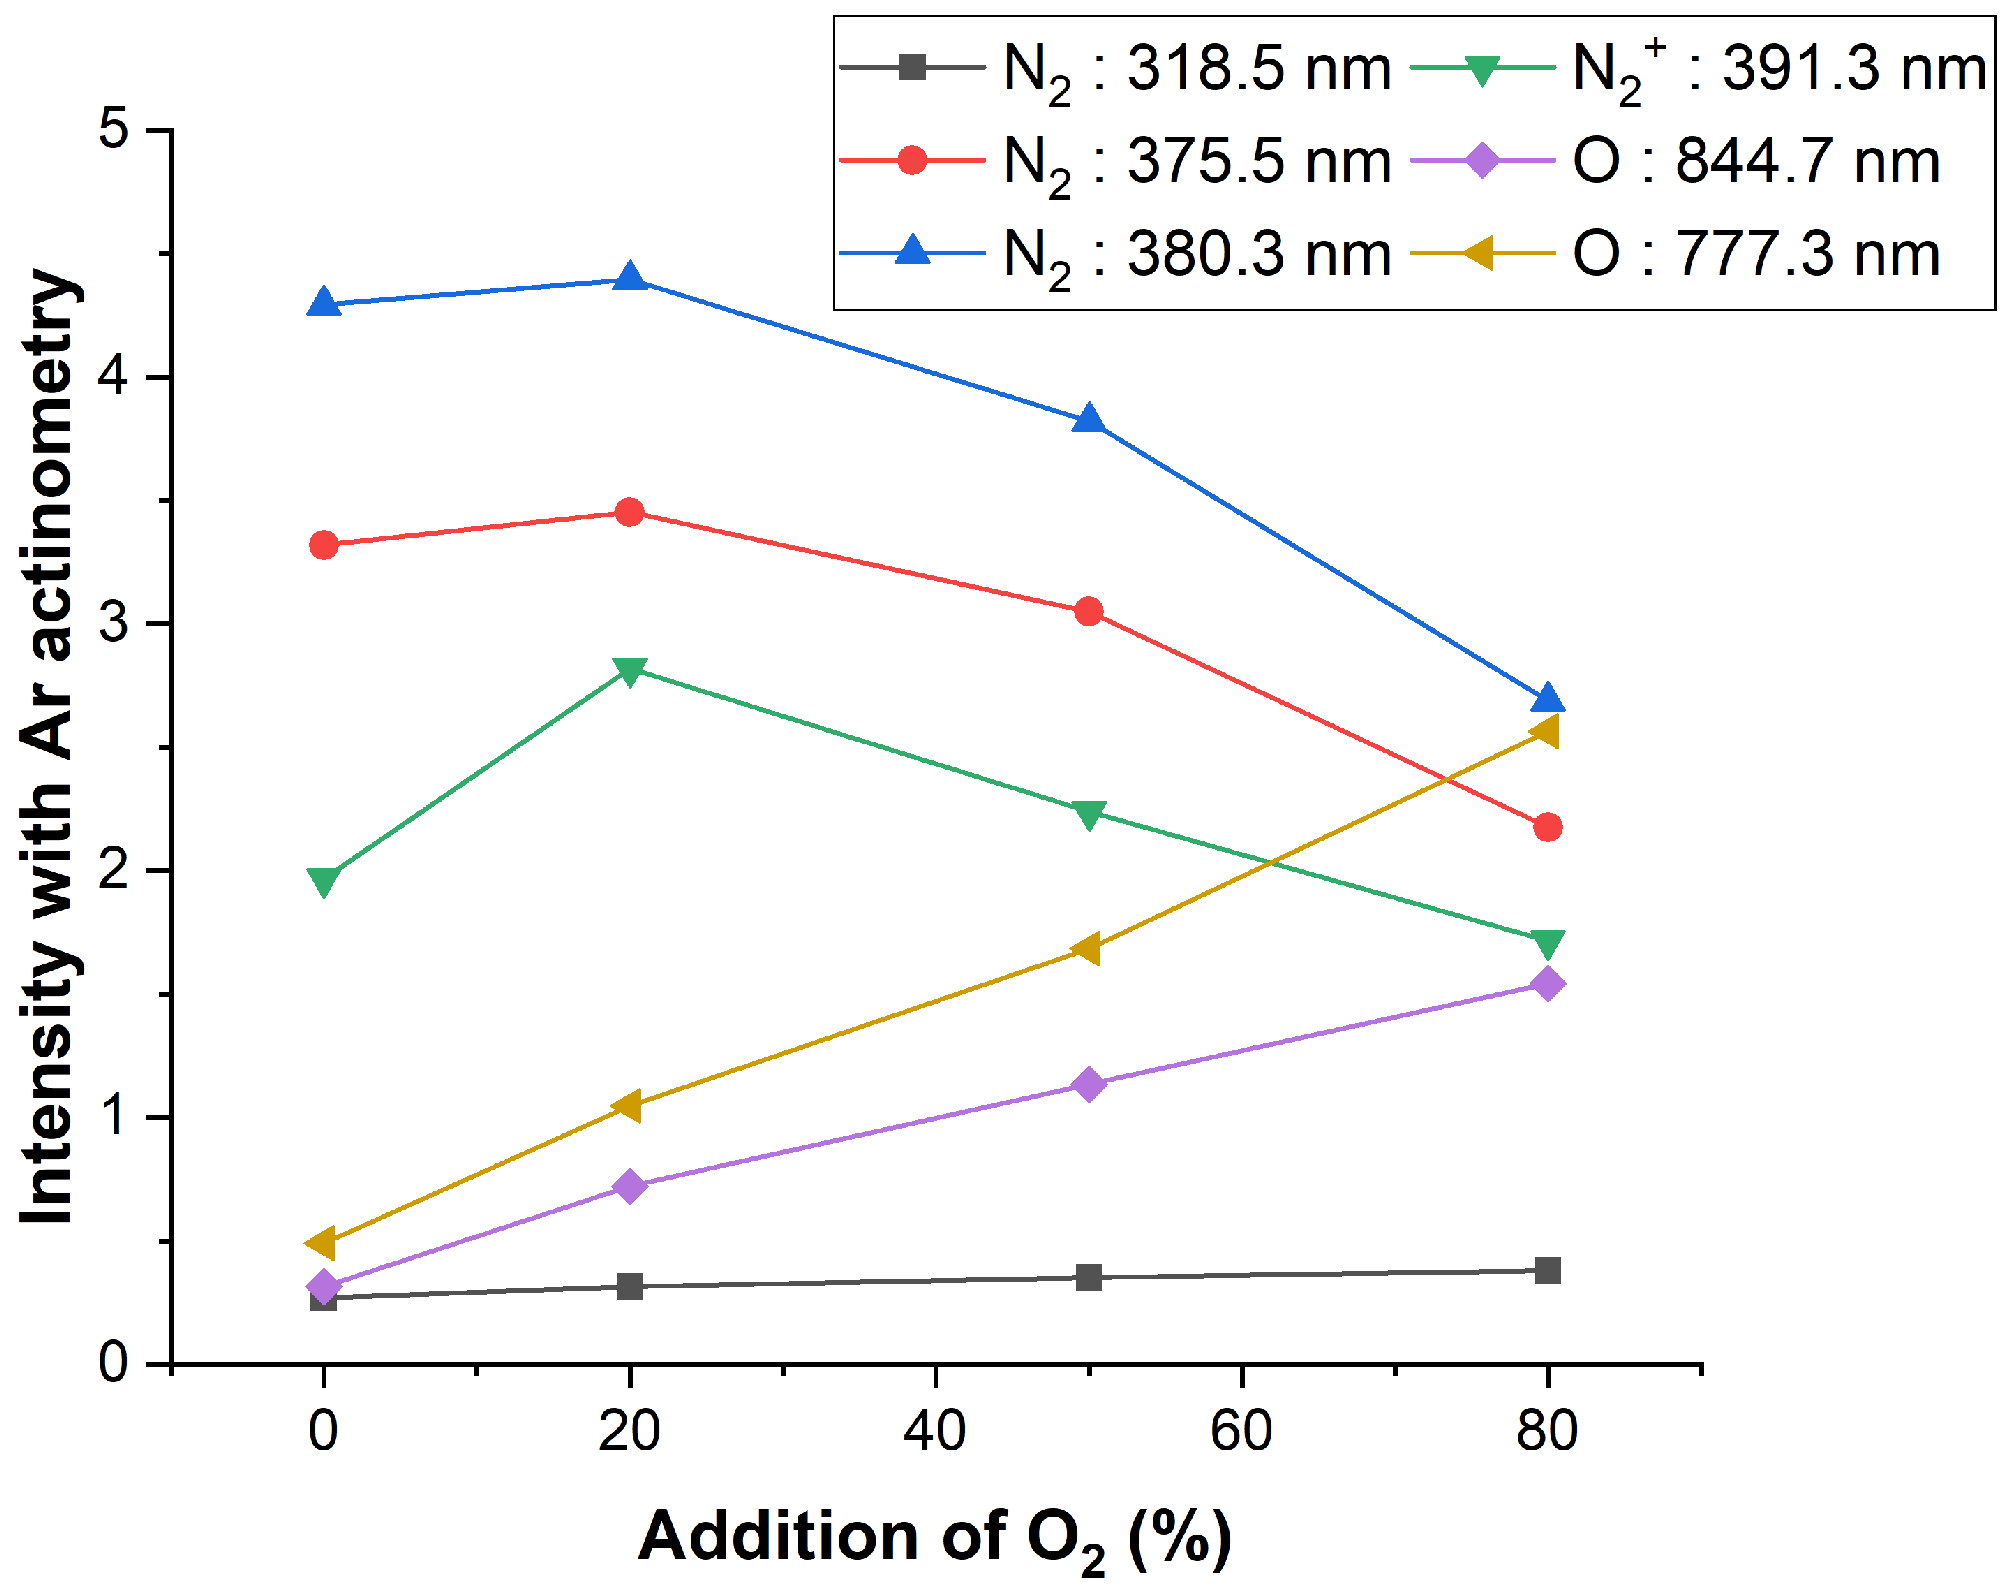
In
Figure 5, the changes in the main peaks of N
2 + O
2 plasma with Ar actinometry are confirmed. The densities of major peaks can be inferred through Ar actinometry. As the mixed O
2 gas flow rate increases, the highly reactive atomic O 777.3 and 844.7 nm peaks intensity increase. Conversely, the intensity of N
2 at the 375.5 and 380.3 nm peaks and
at the 391.3 nm peak was decreased. The wavelength at 337.1 nm was mostly saturated, and the actinometry could not be applied. It was no longer saturated and decreased peak intensity when 80% of O
2 was added. It is assumed that the N
2 excitation decreased because some electrons were used to excite O
2 when the oxygen gas was mixed. For N
2 at 318.5 nm, a slight increase was captured. The O
2 gas increased, the amount of N
2 gas decreased, and the absolute amount of N
2 decreased. However, the increase in only 318.5 nm of the N
2 peak can be seen as an increase in the excitation of the band of the second positive system among various excitation processes of N
2. The excitation energy of the N
2 band of the second positive system (318.5 nm) was about 11–12 eV, and the excitation energy of N
2 band of the first negative system (391.3 nm) was about 18 eV, so a process with low excitation energy occurs easily [
37]. Oxygen is also an electronegative gas, and some electrons are consumed to form
through three-body attachment. This can lead to a decrease in electron density as the oxygen gas flow rate increases.
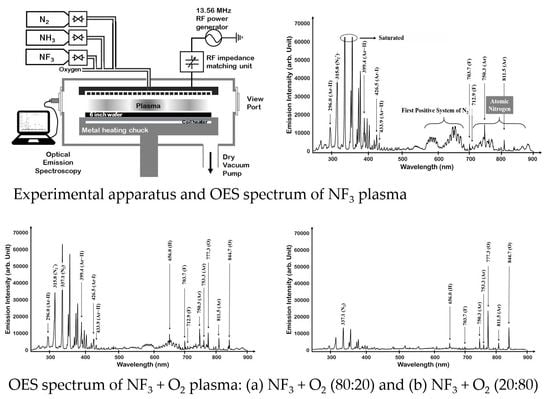
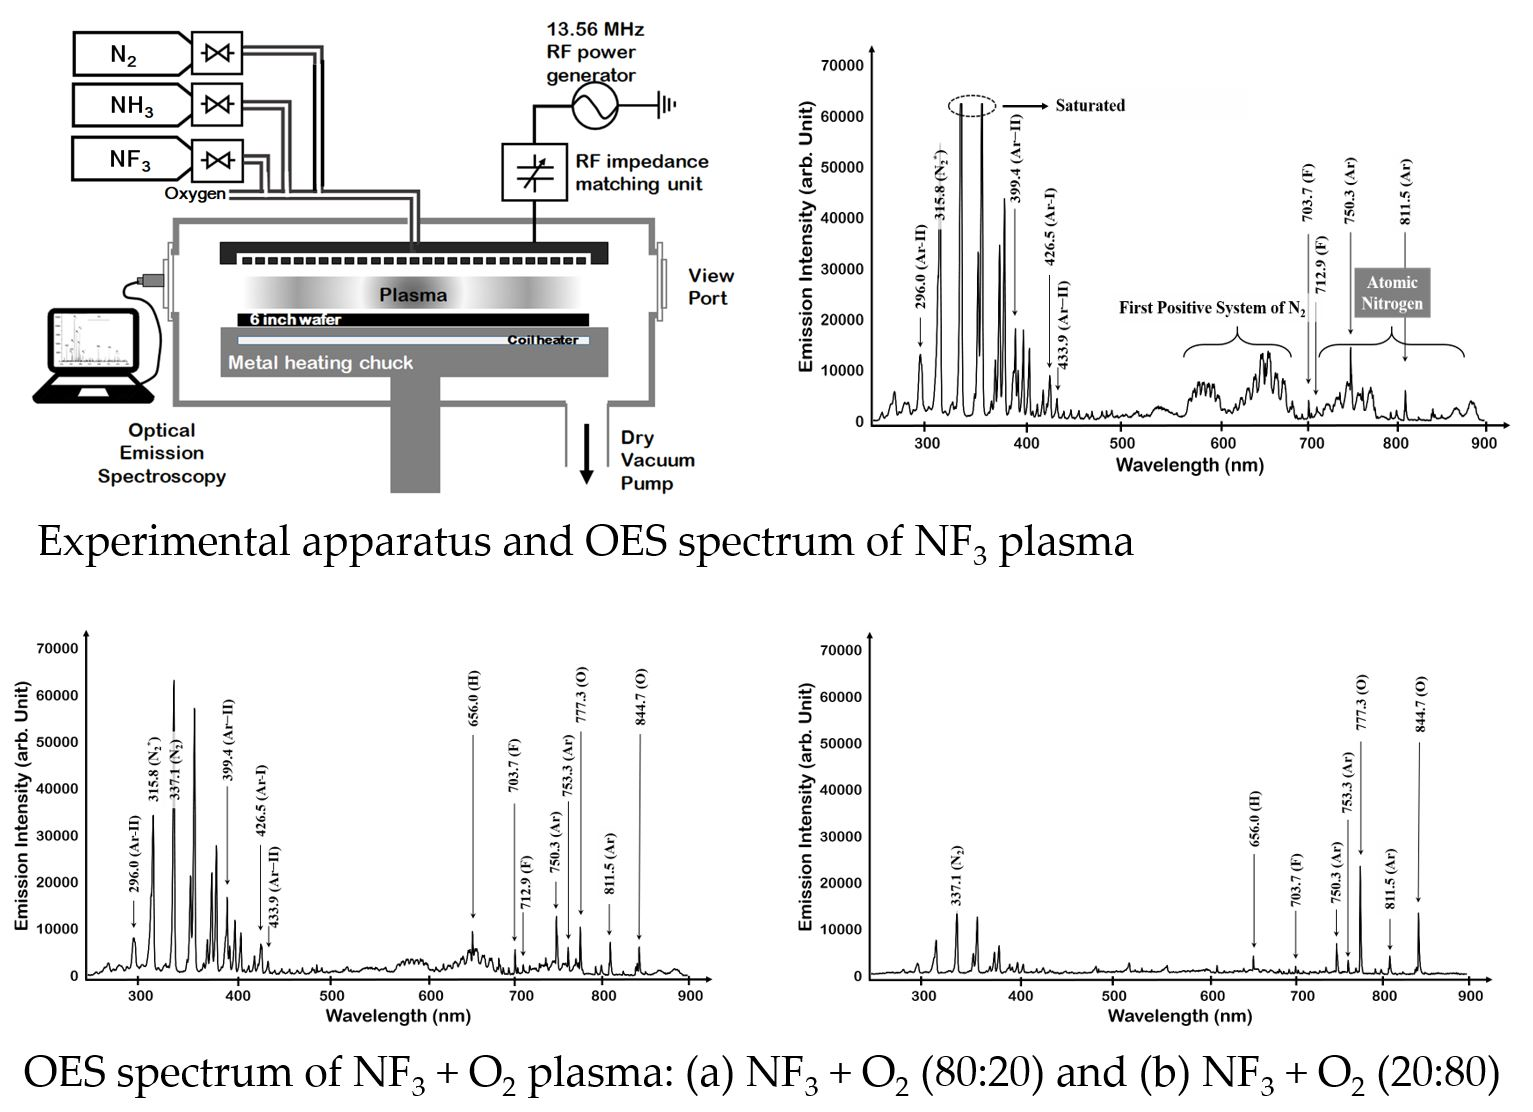
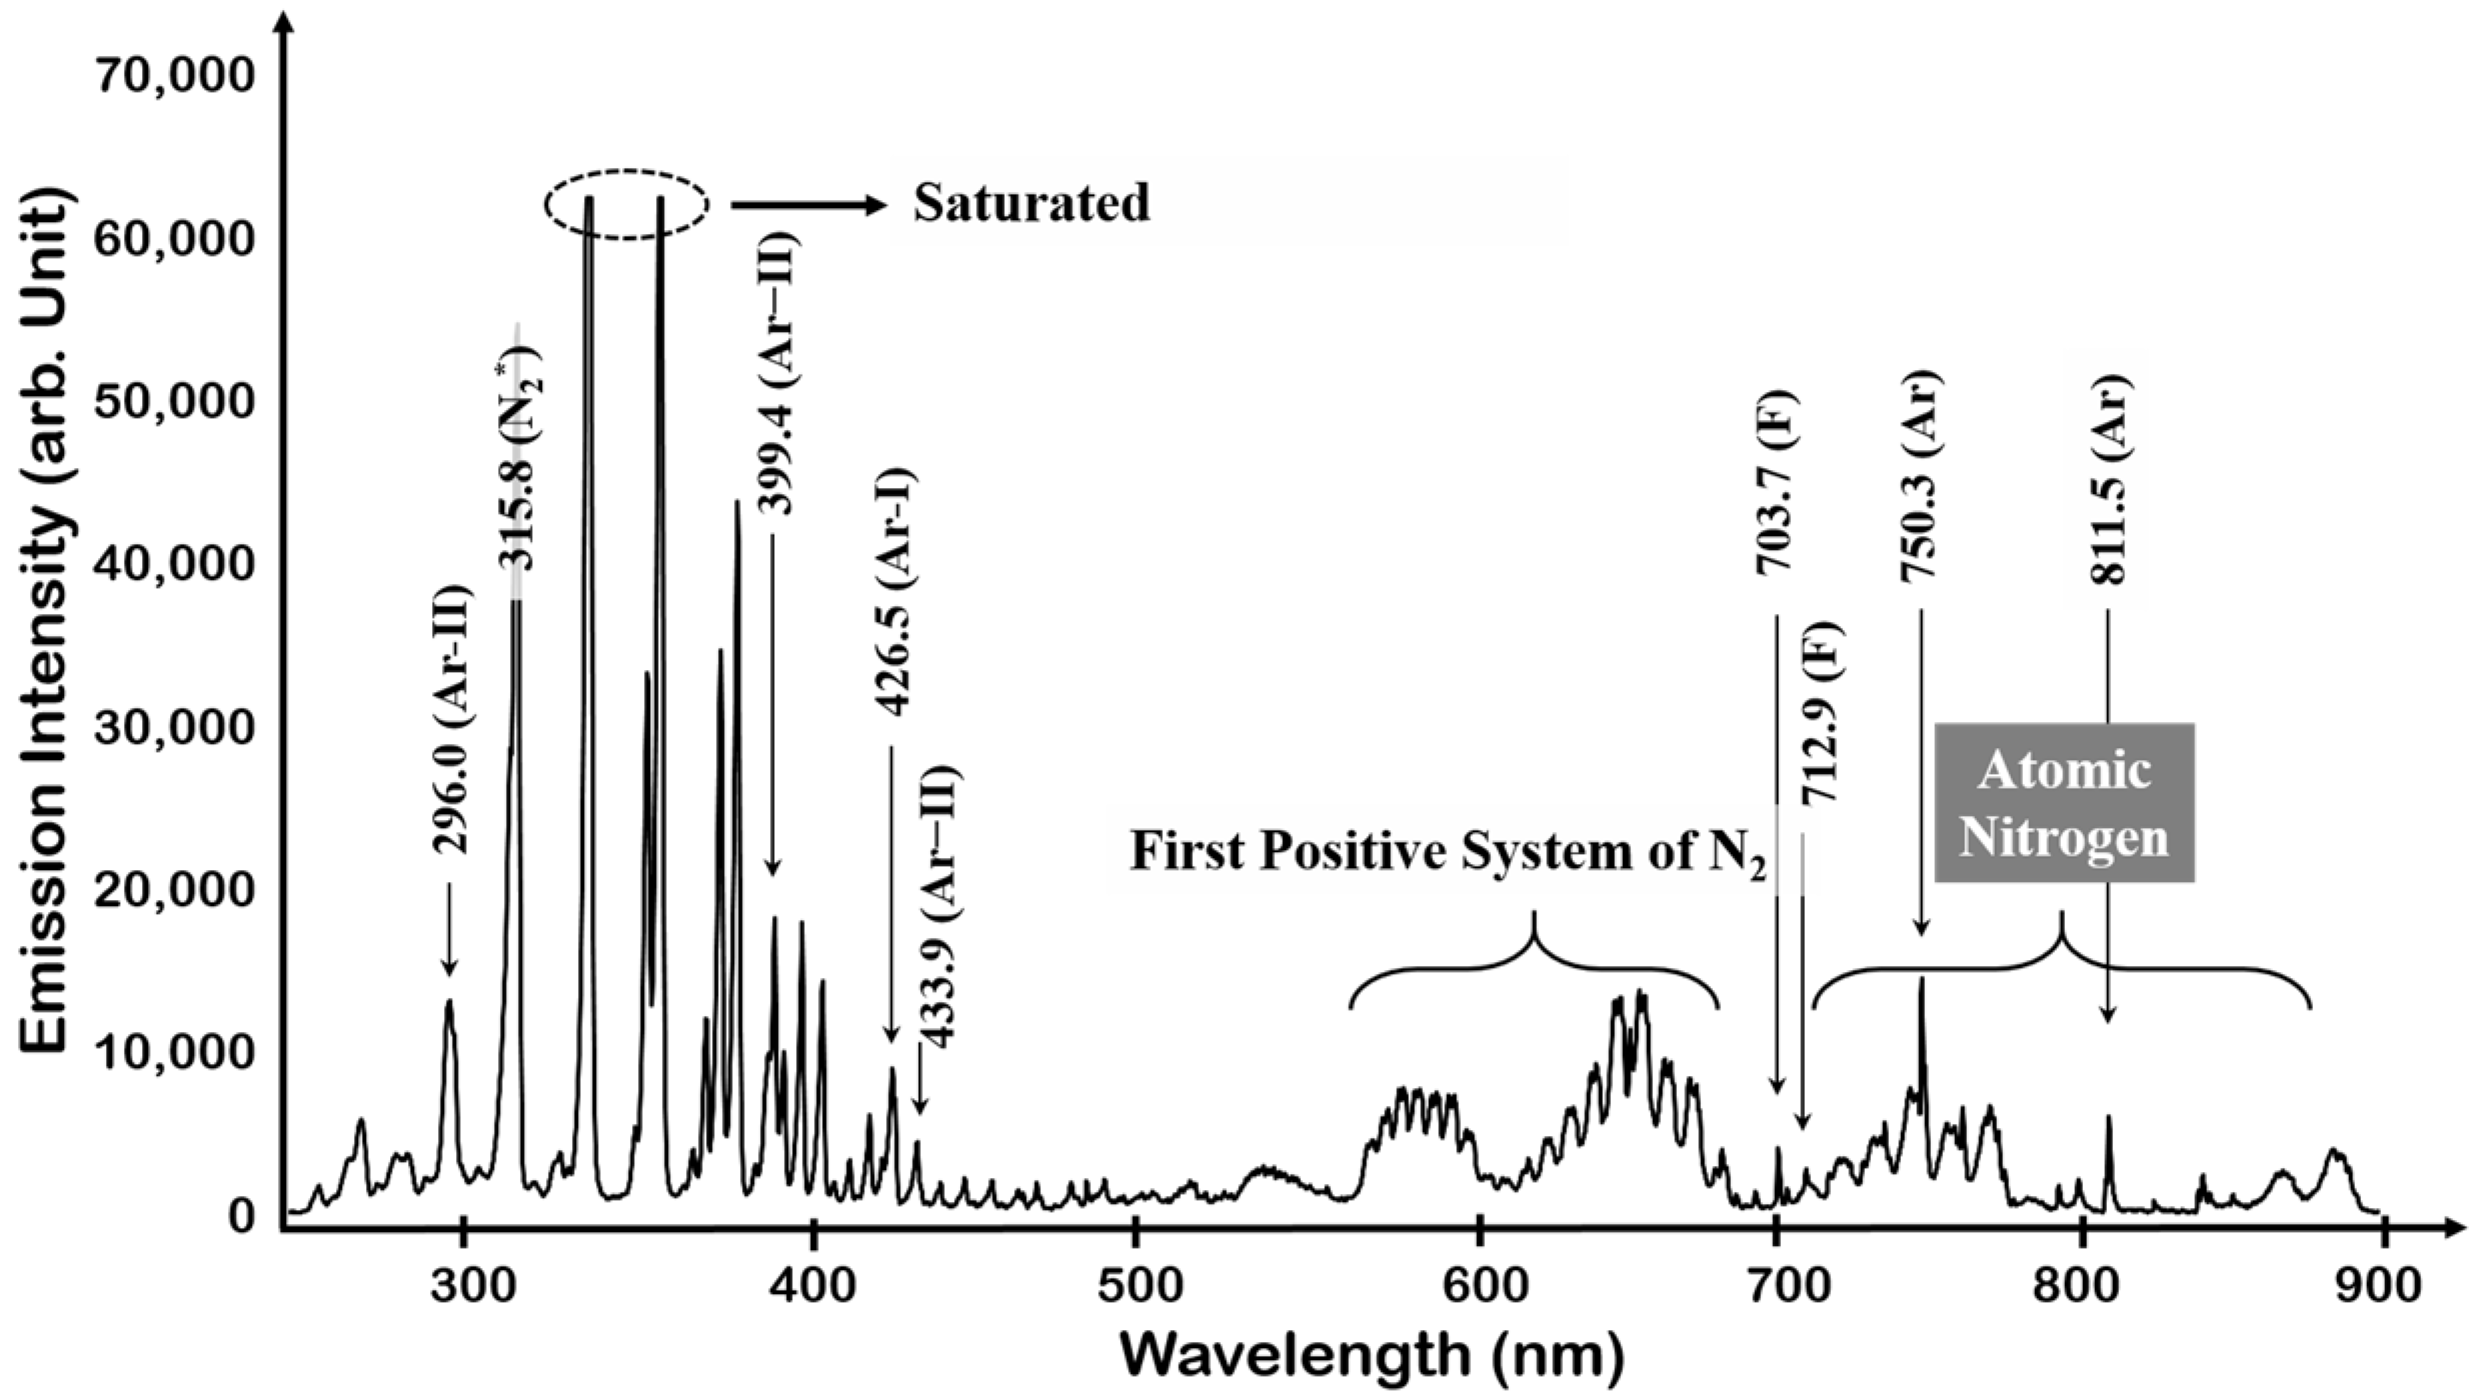
In the case of NF
3 plasma, the spectrum is very similar to that of N
2 plasma. The presence of the N
2 second positive system at 300–400 nm and the N
2 first positive system at the 550–700 nm bands can be confirmed in
Figure 6.
This was also observed in N
2 plasma. The difference from N
2 plasma was the F peak of 703.7 and 712.9 nm and its lower intensity than N
2 plasma. In addition, the intensity of the atomic nitrogen band region decreased, and Ar peaks at 750.4 and 811.5 nm were observed more clearly. The dissociation of NF
3 plasma and the observation of molecular N
2 band as well as atomic nitrogen band is assumed to have been produced by the recombination and reionization of dissociated N atoms as in reaction (10)–(13) [
40,
41].
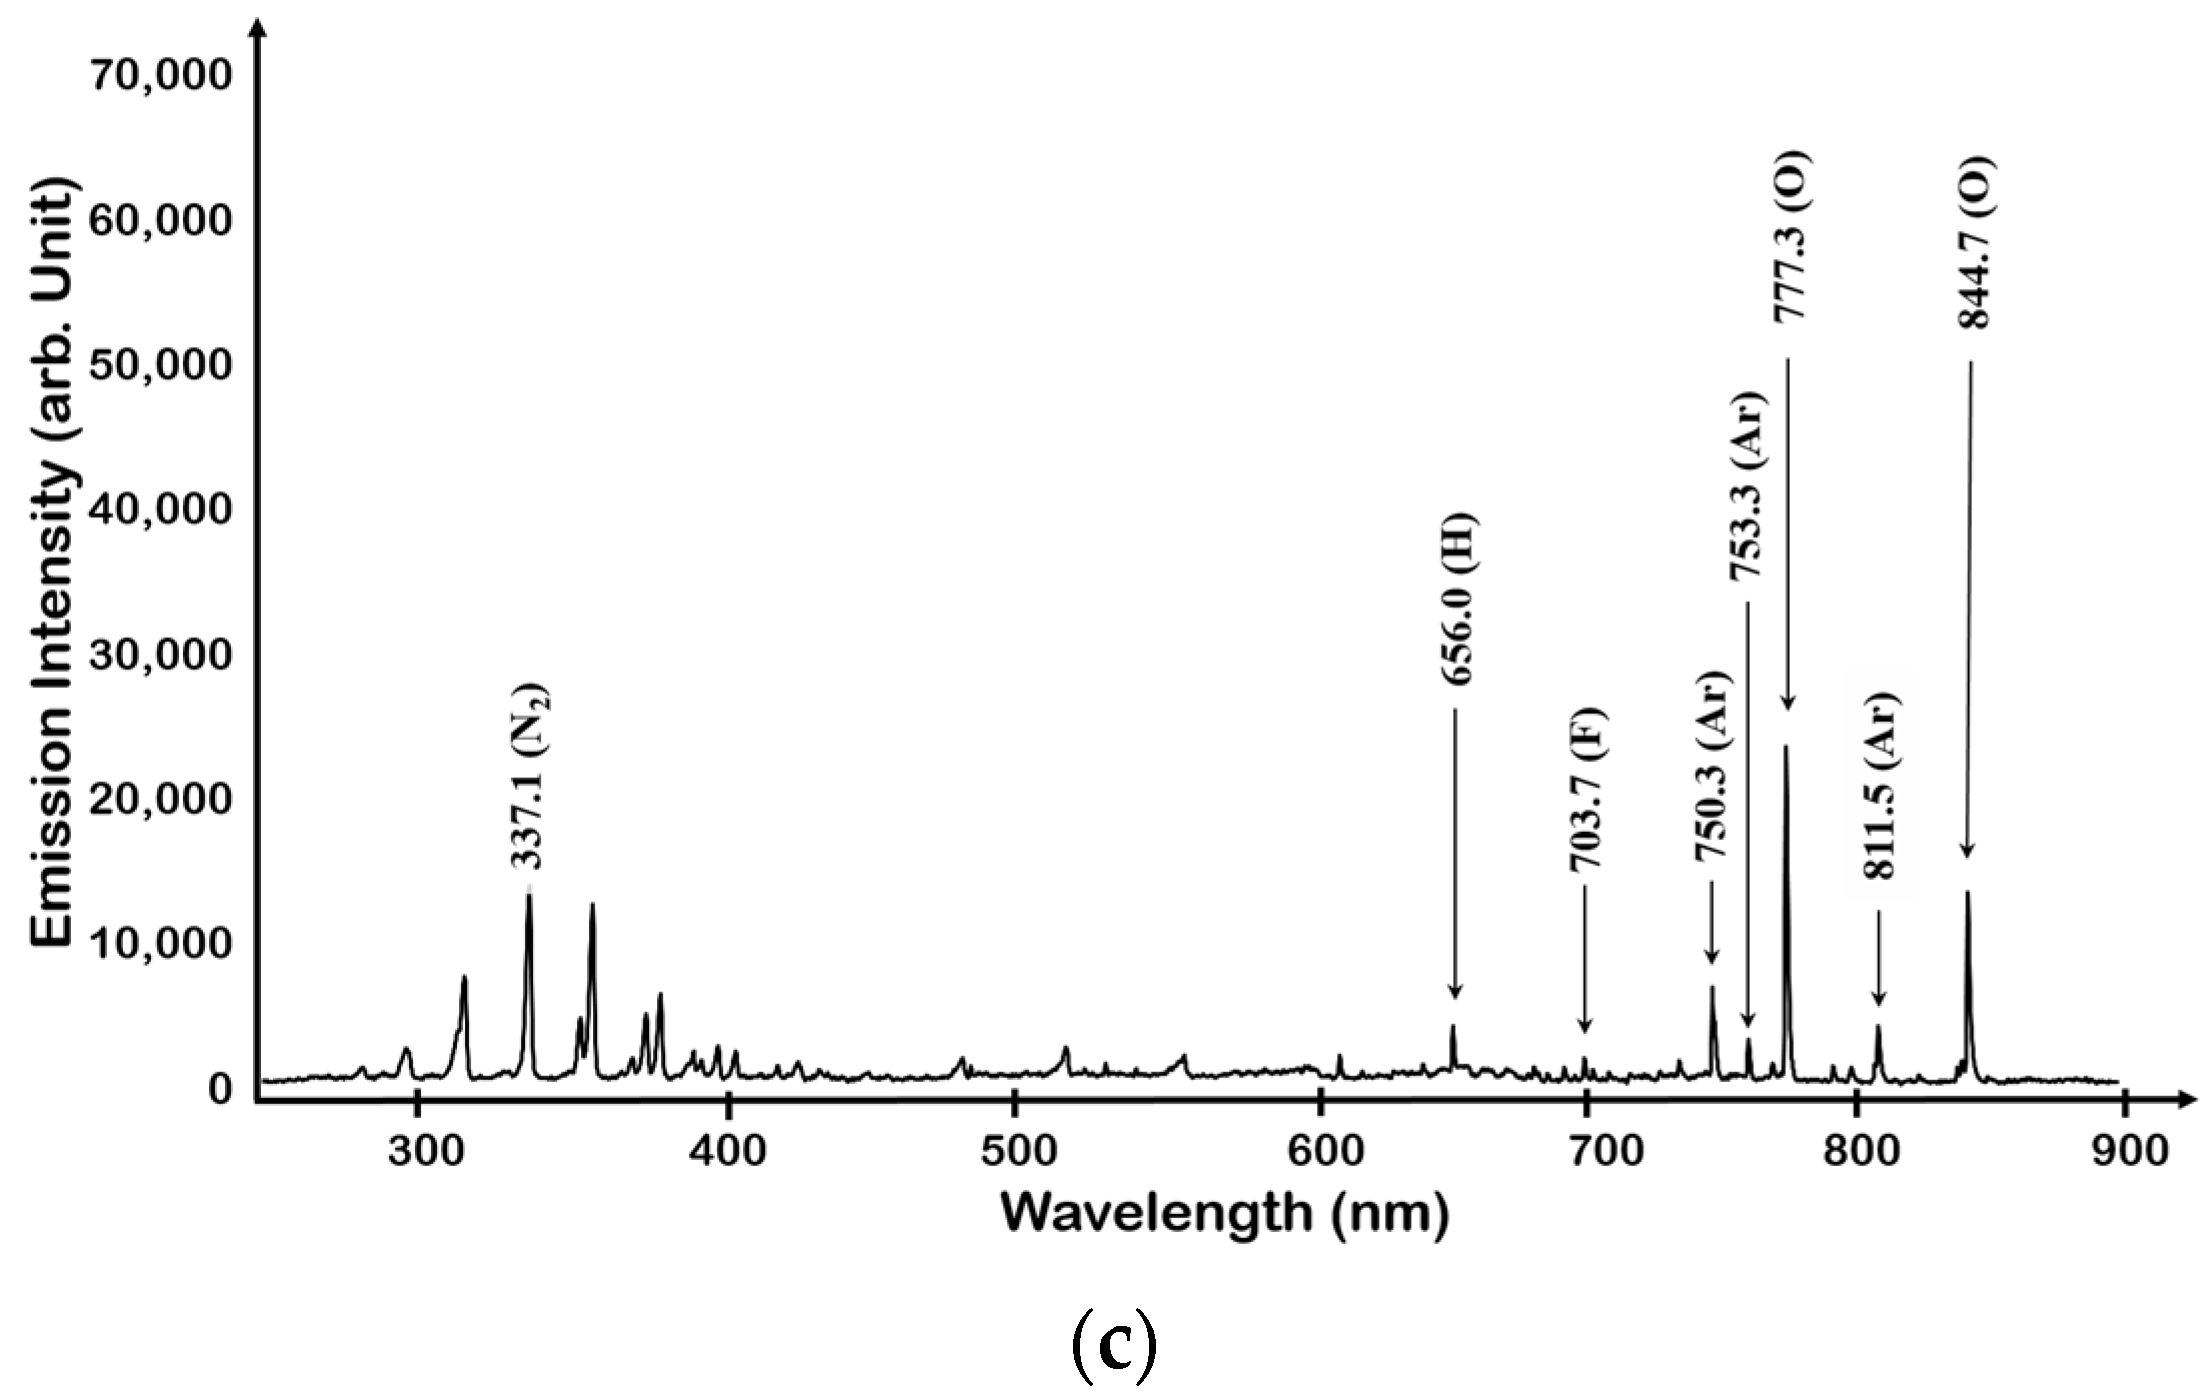
When O
2 was added to NF
3 plasma, O 777.3 and 844.7 nm peaks were observed from O
2 dissociation and the intensity of the previously saturated N
2 second positive system peak was lowered, as shown in
Figure 7. When the mixing amount of O
2 was >80%, the N
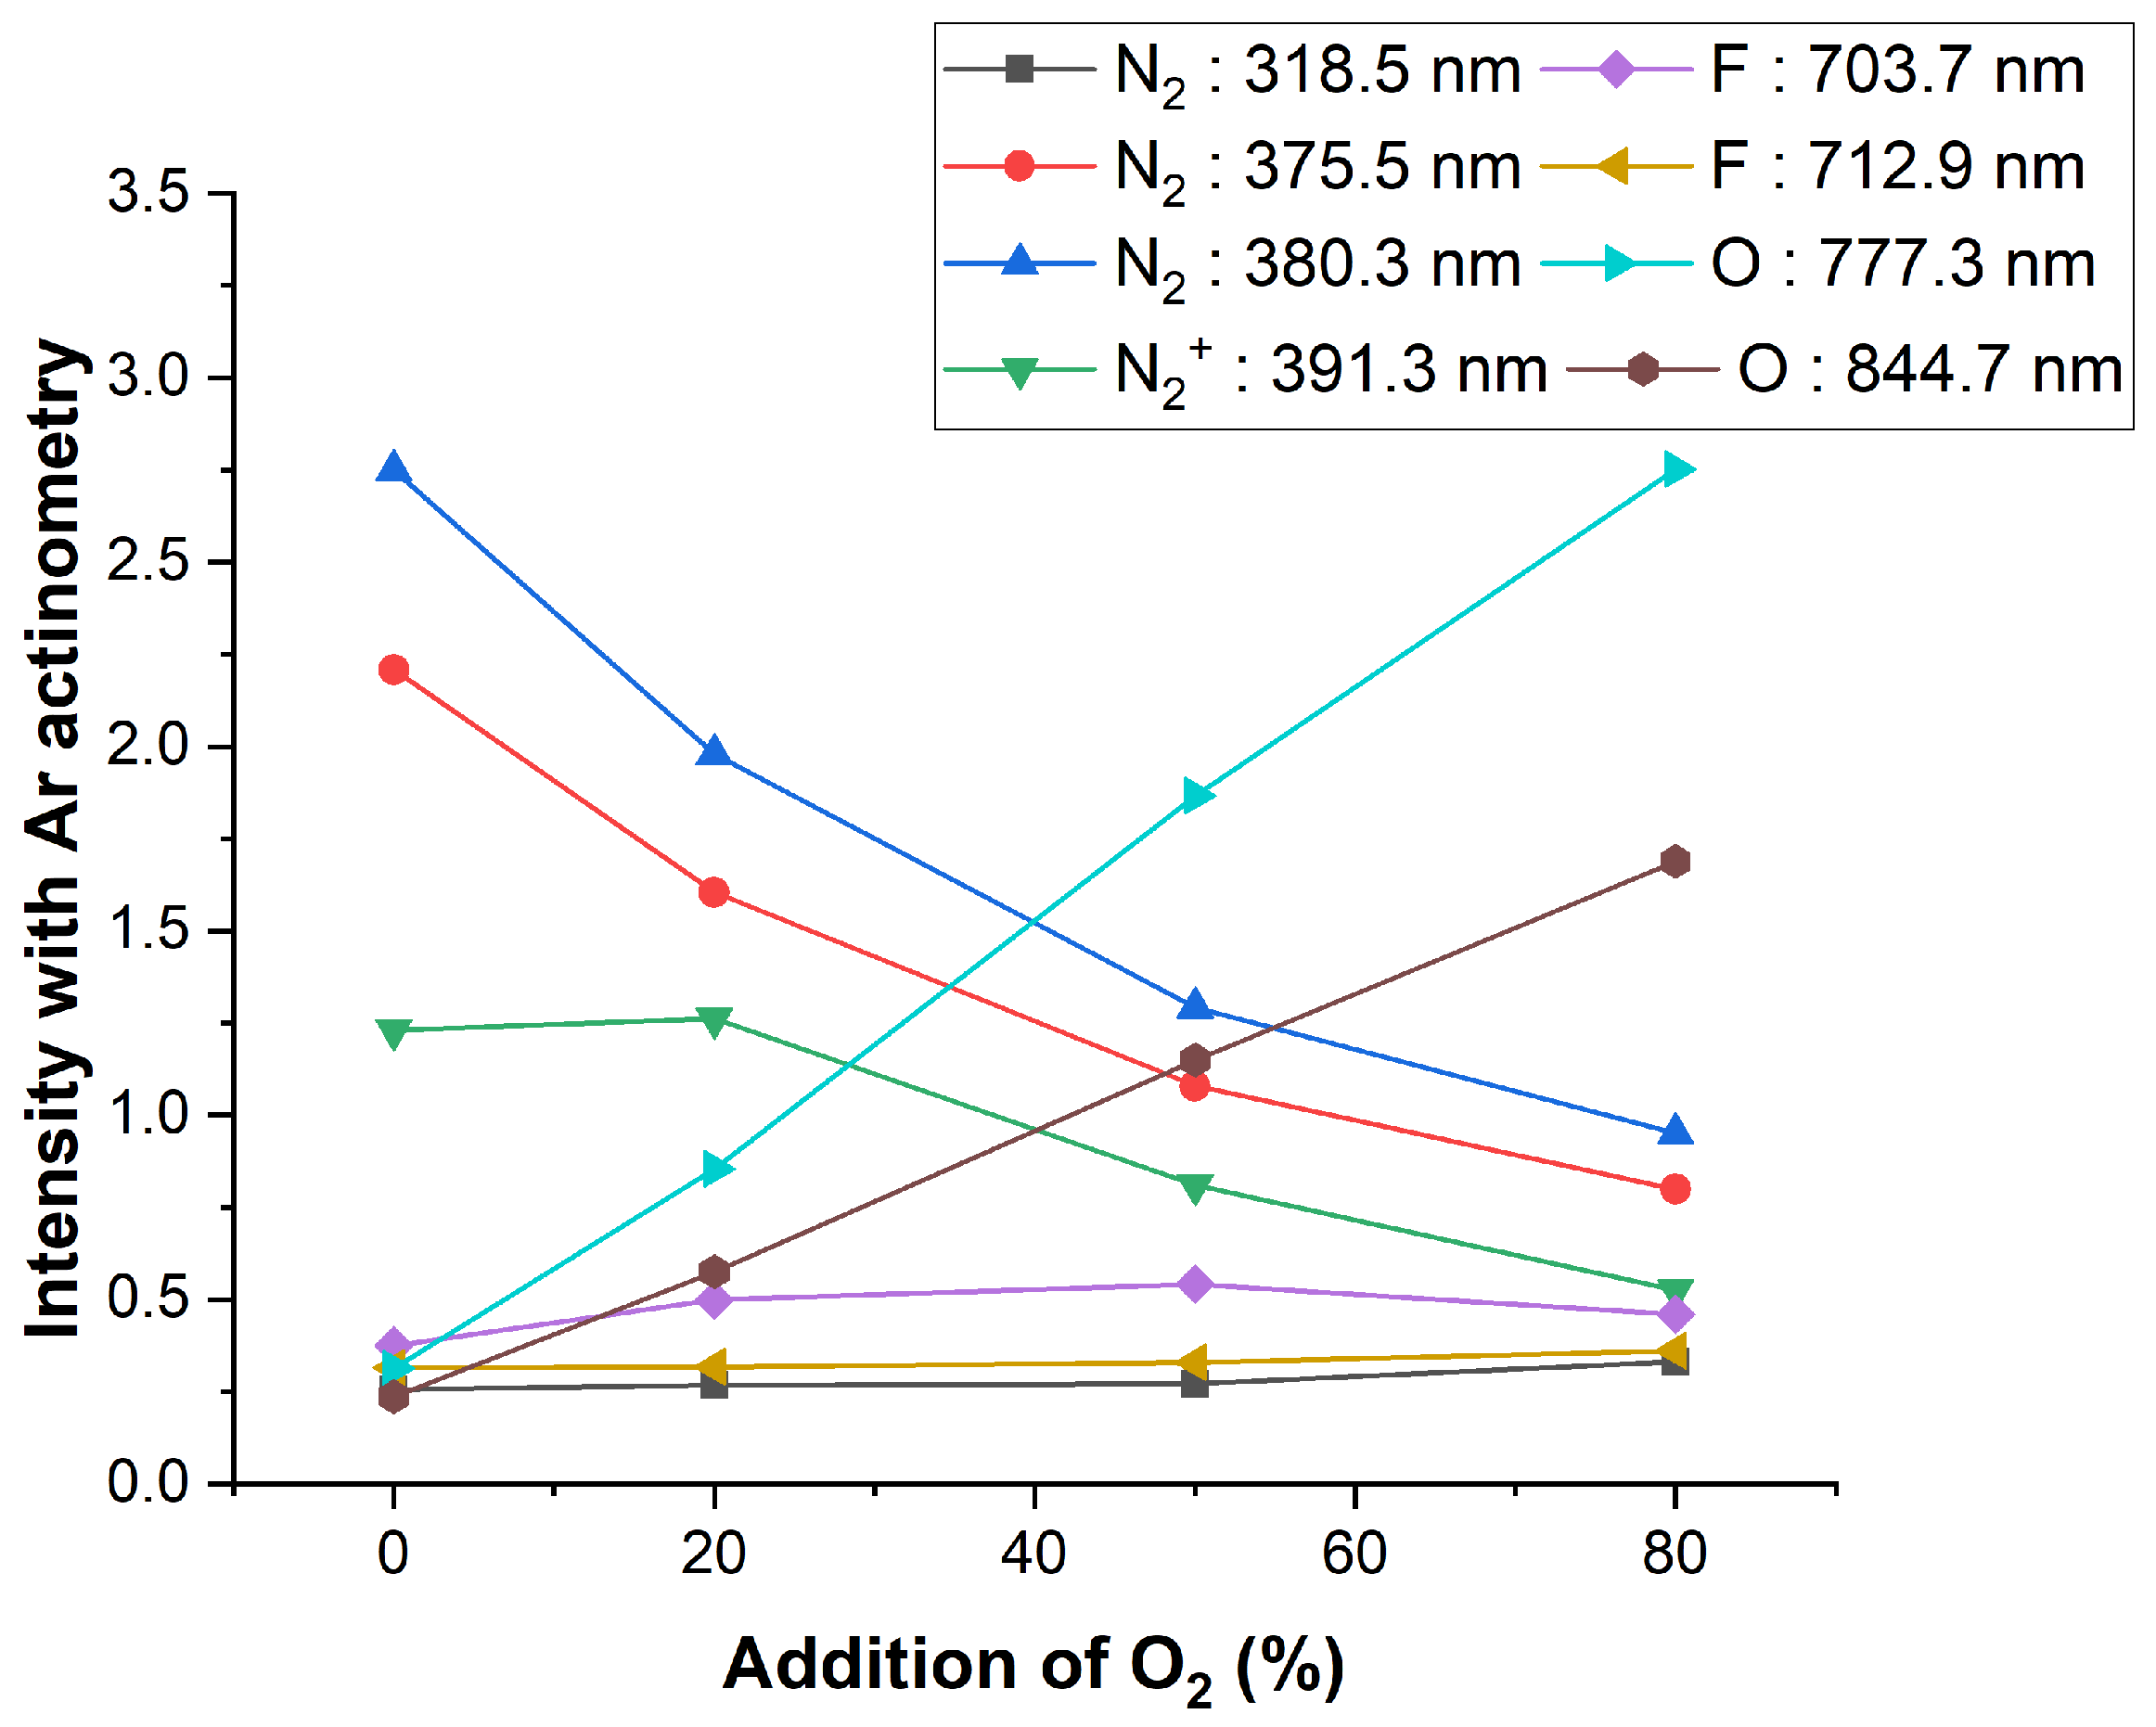
2 and F peaks were greatly reduced and the O peak increased, but the overall light emission sensitivity also was decreased. When the flow rate of O
2 increased in NF
3/O
2 gas mixture while the power and pressure were still maintained, we observed the decreased optical emission intensities of N
2-related peaks via Ar actinometry, as shown in
Figure 8.
As the mixed O
2 gas flow rate increased, the O atom peaks at 777.3 and 844.7 nm were increased, and the N
2 peaks at 375.5 and 380.3 nm and the
peak at 391.3 nm were also decreased. A slight increase was seen at N
2 318.5 nm. As explained with the N
2 +O
2 plasma, this likely occurred because the excitation energy of N
2 318.5 nm was lower than other peaks’ excitation energy. It was also observed that F 703.7 nm increased and then decreased, and F 712.9 nm decreased as O
2 increased. In the case of the F peak, it was caused by various dissociation processes of NF
3. According to reference, NF
3 dissociation starts at 11 eV [
42]. This may increase the probability of occurrence at energy levels similar to that of N
2 318.5 nm.
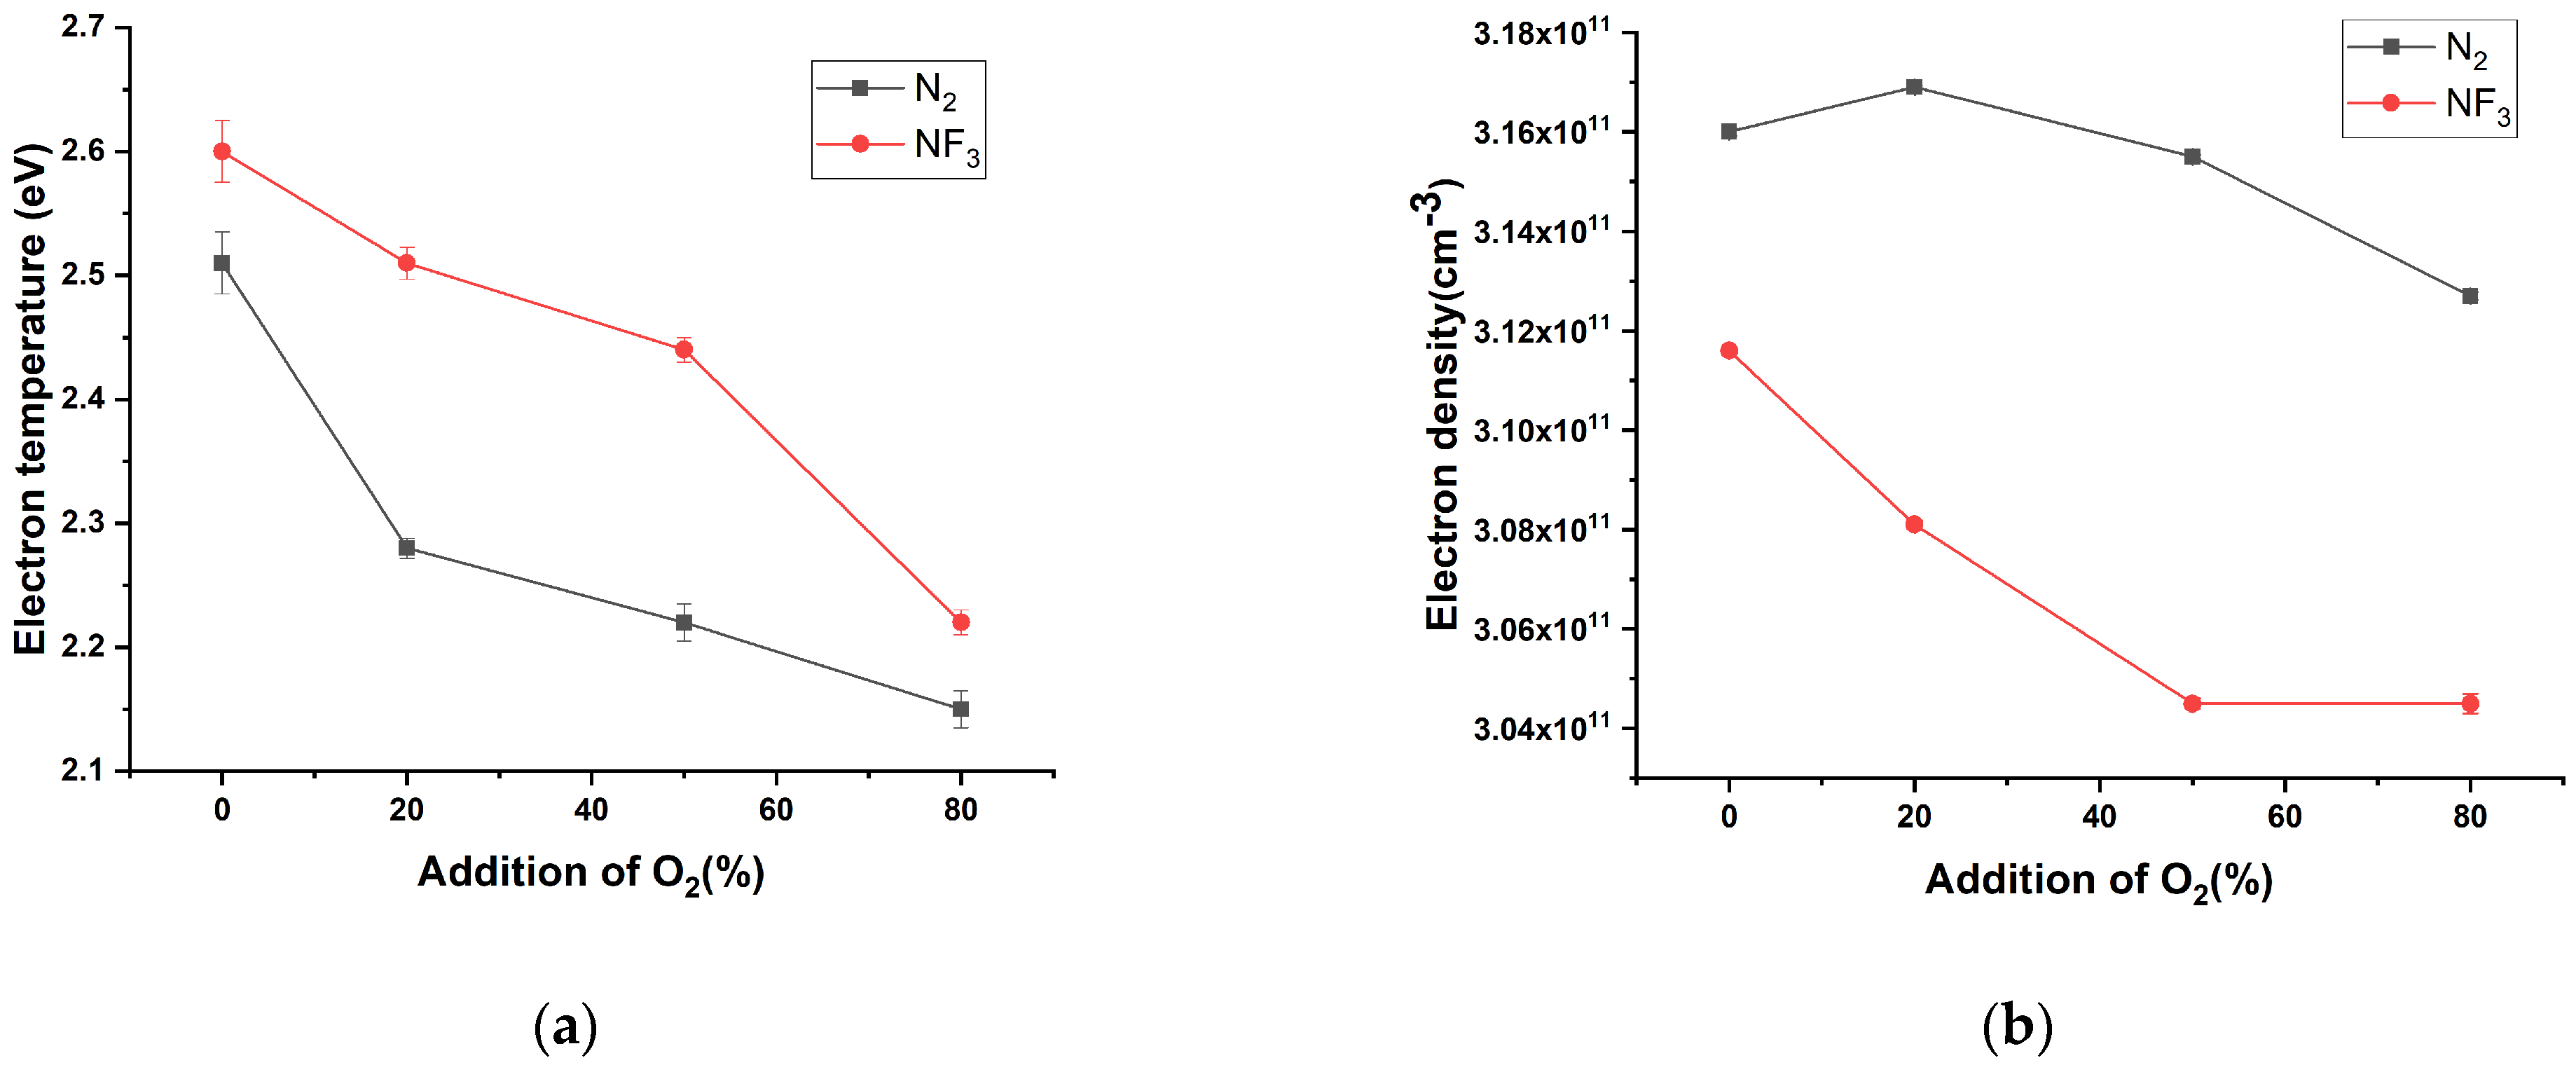
The electron temperature and electron density were calculated using Equations (8) and (9). Data were collected for 60 seconds, one per second after the plasma was created, and expressed as error bars to confirm the change. The calculated electron temperature is shown in
Figure 9a. The electron temperature of both N
2 and NF
3 decreased as the amount of oxygen added increased. Relatively, it seems that the electron temperature at NF
3 was slightly higher than that at N
2.
Figure 9b shows the electron density. In the case of electron density, N
2 was confirmed to be higher than NF
3, and the electron density decreased when O
2 was added. As more O
2 was added, the electron density of N
2 + O
2 plasma tended to decrease slightly, but there was no significant difference. In the case of NF
3, the electron density decreased when oxygen was added, and no change in electron density was observed when O
2 was added by 50% or more. When oxygen is added, the electron temperature decreases in both N
2 and NF
3 gases and the electron density also tends to decrease.
By mixing O2 with each N2 and NF3 gas, plasma was monitored and analyzed using OES. The OES spectrum of each plasma of N2 and NF3 was very similar. In both the N2 and NF3 spectra, an N2 band form was observed, which is thought to be because N atoms separated as NF3 was ionized to form N2 again through recombination. The distinguishing point between the NF3 and N2 plasma was the presence of an F peak. Additionally, the light emission intensity of the NF3 plasma was lower than that of the N2 plasma. As O2 was added, the light emission intensity of N2 and NF3 decreased, so it can be assumed that the energy in the plasma decreased. Actually, the electron temperature tends to decrease little by little for both N2 and NF3. In the case of electron density, N2 increases and decreases, and NF3 decreases. The lower electron density of NF3 than that of N2 was expected because of the high electronegativity of fluorine, which attracts electrons and does not release them again. When oxygen was added, the electron density slightly decreased, but when > 50% is added, the electron density did not change. It is assumed that oxygen is highly electronegative and does not lose many electrons to fluorine because it has six valence electrons. NF3 plasma was confirmed to have a lower electron density compared with N2 plasma, and this was judged to be due to the high electronegativity of fluorine. It can be expected that the overall chemical reaction in the plasma is reduced due to the decrease in electron temperature and electron density, but as a result of actinometry analysis, it was confirmed that radicals with relatively low excitation energy can be generated a small amount.


