Article

The Influence of H Content on the Properties of a-C(W):H Coatings

1
CEMMPRE—Centre for Mechanical Engineering Materials and Processes, Department of Mechanical Engineering, University of Coimbra, Rua Luís Reis Santos, 3030-788 Coimbra, Portugal
2
ISEP—School of Engineering, Polytechnic of Porto, Rua Dr. António Bernardino de Almeida 431, 4200-072 Porto, Portugal
3
Ion Beam Centre, Advanced Technology Institute, University of Surrey, Guildford GU2 7XH, UK
4
IPN-LED&MAT—Instituto Pedro Nunes, Laboratório de Ensaios, Desgaste e Materiais, Rua Pedro Nunes, 3030-199 Coimbra, Portugal
*
Author to whom correspondence should be addressed.
Coatings 2023, 13(1), 92; https://doi.org/10.3390/coatings13010092
Submission received: 12 October 2022 / Revised: 23 December 2022 / Accepted: 28 December 2022 / Published: 3 January 2023

Abstract

:
Diamond-like-carbon “DLC” coatings can be deposited in many different ways, giving a large range of material properties suitable for many different types of applications. Hydrogen content significantly influences the mechanical properties and the tribological behavior of DLC coatings, but its determination requires techniques that are not available in many research centers. Thus, it is important to find alternative indirect techniques, such as Raman spectroscopy or nanoindentation (hardness measurements), which can give comparative and indicative values of the H contents in the coatings, particularly when depositions with a reactive gas flow are being studied. In this work, “DLC” composite coatings with varying H content were deposited via Physical Vapor Deposition (PVD) magnetron sputtering in a reactive atmosphere (Ar + CH4). An Ion Beam Analysis was used to determine the elemental depth profile across the coating thickness (giving both average C:W:H ratios and film density when combined with profilometer measurements of film thickness). The hardness was evaluated with nanoindentation, and a decrease from 16 to 6 GPa (and a decrease in the film density by a factor of two) with an increasing CH4 flow was observed. Then, the hardness and Raman results were correlated with the H content in the coatings, showing that these indirect methods can be used to find if there are variations in the H content with the increase in the CH4 flow. Finally, the adhesion and tribological performance of the coatings were evaluated. No significant differences were found in the adhesion as a function of the H content. The tribological properties presented a slight improving trend with the increase in the H content with a decrease in the wear rate and friction.

1. Introduction

Diamond-like carbon (DLC) coatings are used today in a wide range of applications where low friction and wear are required [1]. Composite DLC coatings can have greatly improved tribological properties, and tungsten-doped DLC coatings have been well reviewed by Andrzej Czyzniewski [2,3]. DLC is an amorphous carbon (a-C) where the bonding is pure sp3 (valence 4, as diamond). Hydrogen is added (a-C:H) to relieve strain, and usually this results in some sp2 (polymer) bonding, which also modifies the hardness. Strictly speaking, this modified material is no longer entirely “diamond-like”, and the more it is modified the less diamond-like it is, but it is still normally referred to as “DLC”. Here, we study the effects of increasing the H-content of W-doped DLC (“a-C(W):H”).
In addition to the different manufacturing techniques and various doping elements (which can have a major influence on the behavior of DLC coatings [4,5,6,7]), hydrogen has a great impact on the film’s character, stabilizing the covalent bonding network (sp3) and controlling the optical and electrical properties. Moreover, hydrogen plays a key role in the mechanical and tribological behavior of the coatings. The influence on the coating’s hardness is significant, but this is a complex phenomenon depending on many factors including the precursor gases used, the selected deposition process and the processing conditions [8]. Some authors found a direct correlation between the H content and the mechanical properties, hardness and Young’s modulus, showing a decrease in the hardness as the H content in the coatings increases. Casiraghi et al. [9] found an increase in the Young’s modulus with the increase in the value of one Raman parameter related with the type of bonds and the clustering in the coating.
However, there are other factors that must also be considered. The deposition method influences the mechanical properties of the coatings; coatings with identical H content can have different hardness values [10,11]. Additionally, the precursor gas used influences the coating’s main characteristics, and coatings deposited with different precursor gases can have different mechanical properties [12,13]. Thus, the use of different deposition methods or precursor gases can significantly influence the type of bonding in the coatings as well as the structure and morphology; as a consequence, different mechanical properties can be achieved [14]. In general, if all the deposition conditions are kept constant, with the exception of the one determining the H content, one expects a decrease in the hardness as the H content increases.
Raman spectroscopy is one of the easiest ways to obtain structural information for different forms of carbon materials, from crystalline to amorphous [15]. In most cases of DLC coatings deposited by sputtering, the spectra of carbon-based coatings show two prominent features, the D band around 1300–1400 cm−1 and the G band around 1500–1600 cm−1, and with UV radiation, a T peak can also be observed around 980–1060 cm−1 [16]. The D band is due to the “breathing modes” of sp2 atoms in distorted rings and the G band is related to the stretching of pairs of sp2 atoms in rings and chains [17]. Raman provides information (i) about the coating’s structure through the G peak position, (ii) the intensity ratio between the D and G bands (ID/IG ratio) and (iii) the full width at a half maximum of the G band (FWHM (G)).
The photoluminescence background in visible Raman spectroscopy is associated with the H presence in DLC coatings and can be used to quantify the H content [9]. However, this is not straightforward, since many other factors also influence the photoluminescence background, such as the metal content or the presence of oxygen in the coatings [18].
In this study a set of a-C(W):H coatings was deposited with constant conditions, only varying the CH4 flow between 10 and 40 sccm. First, the H content of the films is correlated with Raman and hardness. Then, the adhesion and tribological properties of the coatings are studied. The elemental depth profiles (including H) were obtained absolutely using a detailed Ion Beam Analysis [19].

2. Materials and Methods

The coatings were deposited with a four magnetrons UDP-650-4 Teer Coatings, Worcestershire, UK equipment with DC power supplied to the targets and pulsed-DC for biasing the substrates. Four targets were used: one pure chromium, one graphite with 14 pellets of W (20 mm diameter) placed in the preferential erosion zone and two pure graphite targets. The targets were supplied by Testbourne Ltd., Basingstoke, UK with a purity of 99.5 %. Before the depositions, the targets and the substrates were sputtered cleaned during 40 min with shutters interposed between them to avoid cross-contamination. To improve the adhesion of the coatings, a Cr-based interlayer of approximately 300 nm was deposited. In the first 10 min, only the Cr target sputtered, followed by 10 min of transition for the deposition of the coating. In this step, the power on the C targets gradually increased as the Cr target power decreased. The coatings were deposited with a rotation speed of the substrates high enough to avoid the formation of a multilayer structure. A power of 1750 W was applied to both carbon targets whereas the target with W pellets was sputtered with 400 W, and a −50 V bias voltage was applied to the substrates. The gas was introduced with mass flow controllers Aera ROD-4. The Ar flow was set to 46 sccm, giving rise to 3.3 × 10⁻³ mbar while CH4 was varied between 10 and 40 sccm, corresponding to partial pressures of 1 × 10⁻⁴ and 9 × 10⁻⁴ mbar, respectively. The total time, including the deposition of the Cr interlayer, was set to 150 min. In all depositions, the chamber was evacuated down to a base pressure better than ≤6 × 10⁻⁶ mbar.
The coatings were deposited on heat-treated AISI M2 steel with a hardness of ~9 GPa, a diameter of 50 mm and a thickness of 5 mm, to achieve the mirror finishing of the surfaces to be coated, and the steel samples were polished with SiC papers (from P120 grit size) followed by an adequate diamond suspension of particles that were 3 µm. Silicon wafers that were polished one side were also used as substrates for the hardness and IBA measurements. The Si and steel substrates were deposited simultaneously. The linear film thicknesses were obtained with a mechanical profilometer of a step in a silicon-coated sample by removing a small drop of boron nitride to have a step corresponding to the total coating thickness. The equipment used to measure the step was the Perthometer S4P, Mahr Perthen GmbH, Hannover, Germany.
A Raman microspectrometer (Xplora, HORIBA Jobin-Yvon, Edison, NJ, USA) with a laser wavelength of 532 nm was used to characterize the structure of the coatings. The laser power was kept below 0.25 mW to avoid any damage to the coatings surface due to heating, which can lead to the graphitization of the coating. For each sample, two spectra were acquired. The Raman spectra were fitted with symmetric Gaussian functions with a linear background in the range 800 to 2000 cm−1.
The nanoindentation measurements were performed on a Nano Test Platform 1 (Micro Materials, Wrexham, UK) with a Berkovich indenter with a load of 5 mN and 30 s to increase and decrease the load and to also maintain the maximum load. The 5 mN maximum load was selected to prevent a maximum penetration depth higher than 10% of the total coating thickness in order to avoid the influence of the Si substrate on the measurements [20]. The Young’s modulus (E) of the coatings was determined from the reduced value assumed for the diamond indenter Ei = 1140 GPa and a Poisson ratio, νI = 0.07, and νs = 0.2 for the coating.
The adhesion of the coatings was evaluated with a conventional scratch tester (CSEM Revetest, Neuchâtel, Switzerland) with a diamond tip (Rockwell, Milwaukee, WI, 200 µm radius) with a loading rate of 10 N/mm to a maximum load of 50 N. For each sample, at least two tests were performed, and the scratch tracks were observed with an optical microscope to determine the load for the first adhesive failure (LC2).
The elemental depth profiles (composition) of the coatings in units of areal mass density (mass/area) were obtained explicitly using Ion Beam Analysis (IBA) at the Surrey Ion Beam Centre: the Cr signal (and the Si substrate signal) terminated the profile, which could therefore be integrated to obtain the total film thickness (as mass/area). Therefore, if the linear film thickness is known (in μm), the film density (mass/volume) can be obtained. Further details about the procedures used are described in the Supplementary Materials.
Two ion beams (3045 keV 4He+ and 4315 keV 4He++), four detectors (three particle detectors at scattering angles of 172.8°, 148.6° and 30.75° where the forward recoil detector had a 32 μm Kapton range foil and an X-ray detector with a 146 μm Be filter at 60° to the beam) and two beam incidence angles (normal incidence and glancing incidence) were used. The recoiled H was only observed in the forward recoil detector at the glancing beam incidence.
The IBA therefore included elastic scattering (both Rutherford backscattering, RBS, and non-Rutherford elastic backscattering, EBS, where the EBS scattering cross-sections were obtained from SigmaCalc [21]) elastic recoil detection analysis (ERD) and PIXE. All these data were fitted self-consistently using the DataFurnace code [22] (with NDFv9.4e [23] as the computation engine). The particle-induced X-ray emission (PIXE) spectra had significant signals for W, Ar, Cr and Si, and the thickness of the Cr interlayer was determined from the PIXE, where the signal from the graded interfaces was also fitted by the code. The H content of the films was directly observed with ERD in the forward recoil particle detector. The EBS signals for O and C were greatly enhanced at the resonances at 3038 keV (for O) and 4315 keV (for C). Therefore, this IBA had good sensitivity for all the signals reported.
The tribological behavior was evaluated using a pin-on-disc tribometer (High Temperature tribometer, CSM Instruments, Peseux, Switzerland) in room conditions. The sliding partner was a 6 mm AISI 52110 steel ball. The selection of a steel counterpart is related to the types of applications to which this type of coating is applied. The linear speed, normal load and number of cycles were identical for all samples at 0.1 m s−1, 10 N and 10.000, respectively. The friction coefficients are the mean values of the entire friction curve, and the ‘running-in’ phase was not considered. The wear rates were calculated as the worn volume per sliding distance per normal load. The worn volumes were measured with an optical 3D profilometer white light interferometer (NewView 7200, Zygo, Middlefield, CT, USA).

3. Results and Discussion

Table 1 shows the average elemental composition of the films integrated from the IBA depth profiles, including samples with six different CH4 flow rates (one sample with excessive O content was excluded). Additionally shown is the deposition rate (in nm/s) and the film density (in g/cm3) obtained by combining the IBA thickness (in μg/cm2) and the thickness (in μm) measured with the profilometer. The a-C(W):H film signals were easily separated from the substrate by the Cr interlayer, whose thickness was determined by PIXE. These IBA spectra were complicated, and for a good fit, it was also necessary to fit the graded Cr interlayer with an equivalent Cr thickness (around 0.3 μm for all the samples). Note that reliable results require good fitting of all the signals from all four detectors. A full uncertainty analysis was not carried out, but the uncertainty was conservatively estimated at about 10% (±5%).
The decrease in the W content with the increase in the CH4 flow could be mainly attributed to two main factors: (i) for similar sputtering conditions, the number of C atoms reaching the substrate increased (from the reactive gas CH4) and thus the relative number of W atoms decreased; and (ii) depositing in reactive conditions may promote poisoning of the W pellets of the target with the consequent decrease in the sputtering rate of W. The same trend was observed for the Ar content in the coatings which, in this case, was probably due to the lower strain in the films, which provided a lower sticking probability of the noble atoms with almost zero incorporation for the least-dense films. The oxygen content in the coatings was rather low (<2 at%) and appeared independent of the CH4 flow. It originated from the residual oxygen in the vacuum chamber and/or from atmospheric contamination after deposition. Since the samples were stored in the same conditions, it was expected that the contamination from air exposure would be the same for all samples. Thus, the small differences in the O content in the coatings were probably related to the base vacuum before deposition.
The H in the coatings was from the CH4 gas; therefore, the IBA showed that the H content increased from about 26 at% to 31 at% with the CH4 flow rate. The corresponding decrease in the coating density was from 3.9 to 2.1 g/cm3. This decrease must be understood not only by the decreasing average atomic weight of the coating, but also by the increasing average bond length. Both the composition and the structure of the coatings significantly influenced the density.
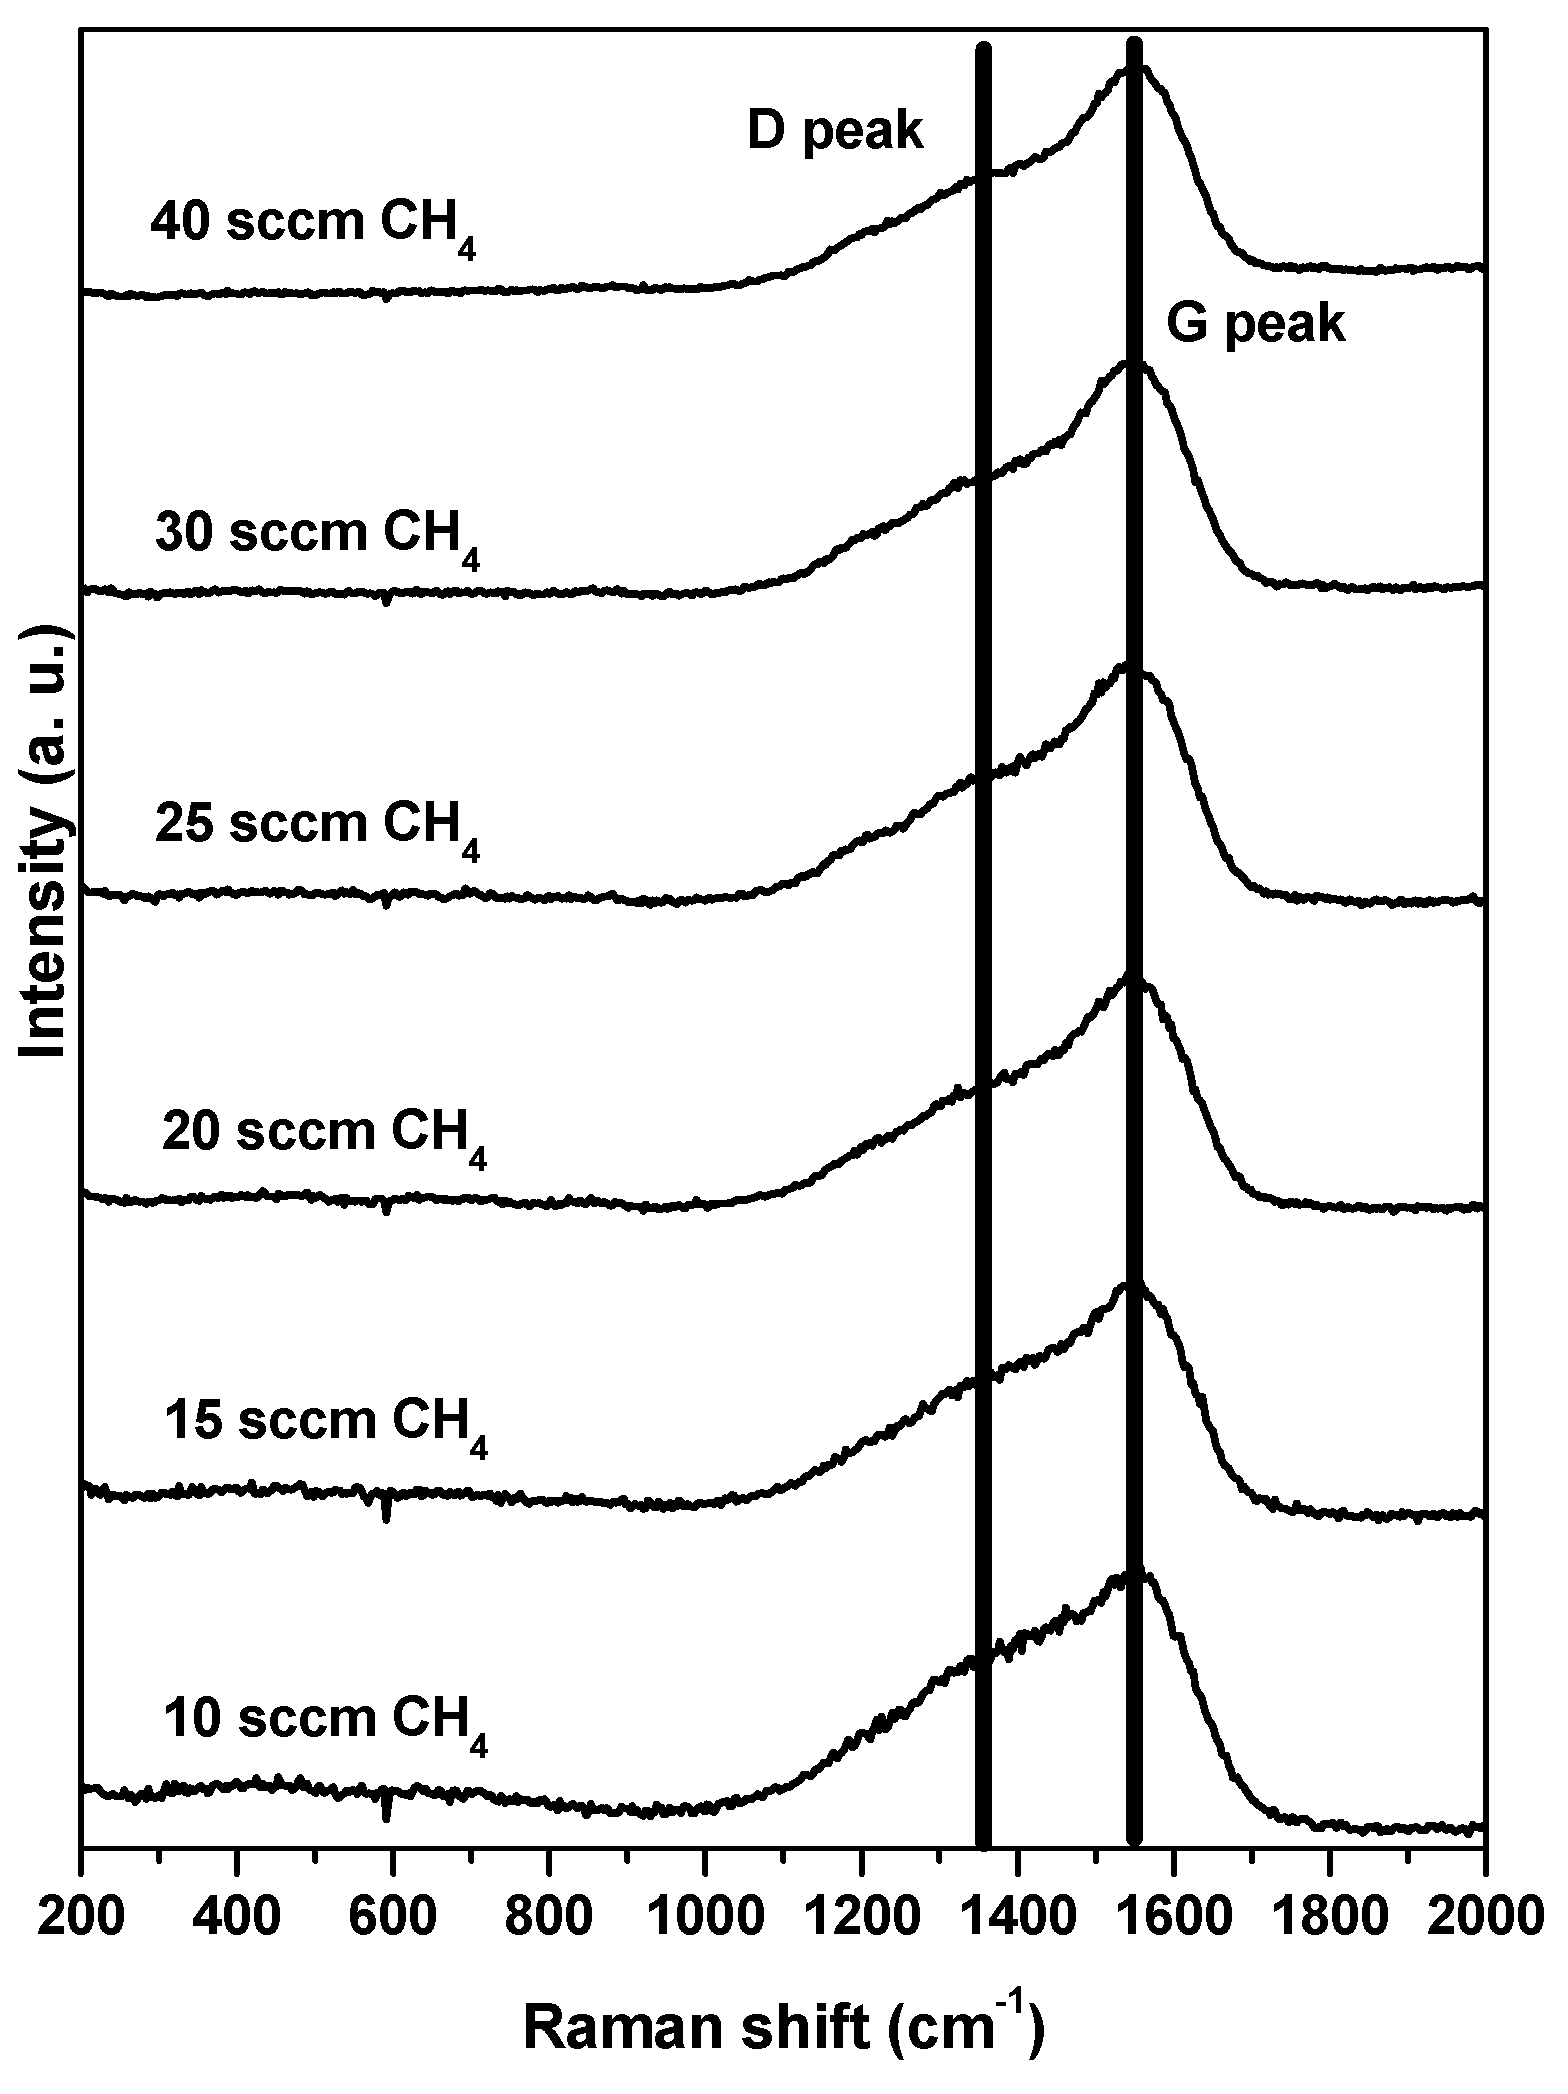
The influence of the H content on the bonding structure of the coatings was analyzed with Raman spectroscopy. Figure 1 presents the Raman spectra from 200 to 2000 cm−1 for all the coatings. Three main parameters were considered in the analysis: the G peak position; the D over G intensities ratio, ID/IG; and the FWHM (G). Moreover, the photoluminescence background (PL) was also analyzed, which can give a signature for the H content. For higher H contents (<~40 at%), the literature shows that the background overshadows the Raman signal of the coatings [9,15,16,24]. To determine the H content in DLC coatings, Casiraghi et al. [9] established a simple formula that relates the H content with the photoluminescence (PL) signal. The values of PL (m/I(G)) were calculated from the ratio between the slope (m)(background of the spectra in the range 1050 to 1800 cm−1) and the intensity of the G peak IG.
Figure 2 presents the evolution of the m/IG values with the methane flow rate. In addition to the H content, there are other factors that can influence the values of m/IG, including the type of structure of the coatings [25], contamination due to poor vacuum conditions during the deposition or water absorbed after exposure to air [26,27] and alloying coatings with a metal [28]. With an increasing CH4 flow rate, m/IG also increased (see Figure 2), suggesting an increase in the H content in the films. The slightly different evolution from the one derived by Casiraghi et al. [9] can be attributed either to the presence of W in the coatings or the differences in the structure related to the conditions in the deposition process. For chromium-alloyed DLC coatings (with a similar H content), it was observed that the decrease in the metal content gave an increase in the slope of the Raman background [29]. The coatings deposited in this work presented two features that contributed to the increase in the m/I(G) with the increase in the CH4 flow, which were (i) the increase in the H content and (ii) the decrease in the W content as the CH4 flow increased.
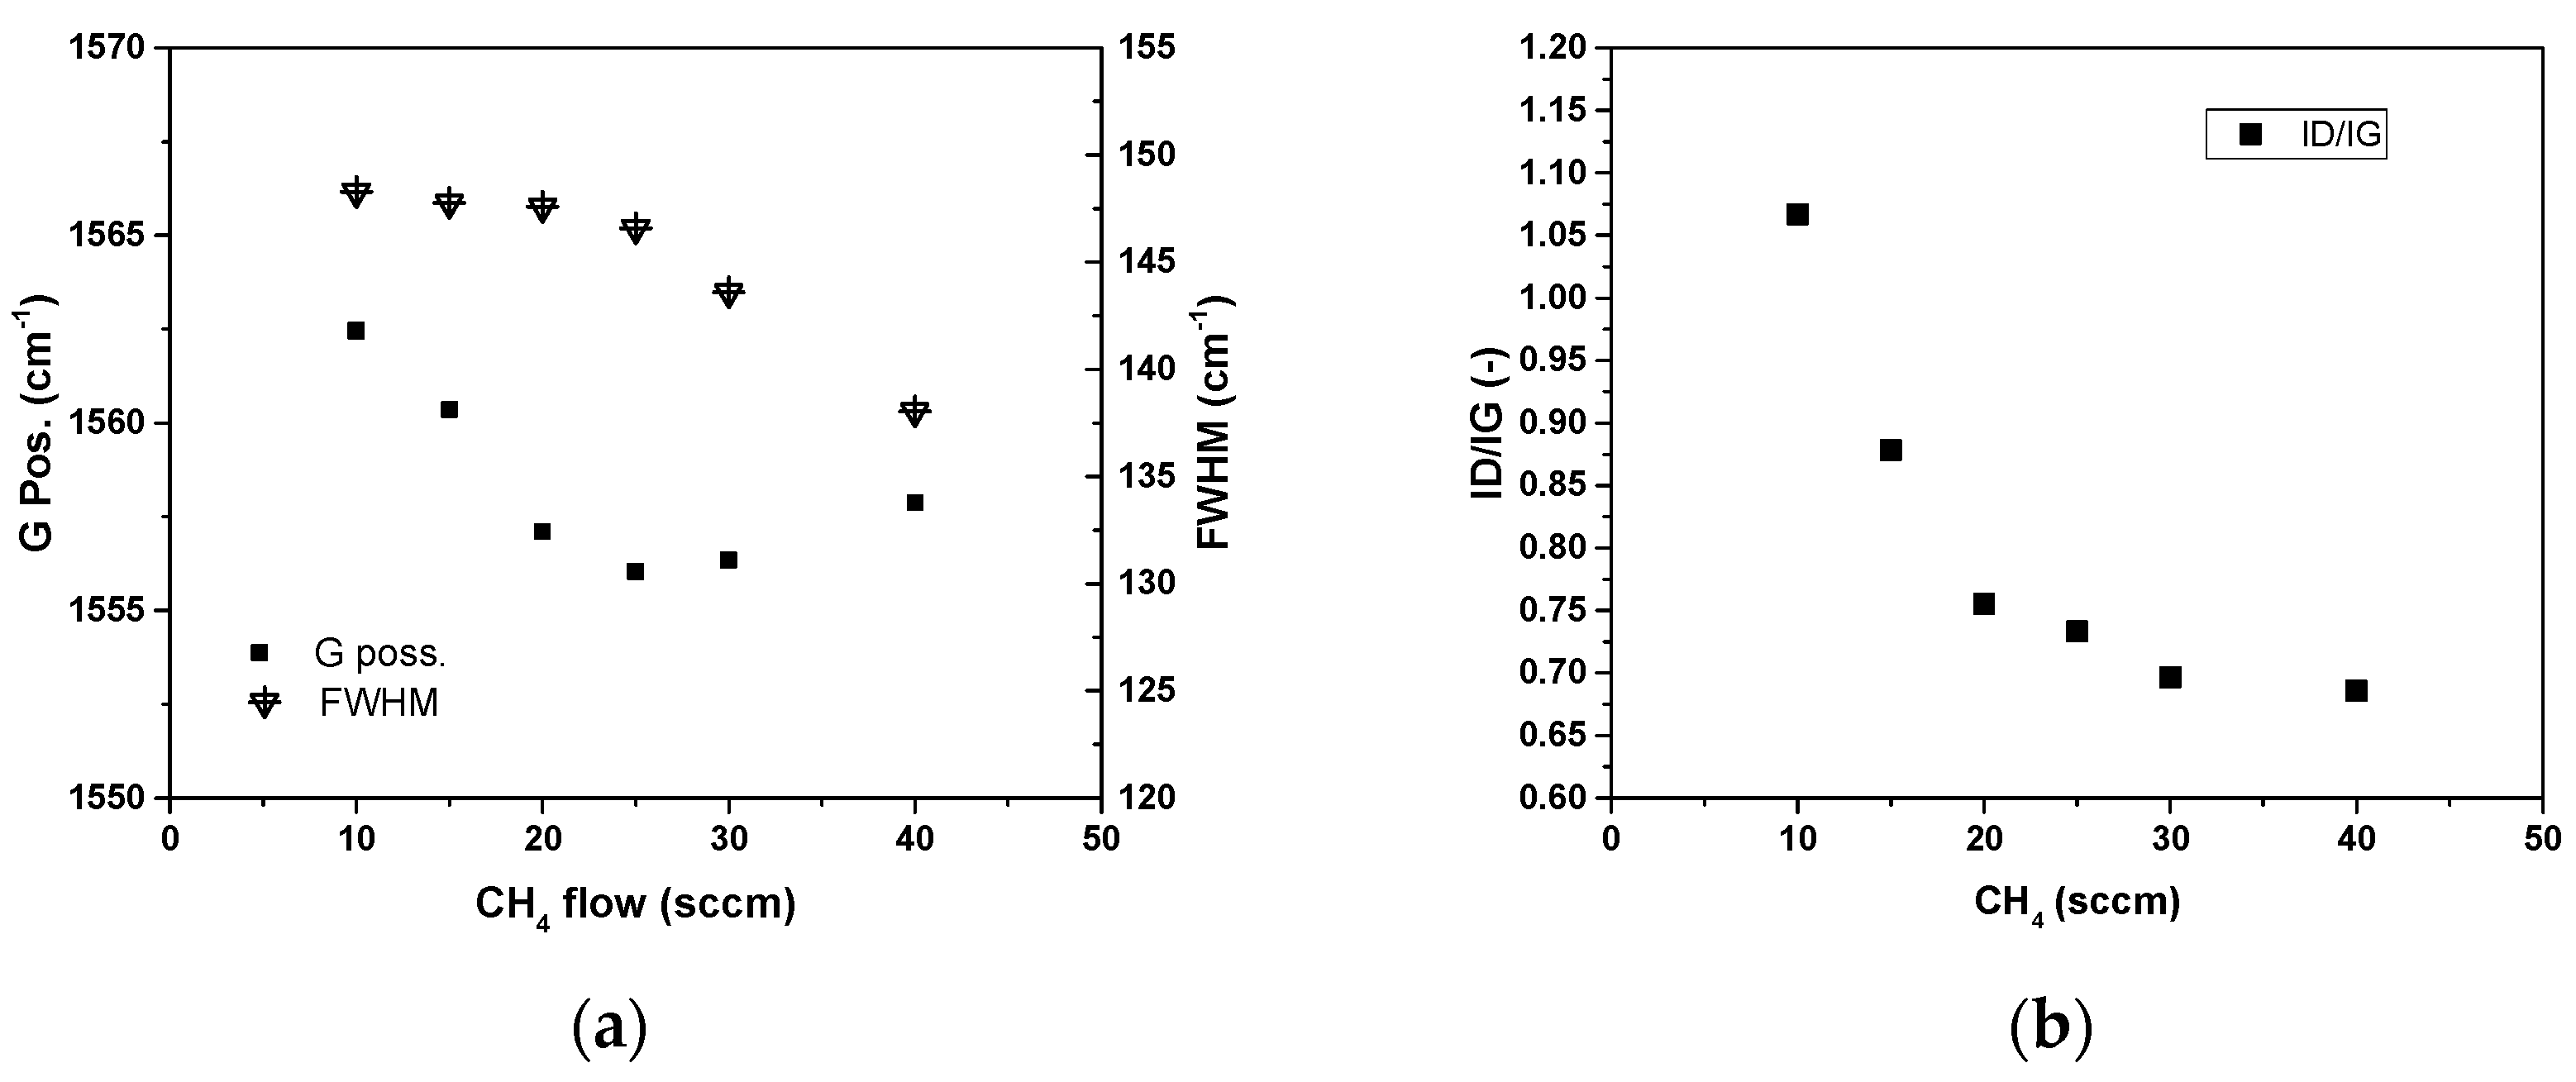
Figure 3a presents the G position and FWHM (G), and Figure 3b presents the ID/IG ratio as functions of the CH4 flow. The G peak position shifted to a lower wave number with the increasing H content, reaching a minimum value of 25 sccm of CH4; at this value, an inversion in the trend was observed. The FWHM (G) and ID/IG ratio decreased from 148 to 138 cm−1 and from 1.05 to 0.7, respectively, as the CH4 flow increased. Casiraghi et al. [24] showed that the evolution of the Raman parameters was different for H content higher or lower than a particular value: in their case, it was 20 at%, and in our case, it was a little higher. For amorphous carbon coatings, ID/IG is related to the size of the sp2 phase organized in rings [15]; thus, a low ID/IG means that the molecular structure is mainly organized in chains even though rings can also be present, but with the π bonds not fully delocalized. FWHM(G) is a measure of the disorder, particularly that arising from bond angle and bond length distortions. A structure organized more in chains (with a polymer-like character) should give rise to a narrowing of the G band, as seen in Figure 3a.
In relation to the G peak position, according to Ferrari and Robertson [16], a shift in the G peak to lower wave numbers is related to bond disorder while the inverse is related to chain formation or clustering. These factors act as competing forces on the shape of the Raman spectra.
The adhesion of the coatings was evaluated using a conventional scratch test. The lowest value for the adhesive failure of the coatings was 42 N, and from the six coatings deposited, only two showed adhesive failures with similar values. Those failures were in the end of the scratch, and no extensive failures covering all areas of the scratch were observed. Figure 4 presents the two type of behaviors observed for all coatings. No clear relations of the adhesive failures to the increase in the CH4 flow was found. The coatings were deposited with increasing flows from 10 to 40 sccm of CH4, and only the ones with 15 and 20 sccm of CH4 flows presented adhesive failures.
The mechanical properties of the coatings were evaluated with nanoindentation. The hardness and Young’s modulus had similar behavior with the increase in theCH4 flow, as both showed a decreasing trend, as shown in Figure 5. Although there was a decrease in the W content from 5 to 2.9 at% (Table 1), this behavior was mainly related to the incorporation of H in the coating due to the changes that it caused to the bonding network and structure. With the increasing H content, the mechanical properties of the coatings tended to be determined by the polymer-like structure due to more C-H sp3 hybridized bonds.
Figure 6 presents the typical nanoindentations curves of three coatings deposited with increasing CH4 flow rates. The mechanical work is divided into two parts: the plastic deformation Wp and the elastic recovery We. From the indentation curves, it can be observed that with the increase in the H content, the hardness decreased as expected and the elastic recovery increased. This behavior was also observed by other authors [18] and might be related to the continuous increase in the number of sp3 hybridized bonds in the film, as corroborated by the Raman analysis.
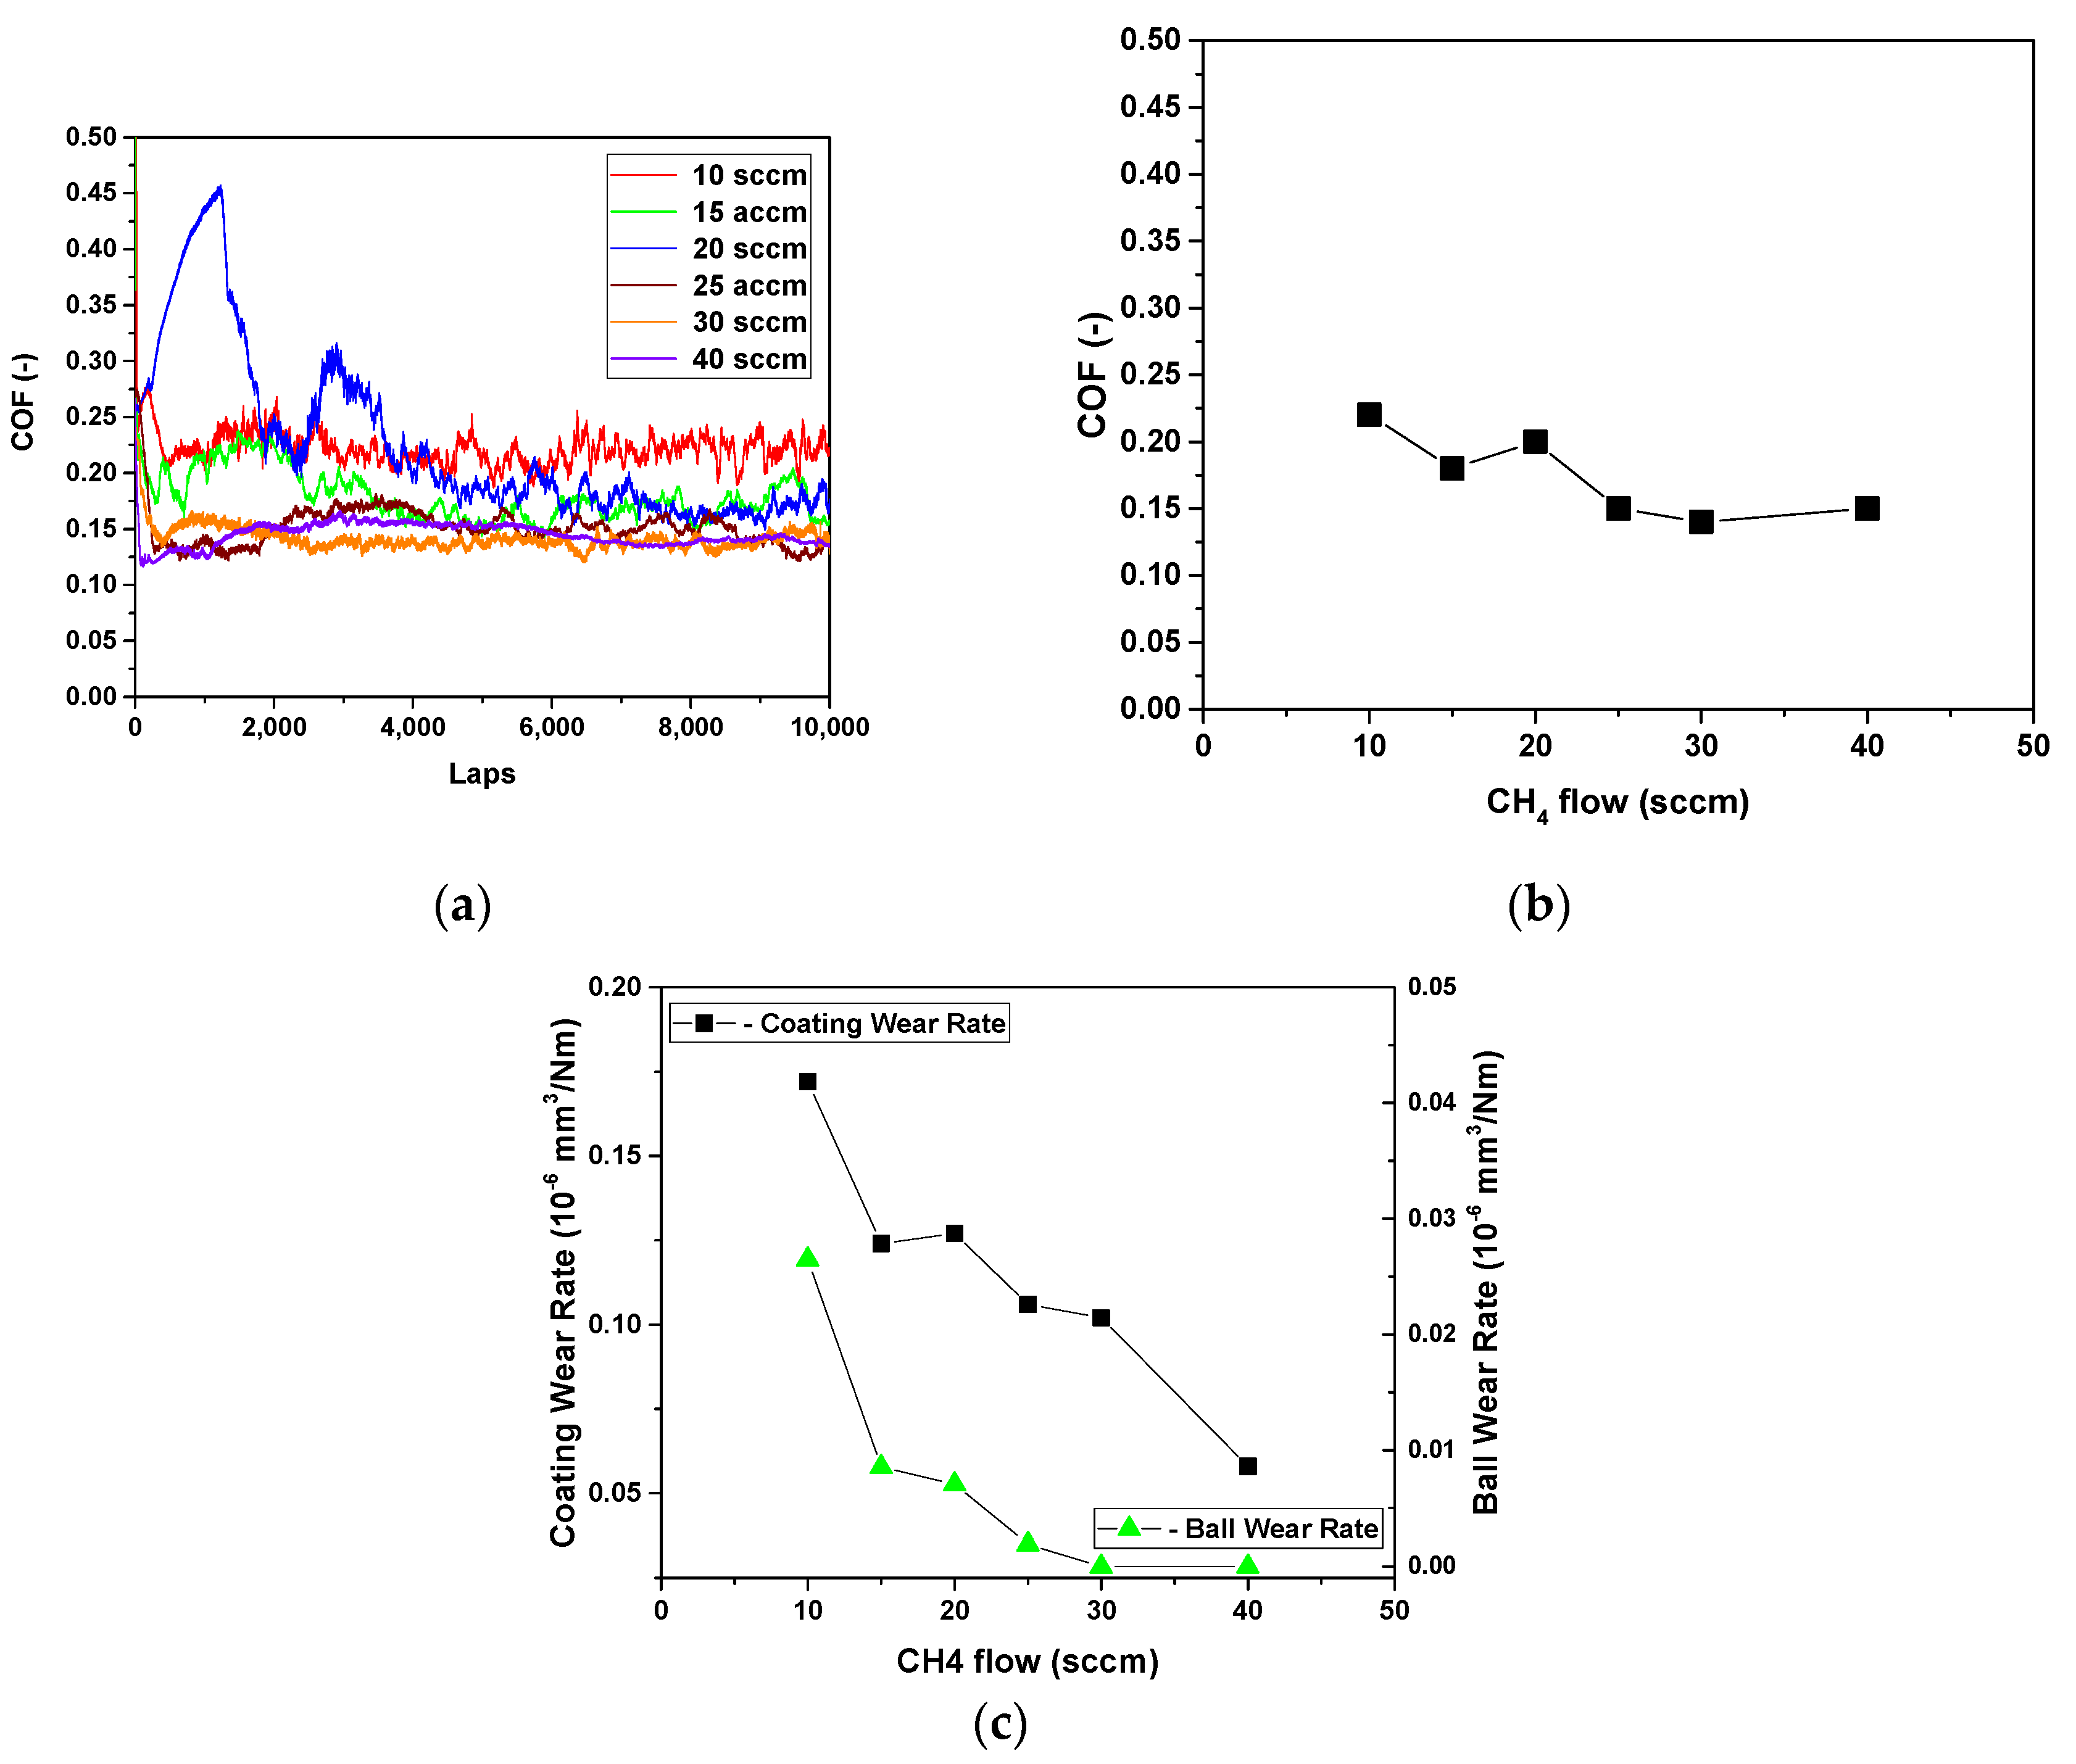
The tribological characterization of the coatings was performed via a pin-on-disc at room conditions with a normal load of 10 N against a 100Cr6 6 mm steel ball. Figure 7a presents the evolution of the friction during the test for the different compositions studied in this work. Two distinct behaviors of the friction can be observed; coatings deposited with up to 20 sccm of CH4 presented significant fluctuations of the friction during the whole test, while coatings deposited with 25 sccm of CH4 or higher flows presented a more stable friction during the test.
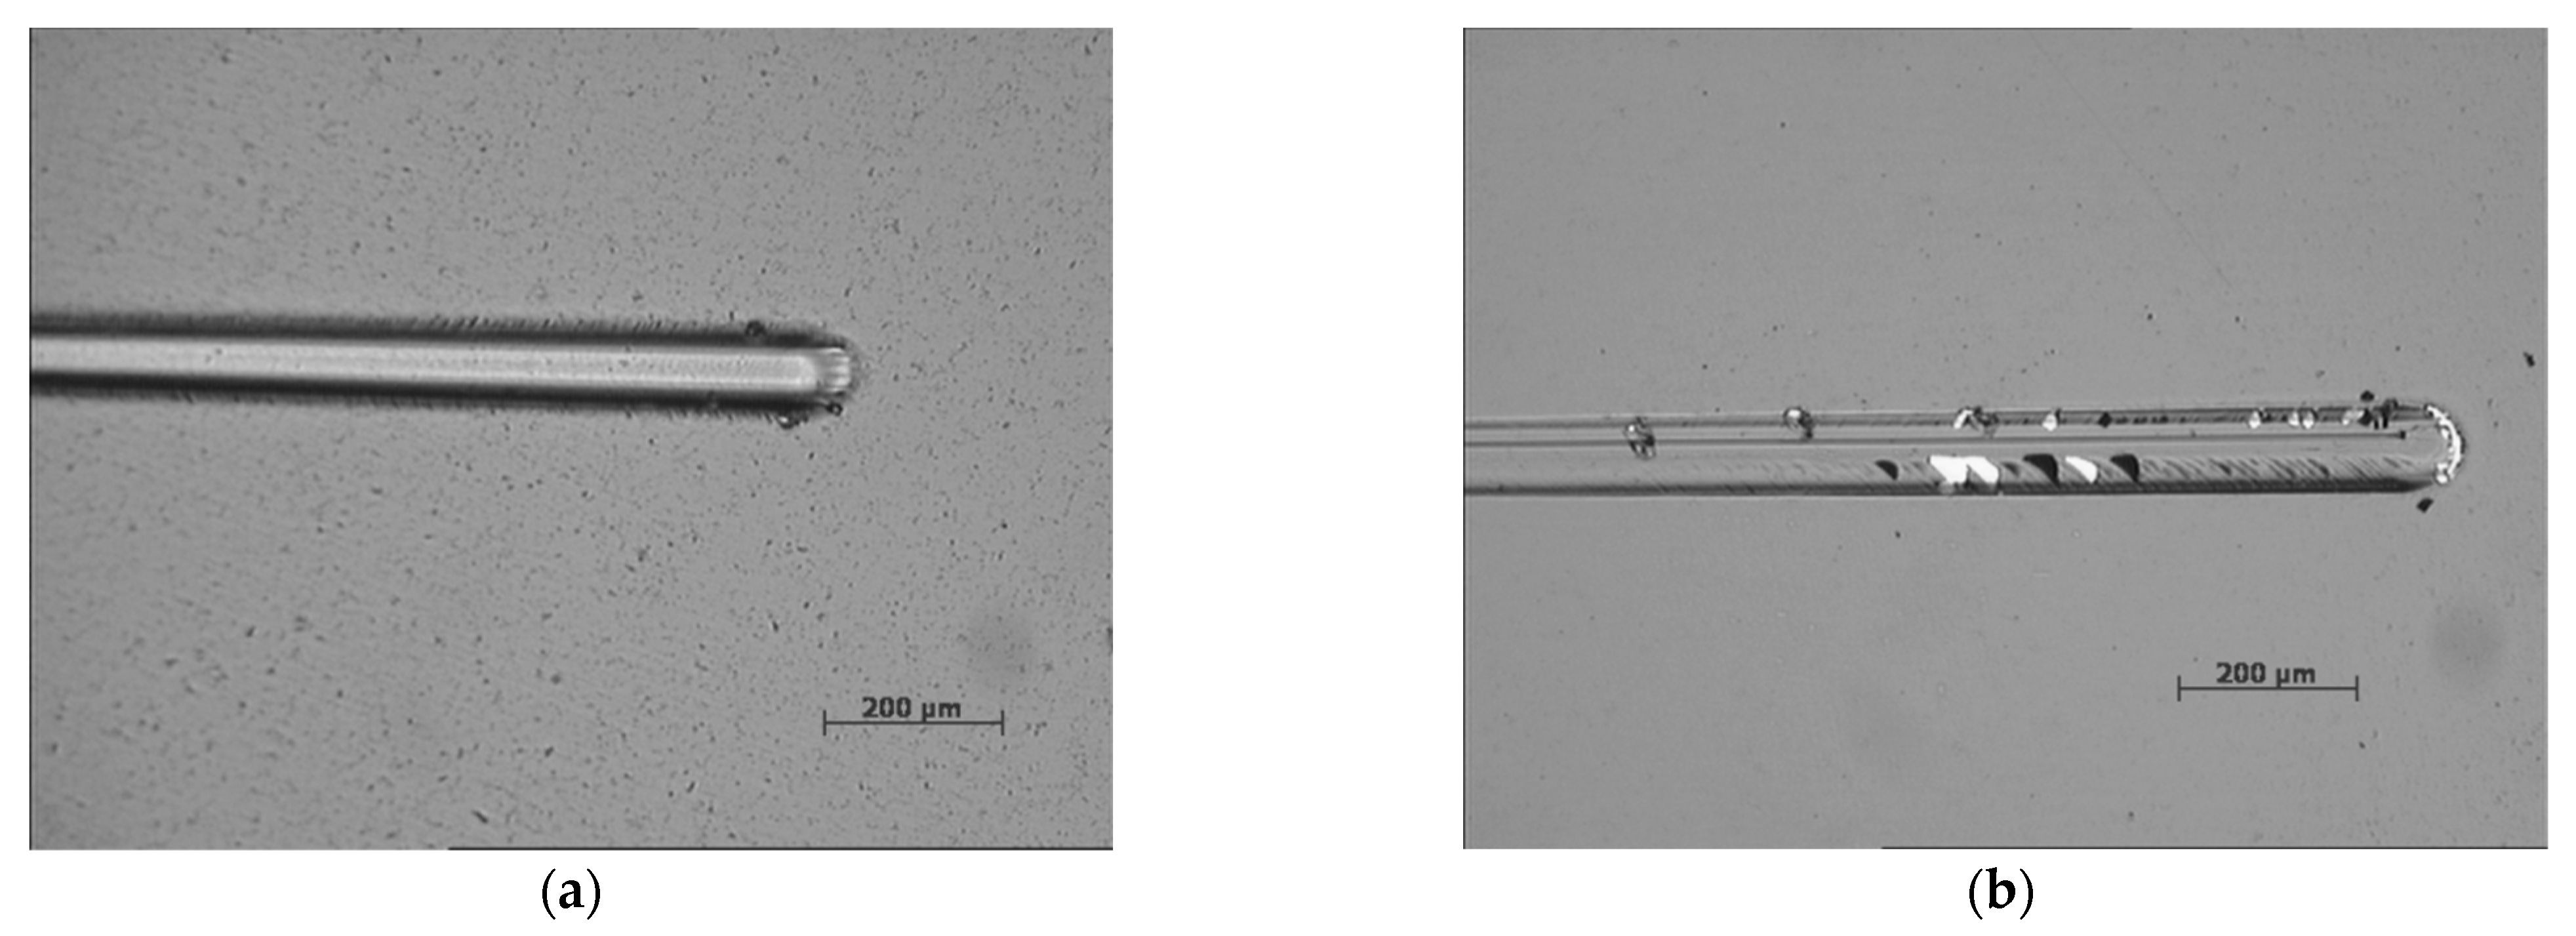
This behavior can be associated with the formation of a well-adherent homogeneous transfer layer on the sliding ball, as was observed (Figure 8b). For the coatings with lower H content (10 sccm of CH4), such a transfer layer was not observed (Figure 8a). The increase in the H content promoted a decrease in the average friction (Figure 7b), a behavior usually observed for DLC coatings deposited with increasing H content [30]. The formation of the transfer layer, usually attributed to the graphitization of the coating, can explain the decrease in the friction. Concerning the wear rate for the coating and the sliding partner (100Cr6 steel ball), a gradual decrease was observed with the increase in the H content in spite of their lower hardness. There were several factors that could have influenced the tribological behavior for this set of coatings. One that could have had a major role in the tribological performance was the H content in the coatings. Additionally, the mechanical properties could have influenced the results. Finally, the types of bonds in the coating also contributed to the performance observed for the different coatings tested.

4. Conclusions

A set of coatings with an increasing CH4 flow were successfully deposited on steel and silicon substrates. The IBA analysis showed that the coatings deposited with increasing CH4 flow rates had markedly lower W and Ar content, whereas the H content increased somewhat. However, the film density reduced markedly with the higher H content. For the same CH4 variation, Raman spectroscopy showed that the structure of the coatings had a more polymer-like character. This evolution of the structure gave rise both to the decrease in both the hardness and Young’s modulus and also to the decrease in the film density. Therefore, it is possible to have a qualitative estimation of the H content and the mechanical properties of the coatings when one knows the flows of CH4 and uses Raman spectroscopy.
The increase in the H content in the coatings did not significantly influence the coating adhesion. However, the tribological behavior was influenced by the increase in the H content, with a decrease in the friction and wear of both the coating and the sliding partner due to the formation of a well-adherent transfer layer on the latter. The formation of the adherent transfer layer was facilitated with the increase in the H content, mainly due to the fact that there was a decrease in the hardness and Young‘s modulus as the H content in the coating increased. Thus, this will contribute to the decrease in the wear and friction by the formation of a transfer layer that protects both of the sliding partners.

Supplementary Materials

The following supporting information can be downloaded at: https://www.mdpi.com/article/10.3390/coatings13010092/s1, Table S1: Misfit factor for H signal; Table S2: C/H ratio for all samples, from fitted data. References [31,32,33,34,35,36,37,38,39,40,41,42,43,44] are cited in the supplementary materials.

Author Contributions

Conceptualization, methodology, coatings deposition and writing—original draft preparation, M.E.; coatings characterization; M.E. and C.J.; writing—review and editing, F.F. and A.C. All authors have read and agreed to the published version of the manuscript.

Funding

This research was funded by CEMMPRE–UIDB/ 00285/2020 (cofinanced by FEDER and FCT-Fundação para a Ciência e a Tecnologia (COMPETE)). The IBA was funded by the European Community under the program «Support of Public and Industrial Research Using Ion Beam Technology (SPIRIT)» (EC contract no. 227012).

Institutional Review Board Statement

Not applicable.

Informed Consent Statement

Not applicable.

Data Availability Statement

Not applicable.

Conflicts of Interest

The authors declare no conflict of interest. The funders had no role in the design of the study; in the collection, analyses or interpretation of data; in the writing of the manuscript; or in the decision to publish the results.

References

  1. Matthews, A.; Eskildsen, S.S. Engineering applications for diamond-like carbon. Diam. Relat. Mater. 1994, 3, 902–911. [Google Scholar] [CrossRef]
  2. Czyzniewski, A. Optimising deposition parameters of W-DLC coatings for tool materials of high speed steel and cemented carbide. Vacuum 2012, 86, 2140–2147. [Google Scholar] [CrossRef]
  3. Czyzniewski, A. The effect of air humidity on tribological behaviours of W–C:H coatings with different tungsten contents sliding against bearing steel. Wear 2012, 296, 547–557. [Google Scholar] [CrossRef]
  4. Voevodin, A.A.; Prasad, S.V.; Zabinski, J.S. Nanocrystalline carbide/amorphous carbon composites. J. Appl. Phys. 1997, 82, 855–858. [Google Scholar] [CrossRef]
  5. Corbella, C.; Oncins, G.; Gómez, M.; Polo, M.; Pascual, E.; García-Céspedes, J.; Andújar, J.; Bertran, E. Structure of diamond-like carbon films containing transition metals deposited by reactive magnetron sputtering. Diam. Relat. Mater. 2005, 14, 1103–1107. [Google Scholar] [CrossRef]
  6. Nilsson, D.; Svahn, F.; Wiklund, U.; Hogmark, S. Low-friction carbon-rich carbide coatings deposited by co-sputtering. Wear 2003, 254, 1084–1091. [Google Scholar] [CrossRef]
  7. Meng, W.J.; Gillispie, B.A. Mechanical properties of Ti-containing and W-containing diamond-like carbon coatings. J. Appl. Phys. 1998, 84, 4314–4321. [Google Scholar] [CrossRef]
  8. Suzuki, M.; Ohana, T.; Tanaka, A. Tribological properties of DLC films with different hydrogen contents in water environment. Diam. Relat. Mater. 2004, 13, 2216–2220. [Google Scholar] [CrossRef]
  9. Casiraghi, C.; Piazza, F.; Ferrari, A.; Grambole, D.; Robertson, J. Bonding in hydrogenated diamond-like carbon by Raman spectroscopy. Diam. Relat. Mater. 2005, 14, 1098–1102. [Google Scholar] [CrossRef]
  10. Lofaj, F.; Kabátová, M.; Kvetková, L.; Dobrovodský, J. The effects of deposition conditions on hydrogenation, hardness and elastic modulus of W-C:H coatings. J. Eur. Ceram. Soc. 2020, 40, 2721–2730. [Google Scholar] [CrossRef]
  11. Lofaj, F.; Kabátová, M.; Dobrovodský, J.; Cempura, G. Hydrogenation and hybridization in hard W-C:H coatings prepared by hybrid PVD-PECVD method with methane and acetylene. Int. J. Refract. Met. Hard Mater. 2020, 88, 105211. [Google Scholar] [CrossRef]
  12. Libardi, J.; Grigorov, K.; Massi, M.; Otani, C.; Ravagnani, S.; Maciel, H.; Guerino, M.; Ocampo, J. Comparative studies of the feed gas composition effects on the characteristics of DLC films deposited by magnetron sputtering. Thin Solid Films 2004, 459, 282–285. [Google Scholar] [CrossRef]
  13. Robertson, J. Requirements of ultrathin carbon coatings for magnetic storage technology. Tribol. Int. 2003, 36, 405–415. [Google Scholar] [CrossRef]
  14. Kahn, M.; Paskvale, S.; Čekada, M.; Schöberl, T.; Waldhauser, W.; Mitterer, C.; Pelicon, P.; Brandstätter, E. The relationship between structure and mechanical properties of hydrogenated amorphous carbon films. Diam. Relat. Mater. 2010, 19, 1245–1248. [Google Scholar] [CrossRef]
  15. Ferrari, A.C.; Robertson, J. Interpretation of Raman spectra of disordered and amorphous carbon. Phys. Rev. B 2000, 61, 14095. [Google Scholar] [CrossRef] [Green Version]
  16. Ferrari, A.C.; Robertson, J. Resonant Raman spectroscopy of disordered, amorphous, and diamondlike carbon. Phys. Rev. B 2001, 64, 075414. [Google Scholar] [CrossRef] [Green Version]
  17. Robertson, J. Daimond–Like amorphous carbon. Mat. Sci. Eng. 2002, R37, 129. [Google Scholar] [CrossRef] [Green Version]
  18. Dai, W.; Wu, G.; Wang, A. Structure and elastic recovery of Cr–C:H films deposited by a reactive magnetron sputtering technique. Appl. Surf. Sci. 2010, 257, 244–248. [Google Scholar] [CrossRef]
  19. Jeynes, C.; Colaux, J.L. Thin film depth profiling by ion beam analysis. Analyst 2016, 141, 5944–5985. [Google Scholar] [CrossRef] [Green Version]
  20. Fernandes, J.; Trindade, A.; Menezes, L.; Cavaleiro, A. A model for coated surface hardness. Surf. Coat. Technol. 2000, 131, 457–461. [Google Scholar] [CrossRef]
  21. Gurbich, A. Evaluated differential cross-sections for IBA. Nucl. Instrum. Methods B 2010, 268, 1703–1710. [Google Scholar] [CrossRef]
  22. Jeynes, C.; Palitsin, V.; Grime, G.; Pascual-Izarra, C.; Taborda, A.; Reis, M.; Barradas, N. External beam Total-IBA using DataFurnace. Nucl. Instrum. Methods B 2020, 481, 47–61. [Google Scholar] [CrossRef]
  23. Barradas, N.P.; Jeynes, C. Advanced physics and algorithms in the IBA DataFurnace. Nucl. Instruments Methods B 2008, 266, 1875–1879. [Google Scholar] [CrossRef] [Green Version]
  24. Casiraghi, C.; Ferrari, A.C.; Robertson, J. Raman spectroscopy of hydrogenated amorphous carbons. Phys. Rev. B 2005, 72, 085401. [Google Scholar] [CrossRef] [Green Version]
  25. Henley, S.J.; Carey, J.D.; Silva, S.R.P. Room temperature photoluminescence from nanostructured amorphous carbon. Appl. Phys. Lett. 2004, 85, 6236–6238. [Google Scholar] [CrossRef] [Green Version]
  26. Rodil, S.E.; Muhl, S.; Maca, S.; Ferrari, A.C. Optical gap in carbon nitride films. Thin Solid Film 2003, 433, 119. [Google Scholar] [CrossRef]
  27. Fanchini, G.; Ray, S.; Tagliaferro, A. Photoluminescence investigation of carbon nitride-based films deposited by reactive sputtering. Diam. Relat. Mater. 2003, 12, 1084–1087. [Google Scholar] [CrossRef]
  28. Zhang, H.; Wu, W.; Gong, C.; Wang, W.; He, Z.; Li, J.; Ju, X.; Tang, Y.; Xie, E. Structural and optical properties of Fe-doped hydrogenated amorphous carbon films prepared from trans-2-butene by plasma enhanced metal organic chemical vapor deposition. Appl. Phys. A 2010, 98, 895–900. [Google Scholar] [CrossRef]
  29. Pardo, A.; Gómez-Aleixandre, C.; Orwa, J.; Cimmino, A.; Prawer, S. Modification of characteristics of diamond-like carbon thin films by low chromium content addition. Diam. Relat. Mater. 2012, 26, 39–44. [Google Scholar] [CrossRef]
  30. Lugo, D.; Silva, P.; Ramirez, M.; Pillaca, E.; Rodrigues, C.; Fukumasu, N.; Corat, E.; Tabacniks, M.; Trava-Airoldi, V. Characterization and tribologic study in high vacuum of hydrogenated DLC films deposited using pulsed DC PECVD system for space applications. Surf. Coat. Technol. 2017, 332, 135–141. [Google Scholar] [CrossRef]
  31. Boudreault, G.; Elliman, R.G.; Grötzschel, R.; Gujrathi, S.C.; Jeynes, C.; Lennard, W.N.; Rauhala, E.; Sajavaara, T.; Timmers, H.; Wang, Y.Q.; et al. Round Robin: Measurement of H implantation distributions in Si by elastic recoil detection. Nucl. Instrum. Methods B 2004, 222, 547–566. [Google Scholar] [CrossRef]
  32. Abriola, D.; Barradas, N.P.; Bogdanović-Radović, I.; Chiari, M.; Gurbich, A.F.; Jeynes, C.; Kokkoris, M.; Mayer, M.; Ramos, A.R.; Shi, L.; et al. Development of a reference database for Ion Beam Analysis and future perspectives. Nucl. Instrum. Methods B 2011, 269, 2972–2978. [Google Scholar] [CrossRef]
  33. Ziegler, J.F. SRIM-2003. Nucl. Instrum. Methods B 2004, 219, 1027–1036. [Google Scholar] [CrossRef] [Green Version]
  34. Wielopolski, L.; Gardner, R.P. Prediction of the pulse-height spectral distortion caused by the peak pile-up effect. Nucl. Instrum. Methods B 1976, 133, 303–309. [Google Scholar] [CrossRef]
  35. Molodtsov, S.L.; Gurbich, A.F. Simulation of the pulse pile-up effect on the pulse-height spectrum. Nucl. Instrum. Methods B 2009, 267, 3484–3487. [Google Scholar] [CrossRef]
  36. Pascual-Izarra, C.; Barradas, N.P. Introducing routine pulse height defect corrections in IBA. Nucl. Instrum. Methods B 2008, 266, 266–270. [Google Scholar] [CrossRef]
  37. Barradas, N.P. Rutherford backscattering analysis of thin films and superlattices with roughness. J. Phys. D Appl. Phys. 2001, 34, 2109–2116. [Google Scholar] [CrossRef] [Green Version]
  38. Simon, A.; Jeynes, C.; Webb, R.P.; Finnis, R.; Tabatabaian, Z.; Sellin, P.J.; Breese, M.B.H.; Fellows, D.F.; van den Broek, R.; Gwilliam, R.M. The new Surrey ion beam analysis facility. Nucl. Instrum. Methods B 2004, 219, 405–409. [Google Scholar] [CrossRef]
  39. Grime, G.W.; Dawson, M. Recent developments in data acquisition and processing on the Oxford scanning proton microprobe. Nucl. Instrum. Methods B 1995, 104, 107–113. [Google Scholar] [CrossRef]
  40. Blaauw, M.; Campbell, J.L.; Fazinić, S.; Jakšić, M.; Orlic, I.; van Espen, P. The 2000 IAEA intercomparison of PIXE spectrum analysis software. Nucl. Instrum. Methods B 2002, 189, 113–122. [Google Scholar] [CrossRef]
  41. Jeynes, C.; Barradas, N.P.; Marriott, P.K.; Boudreault, G.; Jenkin, M.; Wendler, E.; Webb, R.P. Elemental thin film depth profiles by ion beam analysis using simulated annealing-a new tool. J. Phys. D 2003, 36, R97. [Google Scholar] [CrossRef] [Green Version]
  42. Boudreault, G.; Jeynes, C.; Wendler, E.; Nejim, A.; Webb, R.P.; Wätjen, U. Accurate RBS measurement of ion implant doses in silicon. Surf. Interface Anal. 2002, 33, 478–486. [Google Scholar] [CrossRef]
  43. Barradas, N.P.; Arstila, K.; Battistig, G.; Bianconi, M.; Dytlewski, N.; Jeynes, C.; Kótai, E.; Lulli, G.; Mayer, M.; Rauhala, E.; et al. Summary of “IAEA intercomparison of IBA software”. Nucl. Instrum. Methods B 2008, 266, 1338–1342. [Google Scholar] [CrossRef] [Green Version]
  44. Pascual-Izarra, C.; Barradas, N.P.; Reis, M.A.; Jeynes, C.; Menu, M.; Lavedrine, B.; Ezrati, J.J.; Röhrs, S. Towards truly simultaneous PIXE and RBS analysis of layered objects in cultural heritage. Nucl. Instrum. Methods B 2007, 261, 426–429. [Google Scholar] [CrossRef]
Figure 1. Raman spectra for all samples. For each sample, two measurements were acquired, and the results in the figure are the average of both.
Coatings 13 00092 g001
Figure 2. Evolution of m/IG with methane flow rate for the a-C(W):H coatings.
Coatings 13 00092 g002
Figure 3. Raman analysis of the coatings deposited with different CH4 flows: (a) G position and FWHM (G) and (b) ID/IG.
Coatings 13 00092 g003
Figure 4. Optical micrographs of the scratch test: (a) coating deposited on steel substrates with 40 sccm of CH4, (b) coating deposited with 20 sccm of CH4.
Coatings 13 00092 g004
Figure 5. Evolution of the hardness and Young’s modulus with the increase of the CH4 flow.
Coatings 13 00092 g005
Figure 6. Typical indentation curves for coatings deposited with three different flows of CH4.
Coatings 13 00092 g006
Figure 7. Tribological characterization of the coatings: (a) coefficient of friction (COF) plots for all coatings, (b) evolution of the average COF with the increase in the CH4 flow, (c) coating and ball-wear rate with the increase in the CH4 flow.
Coatings 13 00092 g007
Figure 8. Optical micrograph of the sliding ball after the test with coating deposited with (a) 10 sccm of CH4, (b) 40 sccm of CH4.
Coatings 13 00092 g008
Table 1. Coating composition (by IBA) and density (by IBA and profilometer) together with deposition rate, all as a function of methane flow rate.
CH4
(sccm)
H
(at.%)
C
(at.%)
W
(at.%)
Ar
(at.%)
O
(at.%)
Density
(g/cm3)
1026.4 ± 1.365.6 ± 3.35.0 ±0.251.58 ± 0.081.40 ± 0.073.9 ± 0.20
1526.6 ± 1.365.8 ± 3.34.6 ±0.231.50 ± 0.081.50 ± 0.083.6 ± 0.18
2028.3 ± 1.464.9 ± 3.24.3 ±0.221.00 ± 0.051.50 ± 0.083.2 ± 0.16
2529.1 ± 1.565.5 ± 3.34.0 ± 0.200.45 ± 0.020.90 ± 0.053.4 ± 0.17
3030.8 ± 1.564.3 ± 3.23.5 ± 0.130.20 ± 0.011.30 ± 0.073.0 ± 0.15
4030.5 ± 1.565.1 ± 3.32.9 ± 0.150.04 ± 0.001.40 ± 0.072.1 ± 0.11
Disclaimer/Publisher’s Note: The statements, opinions and data contained in all publications are solely those of the individual author(s) and contributor(s) and not of MDPI and/or the editor(s). MDPI and/or the editor(s) disclaim responsibility for any injury to people or property resulting from any ideas, methods, instructions or products referred to in the content.