Abstract
Correlation studies about NOD1 and histones have not been reported. In the present study, we report the functional correlation between NOD1 and the histone H2A variant in response to Streptococcus agalactiae infection. In zebrafish, NOD1 deficiency significantly promoted S. agalactiae proliferation and decreased larval survival. Transcriptome analysis revealed that the significantly enriched pathways in NOD1−/− adult zebrafish were mainly involved in immune and metabolism. Among 719 immunity-associated DEGs at 48 hpi, 74 DEGs regulated by NOD1 deficiency were histone variants. Weighted gene co-expression network analysis identified that H2A, H2B, and H3 had significant associations with NOD1 deficiency. Above all, S. agalactiae infection could induce the expression of intracellular histone H2A, as well as NOD1 colocalized with histone H2A, both in the cytoplasm and cell nucleus in the case of S. agalactiae infection. The overexpression of H2A variants such as zfH2A-6 protected against S. agalactiae infection and could improve cell survival in NOD1-deficient cells. Furthermore, NOD1 could interact with zfH2A-6 and cooperate with zfH2A-6 to inhibit the proliferation of S. agalactiae. NOD1 also showed a synergetic effect in inducing the expression of many antibacterial genes, especially antibacterial pattern recognition receptors PGRP2, PGRP5, and PGRP6. Collectively, these results firstly highlight the roles of NOD1 deficiency in the regulation of immune-related and metabolic pathways, and the correlation between zebrafish NOD1 and histone H2A variant in the defense against S. agalactiae infection.
1. Introduction
Streptococcus agalactiae, also known as Group B Streptococcus (GBS), is a Gram-positive bacteria, which infects a variety of hosts. Among them, the most commonly studied species are humans, cattle, and fish [1]. In humans, GBS is an important cause of neonatal meningitis, pneumonia, sepsis, and other severe invasive diseases in neonates and other infants, pregnant women, immunocompromised individuals, and older adults [2,3,4,5]. In teleost, streptococcal infections are responsible for global economic losses in farmed tilapia [6]. In addition to tilapia, S. agalactiae is also a major pathogen infecting other saltwater or freshwater fish, such as Javanese medaka Oryzias javanicus [7], giant Queensland grouper Epinephelus lanceolatus [8], cultured golden pomfret Trachinotus blochii [9], and olive flounder Paralichthys olivaceus [10].
In mammals and teleost fish, the innate immune response has been shown to play a vital role in controlling in vivo growth of S. agalactiae. Upon infection, the host innate immune system senses S. agalactiae by distinct classes of pattern recognition receptors (PRRs) such as Toll-like receptors (TLRs) and NOD-like receptors (NLRs) [11,12,13,14]. It has been found that S. agalactiae releases diacylated molecules to interact with TLR2/TLR6, which is critical for limiting bacterial dissemination and systemic inflammation in mice [15]. TLR13a and TLR13b from Nile tilapia can combine with the 23S rRNA of S. agalactiae [16]. S. agalactiae is also controlled by caspase-1-mediated innate immune response, which is activated by the assembly of the NLRP3 inflammasome, consisting of the sensor NLRP3, the adaptor-apoptosis-associated speck-like protein ASC, and the effector protein caspase-1. The mice lacking NLRP3, ASC, or caspase-1 were more susceptible to S. agalactiae infection than the wild-type mice [14]. Nucleotide-binding oligomerization domain-containing 1/2 (NOD1/NOD2) and NLRP3 are two groups of well-characterized NLRs. Different from NLRP3, NOD2 did not contribute to host defense against S. agalactiae in adult mice [17]. Whether NOD1 plays a major role in the pathogenesis of S. agalactiae remains to be resolved.
Five major classes of histones including H1, H2A, H2B, H3, and H4 are fundamental structural components of chromatin, which have been implicated in the regulation of chromatin remodeling, DNA repair, transcriptional activity, and individual development by histone posttranslational modifications [18,19]. Many pathogens such as Listeria monocytogenes have evolved to exploit epigenetic histone modifications and chromatin remodeling to modulate the host response during infection [20,21]. The antimicrobial activities of histones were also reported. Histones can act as antimicrobial peptides and directly kill bacteria, fungi, parasites, and viruses in a diverse range of organisms from shrimps to humans [22,23,24,25,26]. In addition, histones can trigger inflammatory responses acting through TLRs, including TLR2 and TLR4, which result in death in inflammatory injury [27]. Histones also activate the NLRP3 inflammasome during liver hepatic ischemia/reperfusion (I/R) through the TLR9-dependent generation of reactive oxygen species [28]. However, how histones and their crosstalks with NLRs contribute to host defense against S. agalactiae infection are still unclear.
Receptor-interacting protein 2 (RIP2) is a kinase that is involved in antibacterial signaling of NOD1/NOD2 sensing bacterial peptidoglycans. Our previous reports showed that NOD1 deficiency affected larvae survival in the early ontogenesis via CD44a-mediated PI3K-Akt signaling, which was independent of adaptor protein RIP2 [29,30]. To our surprise, RIP2 deficiency impaired the expression of all of the tested histones, including H2A, H2B, H3, and H4. The overexpression of histone H2A demonstrated an increased survival rate of zebrafish larvae infected with Edwardsiella piscicida, and an increased transcription of many antibacterial genes. The transcription regulations of histone H2A on these antibacterial genes were dependent on RIP2, and no significant changes, even decreased expressions, were observed for these antibacterial genes in RIP2−/− zebrafish [31]. In this work, we firstly describe the functional characterization of NOD1 and the histone H2A variant in response to Gram-positive bacteria S. agalactiae in vitro and in vivo. More importantly, our results reveal that the interaction and cumulative effect exist between NOD1 and the histone H2A variant for protecting against S. agalactiae infection.
2. Results and Discussion
2.1. NOD1 Contributes to Host Defense against S. agalactiae Infection in Adult Zebrafish
Among NLRs, NLRP3 but not NOD2 plays a crucial role in the control of in vivo S. agalactiae growth and in host resistance against S. agalactiae infection. Zebrafish NOD1 is known to be involved in the host recognition of Salmonella enterica and spring viremia of carp virus [32,33], but its role in the host response to S. agalactiae infection has not been described. Previous studies have developed a zebrafish model of S. agalactiae infection by injection to study bacterial and host factors that contribute to disease progression [34,35]. Bath immersion can also be applied to adult zebrafish, but direct injection methods are more frequently used [35]. Therefore, to explore the effect of NOD1 in S. agalactiae infection, WT and NOD1-1IS−/− (NOD1−/− mutants with 1 bp insertion) adult zebrafish were infected intraperitoneally with S. agalactiae according to the method commonly used in streptococcal infections [35]. The bacterial burden in the mixed samples from the liver and spleen at different times post-infection was measured. Compared with WT adult zebrafish, significantly higher bacteria were detected in NOD1-1IS−/− adult zebrafish at 24 and 48 h post-infection (hpi) (Figure 1A). Infected zebrafish were monitored for mortality up to 5 days post-infection (dpi). Notably, S. agalactiae-infected NOD1-1IS−/− adult zebrafish exhibited reduced survival compared with the WT counterparts (Figure 1B). These data show that NOD1 protects against S. agalactiae infection.
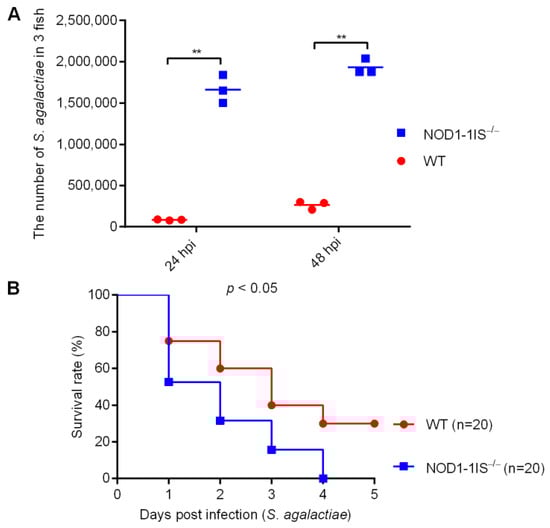
Figure 1.
The effect of zebrafish NOD1 in Streptococcus agalactiae infection. (A) Effect of NOD1 knockdown on the proliferation of S. agalactiae in the mixture of liver and spleen from zebrafish at the age of 7 months. **, p < 0.01. (B) NOD1−/− zebrafish were more sensitive to S. agalactiae infection compared with the WT based on the survival rate.
2.2. NOD1 Deficiency Mainly Affects Metabolism and Immune System Processes in Adult Zebrafish in Response to S. agalactiae Infection
Our previous study revealed that the significantly enriched pathways were mainly involved in the metabolism and immune system for zebrafish larvae from WT and NOD1-1IS−/− collected at 10 dpf [29]. Signaling pathways regulated by NOD1 deficiency are still unclear in adult zebrafish in the case of bacterial infection. The systemic infection caused by the intraperitoneal injection was associated with the expansion of S. agalactiae in the blood, and S. agalactiae was found in the brain vasculature after 24 h post-injection [34]. As mutations or allele in mammalian NOD1 are known to be associated with susceptibility to inflammatory bowel disease (IBD), which is a chronic immune disorder of the intestine [36,37], the intestines from WT and NOD1-1IS−/− adult zebrafish were used for transcriptome sequencing to make clear the intestinal immune response regulated by NOD1 deficiency with or without S. agalactiae infection. The results showed that a total of 820 genes were considered to be differentially expressed genes (DEGs) for NOD1-1IS−/− vs. the WT group injected with PBS, 5407 DEGs at 24 hpi for NOD1-1IS−/− vs. the WT group infected with S. agalactiae, and 12,240 DEGs at 48 hpi for NOD1-1IS−/− vs. the WT group infected with S. agalactiae, respectively (Table 1). All of the DEGs for each group had an enrichment analysis of the KEGG pathways performed. The most DEGs were found at 48 hpi, and were mainly concentrated in the PI3K-Akt signaling pathway (154 DEGs), cytokine-cytokine receptor interaction (109 DEGs), Th17 cell differentiation (62 DEGs), and other immune-related signaling pathways. The second DEGs were found at 24 hpi, and were mainly concentrated in the complement and coagulation cascades (65 DEGs). The numbers of DEGs were the fewest for the NOD1-1IS−/− vs. WT group without bacterial infection, and were mainly concentrated in the complement and coagulation cascades (36 DEGs), NF-kappa B signaling pathway (16 DEGs), and other signaling pathways (Figure 2 and Supplementary File S1). Furthermore, many signaling pathways related to lipid metabolism, including Glycerophospholipid metabolism (41 DEGs), Glycerolipid metabolism (31 DEGs), Arachidonic acid metabolism (29 DEGs), Steroid hormone biosynthesis (27 DEGs), Sphingolipid metabolism (26 DEGs), Fatty acid degradation (22 DEGs), Ether lipid metabolism (21 DEGs), Primary bile acid biosynthesis (18 DEGs), Linoleic acid metabolism (18 DEGs), alpha-Linolenic acid metabolism (14 DEGs), Biosynthesis of unsaturated fatty acids (13 DEGs), and Steroid biosynthesis (11 DEGs), were significantly enriched at 48 hpi for the NOD1-1IS−/− vs. WT group infected with S. agalactiae (Figure 2 and Supplementary File S1).

Table 1.
Summary of RNAseq profiling in NOD1-1IS−/− vs. WT adult zebrafish without or with S. agalactiae infection.
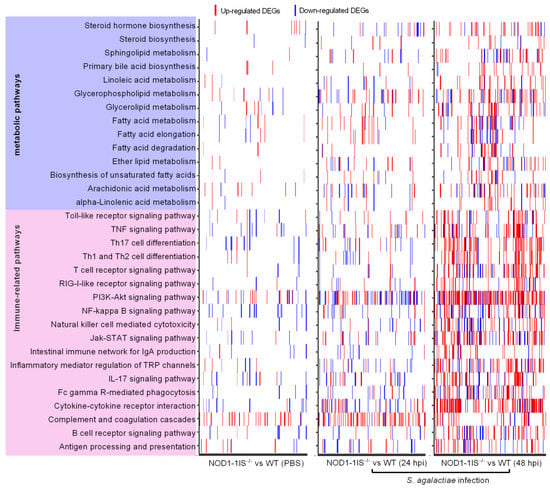
Figure 2.
Heatmap presenting DEG profiles of each of the enriched immune-related and lipid metabolism pathways. The horizontal axis represents DEGs, and the vertical axis represents the enriched pathways. The existence of up-regulated DEG in a pathway is highlighted in red and down-regulated DEG is blue.
A previous report characterized the transcription patterns of the intestines from WT adult zebrafish infected with S. agalactiae. A number of genes involved in the PI3K-Akt signaling pathway (125 DEGs), NOD-like receptor signaling pathway (65 DEGs), T cell receptor signaling pathway (50 DEGs), NF-kappa B signaling pathway (48 DEGs), Toll-like receptor signaling pathway (45 genes), B cell receptor signaling pathway (40 DEGs), and so on, were significantly downregulated at 48 hpi, which suggested the suppression of immune responses observed in the intestines and were consistent with the increasing mortality rate from 1 dpi to 4 dpi [38]. However, in the present study, NOD1 deficiency induced the expression of numerous DEGs involved in these immune signaling pathways in the case of S. agalactiae infection (Figure 3 and Supplementary File S1). Although many of the genes involved in the NOD-like receptor signaling pathway were regulated by NOD1 deficiency, the NOD-like receptor signaling pathway was not one of the significantly enriched pathways. The induced expressions of most immune-related DEGs in the intestines from NOD1-1IS−/− adult zebrafish seem very obscure for us at present, based on the fact that the reduced survival rate was observed in NOD1-1IS−/− adult zebrafish compared with WT counterparts with the S. agalactiae infection (Figure 1B). Different from the results in the intestines, many KEGG pathways, including Cytokine-cytokine receptor interaction (28 DEGs), Apoptosis (25 DEGs), IL-17 signaling pathway (19 DEGs), NF-kappa B signaling pathway (17 DEGs), and Hematopoietic cell lineage (17 DEGs), were significantly enriched for down-regulated DEGs in the skins from the same NOD1-1IS−/− adult zebrafish (Supplementary File S2). As the gut microbiota and its secreted metabolites contribute to regulating transcription, ROS modulation, and inflammation in the gut, they thereby play substantial roles in regulating the host metabolic and immune functions [39,40], which have been shown to act on both NOD1 and NOD2 receptors [41]. S. agalactiae-induced abnormal expression of most immune-related DEGs in the intestines from NOD1-1IS−/− adult zebrafish might be as a result of the outcome of immune imbalances regulated by NOD1 deficiency, the effects of intestinal microbiota and S. agalactiae infection in fatal conditions (100% mortality at 4 dpi). It is interesting to further investigate the effect of piscine NOD1 on the intestinal microbiota composition and activity with or without pathogen infection.
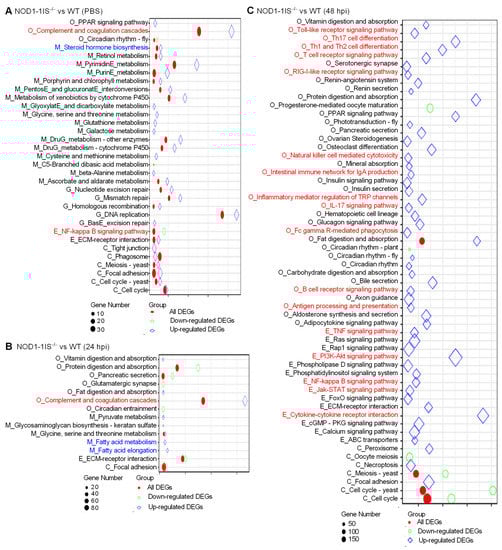
Figure 3.
KEGG enrichment analysis. (A) The KEGG enrichment analysis for DEGs between WT and NOD1-deficiency zebrafish injected with the control PBS. (B) The KEGG enrichment analysis for DEGs between WT and NOD1-deficiency zebrafish infected with S. agalactiae for 24 h. (C) The KEGG enrichment analysis for DEGs between WT and NOD1-deficiency zebrafish infected with S. agalactiae for 48 h. All of the KEGG pathways shown in the figure are significantly enriched (Q-value < 0.05). The x-axis represents the rich factor, and the y-axis indicates the corresponding KEGG pathway. The immune-related pathways are red and the lipid-related pathways are blue. The color and shape of the point indicates the type of DEGs. The size of the point indicates the gene numbers.
2.3. NOD1 Deficiency Regulated the Expression of Histone Variants and those Gene Variants Associated with Bile-Acid Signalling
As RIP2 deficiency impairs the expression of histones [31], and NOD1 is also localized in the nucleus and is associated with chromatin [33], we are quite interested to know whether an interaction exists between NOD1 and histone. We firstly investigated the expression regulations of NOD1 deficiency on the histones through transcriptome analysis. Among the DEGs for NOD1-1IS−/− vs. WT group injected with PBS, two histone variants were identified. The numbers of histone variants were increased to 6 at 24 hpi for NOD1-1IS−/− vs. WT group infected with S. agalactiae, and 74 at 48 hpi for NOD1-1IS−/− vs. WT group infected with S. agalactiae (Table 1 and Figure 4A). Especially at 48 hpi for the NOD1-1IS−/− vs. WT group infected with S. agalactiae, 5 H1 variants, 27 H2A variants, 8 H2B variants, 14 H3 variants, and 13 H4 variants were significantly decreased by NOD1 deficiency (Figure 4A). All these data suggest that NOD1-RIP2 signaling regulated the transcription of histones.
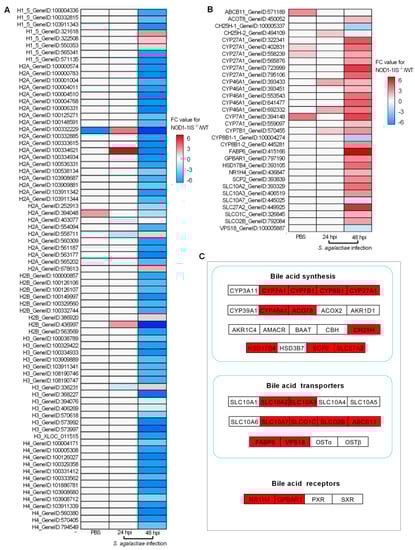
Figure 4.
The effect of NOD1 deficiency on the transcriptional regulation of histones and many of the genes involved in bile acid metabolism. (A) Heatmap of differently expressed histones. (B) Heatmap of bile acid-related DEGs. (C) The expression trends of bile acid-related genes involved in bile acid synthesis, bile acid transporters, and bile acid receptors. The genes in red background were found to be differently expressed in the present study.
Many studies have shown that bile acids and their receptors are involved in immune regulation of the host, in addition to playing a crucial role in glucose and lipid metabolism. Bile acids significantly regulate host immune function by activating G protein-coupled bile acid receptor 1 (TGR5, also known as GPBAR1) and FXR (namely NR1H4) receptors, causing changes in the host’s ability to resist bacteria, virus, and parasites [42,43,44]. Bile acids also activate the PKA-NLRP3 pathway through the TGR5 receptor, thereby improving the pathogenesis of inflammatory diseases including sepsis, celitis, and type 2 diabetes mellitus by inhibiting NLRP3 inflammasome [45]. Although the correlation between the NOD1 and bile acid metabolism has never been reported, research has shown that NOD2 deficiency resulted in an increased renal excretion of bile acids, which was mediated by an increased expression of the bile acid efflux transporters MRP2 and MRP4 in mice. This regulation of NOD2 deficiency on the hepatic bile acid concentration in turn significantly affected hepatocyte death and cholestatic liver disease [46]. Furthermore, it was suggested that bile acid receptors TGR5 and FXR might be therapeutic targets for digestive diseases and inflammatory diseases, including IBD [47,48,49,50,51]. Interestingly, in teleost, we demonstrated the conserved antiviral role of GPBAR1 and its function in regulating glycerophospholipids metabolism [52]. In the present study, we found that 51, 117, and 282 lipid-related DEGs were regulated by NOD1 deficiency in the NOD1-1IS−/− vs. WT group injected with PBS, the NOD1-1IS−/− vs. WT group infected with S. agalactiae for 24 h, and the NOD1-1IS−/− vs. WT group infected with S. agalactiae for 48 h, respectively. Among them, 4, 4, and 30 DEGs involved in bile-acid signaling were regulated by NOD1 deficiency in NOD1-1IS−/− vs. WT group injected with PBS, NOD1-1IS−/− vs. WT group infected with S. agalactiae for 24 h, and NOD1-1IS−/− vs. WT group infected with S. agalactiae for 48 h, respectively (Table 1 and Figure 4B). Especially at 48 hpi for the NOD1-1IS−/− vs. WT group infected with S. agalactiae, 10 bile acid synthesis related genes, 8 bile acid transport related genes, and 2 bile acid receptor genes were found to be associated with NOD1 (Figure 4C). All of these results suggest that NOD1 may regulate bile acid metabolism and influence metabolic diseases via crosstalk with bile acid receptors such as NR1H4 and GPBAR1. In future work, we would like to further study how the mutual regulation and interaction between NOD1 and bile acid receptors affect the occurrence of infectious diseases or metabolic diseases.
The expressions of 6 histones and 32 genes involved in bile acid metabolism were further confirmed by qRT-PCR in the NOD1-1IS−/− vs. WT groups infected with S. agalactiae for 48 h. Nucleotide polymorphism of H2A, H2B, H3, and H4 could not be distinguished by qRT-PCR, and the total expressions of H2A, H2B, H3, or H4 were detected by qRT-PCR (Figure 5A). At 48 hpi, the expression of all of the 38 genes tested was in agreement with the transcriptome data (Figure 5). Most histone genes were down-regulated by NOD1 deficiency (Figure 5A), however more genes involved in bile acid metabolism were up-regulated by NOD1 deficiency (Figure 5B). These results suggest that NOD1 deficiency does regulate the expressions of histones and bile acid metabolism-related genes.
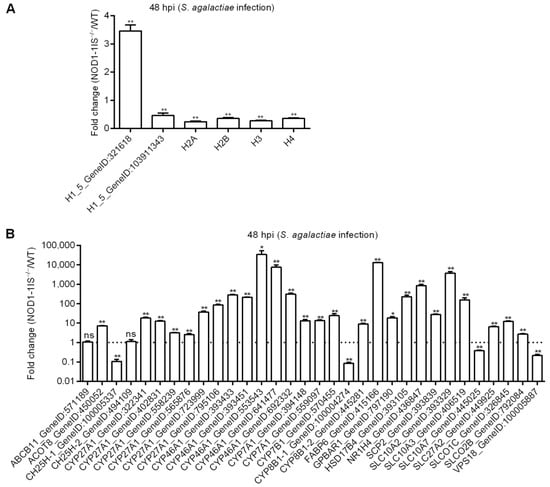
Figure 5.
Validation of differential expression by qRT-PCR. (A) The expressions of candidate DEGs for histone variants confirmed by qRT-PCR. (B) The expressions of candidate DEGs for bile acid metabolism-related genes confirmed by qRT-PCR. Data represent the means ± the SEM and are tested for statistical significance using two-tailed student’s t-test. *, p < 0.05; **, p < 0.01; ns, not significant.
2.4. Interaction Network Analysis of DEGs Related to Immunity and Metabolism Regulated by NOD1 Deficiency
WGCNA correlation analysis was performed on those DEGs related to immunity and metabolism. After ranking the edge weight of each connection, the first 500 edges were selected for visualization (all edges were selected for groups less than 500). The results showed that after screening, the lowest edge weight of the NOD1-1IS−/− vs. WT group without infection was 0.8307. The lowest edge weight of the NOD1-1IS−/− vs. WT group infected with S. agalactiae for 24 h was 0.9224, and was 0.9449 for the NOD1-1IS−/− vs. WT group infected with S. agalactiae for 48 h. These three groups contain 107, 89, and 172 nodes, respectively, and all these nodes belong to the same module.
The results of the WGCNA correlation analysis showed that some lipid metabolism genes are closely related to immune-related genes (Figure 6). More complement genes including C2, C3, C5, C8A, C8B, and C9 were found in the NOD1-1IS−/− vs. WT group without infection (Figure 6A). Relatively few complement genes, including C3, C7, C8A, and C8G, were found in the NOD1-1IS−/− vs. WT group infected with S. agalactiae for 24 h (Figure 6B). However, only C6 was found in the NOD1-1IS−/− vs. WT group infected with S. agalactiae for 48 h (Figure 6C). Histone H2A and bile acid synthesis gene CYP7A1 play important roles in the NOD1-1IS−/− vs. WT group without infection, but not critical in NOD1-1IS−/− vs. WT group infected with S. agalactiae for 24 h (Figure 6A,B). More DEGs related to lipid metabolism, including SLC10A2, SLC27A2, SLCO2B, SCP2, and so on, were found in the NOD1-1IS−/− vs. WT group infected with S. agalactiae for 48 h. Bile acid transport associated protein SLC10A2 and histone H2B were critical in the NOD1-1IS−/− vs. WT group infected with S. agalactiae for 48 h (Figure 6C). The WGCNA-derived “hub proteins” for H2A, H2B, H3, and DEGs related to lipid metabolism are beneficial for us to capture data for identifying novel histone binding complexes and reconstructing metabolic networks.
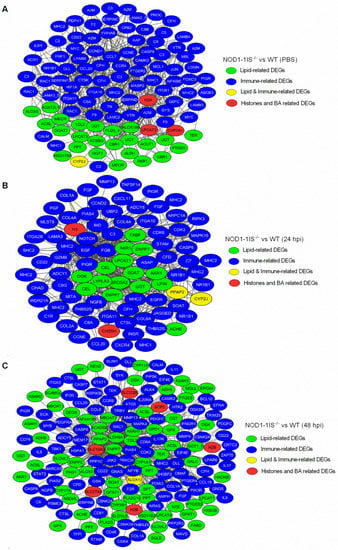
Figure 6.
Co-occurrence network relationship among immune-related and metabolism-related DEGs via WGCNA analysis. (A) Co-occurrence network relationship among immune-related and metabolism-related DEGs in the NOD1-1IS−/− vs. WT groups injected with PBS. (B) Co-occurrence network relationship among immune-related and metabolism-related DEGs in NOD1-1IS−/− vs. WT group infected with S. agalactiae for 24 h. (C) Co-occurrence network relationship among immune-related and metabolism-related DEGs in the NOD1-1IS−/− vs. WT groups infected with S. agalactiae for 48 h. The node color indicates the biological function of each node.
2.5. Histone H2A Is Translocated to the Cytoplasm and Colocalizes with NOD1 in the Case of S. agalactiae Infection
Histones are synthesized in the cytoplasm, and rapidly imported into the nucleus by association with specific nuclear import receptors such as karyopherins (Kaps) or importins to promote their own nuclear localization [53,54,55]. However, after treatment with bleomycin, histone H1.2 was translocated from the nucleus to the mitochondria and co-localized with Bak in the mitochondria [56]. In apoptotic microglia, histone H3 did not stay concealed in the nucleus, and was found to leak from the nucleus into the cytoplasm [57]. In the present study, endogenous histone H2A was detected in the nucleus from the uninfected ZF4 cells, whereas no staining was observed in the cytoplasm using the anti-H2A antibody (Figure 7A). Endogenous histone H2A was distributed in the nucleus and cytoplasm in the ZF4 cells infected with S. agalactiae using anti-H2A antibody (Figure 7B). Furthermore, the merged images confirmed that NOD1 was colocalized with histone H2A both in the cytoplasm and cell nucleus in the case of S. agalactiae infection (Figure 7B). Although further studies are necessary to elucidate the regulatory mechanisms of histone H2A from the nucleus to the cytoplasm, our results suggest that NOD1 appears to be strongly linked with histone H2A.
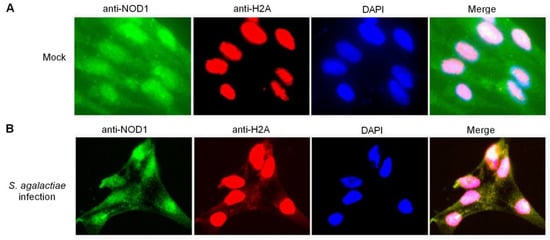
Figure 7.
The colocalization between NOD1 and histone H2A in ZF4 cells. (A) The colocalization between NOD1 and histone H2A in mock-infected ZF4 cells. (B) The colocalization between NOD1 and histone H2A in the ZF4 cells infected with S. agalactiae.
2.6. NOD1 Interacts and Cooperates with Histone H2A Variant to Protect against S. agalactiae Infection
Our previous study showed the antibacterial property of the complete histone H2A against Gram-negative bacteria E. piscicida [31]. We also found that nucleotide polymorphisms existed for zebrafish and grass carp H2A, and that nucleotide polymorphisms of piscine H2A significantly affected the antibacterial activities of piscine H2A [58]. In the present study, we selected a zebrafish histone H2A variant (zfH2A-6, GenBank accession number MT726195) with an antibacterial effect against E. piscicida infection for further study. Similar to the effect of zfH2A-6 in E. piscicida infection, the overexpression of zfH2A-6 significantly inhibited the bacteria proliferation of S. agalactiae in zebrafish larvae (Figure 8A). In the case of S. agalactiae infection, NOD1 deficiency enormously impaired cell survival, whereas the overexpression of zfH2A-6 in WT and NOD1-deficient cells promoted cell survival, which suggest that the effect of zfH2A-6 in promoting cell survival is independent of NOD1. Remarkably, the overexpression of zfH2A-6 in NOD1-deficient cells completely rescued the impaired cell survival caused by NOD1 deficiency (Figure 8B). As both NOD1 and zfH2A-6 significantly inhibited the bacteria proliferation of S. agalactiae and promoted the cell survival of infected cells, and that NOD1 deficiency decreased the expression of histone H2A, we concluded that the effect of NOD1 in the defense against S. agalactiae infection was associated with H2A. Furthermore, compared with the group alone transfected with NOD1 or zfH2A-6, the transient cotransfection of NOD1 and zfH2A-6 showed a cumulative antibacterial effect against S. agalactiae infection (Figure 8C), which indicated that the antibacterial activities of NOD1 and zfH2A-6 against S. agalactiae infection were not functionally redundant and antagonistic.
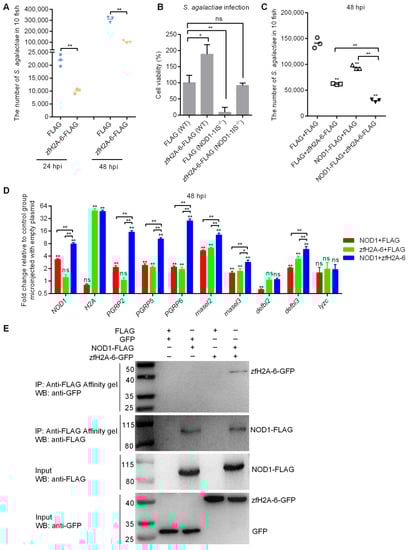
Figure 8.
The effects of NOD1 and zfH2A-6 in the defense against S. agalactiae infection. (A) The effect of zfH2A-6 overexpression in the zebrafish larvae on the proliferation of S. agalactiae. (B) The effect of zfH2A-6 on the cell survival in WT and NOD1-deficient cells with S. agalactiae infection. (C) The effect of NOD1 on the antibacterial effect against S. agalactiae infection with or without the existence of zfH2A-6. (D) The transcription regulation of NOD1 on the antibacterial genes in the case of S. agalactiae infection with or without the existence of zfH2A-6. Data are expressed as mean ± SEM of three independent experiments. * p < 0.05; ** p < 0.01; ns—not significant. The asterisk above the error bars indicate statistical significance using the group transfected with empty plasmid as the control group. The asterisk above the bracket indicate statistical significance between the two groups connected by the bracket. (E) NOD1 interacts with zfH2A-6. The interaction between FLAG and GFP or zfH2A-6 is used as the negative controls.
To further define the possible mechanisms in which zebrafish NOD1 and zfH2A-6 protect against S. agalactiae infection, the expressions of the antibacterial genes, including PGRP2, PGRP5, PGRP6, defbl2, defbl3, rnasel2, rnasel3, and lyzc, were examined by qRT-PCR. In the WT zebrafish with S. agalactiae infection, NOD1 overexpression induced the transcription of many antibacterial genes, including NOD1 (3.2-fold), PGRP2 (2.2-fold), PGRP5 (2.4-fold), PGRP6 (2.0-fold), rnasel2 (5.1-fold), rnasel 3 (1.4-fold), and defbl3 (2.0-fold), and showed a decreased expression for defbl2 and no significant change for lyzc, whereas zfH2A-6 overexpression significantly increased the transcription of H2A (46.2-fold), PGRP5 (2.1-fold), PGRP6 (1.8-fold), rnasel2 (6.2-fold), rnasel 3 (1.6-fold), and defbl3 (3.6-fold). NOD1 together with zfH2A-6 synergistically increased the transcription of NOD1 (7.5-fold), PGRP2 (15.1-fold), PGRP5 (10.1-fold), and PGRP6 (25.1-fold), and cumulatively increased the transcription of rnasel2 (11.2-fold), rnasel 3 (2.7-fold), and defbl3 (6.9-fold) (Figure 8D).
To check whether NOD1 physically interacts with the histone H2A variant, we performed co-immunoprecipitation in EPC cells. As shown in Figure 8E, no GFP (lane 1) and zfH2A-6 (lane 3) bands were observed, which confirmed that GFP and zfH2A-6 proteins were not pull-downed by FLAG. However, the pull-downed zfH2A-6 proteins by NOD1-FLAG (lane 4) were readily detected by immunoprecipitation analysis, which proved the interaction between NOD1 and zfH2A-6. Furthermore, previous studies have suggested that histones function as an important nuclear DAMP, and some TLRs contributed to histone recognition [59,60]. The interaction between NOD1 and zfH2A-6 in the present study may suggest that NOD1 is another receptor for histone recognition.
In mammals, CIITA and NLRC5 are well-known NLRs with transcriptional functions for inflammasome or MHC genes [61,62]. Our previous study showed that NOD1 was detected in the nucleus and chromatin of piscine and mammalian cells, and may have a regulatory function for gene transcription involved in the immune system [33]. The obvious co-localization and interaction of NOD1 and histone H2A, and the significant synergetic effect of NOD1 and the histone H2A variant in inducing the transcriptions of the upstream antibacterial PRRs may suggest that NOD1 and histone H2A have a strong positive feedback for regulating antibacterial signaling pathways in response to S. agalactiae infection.
3. Materials and Methods
3.1. Bacterial Infection for Adult Zebrafish and Sample Collection
Zebrafish wild-type AB/TU and NOD-1IS−/− mutants were obtained from the China Zebrafish Resource Center (CZRC), and were maintained in an aerated recirculation system at 28 °C with a photoperiod of light/dark (12 h/12 h). For bacterial infection of adult zebrafish, the healthy WT and NOD1-1IS−/− zebrafish at the age of 7 months were divided into two groups. Thirty WT or NOD1-1IS−/− zebrafish were intraperitoneally injected with 10 μL S. agalactiae (6.25 × 10⁵ cfu/μL), and another 30 WT or NOD1-1IS−/− zebrafish for 10 μL of PBS.
Nine fish from WT or NOD1-1IS−/− zebrafish injected with S. agalactiae or PBS (three fish for each sample and three samples for each group) were sacrificed at 24 and 48 hpi. Samples from the intestines and skins were flash-frozen in liquid nitrogen, and used for transcriptome sequencing. Samples from the intestines were also used for qRT-PCR verification. For the plate count or colony count, the mixtures from the liver and spleen were taken and lysed in 500 μL of PBS. The diluted bacterial suspension was plated onto BHI agar, then the CFUs were counted after 16 h of incubation at 37 °C.
Twenty fish for each group were used for the survival assay. The numbers of surviving zebrafish were counted daily for 5 days. GraphPad Prism 6 was used to generate survival curves, and the log-rank test was used to test differences in survival between the WT and NOD1-1IS-/- zebrafish injected with S. agalactiae.
3.2. Bacterial Infection for Zebrafish Larvae and In Vivo Antibacterial Analysis of zfH2A-6 and/or NOD1
The p3 × FLAG-CMV-14 empty plasmid, NOD1-FLAG, or zfH2A-6-FLAG, were diluted to the desired concentration of 100 ng/μL. For the in vivo antibacterial assay of histone zfH2A-6, the p3 × FLAG-CMV-14 empty plasmid or zfH2A-6-FLAG were microinjected into fertilized eggs at the one-cell stage. The typical injected volume was 2 nl. At 4 days after fertilization, the hatched larvae microinjected with p3×FLAG-CMV-14 or zfH2A-6-FLAG were infected with 2 × 10⁸ CFU/mL S. agalactiae. Ten larvae per group were collected at 24 and 48 hpi, and were rinsed and lysed in 1 mL of PBS. The diluted homogenates were plated onto BHI agar, and the CFUs were counted after 12 h of incubation at 37 °C.
For the cumulative antibacterial effect of NOD1 and histone zfH2A-6, the plasmids of p3 × FLAG-CMV-14, zfH2A-6-FLAG, and NOD1-FLAG were microinjected with combination constructs of two plasmids (1:1) into one-stage embryos. At 4 days after fertilization, the hatched larvae microinjected with indicated plasmids were infected with 2 × 10⁸ CFU/mL S. agalactiae. Ten larvae per group were collected at 48 hpi, and were rinsed and lysed in 1 mL of PBS. The diluted homogenates were plated onto BHI agar, and the CFUs were counted after 12 h of incubation at 37 °C.
3.3. Bacterial Infection for Zebrafish WT and NOD1−/− Cell Lines and Cell Counting kit-8 (CCK-8) Assay
Primary cell cultures were developed from caudal fins of WT and NOD1-1IS−/− mutants at the age of 1 month, and were successfully subcultured to the stable cell lines designated as WT or NOD1−/− caudal fin-derived cell lines by the tissue block adherent method. The cells beyond 50 passages were used for the CCK-8 assay (Beyotime, Wuhan, China). Approximately 104 WT or NOD1−/− caudal fin-derived cells were seeded overnight in 96-well plates, and then infected with S. agalactiae with the MOI of 1 after 24 h. At 6 hpi, 10 μL CCK-8 reagent was added to a 90 μL DMEM/F12 culture medium to generate a working solution, of which 100 μL was added per well and was incubated for 2 h. The absorbance at 450 nm was measured by a PerkinElmer’s EnSpire Multilabel Plate Reader.
3.4. cDNA Library Construction and Illumina Deep Sequencing
The total RNA was isolated from the intestines or skins of the WT and NOD1-1IS−/− zebrafish injected with PBS or S. agalactiae at 24 hpi and 48 hpi using TRIzol® Reagent (Invitrogen) according to the manufacturer’s introduction. RNA integrity was assessed using an Agilent 2100 bioanalyzer (Agilent, Santa Clara, CA, USA). Samples with RNA integrity numbers (RINs) ≥7.5 were subjected to cDNA library construction using the TruseqTM RNA sample prep Kit (Illumina). To identify the DEGs between the WT and NOD1-1IS−/− adult zebrafish, the expression levels were measured using numbers of fragments per kilobase of transcript per million fragments sequenced (FPKM), and were identified based on FDR (false discovery rate) <0.05, log2FC (fold change (condition 2/condition 1) for a gene) >1 or log2FC < −1. The significantly enriched pathways of these DEGs were determined using the KEGG (Kyoto Encyclopedia of Genes and Genomes) database. Bonferroni correction was used to adjust p-values, and KEGG pathways with adjusted p value (Q-Value) < 0.05 were considered significantly enriched. The FPKMs of DEGs were used for the co-expression network analysis using the WGCNA packages in R [63]. The edge weights were sorted from the highest to the lowest, and the network with the top 500 edges was visualized using Cytoscape_v.3.6.1 [64].
3.5. qRT-PCR Validation of DEGs
qRT-PCR analysis was performed to validate the candidate DEGs for transcriptome samples at 48 hpi under the following conditions: 3 min at 95 °C, followed by 45 cycles of 15 s at 94 °C, 15 s at 54~58 °C, and 30 s at 72 °C. All of the reactions were performed in triplicate in a 96 well plate and the mean value was recorded. The DEGs for validation included H1.1 (NM_199552.1, GeneID:321618), H1.2 (XM_009302911.3, GeneID:103911343), ABCB11 (XM_003199465.5, GeneID:571189), ACOT8 (NM_001006072.1, GeneID:450052), CH25H(XM_021476542.1, GeneID:100005337), CH25H(NM_001008652.1, GeneID:494109), CYP27A1 (NM_001328513.1, GeneID:322341), CYP27A1 (XM_002663399.5, GeneID:402831), CYP27A1 (XM_681430.7, GeneID:558239), CYP27A1 (NM_001123277.1, GeneID:565876), CYP27A1 (XM_009304846.3, GeneID:723999), CYP27A1 (XM_001333968.7, GeneID:795106), CYP46A1 (NM_200461.1, GeneID:393433), CYP46A1 (NM_200479.2, GeneID:393451), CYP46A1 (NM_001020522.1, GeneID:553543), CYP46A1 (NM_001037418.1, GeneID:641477), CYP46A1 (NM_001045298.1, GeneID:692332), CYP7A1 (NM_201173.2, GeneID:394148), CYP7A1 (XM_682404.6, GeneID:559097), CYP7B1 (XM_693936.8, GeneID:570455), CYP8B1 (NM_001110288.1, GeneID:100004274), CYP8B1 (NM_001003736.1, GeneID:445281), FABP6 (NM_001002076.2, GeneID:415166), GPBAR1 (XM_017357898.2, GeneID:797190), HSD17B4 (NM_200136.1, GeneID:393105), NR1H4 (NM_001002574.1, GeneID:436847), SCP2 (NM_200865.2, GeneID:393839), SLC10A2 (NM_200358.1, GeneID:393329), SLC10A3 (NM_214740.1, GeneID:406519), SLC10A7 (NM_001003420.1, GeneID:445025), SLC27A2 (NM_001025299.1, GeneID:449925), SLCO1C (NM_001348086.1, GeneID:326845), SLCO2B (NM_001037678.2, GeneID:792084), and VSP18 (NM_173245.2, GeneID:100005887). The housekeeping gene GAPDH was used for normalizing the cDNA amounts. The primers specific for the interested DEGs are listed in Supplementary Table S1.
3.6. qRT-PCR Analysis of Antibacterial Genes Regulated by NOD1 and/or zfH2A-6
The plasmids of p3×FLAG-CMV-14, zfH2A-6-FLAG, and NOD1-FLAG at a concentration of 100 ng/μL were microinjected with the indicated combination constructs of two plasmids (1:1) into one-stage embryos. At 4 days after fertilization, the hatched larvae were infected with 2 × 10⁸ CFU/mL S. agalactiae. Fifty larvae per group were collected at 48 hpi, and were used for RNA extraction and qRT-PCR using primers specific to the antibacterial genes, including PGRP2, PGRP5, PGRP6, defbl2, defbl3, rnasel2, rnasel3, and lyzc. The primer sequences used for qRT-PCR are described by our previous studies [31,65]. The housekeeping gene GAPDH was used for normalizing the cDNA amounts.
3.7. Fluorescence Microscopy
ZF4 cells plated overnight onto coverslips in 12-well plates were infected with S. agalactiae with a MOI of 1. At 24 hpi, the cells were washed three times with PBS, fixed for 1h at room temperature by 4% PFA, incubated overnight with the primary antibodies including anti-NOD1 [24] and anti-H2A (catalog no. 12349S, CST), incubated for 1 h with fluorescent labeled secondary antibodies (catalog no. R37121 and A11029; Thermo, Waltham, MA, USA), and finally stained with DAPI (1 μg/mL) for 15 min. The coverslips were observed with a confocal microscope (SP8; Lecia, Wetzlar, Germany).
3.8. Co-Immunoprecipitation (Co-IP) and Western Blotting
To test the interaction between NOD1 and zfH2A-6, the EPC cells were co-transfected with the FLAG empty plasmid, GFP empty plasmid, NOD1-FLAG, or zfH2A-6-GFP with the indicated combinations of two plasmids (1:1). At 48 h post-transfection, the cells were washed with ice-cold PBS three times and then lysed in a Pierce™ IP lysis buffer (Thermo Scientific™, Waltham, MA, USA #87787) containing Protease Inhibitor Cocktail (Thermo Scientific™, #78430). Co-IP was performed using a FLAG Tagged Protein Immunoprecipitation Kit (Sigma, St. Louis, MO, USA) according to the manufacturer’s manual. The total lysate and eluted proteins were analyzed by Western blotting using monoclonal mouse anti-FLAG antibody (Sigma, St. Louis, MO, USA, F3165) and anti-TurboGFP polyclonal antibody (Evrogen, Moscow, Russia, CAT. # AB513).
3.9. Statistical Analysis
Significance testing in the cumulative survival analysis used log-rank test in GraphPad Prism 6. Expression data by qRT-PCR are presented as means and standard error of mean (SEM). Two-tailed Student’s t-test or ANOVA were used to compare the means and SEM between groups. All of the data are representative of three biologic replications. The level of significance is shown as follows: * p < 0.05; ** p < 0.01.
4. Conclusions
S. agalactiae is a kind of Gram-positive bacteria that exists widely in the natural world, and can cause enormous economic losses both for saltwater and farmed freshwater fish. In the present study, we firstly reported that NOD1 and histone H2A variant contribute to host defense against S. agalactiae infection in teleost. The transcriptional regulations of NOD1 deficiency on the histone variants and those gene variants associated with bile-acid signaling were characterized, along with immune-related and metabolic pathways regulated by NOD1 in response to S. agalactiae infection. Furthermore, the colocalization, interaction, and functional correlation between NOD1 and the histone H2A variant in the defense against S. agalactiae infection were confirmed. Further studies are required to address how the crosstalks between NOD1 and other histone variants or bile acid receptors affect the occurrence of infectious diseases and/or metabolic diseases.
Supplementary Materials
The following are available online at https://www.mdpi.com/article/10.3390/antibiotics10070861/s1, File S1: The significantly enriched pathways in intestines, File S2: The significantly enriched pathways in skins, Table S1: Primer information.
Author Contributions
Conceptualization, M.C.; data curation, M.C.; formal analysis, M.C.; investigation, X.W., H.F., and J.Z.; methodology, X.W. and M.C.; resources, M.C.; software, X.W., F.X., and M.C.; Supervision, M.C.; writing—original draft, M.C., X.W., and F.X.; writing—review and editing, M.C. All of the authors have read and agreed to the published version of the manuscript. All authors have read and agreed to the published version of the manuscript.
Funding
This work was supported by the Wuhan Application Foundation Frontier Project (2019020701011467) and the National Natural Science Foundation of China (31873046).
Institutional Review Board Statement
All animal experiments were conducted in accordance with the Guiding Principles for the Care and Use of Laboratory Animals and were approved by the Institute of Hydrobiology, Chinese Academy of Sciences (Approval ID: IHB 2013724).
Informed Consent Statement
Not applicable.
Data Availability Statement
The data is available in this manuscript.
Conflicts of Interest
The authors declare no conflict of interest. The funders had no role in the design of the study; in the writing of the manuscript, and in the decision to publish the results.
References
- Chen, S.L. Genomic Insights into the Distribution and Evolution of Group B Streptococcus. Front. Microbiol. 2019, 10, 1447. [Google Scholar] [CrossRef] [Green Version]
- Berardi, A.; Tzialla, C.; Riva, M.; Cerbo, R.M.; Creti, R. Group B streptococcus: Early- and late-onset infections. J. Chemother. 2007, 19 (Suppl. 2), 24–27. [Google Scholar] [CrossRef]
- Schuchat, A. Epidemiology of group B streptococcal disease in the United States: Shifting paradigms. Clin. Microbiol. Rev. 1998, 11, 497–513. [Google Scholar] [CrossRef] [Green Version]
- Farley, M.M. Group B streptococcal disease in nonpregnant adults. Clin. Infect. Dis. 2001, 33, 556–561. [Google Scholar] [CrossRef] [Green Version]
- Raabe, V.N.; Shane, A.L. Group B Streptococcus (Streptococcus agalactiae). Microbiol. Spectr. 2019, 7. [Google Scholar] [CrossRef] [PubMed] [Green Version]
- Klesius, P.H.; Shoemaker, C.A.; Evans, J.J. Streptococcus: A worldwide fish health problem. In Proceedings of the 8th International Symposium on Tilapia in Aquaculture; Ag. Press Unit Abbassa: Cairo, Egypt, 2008; pp. 83–107. [Google Scholar]
- Amal, M.N.A.; Zarif, S.T.; Suhaiba, M.S.; Aidil, M.R.M.; Shaqinah, N.N.; Zamri-Saad, M.; Ismail, A. The effects of fish gender on susceptibility to acute Streptococcus agalactiae infection in Javanese medaka Oryzias javanicus. Microb. Pathog. 2018, 114, 251–254. [Google Scholar] [CrossRef] [PubMed]
- Bowater, R.O.; Forbes-Faulkner, J.; Anderson, I.G.; Condon, K.; Robinson, B.; Kong, F.; Gilbert, G.L.; Reynolds, A.; Hyland, S.; McPherson, G.; et al. Natural outbreak of Streptococcus agalactiae (GBS) infection in wild giant Queensland grouper, Epinephelus lanceolatus (Bloch), and other wild fish in northern Queensland, Australia. J. Fish. Dis. 2012, 35, 173–186. [Google Scholar] [CrossRef] [PubMed]
- Chong, S.M.; Wong, W.K.; Lee, W.Y.; Tan, Z.B.; Tay, Y.H.; Teo, X.H.; Chee, L.D.; Fernandez, C.J. Streptococcus agalactiae outbreaks in cultured golden pomfret, Trachinotus blochii (Lacepede), in Singapore. J. Fish. Dis. 2017, 40, 971–974. [Google Scholar] [CrossRef]
- Baeck, G.W.; Kim, J.H.; Gomez, D.K.; Park, S.C. Isolation and characterization of Streptococcus sp. from diseased flounder (Paralichthys olivaceus) in Jeju Island. J. Vet. Sci. 2006, 7, 53–58. [Google Scholar] [CrossRef] [Green Version]
- Bergstrøm, B.; Aune, M.H.; Awuh, J.A.; Kojen, J.F.; Blix, K.J.; Ryan, L.; Flo, T.H.; Mollnes, T.E.; Espevik, T.; Stenvik, J. TLR8 Senses Staphylococcus aureus RNA in Human Primary Monocytes and Macrophages and Induces IFN-β Production via a TAK1-IKKβ-IRF5 Signaling Pathway. J. Immunol. 2015, 195, 1100–1111. [Google Scholar] [CrossRef] [Green Version]
- Mancuso, G.; Midiri, A.; Beninati, C.; Biondo, C.; Galbo, R.; Akira, S.; Henneke, P.; Golenbock, D.; Teti, G. Dual role of TLR2 and myeloid differentiation factor 88 in a mouse model of invasive group B streptococcal disease. J Immunol. 2004, 172, 6324–6329. [Google Scholar] [CrossRef] [Green Version]
- Mancuso, G.; Gambuzza, M.; Midiri, A.; Biondo, C.; Papasergi, S.; Akira, S.; Teti, G.; Beninati, C. Bacterial recognition by TLR7 in the lysosomes of conventional dendritic cells. Nat. Immunol. 2009, 10, 587–594. [Google Scholar] [CrossRef]
- Costa, A.; Gupta, R.; Signorino, G.; Malara, A.; Cardile, F.; Biondo, C.; Midiri, A.; Galbo, R.; Trieu-Cuot, P.; Papasergi, S.; et al. Activation of the NLRP3 inflammasome by group B streptococci. J. Immunol. 2012, 188, 1953–1960. [Google Scholar] [CrossRef]
- Santos-Sierra, S.; Golenbock, D.T.; Henneke, P. Toll-like receptor-dependent discrimination of streptococci. J. Endotoxin Res. 2006, 12, 307–312. [Google Scholar] [CrossRef] [PubMed]
- Gao, F.Y.; Pang, J.C.; Wang, M.; Lu, M.X.; Liu, Z.G.; Cao, J.M.; Ke, X.L.; Yi, M.M. Structurally diverse genes encode TLR13 in Nile tilapia: The two receptors can recognize Streptococcus 23S RNA and conduct signal transduction through MyD88. Mol. Immunol. 2021, 132, 60–78. [Google Scholar] [CrossRef] [PubMed]
- Lemire, P.; Calzas, C.; Segura, M. The NOD2 receptor does not play a major role in the pathogenesis of Group B Streptococcus in mice. Microb. Pathog. 2013, 65, 41–47. [Google Scholar] [CrossRef] [PubMed]
- Wolffe, A.P. Transcription: In tune with the histones. Cell 1994, 77, 13–16. [Google Scholar] [CrossRef]
- Biterge, B.; Schneider, R. Histone variants: Key players of chromatin. Cell Tissue Res. 2014, 356, 457–466. [Google Scholar] [CrossRef] [PubMed]
- Hamon, M.A.; Batsché, E.; Régnault, B.; Tham, T.N.; Seveau, S.; Muchardt, C.; Cossart, P. Histone modifications induced by a family of bacterial toxins. Proc. Natl. Acad. Sci. USA 2007, 104, 13467–13472. [Google Scholar] [CrossRef] [Green Version]
- Corr, S.C.; O’Neill, L.A. Listeria monocytogenes infection in the face of innate immunity. Cell Microbiol. 2009, 11, 703–709. [Google Scholar] [CrossRef]
- Hoeksema, M.; van Eijk, M.; Haagsman, H.P.; Hartshorn, K.L. Histones as mediators of host defense, inflammation and thrombosis. Future Microbiol. 2016, 11, 441–453. [Google Scholar] [CrossRef] [Green Version]
- Kawasaki, H.; Iwamuro, S. Potential roles of histones in host defense as antimicrobial agents. Infect. Disord. Drug Targets 2008, 8, 195–205. [Google Scholar] [CrossRef] [PubMed]
- Fernandes, J.M.; Kemp, G.D.; Molle, M.G.; Smith, V.J. Anti-microbial properties of histone H2A from skin secretions of rainbow trout, Oncorhynchus mykiss. Biochem. J. 2002, 368, 611–620. [Google Scholar] [CrossRef] [Green Version]
- Patat, S.A.; Carnegie, R.B.; Kingsbury, C.; Gross, P.S.; Chapman, R.; Schey, K.L. Antimicrobial activity of histones from hemocytes of the Pacific white shrimp. Eur. J. Biochem. 2004, 271, 4825–4833. [Google Scholar] [CrossRef]
- Doolin, T.; Gross, S.; Siryaporn, A. Physical Mechanisms of Bacterial Killing by Histones. Adv. Exp. Med. Biol. 2020, 1267, 117–133. [Google Scholar] [PubMed]
- Xu, J.; Zhang, X.; Monestier, M.; Esmon, N.L.; Esmon, C.T. Extracellular histones are mediators of death through TLR2 and TLR4 in mouse fatal liver injury. J. Immunol. 2011, 187, 2626–2631. [Google Scholar] [CrossRef] [PubMed] [Green Version]
- Huang, H.; Chen, H.W.; Evankovich, J.; Yan, W.; Rosborough, B.R.; Nace, G.W.; Ding, Q.; Loughran, P.; Beer-Stolz, D.; Billiar, T.R.; et al. Histones activate the NLRP3 inflammasome in Kupffer cells during sterile inflammatory liver injury. J. Immunol. 2013, 191, 2665–2679. [Google Scholar] [CrossRef] [PubMed]
- Hu, Y.W.; Wu, X.M.; Ren, S.S.; Cao, L.; Nie, P.; Chang, M.X. NOD1 deficiency impairs CD44a/Lck as well as PI3K/Akt pathway. Sci. Rep. 2017, 7, 2979. [Google Scholar] [CrossRef]
- Wu, X.M.; Chen, W.Q.; Hu, Y.W.; Cao, L.; Nie, P.; Chang, M.X. RIP2 Is a Critical Regulator for NLRs Signaling and MHC Antigen Presentation but Not for MAPK and PI3K/Akt Pathways. Front. Immunol. 2018, 9, 726. [Google Scholar] [CrossRef]
- Wu, X.M.; Cao, L.; Nie, P.; Chang, M.X. Histone H2A cooperates with RIP2 to induce the expression of antibacterial genes and MHC related genes. Dev. Comp. Immunol. 2019, 101, 103455. [Google Scholar] [CrossRef]
- Oehlers, S.H.; Flores, M.V.; Hall, C.J.; Swift, S.; Crosier, K.E.; Crosier, P.S. The inflammatory bowel disease (IBD) susceptibility genes NOD1 and NOD2 have conserved anti-bacterial roles in zebrafish. Dis. Model. Mech. 2011, 4, 832–841. [Google Scholar] [CrossRef] [Green Version]
- Wu, X.M.; Zhang, J.; Li, P.W.; Hu, Y.W.; Cao, L.; Ouyang, S.; Bi, Y.H.; Nie, P.; Chang, M.X. NOD1 Promotes Antiviral Signaling by Binding Viral RNA and Regulating the Interaction of MDA5 and MAVS. J. Immunol. 2020, 204, 2216–2231. [Google Scholar] [CrossRef]
- Kim, B.J.; Hancock, B.M.; Del Cid, N.; Bermudez, A.; Traver, D.; Doran, K.S. Streptococcus agalactiae infection in zebrafish larvae. Microb. Pathog. 2015, 79, 57–60. [Google Scholar] [CrossRef] [Green Version]
- Saralahti, A.; Rämet, M. Zebrafish and Streptococcal Infections. Scand. J. Immunol. 2015, 82, 174–183. [Google Scholar] [CrossRef] [Green Version]
- Rubino, S.J.; Selvanantham, T.; Girardin, S.E.; Philpott, D.J. Nod-like receptors in the control of intestinal inflammation. Curr. Opin. Immunol. 2012, 24, 398–404. [Google Scholar] [CrossRef]
- Vasseur, F.; Sendid, B.; Jouault, T.; Standaert-Vitse, A.; Dubuquoy, L.; Francois, N.; Gower-Rousseau, C.; Desreumaux, P.; Broly, F.; Vermeire, S.; et al. Variants of NOD1 and NOD2 genes display opposite associations with familial risk of Crohn’s disease and anti-saccharomyces cerevisiae antibody levels. Inflamm. Bowel Dis. 2012, 18, 430–438. [Google Scholar] [CrossRef]
- Wu, X.M.; Cao, L.; Hu, Y.W.; Chang, M.X. Transcriptomic characterization of adult zebrafish infected with Streptococcus agalactiae. Fish Shellfish Immunol. 2019, 94, 355–372. [Google Scholar] [CrossRef]
- Clark, A.; Mach, N. The Crosstalk between the Gut Microbiota and Mitochondria during Exercise. Front. Physiol. 2017, 8, 319. [Google Scholar] [CrossRef]
- Noureldein, M.H.; Eid, A.A. Gut microbiota and mTOR signaling: Insight on a new pathophysiological interaction. Microb. Pathog. 2018, 118, 98–104. [Google Scholar] [CrossRef] [PubMed]
- Magrone, T.; Jirillo, E. The interplay between the gut immune system and microbiota in health and disease: Nutraceutical intervention for restoring intestinal homeostasis. Curr. Pharm. Des. 2013, 19, 1329–1342. [Google Scholar] [PubMed]
- Inagaki, T.; Moschetta, A.; Lee, Y.K.; Peng, L.; Zhao, G.; Downes, M.; Yu, R.T.; Shelton, J.M.; Richardson, J.A.; Repa, J.J.; et al. Regulation of antibacterial defense in the small intestine by the nuclear bile acid receptor. Proc. Natl. Acad. Sci. USA 2006, 103, 3920–3925. [Google Scholar] [CrossRef] [Green Version]
- Travers, M.A.; Sow, C.; Zirah, S.; Deregnaucourt, C.; Chaouch, S.; Queiroz, R.M.; Charneau, S.; Allain, T.; Florent, I.; Grellier, P. Deconjugated Bile Salts Produced by Extracellular Bile-Salt Hydrolase-Like Activities from the Probiotic Lactobacillus johnsonii La1 Inhibit Giardia duodenalis In vitro Growth. Front. Microbiol. 2016, 7, 1453. [Google Scholar] [CrossRef] [Green Version]
- Hu, M.M.; He, W.R.; Gao, P.; Yang, Q.; He, K.; Cao, L.B.; Li, S.; Feng, Y.Q.; Shu, H.B. Virus-induced accumulation of intracellular bile acids activates the TGR5-β-arrestin-SRC axis to enable innate antiviral immunity. Cell Res. 2019, 29, 193–205. [Google Scholar] [CrossRef] [Green Version]
- Guo, C.; Xie, S.; Chi, Z.; Zhang, J.; Liu, Y.; Zhang, L.; Zheng, M.; Zhang, X.; Xia, D.; Ke, Y.; et al. Bile Acids Control Inflammation and Metabolic Disorder through Inhibition of NLRP3 Inflammasome. Immunity 2016, 45, 802–816. [Google Scholar] [CrossRef] [PubMed] [Green Version]
- Wang, L.; Hartmann, P.; Haimerl, M.; Bathena, S.P.; Sjöwall, C.; Almer, S.; Alnouti, Y.; Hofmann, A.F.; Schnabl, B. Nod2 deficiency protects mice from cholestatic liver disease by increasing renal excretion of bile acids. J. Hepatol. 2014, 60, 1259–1267. [Google Scholar] [CrossRef] [Green Version]
- Wildenberg, M.E.; van den Brink, G.R. FXR activation inhibits inflammation and preserves the intestinal barrier in IBD. Gut 2011, 60, 432–433. [Google Scholar] [CrossRef]
- Alemi, F.; Poole, D.P.; Chiu, J.; Schoonjans, K.; Cattaruzza, F.; Grider, J.R.; Bunnett, N.W.; Corvera, C.U. The receptor TGR5 mediates the prokinetic actions of intestinal bile acids and is required for normal defecation in mice. Gastroenterology 2013, 144, 145–154. [Google Scholar] [CrossRef]
- Ding, L.; Yang, L.; Wang, Z.; Huang, W. Bile acid nuclear receptor FXR and digestive system diseases. Acta Pharm. Sin. B 2015, 5, 135–144. [Google Scholar] [CrossRef] [Green Version]
- Baars, A.; Oosting, A.; Knol, J.; Garssen, J.; van Bergenhenegouwen, J. The Gut Microbiota as a Therapeutic Target in IBD and Metabolic Disease: A Role for the Bile Acid Receptors FXR and TGR5. Microorganisms 2015, 3, 641–666. [Google Scholar] [CrossRef] [Green Version]
- Stepanov, V.; Stankov, K.; Mikov, M. The bile acid membrane receptor TGR5: A novel pharmacological target in metabolic, inflammatory and neoplastic disorders. J. Recept. Signal Transduct Res. 2013, 33, 213–223. [Google Scholar] [CrossRef]
- Xiong, F.; Cao, L.; Wu, X.M.; Chang, M.X. The function of zebrafish gpbar1 in antiviral response and lipid metabolism. Dev. Comp. Immunol. 2021, 116, 103955. [Google Scholar] [CrossRef]
- Mühlhäusser, P.; Müller, E.C.; Otto, A.; Kutay, U. Multiple pathways contribute to nuclear import of core histones. EMBO Rep. 2001, 2, 690–696. [Google Scholar] [CrossRef] [Green Version]
- Keck, K.M.; Pemberton, L.F. Histone chaperones link histone nuclear import and chromatin assembly. Biochim. Biophys. Acta 2013, 1819, 277–289. [Google Scholar] [CrossRef] [Green Version]
- Bernardes, N.E.; Chook, Y.M. Nuclear import of histones. Biochem. Soc. Trans. 2020, 48, 2753–2767. [Google Scholar] [CrossRef] [PubMed]
- Okamura, H.; Yoshida, K.; Amorim, B.R.; Haneji, T. Histone H1.2 is translocated to mitochondria and associates with Bak in bleomycin-induced apoptotic cells. J. Cell Biochem. 2008, 103, 1488–1496. [Google Scholar] [CrossRef] [PubMed]
- Klein, B.; Lütz-Meindl, U.; Kerschbaum, H.H. From the nucleus to the plasma membrane: Translocation of the nuclear proteins histone H3 and lamin B1 in apoptotic microglia. Apoptosis 2014, 19, 759–775. [Google Scholar] [CrossRef] [Green Version]
- Wu, X.M.; Fang, H.; Nie, P.; Chang, M.X. Nucleotide polymorphism and function of piscine histone H2A in Edwardsiella piscicida infection. J. Fish. China 2020, 44, 1–14. [Google Scholar]
- Huang, J.; Xie, Y.; Sun, X.; Zeh, H.J., III; Kang, R.; Lotze, M.T.; Tang, D. DAMPs, ageing, and cancer: The ‘DAMP Hypothesis’. Ageing Res Rev. 2015, 24, 3–16. [Google Scholar] [CrossRef] [Green Version]
- Allam, R.; Scherbaum, C.R.; Darisipudi, M.N.; Mulay, S.R.; Hägele, H.; Lichtnekert, J.; Hagemann, J.H.; Rupanagudi, K.V.; Ryu, M.; Schwarzenberger, C.; et al. Histones from dying renal cells aggravate kidney injury via TLR2 and TLR4. J. Am. Soc. Nephrol. 2012, 23, 1375–1388. [Google Scholar] [CrossRef] [PubMed] [Green Version]
- Meissner, T.B.; Li, A.; Biswas, A.; Lee, K.H.; Liu, Y.J.; Bayir, E.; Iliopoulos, D.; van den Elsen, P.J.; Kobayashi, K.S. NLR family member NLRC5 is a transcriptional regulator of MHC class I genes. Proc. Natl. Acad. Sci. USA 2010, 107, 13794–13799. [Google Scholar] [CrossRef] [Green Version]
- Devaiah, B.N.; Singer, D.S. CIITA and Its Dual Roles in MHC Gene Transcription. Front. Immunol. 2013, 4, 476. [Google Scholar] [CrossRef] [PubMed]
- Langfelder, P.; Horvath, S. WGCNA: An R package for weighted correlation network analysis. BMC Bioinform. 2008, 9, 559. [Google Scholar] [CrossRef] [Green Version]
- Shannon, P.; Markiel, A.; Ozier, O.; Baliga, N.S.; Wang, J.T.; Ramage, D.; Amin, N.; Schwikowski, B.; Ideker, T. Cytoscape: A software environment for integrated models of biomolecular interaction networks. Genome Res. 2003, 13, 2498–2504. [Google Scholar] [CrossRef] [PubMed]
- Cao, L.; Wu, X.M.; Hu, Y.W.; Xue, N.N.; Nie, P.; Chang, M.X. The discrepancy function of NLRC5 isoforms in antiviral and antibacterial immune responses. Dev. Comp. Immunol. 2018, 84, 153–163. [Google Scholar] [CrossRef]
Publisher’s Note: MDPI stays neutral with regard to jurisdictional claims in published maps and institutional affiliations. |
© 2021 by the authors. Licensee MDPI, Basel, Switzerland. This article is an open access article distributed under the terms and conditions of the Creative Commons Attribution (CC BY) license (https://creativecommons.org/licenses/by/4.0/).