Abstract
Traceability analysis, such as identification and discrimination of yeasts used for fermentation, is important for ensuring manufacturing efficiency and product safety during brewing. However, conventional methods based on morphological and physiological properties have disadvantages such as time consumption and low sensitivity. In this study, the resistive pulse method (RPM) was employed to discriminate between Saccharomyces pastorianus and Dekkera anomala and S. pastorianus and D. bruxellensis by measuring the ionic current response of cells flowing through a microsized pore. The height and shape of the pulse signal were used for the simultaneous measurement of the size, shape, and surface charge of individual cells. Accurate discrimination of S. pastorianus from Dekkera spp. was observed with a recall rate of 96.3 ± 0.8%. Furthermore, budding S. pastorianus was quantitatively detected by evaluating the shape of the waveform of the current ionic blockade. We showed a proof-of-concept demonstration of RPM for the detection of contamination of Dekkera spp. in S. pastorianus and for monitoring the fermentation of S. pastorianus through the quantitative detection of budding cells.
1. Introduction
The resistive pulse method (RPM) is used for evaluating the transient ionic current blockade associated with the translocation of individual nano- to microsized particles passing through an appropriate diameter pore. Moreover, it is applicable in proving small objects by using pulse-like electrical signals. In addition, because the measured ionic current blockade signals possess information regarding the properties of these particles such as size [1], shape [2,3,4], surface charge [1,5], and deformability [6,7], these objects can be discriminated at a single-particle resolution. Further, single bioparticles of various sizes ranging from blood cells to polynucleotides can be discriminated against without implementing immunostaining [2,8,9]. RPM with microsized pores (micropore devices), which is similar to the operating principles of a Coulter counter, is widely used to measure the number of blood cells in hematological diagnosis.
In brewing, traceability analysis such as identification and/or discrimination of microorganisms used for fermentation is important to ensure manufacturing efficiency and product safety [10,11]. The genus Saccharomyces is well-known as the key yeast species in beer fermentation, and S. pastorianus is used in bottom-fermented beer [12]. Although the presence of Brettanomyces yeasts (teleomorph Dekkera) including Dekkera anomala and D. bruxellensis is encouraged in several types of beer, these yeasts cause contaminations of most beer leading to spoilage [12,13].
Conventional methods used for the detection and/or isolation of yeast contamination are based mainly on morphological and physiological properties [14]. Several types of selective media are commonly used to identify and discriminate unknown yeasts. However, these cultivation methods require several days to obtain results. Although gene analysis methods based on PCR are also employed to identify and/or discriminate brewing yeasts [14,15], some disadvantages remain. For example, several hours are required to acquire results and complex operations. Therefore, detection methods for unwanted yeast contamination in brewing with rapid and easy operation, such as in-line inspection, are necessary.
In this study, we developed a micropore device for the accurate and rapid discrimination of S. pastorianus from Dekkera spp. The budding state of S. pastorianus can also be detected at the single-cell level by analyzing the shape of the current blockade signals.
2. Materials and Methods
2.1. Yeast Strains and Preparation
S. pastorianus W34/70, D. anomala DSMZ 70727, and D. bruxellensis NBRC 0677 were used in this study. These yeasts were cultivated in YPAD agar plates [16] (Thermo Fisher Scientific, Inc., Waltham, MA, USA) for at least 2 days. To prepare the cell sample solution for ionic current measurements, appropriate amounts of each yeast were collected from a single colony and suspended in 50 mM 2-(N-morpholino) ethanesulfonic acid (MES) buffer to a concentration of 1 × 10⁶ cells/mL.
2.2. Cell Size Measurement Using Light Microscope
One hundred cells in each cell suspension in 50 mM MES buffer were selected using a light microscope (DIML II, Leica Camera AG, Wetzlar, Germany) with a 40× objective lens to determine each yeast size. Approximately 20 μL of each cell sample was seeded into a 96-well plate (Nunc MicroWell 96-Well Microplates, Thermo Fisher, Inc.) to settle at the bottom of the plate surface, and the diameter of each cell was measured immediately [Figure 1a–c]. Cell sizes were expressed as mean ± standard deviation (SD).
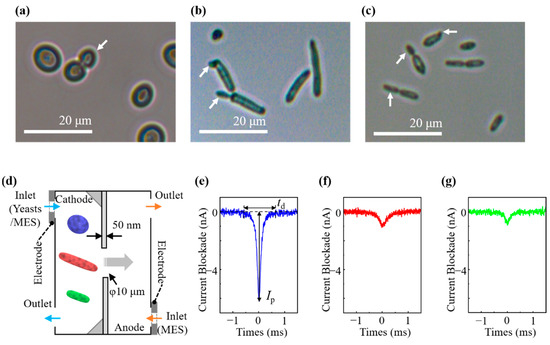
Figure 1.
Light microscopic images of (a) S. pastorianus, (b) D. anomala, and (c) D. bruxellensis. Budding is observed in each. Arrows indicate daughter cells. (d) Picture of micropore device with a diameter of 10 μm. A typical waveform of current ionic blockade by RPM was observed for (e) S. pastorianus, (f) D. anomala, and (g) D. bruxellensis.
2.3. Micropore Device and Ionic Current Measurement
For the ionic current measurement of cells, we employed a micropore device with a diameter of 10 μm and thickness of 50 nm, as shown in Figure 1d (M-NK-1000-A106-001-Pm, Aipore, Inc., Tokyo, Japan). Then, 10 μL of cell sample solution was injected into the cathode-side microchamber through the inlet, and 10 μL of 50 mM MES buffer was injected into the anode-side microchamber through the inlet. For cell mixture measurement, two of three types of yeast, 5 μL each and 10 μL in total, were injected into the cathode-side microchamber.
A current amplifier (ACDC3000, AXIS NET, Inc., Osaka, Japan) was employed for ionic current measurement in the current range of 2.5 μA using the LabVIEW (LabVIEW 2017, National Instruments, Austin, TX, USA) program. The time trace of the ionic current was evaluated via the pore and was recorded at a sampling rate of 1 MHz using a voltage input module (NI-9223, National Instruments), which corresponds to a 1-μs resolution time. Typical waveforms of the ionic current blockade for S. pastorianus, D. anomala, and D. bruxellensis are shown in Figure 1e–g. The duration of the blockade signal was >0.2 ms, and the employed sampling rate was sufficient to analyze the signal of the current blockade. For each experiment, 400 current blockade signals could be obtained in 6 min.
2.4. Resistive Pulse Analysis and Cell Discrimination
We measured resistive pulse signals that appeared on the time trace of the ionic current by monitoring the current displacement, which was larger than the threshold by three times the SD. Further, we averaged the data for the nearest neighboring points to reduce the current noise in the pulse measurement process, as reported by Smeets et al. [17]. In addition, we extracted the waveforms of the pulses of the original 1-MHz data at the time point of pulse detection and evaluated the peak values of the current blockade (Ip) and the duration of the current blockades (td) on the extracted waveform [Figure 1e–g]. Four hundred pulse signals were analyzed. These data were processed using LabVIEW.
2.5. Discrimination of Decision Boundary and Discrimination Error
Compared with the linear separation boundary [18], a quadratic discrimination analysis (QDA) with a nonlinear separation boundary can discriminate more accurately between different classes. QDA is a probabilistic parametric classification technique that separates the class region by quadratic boundaries assuming that each class has a multivariate normal distribution with the dispersion being different per class. The decision boundary (DB) by QDA for cell discrimination is defined by a contour line/curve providing an equal probability of the Ip, td, and Ip-td distributions for each cell [19,20]. The probability is expressed as follows:
where Σk and are the variance-covariance matrix and the mean value of observations for the kth dimension (k = or ), respectively.
2.6. Zeta Potential Measurement
The zeta potential was measured using a zeta potential analyzer (ELSZ-2000Z Otsuka Electronics Co., Ltd., Osaka, Japan). A glass flow cell for measurements was filled with 1.0 mL of cell sample at a concentration of 1 × 10⁸ cells/mL in 50 mM MES buffer. While applying an electric field of ~16 V/cm on average, the electrical mobility was evaluated from the Doppler shift of the scattering light of the laser, and the zeta potential ζ was obtained by fitting the electrophoretic velocity of cells flow inside the measurement glass cell based on the Smoluchowski equation [21]. The measured zeta potential is represented by the mean ± SD (n = 6).
2.7. Multiphysics Simulations of Ionic Current Waveform for a Budding Yeast
To elucidate the characteristic ionic current waveforms originating from the morphological features of budding yeasts passing through a pore, numerical simulations based on finite element methods were conducted [2,4]. The geometric structures were modeled in a cylindrical coordinate system (r, θ, and z as the radial, azimuthal, and axial coordinates, respectively), as shown in Figure 4a. The total model size was 50 μm in radius (R = 50 μm) and 100 μm in z-height. A membrane with a thickness of 50 nm formed a 5-μm radius pore [white arrow in Figure 4a] and was placed in the middle of the model (z = 0 μm).
A yeast model [black arrow in Figure 4a] of a given size (parameterized by Lx) was positioned along the z-axis. The multiphysics simulation was conducted by simultaneously solving Equation (1) the continuity equation at a steady-state (, where j is the current density) for the applied electric potential of Vc, Equation (2) the Poisson–Boltzmann equation for the electrostatic potential of Vs, Equation (3) the Nernst–Planck equation for the i ion concentration of ci, and Equation (4) the incompressible Navier–Stokes equation for the hydrodynamic pressure and the flow field of p and U:
Here, σw, F, zi, and ui are the electrical conductivity of water, the Faraday constant, charge number, and electrical mobility of ion i, respectively. We used zi = 1 and ui = 3.69 × 10⁻⁷ m2/V∙s for i = H+, and zi = −1 and ui = 2.87 × 10⁻⁸ m2/V∙s for i = MES−. These ui values were evaluated from the diffusion coefficient of Di [22,23] based on the Einstein relation ui = eDi/kBT, where e, kB, and T are the elementary charge, Boltzmann constant, and temperature, respectively. ρ, εw, and η are the net ionic charge density, permittivity, and dynamic viscosity of water, respectively.
The boundary conditions for Equation (1) [Vc at z = 50 μm and −50 μm] were 0.1 V and 0 V, respectively. For Equation (2), a surface charge of −0.015 C/m2, estimated from the zeta potential by using the Grahame equation [24,25], was imposed on the surfaces of the pore and the yeast model. For Equation (3), the boundaries at z = ±50 μm and r = 50 μm were assumed to be ci = 2.6 mM. This ci value was estimated based on the assumption that the total ionic current was 100 nA, which corresponded to the experimentally measured baseline current. The other boundary conditions were similar to those in a previous study [2].
The resulting electric potential (Vc + Vs) distribution is shown in Figure 4a. The total ionic current I was calculated by the surface integral for j in the z-direction (jz) at z = 50 μm over the r–θ surface, expressed as
All numerical simulations were performed with COMSOL Multiphysics 5.0 (COMSOL, Inc., Stockholm, Sweden) using the physical parameters of σw = (18.2 MΩ·cm)−1, F = 9.649 × 10⁴ C/mol, e = 1.602 × 10⁻¹⁹ C, kB = 1.381 × 10⁻²³ J/K, T = 293.15 K, εw = 7.097 × 10⁻¹⁰ F/m, and η = 1.002 × 10⁻³ Ns/m2 [23].
3. Results and Discussion
3.1. Morphological Examination by Light Microscopy
Light microscopic images of cells are shown in Figure 1a–c. S. pastorianus cells were round to ovoid shapes with a size of 5.6 ± 0.9 × 6.9 ± 1.2 μm [Figure 1a]. Both D. anomala and D. bruxellensis were spindle-shaped at 2.9 ± 0.8 × 13.6 ± 5.7 μm and 2.5 ± 0.5 × 7.9 ± 3.2 μm, respectively [Figure 1b,c]. The size and shape of S. pastorianus were clearly different from those of D. anomala and D. bruxellensis. Budding was observed in some cells [Figure 1a–c].
3.2. Ionic Current Measurement of Cells and Cell Discrimination
We applied a bias voltage of Vb = 0.1 V between the cathode-side and the anode-side microchambers, and the baseline had a current level of approximately 100 nA. The electrical conductivity (σ) was determined to be 0.104 ± 0.06 S/m. The electric field generated by the bias voltage yields electric forces that drive the cells and translate them through the pores. As illustrated in Figure 1d, the cells were restricted by a pore, causing them to pass turn by turn through the pore, thus yielding a one-to-one correspondence of a pulselike signal between the ionic current blockade and a translocation event of a cell through the pore.
Figure 1e–g depict typical waveforms of the current blockades generated by S. pastorianus, D. anomala, and D. bruxellensis, respectively. The size and deformability of the sensed particles were estimated from the Ip values generated by the RPM [1,6,7]. The Ip values of S. pastorianus, D. anomala, and D. bruxellensis were 6.16 ± 3.96 nA, 0.99 ± 0.58 nA, and 0.75 ± 0.46 nA, respectively, which are significantly different. td can be utilized to elucidate the surface charge of the sensed particles [1,5]. The zeta potential was examined to estimate the surface charge of the cells. The evaluated zeta potentials for S. pastorianus, D. anomala, and D. bruxellensis were −28.99 ± 0.50 mV, −16.50 ± 0.64 mV, and −14.42 ± 0.90 mV, respectively. Contrary to the prediction from the results of zeta potential measurement, the td values were 1.31 ± 0.89 ms, 1.07 ± 1.12 ms, and 0.93 ± 0.90 ms with statistical differences between S. pastorianus, D. anomala, and D. bruxellensis, respectively. Since the Ip values for Dekkera spp. are extremely smaller than that of S. pastorianus, it is considered that Dekkera spp. pass through the pore with a longitudinal direction. The minor axis of Dekkera spp. is less than half that of S. pastorianus, and the spindle-shaped Dekkera spp. are thought to be more mobile than the round shape of S. pastorianus in solution, so it may be faster to pass the pore [26]. Therefore, it may be that the td values indicating the residence time in the pore becomes shorter in long Dekkera spp. compared with short S. pastorianus.
The reproducibility of Ip and td measurements by the RPM for these yeasts was confirmed by three different experiments [27] [Figure 2a]. The histogram of Ip on log, td on log, and scatter plot of Ip–td on log-log, and the BDs for each cell are shown in Figure 2b. If cells are present in regions I, II, and III on each graph, then they are estimated as D. bruxellensis, D. anomala, and S. pastorianus, respectively. The electrical current records and Ip-td scatter plot by RPM of a mixture of two types of yeast from S. pastorianus, D. anomala, and D. bruxellensis are shown in Figure 3. Large variations in current blockade were observed in each mixture of S. pastorianus and D. anomala [Figure 3a], and S. pastorianus and D. bruxellensis [Figure 3b]. Relatively uniform small current blockades could be observed in the mixture of D. anomala and D. bruxellensis [Figure 3c]. The cell distribution on the Ip-td scatter plot by RPM analysis of cell mixture and single measurement [Figure 2b] is very similar and has high applicability of RPM for accurate discrimination of S. pastorianus from Dekkera spp. can be expected.
Figure 2.
Reproducibility of Ip and td measurement by RPM for (a) S. pastorianus, D. anomala, and bruxellensis. (b) Histogram of Ip on log, td on log, Ip-td on log-log, and DBs for S. pastorianus, D. anomala, and D. bruxellensis.
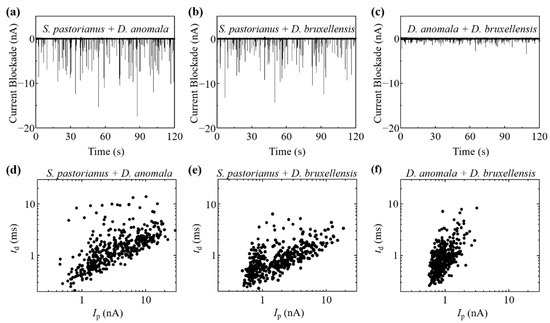
Figure 3.
Electrical current record by RPM of each mixture of (a) S. pastorianus and D. anomala, (b) S. pastorianus and D. bruxellensis, and (c) D. anomala and D. bruxellensis. Ip-td scatter plot on log-log graph by RPM of each mixture of (d) S. pastorianus and D. anomala, (e) S. pastorianus and D. bruxellensis, and (f) D. anomala and D. bruxellensis.
Recall rates of S. pastorianus, D. anomala, and D. bruxellensis were estimated on log10Ip to be 92.4 ± 1.9%, 54.5 ± 5.3%, and 62.6 ± 3.1%, respectively [Figure 2b and Table 1]. S. pastorianus was detected with high sensitivity. On the other hand, recall rates of S. pastorianus, D. anomala, and D. bruxellensis were estimated to be 56.8 ± 8.9%, 19.5 ± 13.2%, and 66.8 ± 5.4% on log10td, respectively. Highly sensitive detection of S. pastorianus was not observed. By performing discriminant analysis on the log10Ip–log10td plane, a significant improvement in the recall rate for S. pastorianus was 96.3 ± 0.8% compared to log10Ip and log10td (McNemar test, p < 0.05). The limit of detection was 2.4%, which gave a signal at 3SDs above the backgrounds. The accuracy of S. pastorianus identification by PCR is reported to be 94.6% [12]. RPM can be expected to be as accurate as PCR. These results indicate the potential of Ip–td analysis by RPM for the quantitative detection of S. pastorianus in solution and the accurate detection of Dekkera spp. contamination.

Table 1.
Discrimination of investigated yeasts based on log10Ip acquired by RPM.
3.3. Analysis of Budding S. pastorianus
In the RPM analysis for S. pastorianus, 87.6% of the waveforms [Figure 4b, blue] were symmetrical, and 11.8% had shoulders before the peak time [Figure 4b, cyan] of the waveform and 0.6% after [Figure 4b, purple]. As shown in Figure 1a, budding was observed in some cells. Budding was observed in 11.9% of S. pastorianus on microscopic images (data not shown), which is close to the appearance rate of the shoulder-shaped waveform in the RPM.
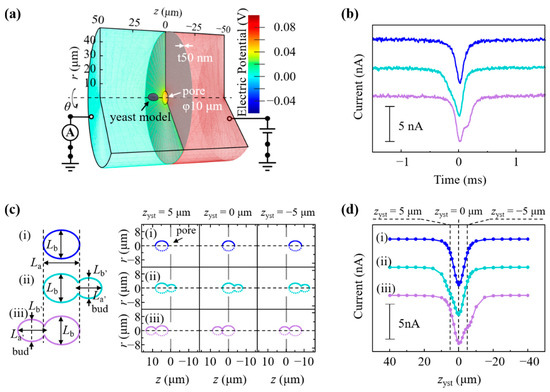
Figure 4.
(a) Geometric structure modeled in a cylindrical coordinate system. r, θ, and z indicate coordinate, azimuthal angle, and axial coordinate, respectively. The color scale at the right represents the electric potential. (b) Measured symmetric waveform (blue), waveform with the shoulder before peak time (cyan), and waveform with a shoulder after peak time (purple). (c) Simulated model of passing through the pore of the nonbudding cell (i) and budding cell with daughter in front of (ii) or behind (iii) mother cell. (d) Simulated waveforms of the nonbudding cell (i), budding cell with daughter in front of (ii) or behind (iii) mother cell.
We simulated whether the shoulder shape of the waveform shows budding by using multiphysics simulations. The size parameter Lx for the yeast model is a variable that defines the distribution of Vc, Vs, ci, p, and U, including j and ρ in Equations (1)–(4), and affect I in Equation (5) [28,29]. In Figure 4c, the blue ellipsoid with La = 6.9 μm on the major axis and Lb = 5.6 μm on the minor axis represents a nonbudding S. pastorianus (i). The budded S. pastorianus (cyan and purple) was modeled by merging a bud (daughter cell) to the forward and backward of the mother cell (ii and iii). The sizes of the mother cell (La and Lb) and those of daughter cells (La’ = 5.0 μm and Lb’ = 4.1 μm for cyan, and La’ = 5.6 μm and Lb’ = 4.5 μm for purple) were assumed from the microscopic images. Figure 4d shows the change in I during the yeast z-position displacement of zyst = 40 to −40 μm. The peak of the current blockade appeared at zyst = 0 μm [Figure 4d, i–iii]. The gap of the pore by passing through cells was minimized in the cell model size of La and Lb at zyst = 0 μm [Figure 4c, i–iii]. In contrast to the symmetric shape of (d, i), the shoulder appeared at zyst > 0 for (d, ii) and zyst < 0 for (d, iii). These corresponded to the passage of the budded S. pastorianus model through the pore in the order of daughter–parent (c, ii) or parent-daughter (c, iii), and the appearance of the shoulder was related to the daughter cell size. The simulated waveforms [Figure 4d] were in good agreement with the experimentally measured waveforms [Figure 4b]. Budding S. pastorianus can be quantitatively detected by measuring the shouldered waveform of the current ionic blockade. The contributions of the size and orientation of yeasts to the waveform can explain the RPM for the investigated Dekkera spp., in which clear shoulders were not seen. Dekkera spp. has an elongated spindle shape, and the major axis of D. anomala is larger than the pore diameter [Figure 1b,c]. This restricts the orientation of those during passage through the pore in the longitudinal direction, and the cell passes through the pores with its major axis parallel to the z-axis. Since the minor axis of Dekkera spp. is apparently smaller than that of S. pastorianus [Figure 1a–c], their obtained Ip values obtained are smaller than those of S. pastorianus [Figure 1e–g]. The current resolution to discriminate the budding cells in Dekkera spp. may be insufficient by the RPM analysis employed in this study. A smaller-sized pore is necessary to improve the resolution for analyzing the budding of Dekkera spp. These results indicate the potential application of RPM for the monitoring of growth viability and fermentation of yeasts by the quantitative detection of budding cells [30,31,32].
4. Conclusions
In this study, we demonstrated the potential of RPM analysis using a micropore device with a 10-μm diameter pore for accurate discrimination of S. pastorianus from Dekkera spp. by measuring multiple parameters such as cell size, and the quantitative detection of budding S. pastorianus by evaluating the shape of the waveform of the current ionic blockade. We demonstrated the proof-of-concept of RPM for the detection of Dekkera spp. contamination in S. pastorianus and for monitoring the fermentation of S. pastorianus through the quantitative detection of budding cells.
Author Contributions
K.Y., A.T., H.A., Y.K., M.H., K.K., Y.N. and M.K. designed and conducted the experiments. M.T. (Masato Tanaka), S.M. and M.T. (Masateru Taniguchi) constructed the measurement system and designed the micropore device. K.Y. and M.K. wrote the manuscript. All authors have read and agreed to the published version of the manuscript.
Funding
This work was supported by JSPS KAKENHI grant number 19H04495.
Institutional Review Board Statement
Not applicable.
Informed Consent Statement
Not applicable.
Data Availability Statement
Not applicable.
Conflicts of Interest
The authors declare no conflict of interest.
References
- Song, Y.; Zhang, J.; Li, D. Microfluidic and Nanofluidic Resistive Pulse Sensing: A Review. Micromachines 2017, 8, 204. [Google Scholar] [CrossRef]
- Tsutsui, M.; Yoshida, T.; Yokota, K.; Yasaki, H.; Yasui, T.; Arima, A.; Tonomura, W.; Nagashima, K.; Yanagida, T.; Kaji, N.; et al. Discriminating single-bacterial shape using low-aspect-ratio pores. Sci. Rep. 2017, 7, 1–9. [Google Scholar] [CrossRef] [Green Version]
- Yusko, E.C.; Bruhn, B.R.; Eggenberger, O.; Houghtaling, J.; Rollings, R.C.; Walsh, N.C.; Nandivada, S.; Pindrus, M.; Hall, A.R.; Sept, D.; et al. Real-time shape approximation and fingerprinting of single proteins using a nanopore. Nat. Nanotechnol. 2017, 12, 360–367. [Google Scholar] [CrossRef] [Green Version]
- Ryuzaki, S.; Tsutsui, M.; He, Y.; Yokota, K.; Arima, A.; Morikawa, T.; Taniguchi, M.; Kawai, T. Rapid structural analysis of nanomaterials in aqueous solutions. Nanotechnology 2017, 28, 155501. [Google Scholar] [CrossRef]
- Arjmandi, N.; Van Roy, W.; Lagae, L.; Borghs, G. Measuring the Electric Charge and Zeta Potential of Nanometer-Sized Objects Using Pyramidal-Shaped Nanopores. Anal. Chem. 2012, 84, 8490–8496. [Google Scholar] [CrossRef] [PubMed] [Green Version]
- Zheng, Y.; Nguyen, J.; Wang, C.; Sun, Y. Electrical measurement of red blood cell deformability on a microfluidic device. Lab. Chip. 2013, 13, 3275–3283. [Google Scholar] [CrossRef] [PubMed]
- Darvish, A.; Goyal, G.; Aneja, R.; Sundaram, R.V.K.; Lee, K.; Ahn, C.W.; Kim, K.-B.; Vlahovska, P.M.; Kim, M.J. Nanoparticle mechanics: Deformation detection via nanopore resistive pulse sensing. Nanoscale 2016, 8, 14420–14431. [Google Scholar] [CrossRef] [PubMed] [Green Version]
- Wanunu, M. Nanopores: A journey towards DNA sequencing. Phys. Life Rev. 2012, 9, 125–158. [Google Scholar] [CrossRef] [PubMed] [Green Version]
- Yokota, K.; Hashimoto, M.; Kajimoto, K.; Tanaka, M.; Murayama, S.; Tsutsui, M.; Nakajima, Y.; Taniguchi, M.; Kataoka, M. Effect of Electrolyte Concentration on Cell Sensing by Measuring Ionic Current Waveform through Micropores. Biosensors 2021, 11, 78. [Google Scholar] [CrossRef]
- Fusco, V.; Quero, G.M.; Stea, G.; Morea, M.; Visconti, A. Novel PCR-based identification of Weissella confusa using an AFLP-derived marker. Int. J. Food Microbiol. 2011, 145, 437–443. [Google Scholar] [CrossRef]
- Rungrassamee, W.; Tosukhowong, A.; Klanchui, A.; Maibunkaew, S.; Plengvidhya, V.; Karoonuthaisiri, N. Development of bacteria identification array to detect lactobacilli in Thai fermented sausage. J. Microbiol. Methods 2012, 91, 341–353. [Google Scholar] [CrossRef]
- Shinohara, Y.; Kurniawan, Y.N.; Sakai, H.; Magarifuchi, T.; Suzuki, K. Nanopore based sequencing enables easy and accurate identification of yeasts in breweries. J. Inst. Brew. 2021, 127, 160–166. [Google Scholar] [CrossRef]
- Bokulich, N.A.; Bamforth, C.W. The Microbiology of Malting and Brewing. Microbiol. Mol. Biol. Rev. 2013, 77, 157–172. [Google Scholar] [CrossRef] [PubMed] [Green Version]
- Pham, T.; Wimalasena, T.T.; Box, W.G.; Koivuranta, K.; Storgards, E.; Smart, K.A.; Gibson, B.R. Evaluation of ITS PCR and RFLP for Differentiation and Identification of Brewing Yeast and Brewery ‘Wild’ Yeast Contaminants. J. Inst. Brew. 2011, 117, 556–568. [Google Scholar] [CrossRef] [PubMed]
- Kopecká, J.; Němec, M.; Matoulkova, D. Comparison of DNA-based techniques for differentiation of production strains of ale and lager brewing yeast. J. Appl. Microbiol. 2016, 120, 1561–1573. [Google Scholar] [CrossRef]
- Sherman, F. Getting Started with Yeast. Methods Enzymol. 1991, 194, 3–21. [Google Scholar] [PubMed]
- Smeets, R.M.M.; Keyser, U.; Dekker, N.; Dekker, C. Noise in solid-state nanopores. Proc. Natl. Acad. Sci. USA 2008, 105, 417–421. [Google Scholar] [CrossRef] [Green Version]
- Pischel, D.; Buchbinder, J.H.; Sundmacher, K.; Lavrik, I.N.; Flassig, R.J. A guide to automated apoptosis detection: How to make sense of imaging flow cytometry data. PLoS ONE 2018, 13, e0197208. [Google Scholar] [CrossRef] [PubMed] [Green Version]
- Fraley, C.; Raftery, A.E. Model-Based Clustering, Discriminant Analysis, and Density Estimation. J. Am. Stat. Assoc. 2002, 97, 611–631. [Google Scholar] [CrossRef]
- Wernecke, K.-D. Discriminant Analysis. In Wiley Encyclopedia of Clinical Trials; D’Agostino, R.B., Sullivan, L., Massaro, J., Eds.; John Wiley & Sons Inc.: Hoboken, NJ, USA, 2007; pp. 1–19. [Google Scholar]
- Schoch, R.B.; Han, J.; Renaud, P. Transport phenomena in nanofluidics. Rev. Mod. Phys. 2008, 80, 839–883. [Google Scholar] [CrossRef] [Green Version]
- Ng, B.; Barry, P.H. The measurement of ionic conductivities and mobilities of certain less common organic ions needed for junction potential corrections in electrophysiology. J. Neurosci. Methods 1995, 56, 37–41. [Google Scholar] [CrossRef]
- Lide, D.R. CRC Handbook of Chemistry and Physics, 84th ed.; CRC Press Press: Boca Raton, FL, USA, 2003–2004. [Google Scholar]
- Grahame, D.C. The Electrical Double Layer and the Theory of Electrocapillarity. Chem. Rev. 1947, 41, 441–501. [Google Scholar] [CrossRef] [PubMed]
- Hayashida, T.; Yokota, K.; Murayama, S.; Arima, A.; Tsutsui, M.; Taniguchi, M. Tailoring Dielectric Surface Charge via Atomic Layer Thickness. ACS Appl. Mater. Interfaces 2019, 12, 5025–5030. [Google Scholar] [CrossRef] [PubMed]
- Ohshima, H. Approximate analytic expressions for the electrophoretic mobility of spheroidal particles. Electrophoresis 2021, 42, 1003–1009. [Google Scholar] [CrossRef]
- Beckert, S.F.; Domeneghetti, G.; Bond, D. Using historical results obtained in the tensile tests for Type A evaluation of uncertainty. Measurement 2014, 51, 420–428. [Google Scholar] [CrossRef]
- He, Y.; Tsutsui, M.; Fan, C.; Taniguchi, M.; Kawai, T. Controlling DNA Translocation through Gate Modulation of Nanopore Wall Surface Charges. ACS Nano 2011, 5, 5509–5518. [Google Scholar] [CrossRef] [PubMed]
- Wang, J.; Ma, J.; Ni, Z.; Zhang, L.; Hu, G. Effects of access resistance on the resistive-pulse caused by translocating of a nanoparticle through a nanopore. RSC Adv. 2014, 4, 7601–7610. [Google Scholar] [CrossRef] [Green Version]
- Brauer, M.J.; Huttenhower, C.; Airoldi, E.M.; Rosenstein, R.; Matese, J.C.; Gresham, D.; Boer, V.M.; Troyanskaya, O.G.; Botstein, D. Coordination of Growth Rate, Cell Cycle, Stress Response, and Metabolic Activity in Yeast. Mol. Biol. Cell 2008, 19, 352–367. [Google Scholar] [CrossRef] [Green Version]
- Porro, D.; Vai, M.; Vanoni, M.; Alberghina, L.; Hatzis, C. Analysis and modeling of growing budding yeast populations at the single cell level. Cytom. Part A 2009, 75, 114–120. [Google Scholar] [CrossRef]
- Ohnuki, S.; Enomoto, K.; Yoshimoto, H.; Ohya, Y. Dynamic changes in brewing yeast cells in culture revealed by statistical analyses of yeast morphological data. J. Biosci. Bioeng. 2014, 117, 278–284. [Google Scholar] [CrossRef]
Publisher’s Note: MDPI stays neutral with regard to jurisdictional claims in published maps and institutional affiliations. |
© 2021 by the authors. Licensee MDPI, Basel, Switzerland. This article is an open access article distributed under the terms and conditions of the Creative Commons Attribution (CC BY) license (https://creativecommons.org/licenses/by/4.0/).